Schools in the time of COVID-19: Possible implications for enrolment, repetition and dropout - Research on Socio ...
←
→
Page content transcription
If your browser does not render page correctly, please read the page content below
Schools in the time of COVID-19: Possible
 implications for enrolment, repetition and dropout
                         SERVAAS VAN DER BERG
                            CHRIS VAN WYK
                           REBECCA SELKIRK

     Stellenbosch Economic Working Papers: WP20/2020
                 www.ekon.sun.ac.za/wpapers/2020/wp202020

                                November 2020

KEYWORDS: Covid-19, pandemic, schools, repetition, enrolment, dropout,
                            South Africa
                      JEL: I220, O150, H410

                       ReSEP (Research on Socio-Economic Policy)
                                https://resep.sun.ac.za

                             DEPARTMENT OF ECONOMICS
                            UNIVERSITY OF STELLENBOSCH
                                    SOUTH AFRICA

             A WORKING PAPER OF THE DEPARTMENT OF ECONOMICS AND THE
          BUREAU FOR ECONOMIC RESEARCH AT THE UNIVERSITY OF STELLENBOSCH

                             www.ekon.sun.ac.za/wpapers
SCHOOLS IN THE TIME OF COVID-19:
POSSIBLE IMPLICATIONS FOR ENROLMENT, REPETITION
AND DROPOUT
Servaas van der Berg, Chris van Wyk & Rebecca Selkirk
ABSTRACT
One needs good quality data on current enrolment, dropout and repetition in order to evaluate the
possible implications of different repetition and dropout decisions by school authorities, learners and
parents for enrolment numbers and for the composition of classes in 2021. We obtained learner level
data from LURITS, a relative recent way of organising and managing enrolment data that has
superseded the Annual National Census of Schools. Though far from perfect, this data give good
information about the extremely high levels of repetition. High repetition leads to many learners being
over-aged and to dropout being quite common in secondary school. Assessing various alternative
scenarios about learners returning to school, repetition and dropout, we conclude that the most likely
outcome for 2021 is that considerably more learners would be promoted to grades 11 and 12 in
particular, with implications for allocations of classrooms, books and teachers, with a decline of
repetition in Grade 10. Learners in all grades would have a learning deficit compared to previous years,
but in addition, the heterogeneity of academic backgrounds would be even greater than usual in 2021
in the final two grades, confronting teachers with an even more difficult task than usual.
Acknowledgment: This paper was produced as a study for the DG Murray Trust and funded by this
trust. A companion report by Ursula Hoadley is also available on Resep’s website: Hoadley, Ursula.
(2020). Schools in the Time of COVID-19: Impacts of the Pandemic on Curriculum. November. Resep
Non-Economic Working Paper. Stellenbosch. https://resep.sun.ac.za/schools-in-the-time-of-covid-19-
impacts-of-the-pandemic-on-curriculum/
KEYWORDS: Covid-19, pandemic, schools, repetition, enrolment, dropout, South Africa
JEL: I220, O150, H410
Resep (Research on Socio-Economic Policy), http://resep.sun.ac.za
11. BACKGROUND AND INTRODUCTION
1.1 Background
This research project stems from a discussion between individuals from Resep and the DG Murray
Trust about rethinking some issues relating to South African education in the context of the Covid-19
pandemic, the lockdown and the economic recession. This gave rise to inter alia a research project on
Schools in the time of Covid-19, with two parts to it, one investigating the implications of the Covid-19
pandemic for flows through the school system, on which this paper is based, and the second part
investigating the effect of the pandemic for shortened curricula and curriculum planning more
generally. This second part of the research was coordinated by Ursula Hoadley, and is available as a
separate Working Paper (Hoadley 2020).
The pandemic has devastating economic consequences. These include the direct effects of the virus,
the effect of people’s attempts to avoid being infected and the effect of the lockdown introduced to
reduce the health impact of the virus. Moreover, domestic economic effects have been exacerbated
by a global recession that is more sudden than anything seen before, and quite severe in its impact.
South Africa has been struck by the pandemic at a time when its domestic economy was weak and
public resources constrained, and when the country was trying to recover from a decade of state
capture.
The pandemic will impact on education and the situation of children and youths in a number of ways,
some of which will receive attention in other current Resep research. This paper deals with issues
related to enrolment, promotion, repetition and dropout.
The school year has been shortened and curricula had to be adjusted. It remains to be seen how well
the shortened curricula will be covered, and whether these new curricula provide an adequate
foundation for subsequent grades. In the early grades, it is known that the reading, writing and
mathematics ability of South African school children is already far below par if compared in an
international context. Shortening the school year will probably simply add to the problem of
inadequate preparation for the next years of the Foundation Phase, or even the Intermediate Phase.
It is unclear what the effects of incomplete coverage of the curriculum in the shortened academic year
will be. How well can even a shortened curriculum be covered? Will curriculum changes have knock-
on effects for subsequent grades? Given a reduced and hastily covered curriculum, greater leniency
may perhaps be shown to struggling learners. The possible consequences for repetition, flow-through
and class sizes need to be understood to direct advocacy efforts.
Usually, repetition rates are high in the last few school grades, and consequently, so is repetition. This
has been no ordinary year, however, and the education authorities have still made no clear decisions
on how to apply repetition policy this year. There are views that it would be unfair to hold children
back at the end of the year in a situation where there is only limited opportunity to test their
performance, against criteria that are unclear because of the trimmed curricula, and where their
opportunities to learn were severely curtailed by circumstances. On the one end of the spectrum there
is a view that everyone should pass, and that they should rather be tested again at the end of the next
grade. At the extreme other end of the spectrum is a view put forth by some academics that the whole
year should be repeated, and that this should apply to everyone, a policy that was implemented in
Kenya. In between there are varying views, e.g. that the current year’s curriculum should continue for
a few months into 2021, before learners are promoted to the next grade, where they will also have to
2have a trimmed curriculum. Something along those lines may have been what was implied by the
Minister in a recent Press Statement where she said
All teachers know that catching-up lost learning, or learning recovery, is not an easy quick
activity but requires a lot of dedicated time. This will include a concerted effort by both
parents and teachers and will need to extend into the 2021 academic year. To allow for
this, we have revised the Annual Teaching Plans to extend to next year. (Motshekga, 2020)
But there are also other options. Many teachers and also parents appear reluctant to accept a policy
where everyone is promoted to the next grade, if that were to apply also to those learners who have
not returned to school since the schools reopened. So it is quite possible that we may see a policy that
combines a decision that learners who have not returned for a substantial part of the last semester of
2020 would not be allowed to progress to the next grade, while all those who did return could be
promoted on the strength of the fact that they have not been given a ‘fair opportunity’ to complete
the 2020 work and that it would be fairer to test them at the end of 2021. In the final part of this paper,
possible consequences of alternative repetition policies in 2020 for enrolment in 2021 are investigated.
1.2 Covid-19 & school closures
The number of school days that have been lost due to the school closures varies because of the way
the lockdown was imposed and return to school was scheduled and managed. The school calendar
that was to apply for the rest of the year when school reopened in August would have implied that
learners would attend school for between 119 and 168 days, depending on the grade, compared to
the normal approximately 200 school days. These numbers exclude matriculants, who have a shorter
calendar for instruction before starting their exams. However, lack of readiness for reopening meant
that some schools only opened later, children or teachers being positively tested for the virus led to
many schools closing again for a period, and also, to manage social distancing, most schools adopted
a system of rotating attendance, where learners in each grade would alternate attending school on a
daily, weekly or bi-weekly basis. This meant an additional 40 to 60 days that children could not attend
school.
1.2.1 SCHOOL CLOSURES AND LEARNING LOSS
In a recent statement, the Minister of Basic Education, Ms Angie Motshekga, referred to the loss of
schooling days and the consequences for learning as well as for planning for next year:
‘We are all aware that many days of schooling has been lost this year, especially in the
early grades. This could lead to long term learning losses, and increase the inequality in
learning outcomes even further. This situation makes it more urgent than before to
provide sufficient support to teachers in teaching reading. All teachers know that catching-
up lost learning, or learning recovery, is not an easy quick activity but requires a lot of
dedicated time. This will include a concerted effort by both parents and teachers and will
need to extend into the 2021 academic year. To allow for this, we have revised the Annual
Teaching Plans to extend to next year.’ (Motshekga, 2020)
Information about the extent of learning loss is at this stage very limited, and largely confined to
experiences in single schools or small groups of school. Learning loss is likely to be greater than simply
the part of the year that was lost to teaching and learning. In addition, there are large differences in
the ability of parents to support children’s work at home, and also differences in the learning
opportunities offered by the school even during the school closures. Indeed, in the first major
international study of such learning loss during the pandemic that has become available, it is found
3that learning loss amongst Flemish children in a grouping of Belgian Catholic schools was large, and
also differed between as well as within schools along socio-economic lines (Maldonado & De Witte,
2020).
2. THE RETURN TO SCHOOL
2.1 Data
When examining the amount of schooling lost, it is important to examine school attendance following
the re-opening of grades. At the time of writing in November 2020, there is still no systematic and
complete attendance data available from government, despite this being an important metric for
evaluating learning losses. This is symptomatic of a greater administration problem, and it is therefore
fortunate that the NIDS-CRAM survey provides data from which some idea of school attendance can
be gathered.
Data and information are crucial in uncertain times. During the lockdown, Statistics South Africa had
to stop fieldwork. Resep then initiated an inter-university project, supported by government, to
monitor living conditions over six months, using a telephone survey. 1 NIDS-CRAM (Coronavirus Rapid
Mobile Survey) collected information in its first wave from a broadly nationally representative sample
of 7 000 respondents drawn from the National Income Dynamics Study (NIDS) panel survey; after
attrition of 20%, the second wave of about 5 600 respondents was still broadly representative. The
survey draws on the background information of respondents collected in five earlier NIDS waves to
supplement the limited short telephone survey. This data set provides important information on
school attendance regarding education and the position of children and youth in this time of rapid
change, and some other issues that will be discussed in this report.
2.2 What the NIDS-CRAM data tell us about the return to school
Mohohlwane, Taylor & Shepherd (2020) did a thorough investigation of the NIDS-CRAM Wave 2 data
insofar as it pertains to education, to examine attendance rates in July, prior to schools closing for the
second time. This forms the information used in this section of this paper.
From the work of Mohohlwane et al (2020), it can be seen that even in so-called ‘open’ grades (grades
6, 7, 11 and 12, which were allowed to return to school first), attendance was still not nearly 100
percent, while in ‘closed’ grades, attendance was not zero (Figure 1). This indicates that there was no
strict adherence to school closure policies, but also that schooling did not return to normal even for
those grades that were allowed to return to school.
1
http://resep.sun.ac.za/how-does-south-africas-covid-19-response-compare-globally-a-preliminary-analysis-using-the-new-
oxcgrt-dataset/
4Figure 1: Attendance rates by grade in July prior to closure
Source: Source: Mohohlwane, Taylor & Shepherd 2020.
The Eastern and the Western Cape were the two provinces with the lowest attendance rates for open
grades in July. This may have been because these two provinces were initially the provinces hardest
hit by pandemic, but strangely the Western Cape had the highest attendance for closed grades of all
of the provinces.
Figure 2: Attendance rates by grade in July prior to closure
Source: Mohohlwane, Taylor & Shepherd 2020.
One source of data from government is absenteeism as reported by school principals, in a survey of
611 schools, focussing on open grades in early July. From the results of this survey, absenteeism rates
appear to cover a wide range (Figure 3). Although 20 percent of school principals reported less than
five percent absenteeism, which is quite close to normal, approximately three quarters of school
principals reported between five and fifty percent absenteeism. On average, absenteeism of
approximately 17 percent was reported. Thus significant numbers of learners did not return to school
when their grades reopened.
5Figure 3: Rates of absenteeism reported by school principals in July 2020
Source: Mohohlwane, Taylor & Shepherd 2020.
Although the richest 10 percent of the population appear less concerned about children in the
household returning to school (Figure 4), attendance in open grades does not differ significantly
according to learner socioeconomic status (Figure 5). On the other hand, the richest 10 percent of
learners in closed grades have far higher attendance than poorer learners, perhaps as a result of more
of these learners attending private schools that did not phase in return to school according to grades.
Figure 4: Level of concern about return to school by quintile/decile
Source: Mohohlwane, Taylor & Shepherd 2020.
Figure 5: Attendance by SES quintile/decile in July
Source: Mohohlwane, Taylor & Shepherd 2020.
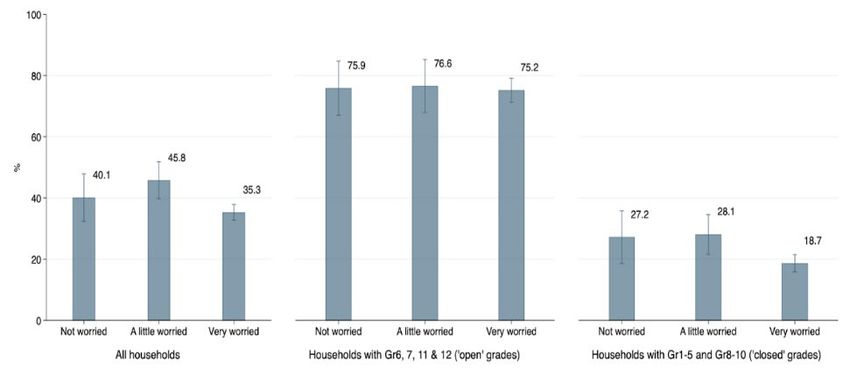
Interestingly, return to school appears to have been relatively unaffected by how concerned parents
are about their children returning to school, although respondents in NIDS-CRAM reporting that they
were “very worried” about the return to school reported lower attendance than those reporting
6themselves to be “not worried” or “ little worried”, but the differences are not statistically significant.
This indicates that other reasons may exist for learners not attending school.
Figure 6: Attendance in July by level of concern about return to school
Source: Mohohlwane, Taylor & Shepherd 2020.
2.3 Conclusion on the return to school
From the above, it is clear that there has been no complete return to school. This is indeed very much
in line with the experience in many other countries where schools have reopened. In South Africa’s
case, this may mean that many learners do not return to school before the end of the year. If this
should be the case, it is likely to have implications for repetition policy and perhaps also for dropout,
as will be considered in Section 3, where we turn to enrolment scenarios.
3. ENROLMENT ANALYSIS
3.1 Research questions and methodology
Will dropout at this stage be dissimilar from other years? It is necessary, for instance, to determine
what the implications will be of greater leniency in pass rates for enrolment, progression, dropout and
class sizes at different levels. This is potentially particularly important at Grades 10 and 11, given
historically high dropout rates in Grades 9 and 10, and high repetition rates in Grades 10 and 11.
The methodology in this part of the report is to utilise available data sources (discussed in the next
sub-section, 2.2), to present a short literature review on the topic of enrolment, repetition and dropout
(in sub-section 2.3), and to investigate current and past patterns of progression, repetition and dropout
(in the following sub-section, 2.4), similar to earlier Resep research. This background and that in the
previous section will be used to arrive at a few alternative scenarios affecting repetition policy and
behaviour of learners that will be the subject of Section 3, along with the possible implications of these
scenarios for future enrolment numbers.
3.2 Data
The Department of Basic Education has given Resep the LURITS datasets for 2017, 2018, 2019 and
2020, after the data had been anonymised. LURITS is the acronym for the Learner Unit Record
Information and Tracking System, and has in recent years replaced the data that were historically
collected from schools using the so-called EMIS (Education Management Information System) tables.
In principle, each learner should have a unique number assigned to her that will follow her if she should
move to another school in any province. That system is not yet fully operational, however, with the
7consequence that tracking learners remains difficult. For instance, 27% of learners who were in Grade
7 in 2018 could not be found in Grade 7 or Grade 8 in 2018; this is the grade where learners move
between primary and secondary school, and few learners drop out at this stage. This makes it
impossible to calculate dropout rates, as learners who have ‘dropped out’ of LURITS may simply be the
same ones found at another school that have ‘dropped in’ to LURITS, because their unique learner
number is not maintained.
The data underlying LURITS is obtained from individual schools, most of which keep their records
electronically, with SA-SAMS (the South African Schools Administration and Management System)
being the main management system used for this purpose. The Western Cape does not use SA-SAMS,
but a system similar to LURITS that predates LURITS, known as CEMIS, from which the Western Cape’s
LURITS data is derived.
The quality of data management within schools and reporting of such data to higher levels in the
education system are still quite varied, thus enrolment numbers appear to jump quite erratically in
some schools across years. Failure to improve this data management and particularly to get the unique
learner identification number functioning well means that this potentially extremely powerful system
is still functioning below its capacity, and careful analysis is necessary in some cases to avoid drawing
erroneous conclusions. Nevertheless, after considerable investigation it was decided to use the 2018
LURITS data as the core data for analysis.
3.3 Literature overview on repetition and dropout
Until recently, limited data was available on school repetition and dropout, and as a result these issues
took a back seat to other education problems in terms of policy focus and education research. A
confounding factor is that repetition and dropout reporting and calculations are often problematic or
misunderstood (DBE, 2006; Crouch, 2005; Simkins, 2013). However, in recent years, repetition- and
dropout-specific questions have been included in the General Household Survey (GHS) and National
Income Dynamics Study (NIDS), and some researchers have been able to access administrative
datasets, resulting in more research on the subject, despite results still varying according to the data
used.
Officially, according to the Admission Policy for Ordinary Schools (Department of Education, 1998)
repetition is allowed once per school phase, where phases consist of the Foundation Phase (Grades 1
to 3), the Intermediate Phase (Grades 4 to 6), the Senior Phase (Grades 7 to 9) and the Further
Education and Training (FET) phase (Grades 9 to 12). While mostly adhered to in earlier grades, the
policy was largely ignored in the FET phase until 2013, when it was specifically endorsed for this phase
(DBE, 2012). Kika and Kotzé (2018) use NIDS data and determine that although the policy is not strictly
adhered to in the FET phase, it resulted in a large decline in the number of learners repeating more
than once, which in turn led to a decrease in overall repetition rates for the period 2013-2016, although
these rates have increased since the study was conducted. Regarding overall repetition, South Africa’s
repetition policy does not cap repetition numbers and therefore does not keep repetition numbers
low.
A study conducted in 2019 (Van der Berg, Wills, Selkirk, Adams & Van Wyk, 2019) highlighted the large
numbers of learners repeating in the South African education system, with the associated costs of this
repetition estimated to amount to at least 8% of the national basic education budget in 2018/2019.
This repetition is mainly concentrated in the FET phase (as a result of schools holding back weaker
learners in order to maintain good matric pass rates), but there also exist “peaks” in repetition at the
8start of each phase (namely Grades 1, 4, and 8 2 and 10), indicating that in the absence of the promotion
policy, many learners would repeat more than one in a phase.
For those favouring repetition, it is heralded as a positive remediation method to reduce learning
deficits in later grades, to encourage learners to put effort into learning, and to reduce heterogeneity
of learner capabilities which poses difficulties in teaching to the right level for teachers that already
struggle to produce adequate learning outcomes. However, it is argued by others that repetition is
strongly linked to later dropout, and that since repetition is more concentrated in poorer schools,
repetition perpetuates social inequalities. The usefulness of repetition in South Africa is cast into doubt
with repetition having been described as “a lottery” in the past (Lam, Ardington & Leibbrandt, 2011;
Branson & Lam, 2010), with assessment practices and correct identification of repeaters appearing to
be problematic in less functional schools (Van der Berg & Shepherd, 2015; Van Wyk, Gondwe & De
Villiers, 2017; Von Fintel & Van der Berg, 2017).
Repetition has been linked to dropout in a number of international and developing country studies
(Roderick, 1994; Jimerson, 2001b; Jimerson, 2002; Glick & Sahn, 2010; Andre 2009; Manacorda, 2012),
although only in some grades in the case of Jacob and Lefgren (2009). Furthermore, a meta-analysis of
repetition studies found that only around 5% of 175 studies found an improvement in repeaters’
academic performance (Jimerson, 2001a). Lorence (2014) proposes that repetition too early (Grades
1 or 2) may have detrimental effects, but that repetition too late is ineffective at improving academic
achievement. South Africa has universal enrolment in Grade 1 and good learner retention in primary
school (Bashir et al, 2018), but significant numbers of learners drop out in secondary school, with the
most likely dropouts being learners who have failed or were failing their current grade, and learners
who repeated once or more in earlier grades, resulting in them being classified as overage (Van der
Berg et al, 2019a).
Challenges associated with correctly identifying dropout from administrative data, even data not
publicly available, are brought to light in Gustafsson (2017), Van der Berg et al (2019a) and Van der
Berg, Van Wyk, Selkirk, Rich & Deghaye (2019b). As a result, not many studies have examined South
African dropout. Individual analysis of school flows identifies quality issues with the data in terms of
missing or inaccurately recorded information and unique learner identifiers that do not always migrate
with learners moving between schools. This implies that dropout figures likely overestimate dropout,
while at a learner-level dropout identification is still not accurate until better data quality is obtained.
Branson, Hofmeyr and Lam (2013) used NIDS to investigate dropout between 2008 and 2010 and
confirmed international findings that repetition (as identified by overage learners) was associated with
higher risk of dropout, a finding confirmed by Van Wyk, Gondwe & De Villiers (2017), who found that
as many as 75% of Grade 9 repeaters dropped out within the next four years. Potential reasons for
dropout are given as pregnancy for females, academic difficulties for both genders (Gustafsson, 2011;
Gustafsson, 2015; Branson et al, 2013), and financial reasons (looking for work) mainly for males
(Branson et al, 2013).
3.4 Education in 2020 under the Covid-19 pandemic
By 1 April 2020, 89% of the learners globally had been affected by school closures (UNESCO, 2020a),
and this number grew over subsequent months. The global Covid-19 pandemic resulted in school
closures around the globe in order to slow down the spread of the virus. In South Africa, schools first
2
Grade 7 is really the start of the Senior Phase, but in this last grade of primary school, schools appear to avoid
having excessive repetition rates. When learners enter secondary school in Grade 8, however, many schools are
concerned about the academic background of these new learners and hold many of them back.
9shut down in March, with a staggered return beginning in June that was once again halted in July with
only Grades 6 and 7 and 11 and 12 learners returning to school before 24 August 2020. Although some
schools implemented remote learning, for the majority of schools there has been a significant number
of school days lost, from which we can infer substantial learning loss has taken place during the 2020
academic year. Schools worldwide also reported concerns about learners’ health and wellbeing in
terms of nutrition, social isolation and other psychological effects under school shutdowns (UNESCO,
2020c), indicating that detrimental effects of the shutdowns extend beyond simply school days lost. A
World Bank report (2020:12) also note the detrimental effect of school closures on attachment to
school:
“For some children and youth, being out of school may cause disengagement and reduce
their schooling persistence. Children who were already tenuously connected to school
could be further discouraged, making them especially vulnerable to dropping out as the
economic shock hits. For instance, interest in going back to school may be much lower for
vulnerable or struggling students if they feel they will not be able to catch up due to school
closures and if schools do not offer extensive support for remedial learning.”
Although it is too early to know what effect school shutdowns have had on repetition and dropout,
there have been numerous studies examining school attendance rates, which are likely to affect both
dropout and repetition in most school systems. The first European country to allow learners to return
to schools was Denmark, which found between 80% and 90% of primary school learners returning to
school. Korea opened schools for distance learning, with nearly 99% attendance of online classes, while
countries like Mexico adopted a two-phase approach to school return, and Sierra Leone used its
experience from past Ebola closures to deliver remote learning and school readiness measures
(UNESCO, 2020b). Upper middle-income countries like Armenia faced difficulties in implementing
distance learning, while countries such as Canada faced fewer difficulties with the transition (UNESCO,
2020d).
Schools’ ability to teach remotely is dependent on four forms of “readiness”: technological readiness,
content readiness, pedagogical readiness, and monitoring and evaluation readiness (UNESCO, 2020d).
In the context of South Africa, it is reasonable to assume that the majority of South African schools do
not fare well under these readiness criteria and as a result remote teaching has not been a solution to
avoid learning losses, although there may be exceptions in some schools. Regarding attendance in
South Africa, Mohohlwane, Taylor and Shepherd (2020) evaluate the initial impact of school return
using NIDS-CRAM and school attendance data and find that while high numbers of adults reported
being worried about children returning to school, this did not have an effect on attendance rates.
Overall, attendance rates in South Africa 2020 are lower than in previous years, but higher than might
be expected given the concerns and disruptions to schooling in 2020. For grades open in August,
attendance disaggregated by most learner and school characteristics is mostly between 77 and 88%,
indicating high, but not universal, return to education after school shutdowns.
In previous school disruptions, it has been seen that vulnerable girls in Sub-Saharan Africa were more
likely to drop out of school or to have had less access to remote learning resources (Rafaeli &
Hutchinson, 2020). Higher dropout can be the result of increased care-burdens stemming from school
closures, as well as increases in gender-based violence and unplanned pregnancies affecting female
students. On the other hand, boys who are likely to drop out as a result of disengagement from school
may be more likely to stay away from school once schools reopen, exacerbating existing male
disadvantage in dropout in many countries (UNESCO, 2020e). Concerns have also been raised about
widening inequalities along socioeconomic lines (Fortuna, Tolou-Shams, Robles-Ramamurthy &
Porchel, 2020; Alvi and Gupta, 2020; Dorn, Hancock, Sarakatsannis & Viruleg, 2020), and in the past
this has been found, where disruptions to schooling results in dropout among poorer learners (Reddy
10and Sinha, 2010). For a country with as high social and educational inequalities as South Africa, this is
cause for concern.
One policy recommendation to lessen widening inequalities is to prioritise identifying and reaching out
to learners at risk of not returning to school, something that has not received sufficient attention in
South Africa. A strong EMIS system has been observed to assist with monitoring school return and
targeting support in Maldives and Montenegro (Nugroho, Pasquini, Reuge & Amaro, 2020), but
previous findings on the limited reliability of South Africa’s EMIS even under normal circumstances do
not point to this being a reliable tool in South Africa’s crisis response.
Although no official policy recommendations regarding repetition have been published in 2020, it
appears likely that there will be strong public opposition to large scale repetition for learners who have
returned to school, as it would be regarded as unfair to penalise them for not meeting appropriate the
usual promotion requirements, as this may be largely due to school closures and learning loss that
affected most learners in 2020 through no fault of their own. Automatic promotion may be the most
acceptable decision. However, there may also be strong opposition among teachers and peer learners
to promoting learners who have not returned to school to the next grade, except perhaps in some
cases related to absence from school due to fears about children’s susceptibilities to the virus due to
co-morbidities. It can therefore be hypothesised that learners who have not returned to school will
repeat the grade, should they return to school in 2021. In the absence of other interventions, though,
dropout for learners not returning to school and who would be made to repeat could be quite high.
We return to this issue in the scenario exercise.
3.5 Progression, dropout and repetition: Current patterns
3.5.1 ENROLMENT
Total enrolment captured in LURITS in 2018 is 16% less than that reported by the General Household
Survey, at 11.4 million versus 13.2 million (Figure 7). This undercount in LURITS seems to be very
consistent across grades, with the exception of Grade 1, where it is less 3, and in Grade 12, where the
GHS numbers exceed the LURITS numbers by fully 38%. It is not clear why this is the case and whether
matrics are even more undercounted in LURITS than in other grades, or whether responses to the GHS
question may in some ways have contributed to an inordinately high estimate for matriculants in GHS. 4
The figure shows that the pattern of enrolment in LURITS and the enrolment numbers derived from
the GHS is very similar, with similar peaks and troughs. Notable is the rise in Grade 3 or 4, another
minor rise in Grade 8, and then a bulge in Grade 10. This pattern is well known and reflects the effect
of the repetition policy and repetition practice. Learners are not supposed to repeat more than once
in a phase, and repetition tends to be when learners enter a new phase: In Grade 1, then again in
Grade 4, and then again in Grade 8 rather than in Grade 7, which is the beginning of the senior phase,
as repetition is more inclined to occur in high school than in primary school. Such greater repetition is
perhaps indicative of teachers not being very satisfied with the cognitive levels that many learners
have achieved, and holding them back at the beginning of every phase.
3
Grade 1 enrolment can be estimated in GHS as all those reporting to be at school, and who have not yet
completed Grade R. However, some enter Grade 1 without having been to Grade R, so the Grade 1 numbers in
GHS would be an undercount.
4
The 629 000 full-time matriculants that wrote the matric exam in 2018 indicates that the 608 000 captured by
LURITS might be closer to reality than the 841 000 reporting in GHS being at school and having completed grade
11. This differences of more than 200 000 is twice as large as would have been expected based on the ratios
applying for other grades.
11Figure 7: Enrolment by grade according to LURITS and the General Household Survey, 2018
Lurits2018 GHS2018
1 400 000
1 200 000
1 000 000
800 000
600 000
400 000
200 000
0
Source: Own calculations from GHS 2018 and LURITS 2018-19.
Despite the problems with the completeness of the LURITS data, the patterns across the data are
broadly in line with expectations, and it is probably good enough to use for analysis of repetition and
overage learners. Unfortunately, as will be shown, this is not the case for the dropout rate, which is
completely over-estimated if LURITS data is taken at face value.
3.5.2 REPETITION
Repetition rates in South African schools are high. The average rates for each school quintile are shown
for boys and girls separately in Figure 8. It is apparent that boys have a repetition rate that is at least
50% larger than that of girls in the bottom four quintiles, and the proportional difference is even larger
in the top quintile. It should be noted that for both genders, there is little difference in repetition rates
for the bottom three quintiles, but for both genders, repetition is a great deal lower for Quintile 4 and
especially for Quintile 5 schools.
Figure 8: Repetition by quintile & gender, 2018
16% 14.8% 14.4% 14.0%
14%
11.6%
12%
10%
8% 9.3% 9.2% 9.2% 6.1%
6% 7.3%
4%
2% 3.5%
0%
Quintile 1 Quintile 2 Quintile 3 Quintile 4 Quintile 5
Female Male
Source: Own calculations from LURITS 2018-19.
12The difference in repetition between boys and girls is also evident in Figure 9, which shows repetition
rates by grade and gender. The pattern across grades is very clear from this, with the higher repetition
rates in Grade 1, 4, 8 and 10 quite evident, though rates remain high in Grade 11, despite the more
lenient progression policy introduced in 2013. The DBE distinguishes “promotion” from “progression”
where the former refers to continuing on to the next grade after meeting all the requirements whereas
the latter is continuing on to the next grade without having met all the normal requirements for that
grade. (Kika & Kotzé, 2018).
Figure 9: Repetition rates by grade & gender, 2018
35%
30%
25%
20%
15%
10%
5%
0%
Gr1 Gr2 Gr3 Gr4 Gr5 Gr6 Gr7 Gr8 Gr9 Gr10 Gr11 Gr12
Female 8.8% 6.2% 4.3% 6.0% 3.5% 2.4% 2.8% 10.4% 10.0% 24.1% 20.6% 5.6%
Male 14.9% 10.6% 7.9% 13.8% 7.7% 5.2% 7.1% 20.6% 16.2% 31.9% 23.5% 4.6%
Source: Own calculations from LURITS 2018-19.
Repetition rates also differ greatly across provinces, as can be seen from Figure 10 and Table 2. It shows
patterns of repetition by province, with the same underlying peaks in rates in Grades 1, 4, 8 and 10.
For provincial comparison, it is useful to look at the final row in this table, which shows the average
repetition rates across all grades for the different provinces. The greatest contrast is between
Limpopo’s 15.6% average repetition rate and the Western Cape’s 7.6%. To shed further light on these
two extremes, Figure 11 compares their repetition rates by grade. From this it appears that the
differences are not great at primary levels, despite the generally better socio-economic background of
learners in the Western Cape compared to Limpopo, but in high school there are large differences.
Limpopo’s repetition rate of 39.3% in Grade 10 is more than twice the 17.0% in the Western Cape.
It is important to keep in mind that the repetition rates are also affected by drop-out, just as repetition
affects dropout. Where learners drop out, it is very often after they have failed a grade. Repeater
numbers are obtained by observing learners who remain in the same grade from 2018 to 2019, usually
also in the same school. 5
5
Due to the difficulty currently still experienced in tracking movement of children between schools in LURITS, it is
very difficult to know how many learners drop out of a school and how many simply change schools (in which
case they also may be repeating). The difficulty matching learners who move between schools is illustrated by the
fact that 27% of learners who in 2018 were in grade 7 (usually the end of primary school) could not be tracked to
another school in 2019, though it is clear that most of them did not drop out,
13Figure 10: Repetition rates by grade & province, 2018 (2019 repeaters as % of 2018 enrolment)
EC FS GT KZN LP MP NC NW WC TOTAL
Gr1 16.6 13.8 10.5 12.9 9.2 11.9 15.6 9.8 9.2 12.0
Gr2 11.1 9.5 7.1 8.1 7.9 8.2 9.2 8.9 7.8 8.5
Gr3 8.1 6.0 5.2 5.8 6.8 6.1 6.6 6.3 5.2 6.2
Gr4 11.5 13.8 6.5 8.8 13.3 8.5 14.8 12.4 8.8 10.1
Gr5 6.6 7.3 3.4 5.2 8.5 4.6 6.6 6.3 4.7 5.7
Gr6 4.7 3.9 2.4 3.6 5.7 3.3 4.9 4.1 2.9 3.8
Gr7 6.2 9.7 2.6 3.9 5.9 4.3 12.4 4.7 4.1 4.9
Gr8 13.4 20.9 13.1 15.2 22.4 12.4 17.5 19.7 10.5 15.6
Gr9 11.6 13.3 10.2 13.2 21.2 11.8 14.7 13.1 9.4 13.1
Gr10 29.1 31.4 24.6 25.9 39.3 26.0 29.2 28.2 17.0 28.0
Gr11 22.8 18.1 16.0 23.0 30.4 25.0 17.7 20.2 12.2 21.9
Gr12 6.7 4.6 0.6 4.4 13.6 7.0 1.0 0.6 0.4 5.2
Total 12.3 12.8 8.6 11.1 15.6 10.8 12.8 11.4 7.6 11.3
Source: Own calculations from LURITS 2018-19.
Figure 11: Repetition by grade, Western Cape and Limpopo, 2018
45%
40%
35%
30%
25%
20%
15%
10%
5%
0%
Gr1 Gr2 Gr3 Gr4 Gr5 Gr6 Gr7 Gr8 Gr9 Gr10 Gr11 Gr12
LP 9.2% 7.9% 6.8% 13.3 8.5% 5.7% 5.9% 22.4 21.2 39.3 30.4 13.6
WC 9.2% 7.8% 5.2% 8.8% 4.7% 2.9% 4.1% 10.5 9.4% 17.0 12.2 0.4%
Source: Own calculations from LURITS 2018-19.
Provincial differences are well illustrated by Figure 12, which shows the average repetition rate in 2018
for Grades 8, 9, 10 and 11, across provinces. Most provinces had repetition rates that were very similar
to South Africa’s average of 20% – quite a high figure – but three stand out: The Western Cape’s 12%
and Gauteng’s 16% are much lower than the average, while Limpopo’s average of 29% is an extreme
outlier.
14Figure 12: Average repetition rate Gr8-11
35%
29%
30%
25%
21%
19% 20% 20% 21% 20%
19%
20%
16%
15% 12%
10%
5%
0%
EC FS GT KZN LP MP NC NW WC SA
Source: Own calculations from LURITS 2018-19.
One of the consequences of repetition, when it is not cancelled by dropout, is that some children
become older for their age. If one considers all learners in the public school system, we see that only
42% are not too old for their grade (this is taken to be turning 7 in Grade 1), and that 21% are a full
three years or more overage (Figure 13). As very few South African children enter Grade 1 late, that
means that many learners have repeated at least three times, which is only possible for those in the
final (Further Education and Training) phase if the repetition rules are applied as is prescribed. In the
Eastern Cape, only 36% of learners across all grades are not overage.
If one considers patterns across the socio-economic spectrum by contrasting learners in different
school quintiles, we see only small differences between the bottom three quintiles, but in Quintile 4
the non-overage proportion is higher at 49%, and only 12% are three or more years overage. In Quintile
5, a full 69% are not overage, and only 4% are 3 or more years overage.
Figure 13: Appropriate or overage status in Gr10, 2018
100%
90%
80%
70%
60%
50%
40%
30%
20%
10%
0%
EC FS GTKZN LP MP NCNWWC SA Q1 Q2 Q3 Q4 Q5 SA
3 or more years overage 25 23 10 23 27 23 23 22 8 21 28 26 22 12 4 21
2 years overage 17 19 14 14 15 16 18 18 14 16 17 17 17 15 8 16
1 year overage 22 23 23 20 20 21 22 22 24 21 21 21 22 24 19 21
Not overage 36 35 52 43 38 40 37 38 54 42 33 36 39 49 69 42
Source: Own calculations from LURITS 2018-19.
As one would expect, the overage proportion rises across the grades, at least until the last two grades.
Figure 14 shows the decline in the number of learners that are appropriately aged across the grades,
15and a commensurate increase in the numbers overage, first those one year overage, then two years,
and then finally three or more years. If one also considers Figure 15, though, that excludes those not
overage, it is much clearer how the shift occurs. What also becomes clearer is that, after Grade 10,
there is a drop in the overage numbers, as the overage learners are more likely to drop out, often after
repeating again in Grades 9, 10 or 11. The table is also useful to consider these trends.
Figure 14: Appropriately aged and overage by grade in public schools, 2018
Not overage 1 year overage
2 years overage 3 or more years overage
1 200 000
1 000 000
800 000
600 000
400 000
200 000
0
Source: Own calculations from LURITS 2018-19.
Figure 15: Overage by grade in public schools, 2018
1 year overage 2 years overage
3 or more years overage
600 000
500 000
400 000
300 000
200 000
100 000
0
Source: Own calculations from LURITS 2018-19.
16Table 1: Overage by grade in public schools, 2018 (percentages)
Grade Not overage 1 year overage 2 years overage 3 or more years All ages
overage
Gr1 90% 9% 1% 0% 100%
Gr2 83% 14% 2% 1% 100%
Gr3 76% 19% 3% 1% 100%
Gr4 70% 21% 7% 3% 100%
Gr5 67% 21% 8% 4% 100%
Gr6 65% 22% 9% 4% 100%
Gr7 64% 21% 9% 6% 100%
Gr8 57% 21% 12% 10% 100%
Gr9 54% 21% 13% 13% 100%
Gr10 42% 21% 16% 21% 100%
Gr11 40% 21% 15% 24% 100%
Gr12 44% 21% 14% 21% 100%
Total 64% 19% 9% 8% 100%
Source: Own calculations from LURITS 2018-19.
3.5.3 DROPOUT
Unfortunately, the incompleteness or the fact that no all learners in LURITS can be matched across
years due to deficiencies in their unique numbering means that LURITS data cannot be used to
determine dropout with any degree of accuracy. Figure 16 shows the dropout rates implied by
matching the data that could be matched between LURITS in 2018 and in 2019, as against the rates
derived in an earlier study based on EMIS data from 7 provinces. As can be seen, there are substantial
differences, and based on what we know, it is more likely that the ASS data, though a little dated,
provides a more accurate picture of dropout.
Figure 16: Dropout rates for all grades derived from ASS 2015-16 and LURITS 2018-19
16%
14%
12%
10%
8%
6%
4%
2%
0%
Gr1 Gr2 Gr3 Gr4 Gr5 Gr6 Gr7 Gr8 Gr9 Gr10 Gr11
2015-16 ASS 1.5% 1.3% 0.0% 2.5% 1.6% 1.9% 3.4% 5.9% 5.3% 8.4%
2018-19 Lurits 6.5% 5.9% 6.0% 6.4% 5.6% 6.4% 10.6% 13.6% 15.2% 15.2%
Note: Gr7 dropout cannot be derived accurately from either ASS or LURITS in its current form.
Source: 2015-16 ASS from Van der Berg et al. 2019, 2018-19 LURITS from own calculations.
One way to estimate the approximate numbers of learners dropping out of school each year is based
on the relative demographic stability and the relatively stable patterns of enrolment by grade. If one
considers that the matric-age cohort is approximately 1 million, and that around 620 000 full-time
17matriculants write the matric examination every year, drop-out should be around 380 000 learners per
year across all grades (1 million minus 620 000). Indeed, applying the dropout rates for the 2015-16
ASS to 2018 enrolment numbers (after interpolating a dropout rate for Gr7) leads to an estimate of
367 000, which is quite similar to the 380 000 estimated above. In contrast, applying the LURITS 2018-
19 dropout rates would imply annual dropout of well over 1 million, which is clearly excessive and
therefore confirms that the LURITS dropout data cannot be used.
3.5.4 A MULTIVARIATE LOOK AT REPETITION
Appendix A contains a set of regression equations (ordinary least squares linear probability models,
i.e. OLS LMP) to ‘explain’ the likelihood of being captured in LURITS in Grade 10 in 2018 and again in
LURITS in Grade 11 in 2019. The accuracy of these regressions on promotion is of course affected by
the deficiencies in the LURITS data, as explained earlier, but as the overwhelming majority of learners
could be tracked from Grade 10 to Grade 11, the regressions still provides a good perspective, albeit
that they under-estimate promotion to Grade 11 somewhat. The first model applies to all Grade 10
learners in 2018. The constant term indicates that around 72% of learners in the reference category
continue on to Grade 11 in 2019, the reference learner being female, from the Eastern Cape, in Quintile
1, and not overage. The negative gender dummy indicates that being male reduces the probability of
promotion by about 5 percentage points. Quintile has a large effect: Being in a quintile 4 school
increases the probability of promotion by just more than 3 points, but this is small compared to the
strong effect of 15 points of attending a quintile 5 school. Overage is the variable that has the biggest
correlation with outcomes, after considering other factors: Compared to an appropriately aged Grade
10 leaner, one who is one year overage is 12 points less likely to be promoted, a learner two years
overage has a 21 percentage point lower likelihood, and one 3 or more years overage has a massive
31 percentage point lower likelihood to be observed in the LURITS2019 data in Grade 11. The Western
Cape has a three percentage point advantage over the Eastern Cape, but interestingly Gauteng has a
5 point disadvantage once all the other explanatory variables have been taken into account, indicating
that its relatively good promotion rates are more due to its student composition in terms of overage
or its far more favourable SES profile. The second and third regression models in Appendix A show very
similar results, for boys and girls separately.
Models 4, 5 and 6 investigate the situation in respectively Quintiles 1 to 3, Quintile 4, and Quintile 5.
The constant terms (the likelihood of a reference person being observed in Grade 11 in the 2019 LURITS
data) rises sharply across these three models, from 70% to 78% and finally to 98% in Quintile 5. One
of the other most interesting result is that the coefficients on being overaged increase sharply in
Quintile 4 and especially in Quintile 5 – learners that have fallen so far behind in such schools, where
they would usually encounter better learning conditions, appear to have little chance of being
promoted.
Overall, the multivariate analysis shows that all the variables seen to be associated with better
promotion rates in the foregoing descriptive analysis are indeed still significantly associated with such
better promotion, even when considering all of them simultaneously in multivariate regressions.
Gender, province, age relative to grade and school quintile all play a role. Thus, any changes in
promotion that we may see in the scenario exercises that follow will be influenced by these attributes
of the learners and their schools. In particular, and this is a message that cannot be emphasised
enough, learners who have failed often are at high risk of repeating and/or dropping out. The
application of repetition policy in 2020 could have severe consequences for individuals’ choices and
futures, but also for education planning that is so severely influenced by enrolment planning,
particularly in secondary schools.
184. SCENARIOS OF FUTURE ENROLMENT
4.1 The four scenarios considered
Various factors may play a role in the decisions of education policy makers that would influence
promotion, dropout and repetition:
• The first is their response to a view, widely held in parts of the community, that having learners
repeat in 2020 would be unfair, as they have not been given a realistic chance to master the
curriculum, and had to endure very difficult circumstances during the lockdown and school
closures, including in many cases stress or hunger.
• A second view that may also influence policy is a widespread one that it would be unfair to progress
learners that did return to school since reopening, and that such learners should thus repeat.
• A third option that has gained some currency is that, for most grades, it may make sense to hold
higher assessments back until the end of 2012. For instance, someone currently in grade 4 would
then automatically be promoted to grade 5 in 2021 (where some of the work in the early part of
the year may in fact still be part of the curriculum set for grade 4). At the end of 2021 then, this
learner would be assessed in a way that also considers the foundation that had to be laid in grade
4. Should this be the case, repetition rates in 2021 may then go up somewhat, but that is still
uncertain.
Considering what is known from NIDS-CRAM about the return to school (see Section 2 above), and also
drawing from international experience, it is likely that 10% or maybe even 20% of learners may not
return to school this year. As mentioned earlier, we do not know definitely why (and how many)
learners drop out from the South African school system. The best explanations thus far include
academic difficulties as the main factor, with pregnancy and financial (work-seeking) reasons being
provided as lesser reasons (Gustafsson, 2011; Gustafsson, 2015; Branson et al, 2013). If learners are
automatically progressed to the next grade at the end of 2020, academic difficulties may not be
detected by learners, and may not result in dropout at the end of the year. Although little is known of
the non-returners to school, it is unlikely that the majority have dropped out permanently as a result
of academic difficulties – reasons such as health concerns are more likely for this non-return. On the
other hand, the extended time away from school may have resulted in higher teenage pregnancies,
while the economic hardship caused by the lockdown may have resulted in more learners needing to
look for work to assist in helping their families. These two reasons would increase the number of non-
returners that will not return to school in 2021.
Taking the above factors into account, we model a 40 percent drop-out rate among the non-returners
to school, while the remaining 60 percent will return to school and repeat their grade in 2021. Under
a scenario where 10 percent of learners do not return to school by the end of 2021, overall dropout
under these assumptions in Grades 8 to 11 is lower than would be expected in a normal school year.
In the event that 20 percent of learners do not return to school before 2021, overall dropout rates
remain similar (or higher in some grades) than usual.To give an indication of possible enrolment in
2021, the following scenarios are modelled 6:
6
In addition, linear probability models (LPMs) were applied to the data with outcome variables being repetition
and dropout, and the coefficients on the explanatory variables were then used to predict the probability of
dropout and repetition for each group of learners disaggregated by gender, school quintile, and overage status.
By construction, the probability of promotion was set to equal 100% minus the probability of repeating or
19Scenario 1: Normal repetition and dropout rates applied in both 2020 and 2021
Scenario 2: Zero repetition or dropout in 2020, normal repetition and dropout in 2021
Scenario 3: 10% of learners do not return to school in 2020 and repeat or drop out, while the remaining
90% are promoted automatically. Of those who are not promoted, it is assumed that 40% would drop
out of school and 60% would repeat next year. This assumes then a 6% repetition rate and a 4%
dropout rate.
Scenario 4: 20% of learners do not return to school in 2020 and repeat or drop out, while the remaining
80% are promoted automatically; this is again followed by normal repetition and dropout in 2021.
Again, as in Scenario 3, it is assumed that 40% of those who are not promoted, would drop out of
school and 60% would repeat next year. This assumes then a 12% repetition rate and an 8% dropout
rate.
The 2018 LURITS data was used as a starting point, and it is assumed that 2020 enrolment and
repetition patterns are similar to that of 2018 as captured in LURITS 7. The focus is on Grade 9 to 12, as
this is where there are the largest differences in enrolment between grades, and also the highest
repetition rates.
4.2 Results of applying the four scenarios
The total number of learners in secondary school will be affected considerably by the dropout rate.
The dropout rate implied in Scenario 3 is lower than the current situation, while the 8% is higher. Under
Scenario 3, around 110 000 more learners will have to be accommodated in secondary school in 2021
than currently, if we assume that only 5.2% of matriculants will repeat in 2021, as was the pattern in
recent years.
dropping out. Owing to mistrust of the dropout percentages in the LURITS data, the predicted dropout
probabilities were scaled down to give an overall dropout rate in 2018 equivalent to the dropout rates in the
2015/16 ASS (EMIS) data. The adjusted dropout probabilities were then used to calculate dropout in 2021, where
changes in the underlying characteristics of the learners resulted in a slightly different overall dropout rate to the
2015/16 ASS. LURITS repetition rates were used for Scenario 1. Under Scenarios 3 and 4, it was assumed that
learners who do not return to school will have to repeat or drop out. To determine what proportions of non-
returners will repeat and drop out, the ratio of dropout probability to repetition probability was calculated for
each group of learner characteristics. Since it is likely that learners who do not return to school in 2020 may be
more likely to never return to school, as discussed earlier, this ratio of dropout to repetition was doubled. From
this adjusted ratio, it could be calculated what proportion of the non-returners will drop out, and what proportion
will repeat. This is how the 60:40 split between repeaters and dropouts was derived that formed part of Scenarios
3 and 4.
7
As indicated earlier, GHS data show 16% higher school enrolment than LURITS, largely because of incomplete
data in LURITS.
20Table 2: Applying the four scenarios: Effect on secondary school enrolment in 2020
Current Scenario 1: Scenario 2: Scenario 3: Scenario 4:
Normal No Repetition, Moderate Larger
Repetition & No Dropout Repetition & Repetition &
Dropout Dropout Dropout
Enrolment:
Gr 8 946 170 975 997 921 440 884 770 941 540
Gr 9 846 491 877 131 946 170 902 342 858 515
Gr 10 990 415 962 714 846 491 821 267 796 043
Gr 11 822 676 840 827 990 415 940 734 891 053
Gr 12 607 653 604 688 822 676 771 723 689 456
Total 4 213 405 4 261 357 4 527 192 4 320 837 4 176 607
Growth 2020-21:
Gr 8 3% -3% -6% 0%
Gr 9 4% 12% 7% 1%
Gr 10 -3% -15% -17% -20%
Gr 11 2% 20% 14% 8%
Gr 12 0% 35% 27% 13%
Note: ‘Current’ figures here are the 2018 enrolment numbers from LURITS, which were simply assumed to proxy
for enrolment in 2020. It was shown earlier that GHS enrolment estimates are 16% higher than LURITS data in
2018. New enrolment from Grade 7 in Grade 8 in 2021 is assumed to be 828 000 in Scenarios 2, 3 & 4. The matric
repetition rate of 5.2% is assumed to apply in 2021.
Source: Own calculations.
The real challenge for education planning may not be the overall numbers to be accommodated in
secondary schools, but the changes in enrolment patterns across grades. In Scenarios 2, 3 and 4, there
are considerable decreases in enrolment in Grade 10, which is not surprising: this is the grade where
enrolment peaks because of very high repetition rates. Figure 17 shows growth in enrolment in 2021
compared to enrolment in 2020 under Scenario 3, which currently appears to be the most realistic
scenario, though also the one that implies the greatest enrolment changes across grade, as well as a
moderate increase of 107 000 in aggregate enrolment in secondary schools. 8 Because progression to
Grade 11 and also Grade 12 is easier under this scenario, the large decline of 17% in enrolment in
Grade 10 may occur in combination with a rise of 14% in Grade 11 and a disturbingly high 27% rise in
Grade 12 enrolment.
8
It is pertinent to again note that the 2018 enrolment captured in LURITS is used as proxy for 2020 enrolment. It
has been indicated earlier that this enrolment is an under-estimate of perhaps around 16% if the GHS is used as
comparator, and there would have been some modest aggregate enrolment growth since, so all estimates of
numbers might be a little too low.
21You can also read