Australia and SAR: A Road Map - John Richards - CRC for Spatial Information
←
→
Page content transcription
If your browser does not render page correctly, please read the page content below

Australia and SAR: A Road Map

John Richards

A report prepared for the CRC for Spatial Information, based on the study entitled Robust
Imaging from Space, August 2012. It draws on that study, which, inter alia, provides a
comprehensive compendium of past, current and future free flying, spaceborne SAR systems,
and provides cost estimates. The author is grateful for having had access to that material.

Acknowledgement

The author acknowledges the assistance of Dr Peter Woodgate, CEO of the CRC for Spatial
Information, for his very helpful comments and suggestions on the draft of this report.

                                      www.crcsi.com.au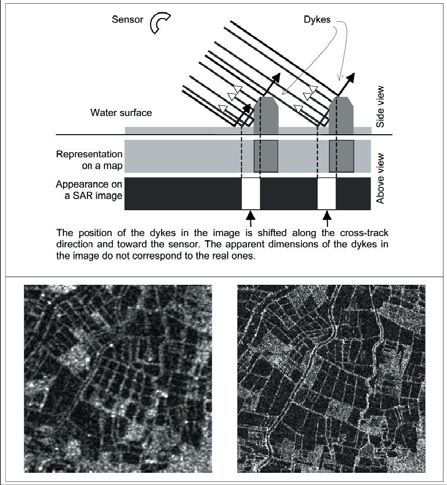
2

PRECIS
The all‐weather, wide‐area imaging capability of synthetic aperture radar (SAR) satellites and their
strengths for hazard mapping, coastal surveillance and carbon accounting lie behind existing and
planned investments in SAR systems by other nations. Australia needs to determine whether it can
continue to rely with confidence on overseas‐provided data for similar applications of national
interest, or whether it needs to secure future access to data by becoming a contributor to space and
ground segment hardware.

There are significant benefits to Australia by investing in the national skills base in interpreting SAR
imagery. SAR analytical skills are an order of magnitude more complex than those needed for
understanding other space imagery. Australia would benefit from a SAR workforce that can address
current needs, and also tackle innovative applications that we cannot now foresee. These
applications will provide powerful tools for the future management of our natural and commercial
resources.

For these reasons Australia needs to make forward looking decisions as to the most cost‐effective
way to gain access to SAR imagery, by balancing short and long term costs against security of access.

An incremental strategy that creates feasible options for Australian access to SAR imagery is needed,
structured so that investing in skills development early on will give Australia the capability to make
informed decisions about future Australian investments in this evolving technology.
3

EXECUTIVE SUMMARY
1. SAR is a form of satellite imagery that has particular benefits to Australia in the management
of its natural and commercial resources, and its coastlines, and in its monitoring of hazards.
The all‐weather, all‐time‐of‐day, imaging capability of SAR and its relative strengths for hazard
mapping, coastal surveillance and carbon accounting lie behind investments by other nations with
comparable surveillance and resource management interests to Australia. They include Canada,
Argentina, Italy, Germany, China, Japan and the European Space Agency. All have their own space
and ground hardware and thus can control coverage and image acquisition strategies to meet their
long term and episodic needs. The experience of each to date has prompted their investment in
follow‐on programs, often with improved capability, as does the opportunity to derive products
from radar data that cannot be obtained by other means. These include maps of topographic
change, three dimensional tomographic images and products that permit an analyst to discriminate
between bodies with rapid fluctuations, such as the sea and flood waters (even under canopies), and
those which don’t change, such as dry land and ships at sea.

2. Australian access to SAR data may not be secure unless Australia contributes to acquisition
costs.
Australia’s civilian applications of SAR have always depended on the data recorded and often
provided at concessional rates by overseas agencies. While acceptable in an R&D setting, Australia
must question whether it can continue with that strategy for applications of national interest, or
whether it needs greater security of data access. Placing a mission into orbit is the most costly part
of the SAR process, and operators of space and ground hardware may in future seek greater
contributions from users like Australia who benefit from high‐value, low‐cost activities using their
data.

3. There is a range of investment options available to improve SAR capability
It is difficult at this time to see a firm economic argument in favour of a dedicated Australian
spacecraft or instrument. There is, though, the half way option of seeking investment as a partner in
planned missions by operators with a proven track record. While not as expensive and high risk as
developing our own system, it offers the benefits of lifting Australian experience with space
hardware and instrumentation, allowing some influence over coverage and imaging characteristics,
and showing Australian preparedness to contribute to the high cost end of acquisition while
benefiting from the high value interpretation and product generation phase.

4. Interpreting SAR imagery properly is challenging but essential.
Before any sensible decision can be taken about hardware, Australia needs to invest in raising the
national skills base for the interpretation and use of SAR products so that our applications specialists
are able to exploit fully all that SAR imaging has to offer, even with reliance on non‐Australian data
supply. Irrespective of the longer term, that would not be a wasted investment. Improved skills
would encourage the generation of value added products by small business, and would open up
marketing and aid possibilities in our region. A raised national skills level would also allow a detailed
investigation of the importance of investing in Australian instruments or platforms, or of seeking
partnering opportunities with nations which already have mature systems in orbit.
4

5. An incremental Australian investment strategy is the best approach
This report recommends a three phase incremental investment strategy in which an initial stimulus
of the value adding sector, as shown in the table below, provides the opportunity to benefit from
SAR capabilities at low cost, while investigating fully the benefits of space and ground sector
partnering. If pursued, the partnering option also provides time to make informed decisions on a
fully Australian SAR system. That is important because data gathering in the future may be more
appropriately based on emerging developments in satellite clusters and the use of bistatic and
multiple transmitter/multiple receiver radar systems, all of which need to be evaluated. Moving
between the phases seen in the table would be contingent on successive cost‐benefit analyses.

Phase                             Cost and Period      Key Benefits
1   Develop the value adding      $5m over 7 years     Improved skills and competitiveness of
    sector by improving the                            Australian organisations, and positioning to
    national skills base in SAR                        make informed decisions about phase 2.
    image interpretation.
2   Partner with an existing      $340m over 8 years   Australian priority access to imagery over
    SAR system provider and                            Australian areas of interest, and improved
    contribute to costs.                               security of long term access. Skilled
                                                       workforce now available to make informed
                                                       decisions about phase 3.
3   Australian owned              $740m over 13        Highly secure data supply with skilled
    instruments and or            years                workforce for public good applications and
    satellites.                                        commercial exploitation.
5 1 Introduction Imaging with synthetic aperture radar (SAR) is a valuable adjunct to the more common earth observation from space (EOS) systems, which use optical instruments. Not only does radar imaging have particular technical advantages over optical methods, but the earth surface properties sensed are often complementary to those that are detected with imaging in the visible and infrared, the so‐ called optical wavelengths. There can be significant benefits in using the two technologies cooperatively. This report summarises the essential elements of SAR technology, and provides a road map with options for Australian future engagement with SAR imaging. The purpose of the map is to ensure that Australia’s spatial management needs in resource exploitation, environmental management, and safety and security, benefit cost‐effectively from the unique advantages this technology brings. It makes the underlying assumption that a decision has already been taken to examine SAR in favour of, or together with, imaging in the visible and infrared as a technology for Australian investment. As a result this report does not include a comparative assessment of SAR and optical EOS techniques. 2 Structure of the Report Investment as a nation in SAR remote sensing technology can be expensive if the aim is to design, or influence the design of, spacecraft and sensors matched to Australian needs. It is clearly less expensive to be a purchaser of products recorded by the missions owned by other nations, but then the results may be sub‐optimal in terms of national requirements. There is also the question of continued access to data, and access at reasonable cost, especially if Australia is not seen as a serious player with other nations in the data acquisition phase of remote sensing, in which it makes meaningful contributions internationally to the development and operation of SAR systems. In order to understand the trade‐offs in pursuing one option against others, and whether hybrid strategies are possible, it is important to have a feel for the nature of SAR imaging and to appreciate, albeit qualitatively, the information about the landscape and its features revealed by radar that are not available in optical imagery. It is also necessary to know what radar data is currently available and what is planned for the timeframe relevant to this report1. This document is structured in the following manner. Section 3 presents a brief summary of SAR imaging. A fuller technical overview is given in Appendix B, which is non‐mathematical but sufficient to allow important concepts to be appreciated. A series of case studies is presented in Appendix A in order to allow the unique advantages of SAR to be appreciated. In Section 4 the pull factors that support the adoption of SAR in Australian EOS operational use and research are considered. That includes a summary of the lessons learnt from the case studies. 1 The report Robust Imaging from Space, August 2012 shows that there is a considerable archive of historical data available, and summarises the data that is currently being recorded. Those current programs may not be best suited to our national requirements.
6

Section 5 argues that the future potential of SAR is important to consider at this stage in our
understanding of the technology and its current state of maturity.

Section 6 is a principal section of the report. Against pull factors and potential developments
formerly identified it introduces investment options for Australia by differentiating national SAR
engagement into the space segment, the ground segment and the value added segment, the last of
which opens up opportunities for regional engagement both on an aid basis and as a fee‐for‐service
activity. The importance of training in the interpretation and application of SAR imagery is
emphasised as an essential element that underpins any future Australian SAR activity. The concept
of agents – expert radar image interpreters – is introduced as a means to service both domestic and
regional users.

Section 7 elaborates on specific investment possibilities and provides timelines for alternative
pathways that align options to timeframes and indicative expenditures. It concludes with a tabular
road map.

3     The Benefits of SAR Imaging
Optical imaging uses reflected sunlight in the visible and infrared range of wavelengths to form
images of the earth’s surface. In contrast, SAR remote sensing is based on recording earth surface
features with radio waves, similar to those used in mobile telephones and WiFi. Since the Second
World War the radio waves of interest – the so‐called microwaves – have been known by the letter
designators shown in table 12, which are used in this treatment. Waves at a given wavelength are
radiated onto the earth’s surface and the radiation that is scattered back to the SAR contains
information about surface properties.

                                 Table 1. Microwave bands used in SAR

                                   Band         Typical SAR wavelengths
                                                          (cm)
                                      P                  66.7
                                      L                  23.5
                                      S                  12.0
                                      C                   5.7
                                      X                   3.1

SAR radiation is technically pure, compared with sunlight; as a result it is possible to look for
differences between two or more images that reveal information on the topographic properties of
the landform; this technique is widely used and is referred to as interferometry. Interferometry
cannot be performed with optical EOS data.

SARs can be described as single polarisation (SP), dual polarisation (DP) and quad or full polarisation
(QP). It is not essential to understand the technicalities of those terms, but just to appreciate that

2
 The full ranges of wavelengths associated with each letter are shown in Appendix B; those in Table 1 are the
values commonly encountered in SAR remote sensing.
7
their value in remote sensing, and also their complexity and system cost, goes in the order
SP→DP→QP. These allow a valuable tool called polarimetry to be used to help understand earth
surface properties.
From Appendix B the following are seen to be the unique advantages of radar earth observation
compared with optical imaging:
a. SAR is an all‐weather, all time of day, imaging modality, and is only affected by exceptionally
heavy rain at very short wavelengths.
b. Earth surface features respond differently at radar wavelengths than at optical wavelengths,
making radar a different, and yet complementary, diagnostic tool.
c. The purity of the radiation employed in SAR imaging means that sophisticated products can
be derived from recorded radar images, including maps of topography and topographic
change with time. The availability of interferometric and polarimetric products makes SAR a
very useful technology in many applications, and gives it an operational edge over optical
imaging in many cases. Current research shows that three dimensional (tomographic)
imaging is also possible.
4 Pull Factors
Investment in SAR can be substantial, especially with involvement in space and ground hardware, so
it is clearly important to examine carefully those applications for which SAR has an edge and which
would justify an investment of any magnitude. In broad terms, they fall in the following non‐
Defence categories:
a. Public good applications:
i. Resource monitoring and management (crops, forests, waterways, mapping)
ii. Environmental monitoring and management (carbon accounting, land clearing,
water pollution)
iii. Safety and security (vessel detection, coastal management)
iv. Hazard mapping and monitoring, including emergency response (flooding, coastal
inundation)
b. Private sector applications
i. Domestic resource utilisation (agriculture, commercial forestry, mapping,
exploration geology)
ii. Providing regional value adding on a fee‐for‐service basis (which could also form the
foundation of an aid program)
The set of case studies given in Appendix A demonstrate broadly the use of SAR in these sorts of
areas. The lessons drawn from the case studies, which are summarised in Table 2, are:
a. Cropping and environmental applications generally favour the longer wavelengths of P and L
band.8
b. Forest monitoring applications are best handled by a combination of long wavelengths (P
and L), for assessing woody biomass, and short wavelengths (typically X) for assessing
canopy green biomass.
c. Flood mapping can be carried out at any wavelength, but longer wavelengths (P and L) are
preferred when inundation under canopies is important.
d. Vessel detection and coastal applications are best served by shorter wavelengths, and
typically X band.
e. The in‐between wavelength of C band is a compromise and but offers benefits over L and X
band respectively for some low level crop applications.
f. There is little experience with S band.
g. Success in the applications referred to in a‐d above is enhanced if cross and either dual or
full polarisation imagery is available, and if derived properties such as interferometric
coherence can be employed.
Table 2. Significant SAR characteristics revealed in the case studies of Appendix A
SAR wavelength Full polarisation helpful?
Application P L S C X somewhat very
Cropping x x ? x x
Forestry x x ? x x
Environment x x ? x x
Flooding and hazards x x ? x x
Coastal surveillance ? x x
? = not enough known at this time
At this stage in the application of SAR technology internationally, it is difficult to uncover case
studies that show how earth observation with SAR can beneficially displace other methodologies
long used in Australia in agriculture, forestry and resource applications generally. That is not to say
that such benefits will not ultimately be realised – it is just that it is too early in the R&D cycle to be
able state those outcomes with confidence.
What is clear from the case studies, however, is that there is a range of applications of importance to
Australia for which SAR is ideally suited and for which solutions are not currently available or current
methodologies are less effective generally. There are three areas that stand out in this regard:
a. Hazard mapping and monitoring
b. Coastal zone surveillance
c. Forest carbon accounting
While some still require underlying research, that research will supplement understanding in the
other application areas identified from the case studies where work is still needed. Thus, while
important in their own right, a focus on these three will form the basis of longer term and wider SAR
applications in Australia. This is consistent with the philosophies adopted by overseas agencies
engaged in SAR; not a “field of dreams” approach, but recognition of the incipient importance of the
technology to many public‐good and commercial applications, and the need to be situation‐ready
when the various R&D programs conclude, and when innovative applications present themselves. It
can be a technology with long development and investment cycles.9
5 Future Trends
While factors such as the future potential of technologies are generally antithetic to significant
public investments, the state of development internationally of SAR applications, derived products
and methods for SAR image understanding, means that the technology has not reached a sufficient
level of technical maturity to ignore future potential altogether. If Australia waits until many of the
emerging applications have matured then it may have to be a fast‐follower if it wants to realise
commercial benefits3, particularly in the value adding sector. It may also find itself in the position of
having to license intellectual property developed by other nations for its own needs.
The alternative is to engage in, and even partly lead, new developments so that intellectual property
rights are more likely to be available directly for use, rather than by way of license. That of course
entails taking risks by funding new research, but the Canadian experience with SAR is a good
example of the importance of farsighted investments in emerging technologies. Not only has that
allowed the development of the high profile and successful Radarsat program, but early Canadian
research positioned that country and its sponsored, commercial operators such as Macdonald
Dettwiler and Associates (MDA), a start‐up out of the University of British Columbia, to capture a
significant part of the ground station market, including the market built around the correlation
software required to form image products from the data recorded by SAR satellites.
To position Australia well in this regard investment would be needed to enhance the skills of the
Australian SAR work force, including in research. While analyst expertise is important for
interpreting optical imagery, the degree of knowledge required for radar image interpretation is of a
higher order, owing to the much greater complexity of the data. This point is taken up in the next
section in relation to value adding.
6 Investment Segments and Training Complexity
There are various ways of compartmentalising the SAR image capture and utilisation chain to help
understand where investments might be placed. One is shown in Fig. 1, and consists of three broad
elements acting in sequence to convert radiation scattered from the landscape into products of
value to a variety of end users. These are:
a. The Space Segment, consisting of the satellites themselves and the need to launch and place
them into orbit. It also includes the SAR sensor. This segment converts backscattered
radiation measurements to data ready to be downlinked to the ground segment.
b. The Ground Segment, consisting of the receiving hardware and antennas, and the software,
needed to convert the data recorded by the satellites, and subsequently downlinked, into
image products for provision to users. It also includes station keeping hardware and
software to maintain satellites in the correct orbital position.
3
While a fast–follower strategy might make sense for high volume, low complexity products such as mobile
telephones and motor vehicles, the uniqueness of derived products from radar imagery, and the intellectual
investment behind their creation, makes it a risky approach if the products are expected to have high value in
resource exploitation and national interest applications. As the perceived economic gain derived from a given
product goes up then so does its value and price. That has to be balanced against being in at the beginning.10
c. The Value Adding Segment, consisting of those organisations and individuals expert in
applying radar data and in deriving innovative products, along with specialised software;
these convert image data to value added and derived products (such as topographic and
thematic maps, and maps of coherence).
This decomposition is used in the next section to focus attention on specific investment options.
Here we take up the essential aspect of training. Investment in value adding requires a skilled
workforce, particularly in operational use, as against research. Without a skilled workforce there is
little sense in ground and space segment investments, so that we are led naturally to the value
adding segment as Australia’s first priority for investment.
space segment
downlink and
satellite control antenna(s)
bus
SAR antenna
downlinked raw
signal data value adding segment
radiation data imagery Images converted to products
derived and value added
uplinked command products for use
and control information
ground segment
ground station
Fig. 1. The three segments of a SAR system; the blue (shaded) line shows the value enhancement chain and
the conversion roles of each segment in the chain.
For SAR image analysis the interpreter has to understand, at minimum, how the scattering behaviour
of earth surface features depends on wavelength, look angle and polarisation state. The latter two
are not relevant to optical imagery. When interferometric products are of interest the analyst has to
be aware of the performance limitations of the imaging geometries selected, along with the
importance of derived properties such as coherence as diagnostic tools4. The emergence of
techniques such as tomography opens prospects for better information extraction for some
applications, but again the complexity in understanding both the imaging process and what is being
mapped is much greater than for optical image interpretation.
As a consequence the level of training required for radar image understanding is high. Australia was
well positioned in the 1980s and 1990s in terms of radar image interpretation skills, with expertise
available in DSTO, CSIRO and the universities, but, with a few exceptions, much of that expertise was
either allowed to dissipate or has not kept pace with recent developments. If Australia is to make
optimal use of existing SAR technologies and ensure it is well skilled to accommodate newer and
emerging developments, then it needs agencies with radar expertise not widely available at present.
4
See J.A. Richards, Remote Sensing with Imaging Radar, Springer, Berlin, 2009.11 Because of the danger of losing key skills if significant experts leave in this highly complex technology, Australia ideally should have at minimum three agencies with the appropriate expertise. Because of technology developments they must be underpinned by research components. There would also be value in having available skilled personnel who would operate on a commercial basis to undertake the interpretation task for both commercial and government users, either independently or collaboratively, so that optimal use of the technology can be realised. Those data interpreters would need to provide on‐demand services in response to particular application needs, and could also provide their own speculative derived‐products into the marketplace. The interpretation scenario is even more complicated when coincident radar and optical data sets are to be analysed in combination. Because the two imaging modalities respond differently to earth surface properties, their use together will often allow better value added products to be derived. The complexity of knowing how to combine the data sets again, almost certainly, means that the average user will not have the expertise in both modalities and in how the information they provide on the landscape should be fused. The notion of image interpretation services noted above would seem to be needed for a successful operational remote sensing program. That leads to an additional beneficial consideration, based on providing a radar remote sensing service into our region. Providing a regional value‐adding operation would open up a significant service sector to Australian agencies skilled in the use and interpretation of SAR imagery and its derived products. Because Australia’s major regional neighbours lie in the tropical zone, cloud cover presents a significant barrier to routine and successful resource assessment from space using optical technologies. Since cloud cover is not important to radar imaging, SAR is an ideal technology for the tropics and has been so recognised for many decades. Yet its successful application requires advanced skills, and certainly an expertise base an order of magnitude greater than that needed for optical image interpretation. With appropriate investment in training to re‐equip Australian researchers and applications specialists Australia would be well placed, because of its alliances and trade ties, to provide such a service. It would represent a large and evolving market for Australian commercial operators and could form part of a regional aid program of significance. It is difficult to quantify the market, but econometric modelling, informed by EOS experts, would allow reasonable estimates to be derived in the short term. Although the three‐segment model of Fig. 1 has been proposed here as a means for understanding the cost of engaging with SAR remote sensing, it is a model that could also be applied to understand the economic value of entry at various points in any earth resources data acquisition system. By focusing separately on the space, ground and value adding segments it is possible to weigh the level of investment in the hardware segments against the economic value estimated to accrue from product generation. If increased funding of the space and ground hardware leads to image data of higher economic value, including the implicit value in being able to influence tasking of the space and ground segments, then the hardware investment would be justified. Otherwise national interests would be served by remaining a purchaser of data.
12

7      Investment Options and Timelines
When contemplating increasing Australia’s public investments in SAR as an earth observation
technology, it is necessary, first, to decide to which of the segments in Fig. 1 major expenditures
should be directed, if not all three. Clearly, Australia’s major interest is in end products and so, at
minimum, the value adding segment should be its first priority, as noted above. Investment in that
segment alone means Australia is invariably regarded as a data‐taker and not a data‐specifier, in that
the imagery it has to work with may not have characteristics well‐matched to Australian needs. The
right types of imagery may simply not be available; and, of course, with time Australian users may
have to pay commercial rates.

In order to have a say in data specification, and to guarantee continuing access in the longer term, it
would be necessary for Australia to be seen as investors in data acquisition5. That means it has
decisions to make in terms of ground station provision, satellite provision, or both, and on the extent
of its involvement. Ultimately, of course, it may determine that it is in its national interest to have a
dedicated spacecraft and ground receiving facility. That is an expensive and high‐risk pathway6, and
it is difficult to see it as supportable in the foreseeable future for purely civilian applications.
Nevertheless it is shown as one of the choices in Fig. 2, which lays out five alternative pathways that
Australia may wish to consider, and from which we draw the following observations.

Although not as expensive as a dedicated Australian spacecraft, the option of an Australian
instrument on the satellite of another nation is appealing, but involves several assumptions: that bus
mass and space can be negotiated; that Australian expertise is available for design and maintenance;
and that the risk of launch or equipment failure is acceptable. It would seem that this may be a
better option once Australian expertise has improved and Australia’s position as a partner in data
acquisition has been secured by other, less risky and lower cost approaches.

The option of seeking to be a partner in the program of another nation offers several benefits as a
means for developing Australia’s reputation as part of the supply community and in terms of buying
its seat at the international table of decision makers in SAR technology. It is lower in cost than the
options of supplying Australian hardware, and yet should give it a say in the data types of
importance to Australian mapping and monitoring needs. It is the option promoted here, and is
developed further in the following analysis. It has the added advantage of sitting midway between a
full dependence on overseas supply, as at present, and a totally Australian SAR system, and thus can
form part of an evolutionary pathway – or road map – that we take up below.

5
  In the three transitions shown in Fig. 1, that from radiation to data, while essential, adds least value but
requires the largest investment in terms of funding the space and ground segments. In contrast, the value
adding segment of imagery to products is the least expensive, relatively, yet it adds most value to the
information chain. It would not be unreasonable for the operators of space and ground hardware to
anticipate increased contributions from those who benefit substantially from value added activities using their
data.
6
  Currently a build and launch would cost in the vicinity of $400M. While launch services are available from,
for example, the US, Russia or India, the investment risk is high because of launch or instrument failure. While
capital loss can be indemnified, opportunity costs incurred through single launch failures cannot.
13

Space Segment                                    Principal Advantages                 Principal Disadvantages              Configurations
SS1   Choice 1    Purchase of data as required   Lowest cost                          Supply continuity not guaranteed,
                                                                                                                                           •
                                                                                      pricing not guaranteed
SS2   Choice 2    Australian equity in another   Moderate cost, less compromise,      Lead time may be unacceptable
                  nation's future program        may influence later specifications                                                    •
SS3   Choice 3    Australian equity in another   Moderate cost, compromise,         Accept current specifications
                                                                                                                                   •
                  nation's current program       acceptable lead time
SS4   Choice 4    An Australian SAR on           Optimised instrument               Moderately expensive, high risk,
                                                                                                                               •
                  another nation's spacecraft                                       local skills needed, long lead time
SS5   Choice 5    An Australian spacecraft or    Total design control               Expensive, high risk, local skills
                                                                                                                           •
                  cluster                                                           needed, long lead time
Ground Segment
GS1   Choice 1    Overseas ground segment        Lowest cost                          Minimal control over acquisitions
                                                                                                                                   •
GS2   Choice 2    Shared ground segment          Moderate cost, compromise            May not be optimal
                                                                                                                               •       •   •
GS3   Choice 3    Dedicated Australian ground Total design control                    Expensive, high risk, local skills
                                                                                                                           •
                  segment                                                             needed, long lead time
Value Added Segment
VAS1 Choice 1     Source expertise from          Low cost                             No Australian skills development
                                                                                                                                           •
                  overseas on fee for service                                         and thus no value added markets
VAS2 Choice 2     Establish single expert        Skilled Australians, best funded     High risk, since investment in key
                  agency                                                              people not spread
                                                                                                                           •   •   •   •   •
VAS3 Choice 3     Establish several expert       Skilled Australians, risk spread     Resources are spread; may offset
                  agencies                                                            by networking
                                                                                                                           •   •   •   •   •

Highest cost and risk, although maximum control; investment in several value adding agencies warranted
High cost and risk, contributes to ground station expertise, number of value adding agencies to be determined
Option may not be possible owing to current overseas decisions and commitments; even so lacks flexibility
Lower cost and risk, allows development of Australian expertise; number of values adding agencies to be decided
Lowest cost and capital risk, but increased data contunuity risk; decisions needed on investing in value adding

Fig. 2. The simple choices available in each of the three principal segments, and five configurations that would
seem viable by matching choices across segments; in some cases there are alternatives, such as whether and
when to sponsor more than a single value adding agency. The choice promoted here is highlighted in yellow
and with enhanced, bold text.

Having selected a partnering option the decision that then needs to be taken is whether Australia
seeks a role in current programs or in those that have been approved for the future. There seems
little value in the former since there is no room to tailor programs to Australian needs and
immediate Australian data access is not essential. The logical choice is to seek partnership in a
program that has received approval to proceed but may still be open to partnering proposals. To
minimise investment risk, future programs with a successful heritage are to be preferred. Figure 3
shows two possibilities in each of the common wavebands used in radar remote sensing, along with
the single program proposed for S band. Table 3 shows the country or agency responsible for each
mission. Which of those missions seems to meet Australia’s needs best?

From the findings in Section 4 it is seen that the Australia’s needs could be covered with a
combination of L and X band imaging. If systems planned at those wavelengths also provided fully
polarised imagery then best flexibility is offered in terms of future Australian applications, albeit
after suitable research has been undertaken. It is therefore a viable option to seek partnership, for
example, in SAOCOM (Argentina) and CSG (COSMO Sky Med Second Generation from Italy); this is
14
enhanced by the fact that Argentina and Italy are already collaborating in these missions7. This
would give near coincident X and L band imagery that is fully polarised. While it would be helpful to
have P and C band data as well, it is difficult seeing the marginal cost‐benefit of going to those
additional wavebands for other than research purposes at this time. The X and L band combination
should meet most operational needs for the foreseeable future and would also provide material for
developing high levels of Australian skills in SAR research and image interpretation.
The NASA SMAP program is also of
SAOCOM 1A, 1B QP interest (Oct 2014 – Mar 2018)
L
PALSAR-2 (ALOS-2) SP (HH, VV, HV), DP and QP
HJ-1C SP (HH, VV) Polarisation Key (all missions)
SP: one of HH, VV, HV
S DP: one of HH and HV or VV and VH
QP: all of HH, VV, HV, VH
Radarsat C-1, C-2, C3 QP
C
Sentinel 1A, 1B SP (HH, VV), DP
TSX-NG QP
X
CSG-1, CSG-2 SP, DP, QP
2013 2014 2015 2016 2017 2018 2019 2020 2021 2022 2023 2024 2025 2026 2027
Fig. 3. Programs for consideration if the option is to seek partnership with future, approved missions
Table 3. Owners of the programs referred to in Fig. 3.
Program Responsible country or agency
SAOCOM Comisión Nacional de Actividades Espaciales (CONAE) Argentina
PALSAR Japan Aerospace Exploration Agency (JAXA) Japan
HJ‐1C National Committee for Disaster Reduction, State Environmental Protection
Administration (NDRCC/SEPA) China
Radarsat Canadian Space Agency (CSA) Canada
Sentinel Global Monitoring for Environment and Security (GMES) program, ESA Europe
TSX‐NG German Aerospace Center (DLR) Germany
CSG Italian Space Agency (ASI) Italy
Other options are possible, including the TSX‐SG program and PALSAR‐2, but the timeframe and
existing linkages of the SAOCOM/CSG combination means that that would be a high value alliance
7
SIASGE consortium: Italian‐Argentine Satellite System for Emergency Management, a joint programme of the
Italian Space Agency and the Argentine Space Agency CONAE (Comision Nacional de Actividades Espaciales)15
partner. The C band Radarsat and Sentinel programs would be acceptable, but would represent a
wavelength compromise for the applications of importance to us.
Having chosen, in principle, the route of partnering in the space/ground segment, how can
Australia’s investment be best utilised? Figure 4 shows a pathway for pursuing the option of seeking
partnership in the X and L band programs of other nations8. It is structured so that the value added
segment is enhanced first, in preparation for entering the partnership. Should a decision be taken
not to proceed to invest in hardware segments then the funding of value adding is not wasted.
Essentially, it means a reversion to the last configuration of Fig. 2, albeit with a much better
informed and active value adding sector than is currently the case.
2013 2014 2015 2016 2017 2018 2019 2020 2021 2022 2023 2024 2025 2026 2027
Australian sensor or platform(s) option 3
make this transition if SAR value
established during option 2
SAOCOM 1A, 1B QP L
option 2
CSG-1, CSG-2 SP, DP, QP X
seek partnership early enough
to have say in later missions
first priority must be to up-skill
Develop the value adding sector the Australian SAR workforce option 1
$40M $200M $40M $40M $40M $40M
$25M $25M $135M $50M $50M $50M
$2M $0.8M $0.8M $0.8M $0.2M $0.2M $0.2M option 1
$2M $0.8M $26M $26M $135M $50M $50M $50M option 2
(a) $2M $0.8M $26M $26M $135M $50M $50M $90M $200M $40M $40M $40M $40M option 3
develop value adding sector
develop partnering
develop full ownership model
study option 2 study option 3
proceed to fund option 3
to a total of $740M over 13 years
no investment in option 3; fully fund option
2 to a total of $340M over 8 years
no investment in option 2; fully fund
option 1 to total of $5m over 7 years = decision
no investment in
Australian SAR expertise INVESTMENT DECISIONS
(b)
Fig. 4. (a) Options for enhancing Australian engagement in SAR technologies for EOS, and (b) an investment
pathway that allows go/no go decisions based on experience gained in an earlier phase.
8
The costings for the options in Fig. 4 have been drawn from Robust Imaging from Space, August 2012.16 If the decision is taken to proceed with a space/ground hardware partnership then, along with the investment in value adding, expertise will be developed in order to consider ultimately whether a fully Australian program is warranted, or whether Australian needs remain served by working in collaboration with other nations. That decision point is also shown in Fig. 4. A benefit in delaying that decision is that the world of platforms is changing from total reliance on large, single and expensive busses to clusters of smaller satellites. Clusters have the advantages of sharing the risk of launch and bus failure over several platforms, and improving temporal coverage. The small COSMO Sky Med cluster is a good early example of this principle. But there is still some way to go in terms of proving the value of microsatellites for SAR applications, particularly at the longer wavelengths. This can now be encapsulated in a recommended strategy, as outlined in Table 4. It is based on the nesting of options shown in Fig. 4 and the principle that a decision not to proceed to a subsequent phase does not waste investments to date. The timetable shown in Fig. 4 is set by the projected launch dates and lifetimes of the Argentine and Italian programs that could form the centrepiece of Australian investment in space and ground hardware. Should different international partners be contemplated there would need to be a commensurate adjustment to Fig. 4 and Table 4.
17

     Table 4. Decision roadmap for enhancing Australian SAR engagement for earth observation

Phase Sequential             Typical reasons behind             Likely subsequent activity
      decisions              decisions
 1      Fund enhanced        1. Agreed SAR benefit in           1. Fund up to three R&D centres to
        value adding            coastal monitoring, hazard         build a critical mass of expertise.
        segment                 mapping, carbon accounting      2. Provide assistance funding for
                                and topographic                    small business to establish value
                                applications.                      adding agencies for SAR, and SAR
                             2. Acceptance of the potential        in combination with other data
                                for SAR in agriculture,            types (optical, thermal, lidar).
                                forestry and urban              3. Initiate a detailed study of the
                                environments.                      benefits of investment in the
                             3. Need to create a better            space and expanded ground
                                Australian skills base in SAR      segments made possible by
                                earth observation.                 partnering in overseas L and X
                             4. Can use the outcome of 3 to        band programs.
                                explore future benefits of      4. Alternatively, conclude that
                                SAR and derived products.          Australia’s earth observation
                             5. Attractiveness of potential        future does not rest heavily on
                                regional markets and aid           SAR, apart from the use of data
                                programs.                          from other operators, and
                                                                   proceed no further.
 2      Fund partnering      1. The results of the detailed     1. Determine the most appropriate
        in the space            study in Phase 1 have              programs in which to seek equity
        segment and any         demonstrated the cost‐             and initiate discussions with
        necessary               effectiveness and public           relevant agencies.
        additional              benefits of this solution.      2. Determine the optimum time to
        ground facilities.   2. Delivers some control over         enter the space segment.
                                when and where SAR data is      3. Determine the funding model.
                                acquired, suited to             4. Determine the lead Australian
                                Australian needs.                  agency for this Phase.
                             3. The need to develop greater     5. Based on the early experience
                                Australian experience with         with this Phase, and a detailed
                                SAR instrumentation and            study of cost‐effectiveness,
                                space platforms is now a           explore the advantages of a
                                driver.                            dedicated Australian space
                                                                   segment based on either a single
                                                                   platform or a cluster. This could
                                                                   involve the provision of Australian
                                                                   instruments, or the design of a
                                                                   complete platform(s).
 3      Fund a dedicated 1. The Phase 2 studies have            1. Determine the funding model.
        Australian space    identified significant benefits     2. Determine the lead Australian
        segment.            (spatial and temporal                  agency for Australia’s long term
                            coverage, wavebands and                SAR program.
                            polarisations) in having an         3. Initiate a study of a follow‐on
                            Australian platform or                 program, possibly with both public
                            platforms.                             and private equity.
18
APPENDIX A
Case Studies
Case Study 1: Hazard Mapping – Floods
Observing flooding over large areas even in cloud cover and at night
Case Study2: Soil and Plant Moisture Determination
Measuring agricultural field soil moisture and biomass even through clouds
Case Study 3: Ship Localisation andc surveillance
Observing ships reliably under all weather conditions
Case Study 4: Improved Vessel Detection by Reducing Sea Clutter
Detecting vessels at sea even in moderately rough sea states
Case Study 5: Forest Biomass Assessment
Estimating forest biomass over large areas
Case Study 6: Terrain Deformation Mapping
Accurately assessing deformation resulting from earthquakes, subsidence and
ground water changes over large areas
Case Study 7: Oil Slick and Sea Pollutant Monitoring
Detecting and monitoring oil spills over large areas
Case Study 8: Aquaculture
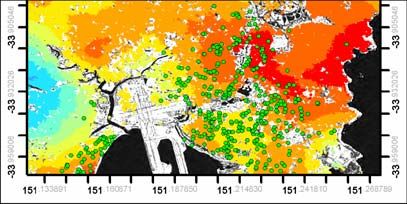
Identify and manage fish and shrimp farms over large areas19 Case Study 1: Hazard Mapping – Floods Observing flooding over large areas even in cloud cover and at night Objective and data used To assess the ability to estimate the extent of flood inundation from satellite imagery. X band COSMO SkyMed data and L band JERS‐1 data. Findings The studies cited below under Source Documents identify the benefits of the property called SAR coherence as a more effective tool for flood inundation than the simple, recorded image product. Using near‐coincident Landsat imagery to delineate flood boundaries in Wanaaring and Goodooga in 2010, Xiaojing and Ge found that SAR coherence based maps were between 88% and 98% accurate. It needs to be kept in mind that the Landsat data could only be used as a baseline because there was no cloud cover at the time the experiment was carried out. In contrast, data for generating coherence maps can be obtained under virtually any weather conditions, and certainly when cloudy. Lessons for Australia This application of SAR is well suited to mapping and monitoring large scale coastal and inland flooding, such as happens all too regularly in this country. It is a reliable technique, both theoretically and because it is time of day, and weather independent. Methodology In case study 3 below, interferometric coherence, effectively the degree of pixel‐level correlation between two scenes, is used to mask out water and to allow ships and other hard targets to be discriminated more easily. Because the water surface is constantly changing its coherence is low compared with cover types that don’t change between acquisitions. When SAR is to be used for flood mapping the opposite strategy is used. We look for regions of low coherence because they are associated with flood waters. That is the simple basis behind these two studies. While flood extent in open regions can also be gauged from optical imagery, a major benefit of radar is that long wavelengths penetrate canopies allowing the flood outline to be delineated in forests, such as in the Amazon and in riverine regions in Australia, again using interferometric coherence. Northern NSW flood as seen by colour IR aerial photography, mapped by GPS from helicopter and as mapped using X band SAR coherence (blue). From Linlin Ge, E., Simmons, D. Abernathy, X. Li, 2010. Integrated remote sensing for monitoring major inland flood events in New South Wales, Australia. The 15th Australasian Remote Sensing & Photogrammetry Conf., Alice Springs, Australia, 13‐17 September, p. 293‐312. Used with permission of SSSI. Limitations Time of acquisition is the major limitation in this application. With current missions the technique cannot be used reliably on‐demand, but it can certainly be applied to map longer term (days to weeks) inundation once imagery has been recorded. At best, turnaround times would take several hours from satellite overpass to provision of imagery to emergency responders. Source documents J. Xiaojing and Linlin Ge, High‐resolution COSMO SkyMed spotlight radar image processing for accurate flood inundation mapping, PowerPoint presentation, November, 2011 H.C. Jung and D. Alsdorf, Repeat‐pass multi‐temporal interferometric SAR coherence variations with Amazon floodplain and lake habitats, International Journal of Remote Sensing, vol. 31, No. 4, Feb. 2010, pp. 881‐901.
20

Case Study 2: Soil and plant moisture determination
Measuring agricultural field soil moisture and biomass even through clouds
Objective and data used
Estimation of biomass and soil moisture of agricultural fields.
L band PALSAR and X band COSMO SkyMed radar data.
Findings
Reasonable agreements were found with predicted soil moisture content from radar data and commensurate
rainfall records. An important demonstration in this study was the strong empirical relationships between L
and X band radar responses, and soil moisture and plant water content. The study draws attention to
previous research that has demonstrated a strong relationship between like (HH) and cross (HV) polarised L
and radar response and the moisture content of moderately rough, bare soils. The dependence of plant
water content on radar wavelength was different for narrow and broad leaf crops, and highlighted the benefit
of having two widely separated wavelengths; horizontally polarised L band was seen to be well correlated
with the water content of broad leaf crops such as sunflower, corn and sorghum, while vertically polarised X
band was seen to have a strong negative correlation with the water content of narrow leaf crops such as
wheat and alfalfa.
Lessons for Australia
Notwithstanding the technical difficulties encountered in this study, and a slightly questionable approach, it
produced enough evidence to demonstrate the viability of assessing crop and soil moisture contents in the
microwave wavelength range. Although it is not clear whether this is a more successful methodology than
other remote sensing techniques for biomass and soil moisture determination, the all‐weather capability of
radar makes it attractive. Even though Australia’s cropping regions are generally not heavily cloud covered
there is anecdotal evidence that the repeat cycles of most optical missions that might be used for crop
assessment still encounter clouds, causing problems when time series information is important for modelling
Methodology
Non‐agricultural cover types were masked out so they would not interfere with the study. Empirical
relationships between radar backscatter in the two wavebands, and plant water content and soil moisture
content, were supplemented by scattering models that allowed soil surface roughness to be accounted for. A
neural network classifier was used to generate maps of soil moisture content and plant water content
(biomass) for a region in Lombardy, Italy.
Limitations
As with many similar studies the availability of data was a major limitation. Temporally coincident L and X
band imagery was a significant concern, and points to operational difficulties if the radar data required in
studies such as these is not recorded by the same platform or by platforms that are scheduled to provide near
simultaneous coverage. Such scheduling could only be expected if different platforms are part of a
partnership consortium, such as SIASGE that underpins this work.
Source document
S. Paloscia, S. Pettinato and E. Santi, Combining L and X band SAR data for estimating biomass and soil
moisture of agricultural fields, European Journal of Remote Sensing, Vol. 45, 2012 pp. 99 – 109.
21

Case Study 3: Ship Localisation and Surveillance
Observing large ships reliably under all weather conditions
Objective and data used
Detection and recognition of ships as an adjunct to the automated identification system (AIS).
TerraSAR‐X, X band imagery in ScanSAR, strip and spotlight modes.
Findings
Vessels over 60m in length were detected 93% of the time in this study by developing a linear regression
between the actual length and that assessed from radar imagery. Sea state often created problems for the
detection of smaller vessels. Otherwise there was a remarkable correlation (95%) between the radar
estimated ship length and the actual (AIS) value. AIS is a European Automated Identification System used
with commercial and other cooperative shipping.
Lessons for Australia
Because of the length of our coastline and the size of the extended economic zone, this approach is appealing
as a potentially cost‐effective means for shipping surveillance and identification. Clearly, the technique needs
to be refined to give better results on smaller vessels and those with non‐metallic super structures. In Case
Study 4 we see an innovative means for reducing sea clutter and thus improving the chance of positive
detection and reduced false alarm rate, possibly for smaller vessels as well.
Methodology
Using shoreline data land was masked out of the imagery; range and azimuth ambiguities from strong shore
or sea based features were modelled and removed, as were antenna side lobe effects. A constant false alarm
rate (CFAR) detector was then applied to allow ships to be identified successfully against sea scatter. The
highjacked MV Sirius was used as a target for part of this work. Broad coverage ScanSAR imagery was used to
locate the vessel, while strip and spotlight images were used for precision location and vessel length
assessment. Vessel velocity determination was also carried out by producing two degraded resolution
products from each original image, and then looking at the displacement between them. Automated
Information System (AIS) data was used both to assist in identification and to corroborate the results obtained
on vessels so equipped.
Limitations
For non‐cooperative (non‐AIS) vessels, the several‐day time lapse between SAR acquisitions means that
vessels, once found, could be lost before the next satellite overpass. Although X band maximises the ship
radar signature it also generates significant sea clutter and thus lowers the signal to noise ratio for the CFAR
detector.
Source document
S. Brusch, S. Lehner,T. Fritz, M. Soccorsi, A. Soloview and B van Shie, Ship surveillance with TerraSAR‐X, IEEE
Transactions on Geoscience and Remote Sensing, vol. 49, no. 3., March 2011, pp. 1092‐1103.
22

Case Study 4: Improved Vessel Detection by Reducing Sea Clutter
Detecting vessels at sea in moderately rough sea states
Objective and data used
Reliable ship detection against sea state noise
COSMO SkyMed quad polarised X band imagery
Findings
SAR coherence has been seen to be an excellent mechanism for improving the chance of vessel detection
against sea state clutter. That is particularly important at X band, because it allows the high target signal
strength to be exploited.
Lessons for Australia
Multiple time imagery makes coherence analysis possible and, as demonstrated, that has the potential to
improve the chance of vessel detection in our region. The COSMO SkyMed program is dual use (civilian and
military) largely because of its high resolution, high chance of detection, X band capability. Such dual use
arrangements should not be overlooked in Australian SAR planning. In principle, the approach here could be
used with the spotlight mode of Case Study 3 to help in ascertaining vessel characteristics, including shape
and length.
Methodology
Although similar in intent to the previous case study this one demonstrates an innovative approach that
makes special use of the coherent and polarised nature of SAR data to enhance the prospect of detection of
ships and other structures such as oil platforms. Effectively, it minimises the confounding effect (clutter) of
sea surface scatter. Because of the time offsets of the different polarised signals in COSMO SkyMed, sea
surface returns are uncorrelated over the short period between the transmission of different polarisations,
whereas the correlation is maintained across polarisations for hard, constant targets such as ships.

SAR image, SAR coherence image and the application of a threshold to detect vessels (from Nunziata et al below).
Limitations
The major limitation is the availability of SAR acquisitions at the time required. In this exercise the target zone
was fixed to the region around the Deepwater Horizon accident.
Source document
F. Nunziata, M. Migliacco, and A. Montuori, Cosmo SkyMed multi‐polarisation SAR data for vessels
observation, PolINSAR 2011 Workshop, Frascati, Italy, 24‐28 January, 2011.
23

Case Study 5: Forest Biomass Assessment
Estimating forest biomass over large areas
Objective and data used
To assess the ability to estimate forest stand biomass from L and P band radar imagery.
Aircraft P and L band SAR data, along with laser scanning to assist in biomass ground truth estimates.
Findings
Correlation between both like and cross polarised backscatter at the longer wavelength P band and L band
imagery was demonstrated, although it was seen to be stronger at P band. The L band data showed
saturation at biomass levels of about 150t/ha, whereas the relationship at P band was fairly linear up to
290t/ha. Biomass estimates had errors in the range on 38‐46% for the L band data and 18‐25% for the P band
data.
Lessons for Australia
This is one of those applications that is classically matched to Australian conditions and needs. The area to be
assessed for forest carbon accounting is vast and there are no other viable techniques for tackling the
problem. Provided biomasses do not exceed about 150t/ha, we learn from this study that L band data will be
acceptable in our context, but the research has still to be completed. Also, this work, being based on aircraft
data, could not control the effect of incidence angle. Early Australian radar research on forest monitoring
with radar (Z. Ahmed and J.A. Richards, Multiple incidence angle SIR‐B forest Observations, IEEE Transactions
on Geoscience and Remote Sensing, vol. 27, no. 5, September 1989, pp. 586‐591) showed the importance of
incidence angle on biomass (age) saturation and the value of building structural forest models rather than
relying totally on regression relationships.
Methodology
Stem biomass ground truth was generated by using laser scanning to estimate stem volume; from this above
ground dry biomass was derived via previously determined relationships for different tree species.
Regression equations were then used to relate like and cross polarised backscatter in the two radar
wavelengths to laser scan estimates of stem biomass. The regression parameters had to be estimated and
several simplifying assumptions were needed to keep the problem tractable.
Limitations
This is an immensely complex problem, especially because of the difficulty in getting reliable ground truth
estimates of dry above ground biomass. Nevertheless, the technique remains one of the only feasible
prospects for forest biomass assessment on a wide scale, and is being pursued by many investigators.
Source document
G. Sandberg , L.M.H. Ulander, J.E.S. Fransson, J. Holmgren, T. Le Toan, L‐and P‐band backscatter intensity for
biomass retrieval in hemiboreal forest, Remote Sensing of Environment, vol. 115, 2011, pp. 2874–2886.
You can also read