Urban mobility and resilience: exploring Boston's urban mobility network through twitter data
←
→
Page content transcription
If your browser does not render page correctly, please read the page content below
Mirzaee and Wang Applied Network Science              (2020) 5:75
https://doi.org/10.1007/s41109-020-00316-9
                                                                                                                 Applied Network Science

 RESEARCH                                                                                                                                        Open Access

Urban mobility and resilience: exploring
Boston’s urban mobility network through
twitter data
Sahar Mirzaee1*          and Qi Wang2

* Correspondence: s.mirzaee@
northeastern.edu                         Abstract
1
 Department of Public Policy and
Urban Affairs, Northeastern              Human mobility connects urban dwellers and neighborhoods and impacts social
University, Boston, MA 02115, USA        equity. An in-depth understanding of human mobility helps to enhance urban
Full list of author information is       resilience. However, limited research has focused on mobility resilience. Building on
available at the end of the article
                                         previous research, this study looks at the neighborhood connectivity enabled by
                                         urban mobility. We analyze the aggregated mobility patterns in Boston through the
                                         coupling of network structure and social characteristics. Geocoded twitter data
                                         combined with socioeconomic datasets were used to create a mobility-based urban
                                         network. Through the quantitative analysis, we found that the social segregation in
                                         Boston shapes its mobility network. Network communities identified by the Louvain
                                         modularity algorithm are often self-containing, meaning that their residents are more
                                         likely to move within their communities. A multinomial regression reveals that spatial
                                         racial and income segregation has a strong impact on the dynamic segregation of
                                         the network. The beneficial network characteristics –e.g. higher density and well-
                                         connected motifs– are less present in areas with bolder presence of minorities. Thus,
                                         the resilience state is not equitable among neighborhoods of different income levels
                                         and races, indicating that the resilience measures of urban networks need to be
                                         adapted according to sociodemographic characteristics.
                                         Keywords: Urban mobility, Resilience, Urban systems, Network science, Social
                                         segregation, Network motifs

                                       Introduction
                                       Cities are hybrid systems consisting of entangled entities and thus should be treated as
                                       one adaptive complex system (Amir and Kant 2018). Because of the high complexity,
                                       advancing urban resilience requires studying and engineering urban areas as a set of
                                       interactive social, environmental, structural, and governance systems. One of the big-
                                       gest challenges of enhancing urban resilience is to identify processes that require
                                       changes in this context. It can only be achieved through case studies that are represen-
                                       tative of the real world accompanied by descriptive and explanatory quantitative ana-
                                       lyses that can also raise new questions (Hill et al. 2012).
                                      © The Author(s). 2020 Open Access This article is licensed under a Creative Commons Attribution 4.0 International License, which
                                      permits use, sharing, adaptation, distribution and reproduction in any medium or format, as long as you give appropriate credit to the
                                      original author(s) and the source, provide a link to the Creative Commons licence, and indicate if changes were made. The images or
                                      other third party material in this article are included in the article's Creative Commons licence, unless indicated otherwise in a credit
                                      line to the material. If material is not included in the article's Creative Commons licence and your intended use is not permitted by
                                      statutory regulation or exceeds the permitted use, you will need to obtain permission directly from the copyright holder. To view a
                                      copy of this licence, visit http://creativecommons.org/licenses/by/4.0/.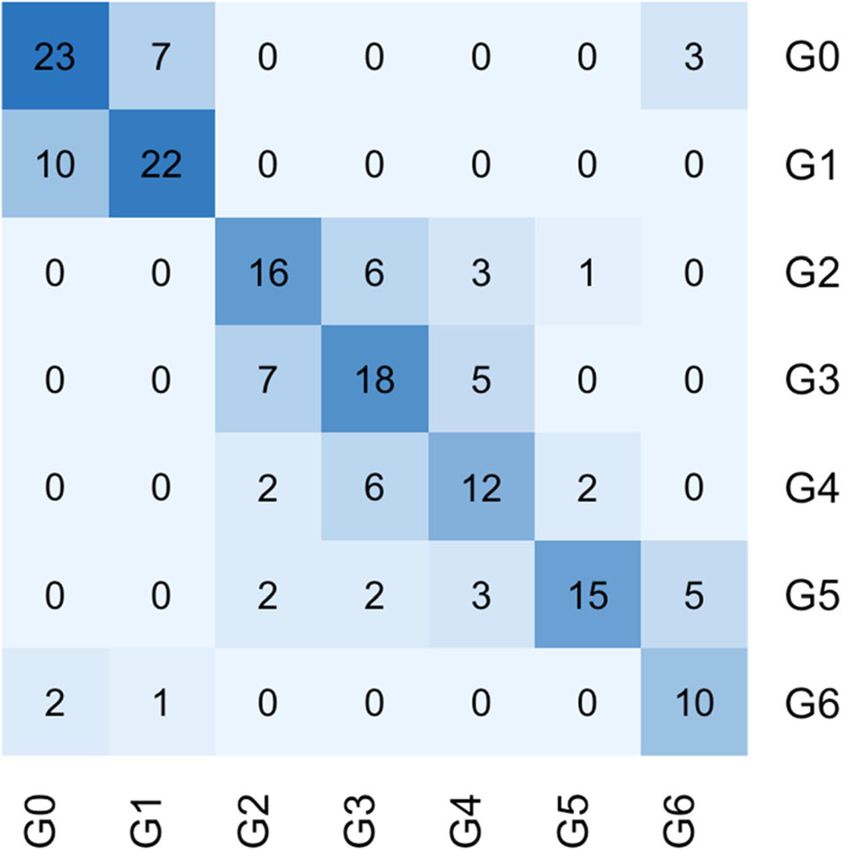
Mirzaee and Wang Applied Network Science   (2020) 5:75                                                          Page 2 of 20

                   Mobility resilience is a critical aspect of urban resilience. Mobility, a basic human be-
                havior, is the “the micro-geographies of everyday life” (Adey 2010). It lies within the
                intersection of many urban systems to generate and accumulate wealth, support busi-
                ness, and maintain engineering and social infrastructures. During manmade and natural
                disasters, maintaining mobility resilience could be a matter of life and death and help
                urban dwellers “remain resilient in the face of adversity” (United States 2017) and with-
                standing and recovering rapidly.
                   Despite the critical importance, human mobility research has long been focusing on the
                discovery of systematic behaviors within a certain range of the stable state, including the
                high uniformity (Jurdak et al. 2015; Brockmann et al. 2006), ultraslow diffusion (Toole
                et al. 2015; Song et al. 2010a, b; Noulas et al. 2012; Cuttone et al. 2018; Yan et al. 2014),
                periodicity (Cho et al. 2011; Liang et al. 2012), high predictability (Bagrow et al. 2011;
                Schneider et al. 2013a), and motif composition (Schneider et al. 2013a, b; Candia et al.
                2008). Limited research has been conducted to understand how mobility enables connect-
                ivity between urban neighborhoods. Also, there is a dearth of studies that attempted to
                understand study how socio-demographics impact the mobility-based social networks.
                   Building on a comprehensive definition of urban resilience and through a case study
                of Boston, this study focuses on inter-neighborhood mobility structure and its relation-
                ship with socioeconomic characteristics of residents to better understand the weak-
                nesses, strengths, and segregation patterns of the mobility network of the city. The
                rationale of the study is that humans are inevitably and continuously an integral part of
                many networks. Researchers have applied a variety of approaches to gather and process
                large quantities of data to systematically model the networks around us and capture the
                dynamic nature of real-world networks (Vespignani 2012). The diverse use of concepts,
                tools, and methods from network science in many fields and the interdependent nature
                of the systems of study, make it a remarkably suitable instrument to study mobility net-
                works. Understanding the underlying characteristics of such network are vital in miti-
                gating the negative impacts of hazards and improving urban resilience.
                   The rest of the article is organized in the following orders. In Section 2, we provide a
                brief review of research background in related areas. We discuss the importance of mobil-
                ity for social resilience in urban areas and we review the literature on urban mobility and
                discuss the differences between urban mobility systems and urban transportation systems.
                The clarification of the differences serves as the foundation to discuss the differences in
                resilience studies of the two systems. The last part of the Section 2 explains motifs and
                their role in mobility network studies. In Section 3, we introduce both the data and the
                network analysis methods and measures used in this study. Then it is followed by Section
                4 to present the results from our analysis. We present our discovery of the network struc-
                tures and social characteristics of network communities hidden in the mobility network in
                Boston. Also, we discuss the motifs in these network communities. The paper ends with
                an acknowledge of certain limitations (Section 5) and our conclusions (Section 6).

                Background
                Urban resilience
                Urban areas are a combination of ecological, technical, and social systems. Ecological
                or technological approaches to enhance resilience of urban areas will fail without the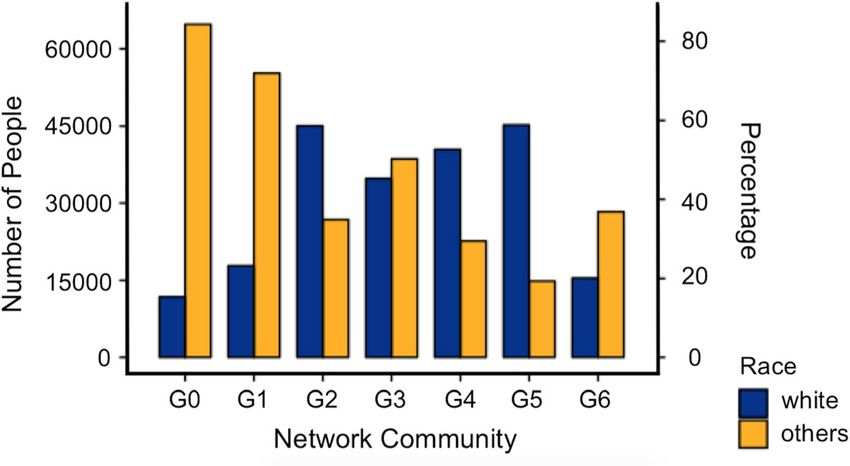
Mirzaee and Wang Applied Network Science   (2020) 5:75                                                          Page 3 of 20

                third social consideration (Grimm et al. 2008). Urban systems are not merely aggrega-
                tion of people and technology, rather they are hybrid systems and entangled entities
                that should be looked at as an adaptive whole (Amir and Kant 2018). Although urban
                resilience is still a vague concept that often-times lacks operationalizability, recent defi-
                nitions of urban resilience agree on the interdependency of urban systems (e.g. Coaffee
                2008; Paton and Johnston 2001). In this study, we define urban resilience as:

                   the ability of an urban system, its social units (such as individuals, communities,
                   institutions, governments, etc.), and its technical units (urban infrastructure) to
                   recover from hazards while maintaining functional continuity of their substituents
                   and as a whole, and mitigating negative impacts of future hazards through practice
                   of resilience planning.

                  Building on this definition, this study focuses on social aspect of urban resilience and
                concentrates on affected neighborhoods and demographics in cases of disruption to
                better understand the weaknesses, strengths, and the level of functional continuity of
                mobility network of Boston. Understanding the underlying characteristics of mobility
                networks are vital in mitigating the negative impacts of hazards and improving urban
                resilience.

                Mobility and social resilience
                Urban areas consist of many interconnected and interdependent systems. These sys-
                tems include the urban ecology, urban infrastructure, social networks, governance net-
                works, and others. Enhancing urban resilience requires understanding these systems
                and improving upon them individually and collectively. The social aspect of urban re-
                silience requires social integration of people with different races and income levels
                (Fonseca et al. 2019). Social integration stands at the opposite of social segregation; the
                former benefits social resilience and the latter hinders it.
                   Social segregation limits housing opportunities and has serious detrimental impact
                on educational outcomes (Condron et al. 2013), it creates concentrated poverty
                (Massey and Fischer 2006) and crime (Peterson and Krivo 2010). On the other hand,
                social integration creates greater solidarity and trust (Angell 1947), improves longevity
                and well-being in communities (Moen et al. 1989), benefits social mobility (Peach
                2005), helps communities to be resilient to perturbations (Folke et al. 2010), and
                provides access to coping mechanisms (Ramirez-Valles et al. 2010) as well as low-
                ering conflict and crime (Crutchfield et al. 1982). Social segregation disproportion-
                ately affects socially disadvantaged and underrepresented groups, whose struggles
                are further exacerbated by lack of urban policy coordination, disproportionate in-
                frastructural investments (Lucas and Porter 2016, Rode et al. 2018). While the resi-
                dential and neighborhood segregation remain important, urban social segregation
                needs to be understood and inspected in dynamics of everyday life such as social
                networks and mobility (Wissink et al. 2016). Studies of transportation infrastruc-
                ture have revealed inequalities in mobility opportunities (Elliott and Urry 2010).
                Thus, many studies focused on “mobility related social exclusion” (e.g. Schwanen
                et al. 2015, Lucas 2012).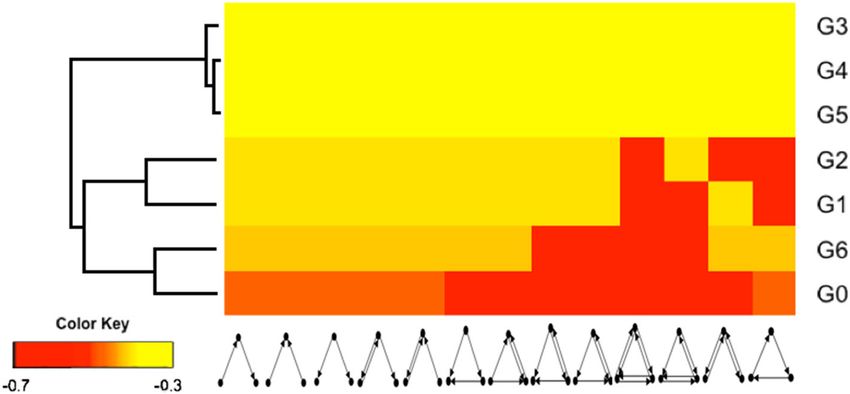
Mirzaee and Wang Applied Network Science   (2020) 5:75                                                        Page 4 of 20

                  To improve social resilience in urban areas it is vital to understand the level of social
                segregation in a city. Social segregation has two aspects: a well-studies spatial aspect
                known as residential segregation, and segregation on a dynamic level (Erbe 1975) that
                has not been extensively studied mostly due to lack of available data that captures mo-
                bility on spatial and temporal scale. The technological advancements of the last decade
                now present researchers with unprecedented data that can be used to innovatively
                study urban dynamics, one of such is social media data (e.g. Shelton et al. 2015,
                Gabrielli et al. 2013). The availability of data presents a vast array of opportunity for
                urban researchers to reveal hidden inequities of mobility patterns in urban area. Section
                2.3 summarizes the relevant literature on urban mobility. Urban mobility can reveal in-
                sights into the dynamic segregation or perhaps the dynamic integration of an urban
                area. Dynamic segregation here goes beyond spatial segregation and refers to social seg-
                regation in everyday interactions. Dynamic integration on the other hand refers to so-
                cially diverse interactions that are not bounded by spatial constraints. This study builds
                a mobility network of Boston using Twitter data and investigates the racial and income
                segregation of the network.

                Urban mobility
                In recent years urban mobility studies have taken advantage of the field of network sci-
                ence to advance the field. Urban mobility networks are geospatial networks in which
                each node has a two-dimensional location property that can be used to place the node
                on a plane, such as a map. If the network can be placed on a map in a way that its
                edges do not intersect, then the network is considered planar (Barthélemy 2011). Al-
                though many spatial networks, such as an individual’s travel pattern or roads networks
                are planar (e.g. Masucci et al. 2013), not all spatial networks depict a planar network
                (Barthélemy 2011). The network of this study is a non-planar network that is an aggre-
                gation of planar individuals’ mobility networks.
                   One property of many geospatial networks is spatial embeddedness. A spatially em-
                bedded network suggests that nodes that are in spatial proximity of each other have a
                higher chance of being connected to each other and the connection probability of two
                nodes decay with increase of distance (Bullock et al. 2010). The Spatial embeddedness
                is mostly used in generating random graphs and the objectives are mostly mathematical
                to understand influence that geometric distances have on the merely topological con-
                nections (Picciolo et al. 2012). However, in real world networks, the relationship be-
                tween two nodes cannot be determined merely by the spatial organization of its nodes
                and shared affinities and community structures can have enormous impact on the be-
                havior of the network as well as edge distribution (Bullock et al. 2010). As the network
                of this study is based on actual individuals’ location, this study does not look into
                spatially embedding the network to avoid suppressing the actual patterns that exists in
                the network.
                   Human travel patterns have been of interest to many scholars. There have been sev-
                eral studies on general mobility patterns confirming that human travel patterns follow
                a mathematically described two-parameter continuous-time random walk model, a
                power-law distribution (e.g., Brockmann et al. 2006; Gonzalez et al. 2008; Song et al.
                2010a, b). Such studies focus on travel patterns during normal circumstances when
Mirzaee and Wang Applied Network Science (2020) 5:75 Page 5 of 20
there are no instances of disruption. Furthermore, a few studies have focused on under-
standing human mobility before, during, and after natural hazards, which disrupt nor-
mal traveling patterns. For example, one study constructs London’s metro
infrastructure network and identifies the points of vulnerability to understand their im-
plications on the system’s resilience (Chopra et al. 2016). Wang and Taylor (2015) con-
ducted a study that focuses on the significance of human mobility disruption during
tropical typhoons to help with disaster response management. However, when consid-
ering resilience, the literature is focused on understanding the role of mobility patterns
on infrastructural resilience of urban areas, ignoring the social aspect of such networks.
Social resilience and diversity play a vital role in urban resilience as social exclusion is a
consequence of the lack of resilience in spatial fragmentation processes (Cumming
2011). Geography is coupled with human interaction and is a key feature for context-
ualizing social relationships (Toole et al. 2015). Puura et al. (2018) used mobile phone
call detail record (CDR) data to infer social relations as well as individual mobility and
found out that the more extensive and individual’s network of calling partners, the
more mobile they are highlighting the role of human interaction in mobility. Lack
of social resilience will affect excluded groups in many ways among which is the
lack of coping mechanisms in cases of physical and socio-economic disruptions
(Chaves et al. 2008).
On the other hand, the study of social networks has gained prominent attention from
a different range of disciplines as well (e.g. Watts 2004; Easley and Kleinberg 2010).
However, they are mainly focused on the social dimension, leaving out the interac-
tions between humans and the physical space (Wang et al. 2011). Recently, re-
searchers have started to treat urban mobility as urban geosocial networks and
analyze their unique properties using approaches from network science. Phillips
et al. (2019) used geocoded twitter data for 50 large US cities to develop a “struc-
tural connectedness” measure that is based on everyday travel patterns of people
from different neighborhoods in a city and identifies whether people from different
neighborhoods travel to all other neighborhoods in equal proportion. They uncover
valuable information such as neighborhoods that act as hubs, lack of mobility be-
tween some neighborhoods, and the relationship between mobility and structural
connectedness. In light of the new development, the aim of this study is to exam-
ine the network structure of the mobility in Boston as a case study to better
understand the underlying characteristics of mobility networks on urban resilience
from a social perspective.
Urban mobility resilience vs. transportation system resilience
While urban mobility and transportation systems deeply integrate and are often-times
coupled with one another, they are different in essence and thus regard different resili-
ence features. The studies on the resilience of mobility networks, especially with a focus
on social aspects, requires different methodologies and tools from the ones on trans-
portation systems. We distinguish transportation and mobility in this paper as follows:
the static set of mediums by which humans move are referred to as transportation, and
the movement itself is mobility. Transportation is the infrastructures that are largely in
place, whereas mobility is not limited to them.Mirzaee and Wang Applied Network Science (2020) 5:75 Page 6 of 20
Transportation resilience is looked upon from engineering and infrastructure per-
spectives and is referred to as the ability of the system to maintain its demon-
strated level of service or restore itself to that level in a timely manner (Freckleton
et al. 2012). Minimizing operational loss is another concern of transportation resili-
ence (Pant 2012).
Although there have been numerous studies on resilience from different perspectives,
there are few studies that focus on urban mobility resilience. Cutter et al. (2008) looks
at mobility as a social system interacting with a defined geographical space and refers
to resilience as the system’s capacity to absorb disturbance and return to a fully func-
tional state that advances the state of the system through learning (Adger et al. 2005;
Klein et al. 2003). Fernandes (2017) refers to the resilience of urban mobility as “cap-
acity to persist, ability to adapt, and the potential to transform the city when confronted
with a threat.” Wiles et al. (2012) study resilience concepts in the gerontology field and
express that mobility resilience “might refer to an individual’s personal mobility in
terms of whether they are able to walk, whether they have a car, or whether they are
physically fit, but also to broader environmental elements of mobility, such as whether
there is an accessible high-quality public transport system or other forms of collective
transport, whether a neighborhood has high ‘walkability’, or what road conditions are
like and the degree to which a person feels safe to use them”.
The lack of research on mobility resilience motivated this study to develop a defin-
ition that can serve as a basis of this research. For this purpose, this study looks at
urban mobility in terms of one of many interconnected urban systems acknowledging
that urban mobility should be looked at as a system that involves the interactions of
humans with their surrounding built and ecological environment (Vermaas et al. 2011;
Clegg 2000).
Disruption in mobility networks vs. disruption in transportation networks
One of the studied ways of improving the resilience state of a transportation network is
through robust system architecture and introducing redundancy (Li 2016). In transpor-
tation networks, nodes are places and edges are the infrastructural means that connect
the two nodes, such as railroads and streets. Having more than one path between two
nodes in the network can reduce the chance of disconnection of the two nodes, al-
though tightly coupled networks can be more vulnerable due to faster spread of failure
(Vespignani 2010). Removal of a node in a transportation network –such as disruption
in a train station– is another challenge that can be overcome by reaching to the destin-
ation by another mode of transportation or taking another path to a neighboring node.
Studies on mobility networks, on the contrary, usually conceptualize the nodes and
edges differently from the ones on transportation networks. For example, in Phillips
et al. (2019), nodes are origin and destination block groups –such as home and work
locations– and edges are people who travel between two nodes regularly. Removal of a
node means economic or social disruption for people who travel on the edges con-
nected to that node. For example, natural disasters such as flooding, or man-made at-
tacks to the area can permanently or temporarily remove a node from the network;
meaning residents who depend on the removed nodes for work (or residence) will not
be able to access their destination (or origin). Thus they suffer from economic andMirzaee and Wang Applied Network Science (2020) 5:75 Page 7 of 20
social consequences. This study follows a similar way to build the mobility network in
Boston.
Motifs in mobility networks
Motifs are recurring patterns of connections within a network and can represent broad
ranges of phenomena (Milo et al. 2002). The abundance of triadic motifs in networks is
significantly correlated with stability or robustness of the network against perturbation
(Scherrer et al. 2008). It is expected that human social networks have highly connected
motifs to maximize information flow as opposed to, for example, a hierarchical military
network that information flow occurs only in one direction (Krause et al. 2007). Schnei-
der et al. (2013a) studied the motifs of individuals’ mobility patterns in Paris using mo-
bile phone call detail record (CDR) and found out that only 17 unique motifs explain
90% of mobility patterns. Jiang et al. (2017) used a similar approach using CDR data to
study the motifs of human mobility in Singapore and suggested using such patterns to
improve urban and resource planning.
These studies have focused on individuals’ mobility patterns and the resulting motifs.
In this study the network is an aggregated mobility network of all the individuals in the
data. Thus, the meanings behind motifs differ from the ones of individuals’ movements.
In a directed network there are sixteen different motifs with three nodes (they are listed
in Table 3). Table 1 represents example of situations in which a certain network motif
is abundant.
Methodology and data
Data
In numerous occasions, complete enumeration of data to create and analyze a real-
world network is not possible. The incompleteness of data is especially true in networks
that involve human mobility. However, with the popular use of smartphones and new
information technologies, the availability of geocoded data is helping to resolve this
problem, although not yet to the fullest. For example, a study used geocoded data from
public shared photos on Flicker to study individuals’ mobility patterns (Barchiesi et al.
2015). Another study used geocoded twitter data to investigate the “structural connect-
edness” of US cities based on everyday mobility patterns of residents (Phillips et al.
2019). The use of geocoded social media data has become very popular in urban re-
search domain, including urban activities and environmental studies (Heikinheimo
et al. 2020). A study found Twitter users to be representative of general demographics
of U.S. population (Wang and Taylor 2016). Although survey-based intra-urban
Table 1 Examples of abundance of certan motif types in a mobility network
Motif
Examples Many nodes of the network are The destination node in this There is a richness of mobility
of not connected to each other. motif is socially and happening between different
abundance The structure means there is a economically accommodating parts of the network. The
lack of economic and social other nodes. connectivity allows social and
mobility, and thus the nodes It allows for knowledge sharing economic upward mobility. The
are more vulnerable to between all the nodes in the structure can also be resilient
economic or social motif. The origin nodes are to economic or social
disturbances. highly dependent on the disturbances.
destination node.Mirzaee and Wang Applied Network Science (2020) 5:75 Page 8 of 20
mobility data is available for many cities, such data sources most often are not available
on geographically small resolution and they lack enough detail for arriving at empirical
insights (Heikinheimo et al. 2020). Twitter data has also the added potential of captur-
ing locations other than home and work locations that are on individuals’ regular travel
patterns.
The use of Twitter data in understanding mobility in recent years has been prevalent,
as the location-sharing technology has made it possible for researchers to take advan-
tage of exceptional access to direct records of human activities in urban areas (Hawelka
et al. 2014). Hawelka and his colleagues used almost a billion tweets to map the mobil-
ity profiles of different nations and later validated their findings using global tourism
statistics and concluded that Twitter is exceptionally useful for understanding and
quantifying mobility patterns (Hawelka et al. 2014). Jurdak et al. (2015) analyzed six
million geo-coded tweets in Australia and demonstrated that Twitter could be a reliable
source for studying human mobility patterns.
This study uses geotagged twitter data from October 2013 to March 2015. Each entry
of a geotagged tweet contains the complete information of that micro-message includ-
ing the user ID, tweet ID, time stamp, latitude, and longitude. The data is then aggre-
gated to the block group defined by the U.S. Census. A user has to tweet from a
specific block group 5 times or more to assume that the block group is in his/her rou-
tine travel trajectory. The final data consists of 25,585 data points. Origin and destina-
tions have been inferred from the time of the tweets. If the user tweets any time
between 8 pm and 8 am, the location is treated as the origin. The location is treated as
destination if the tweet’s timestamp is within the time range of 8 am to 8 pm. Using the
timestamps to assess origin and destination is a common assumption among similar
studies (e.g. Rashidi et al. 2017; Gao et al. 2014). Moreover, we used time stamps to
count the number of tweets by each user from each block group that are at least 12 h
apart from each other. For example, if a user tweets 10 times from the same block
group between 6 pm and 6 am the next day, this is counted as one occurrence and it is
most likely their home location. We look for at least 12 h intervals as a proxy for the
timespan that most people spend at home and avoid counting home locations multiple
times a day that would create self-loops. In certain hours of a day social media activity
peaks (Toivonen et al. 2019) and multiple tweets by a user can produce incorrect data.
In the final network of the study 62% of the users only travel between two nodes, while
31% have three nodes on their regular mobility pattern, and only 7% have four or more
nodes (block groups) on their regular travel. The average separation degree for all the
users is 1.38.
A block group defined by the Census Bureau is a combination of census blocks that
are collectively a subdivision of a census tract. On average there are 39 census blocks
in a block group. A block is the smallest geographic entity for which tabular sample
data is published by the decennial census (United States. Bureau of the Census 1994).
Despite availability of data on a census block scale, this study uses block groups as
nodes of the network and aggregates users’ data to a block group basis to ensure ethical
use of data and unfeasibility of identifying any individual based on their mobility
pattern.
After cleaning the dataset, a network of mobility among the block groups is formed.
In this network each node is a block group and each weighted edge represents theMirzaee and Wang Applied Network Science (2020) 5:75 Page 9 of 20
number of individuals that regularly travel between the two nodes. For this study, we
excluded edges with their weights less than 10 which are the edges with fewer than 10
people traveling between a dyad of two block groups. We removed these edges so the
network only focuses on more regular travel patterns. The removed edges represented
45% of the total number of edges but only 8% of the total weight of the network. In the
final network there are 417 nodes and 2321 edges. There is a total of 610 block groups
in Boston and the network of this study represents 68.3% of them. The distribution of
the nodes covers all neighborhoods of Boston. To investigate representativeness of our
data, we investigated the relationship between the population of block groups and
number of users in each block group and found a linear statistically significant relation-
ship between population and number of users with p-value of less than 0.05 and R-
squared of 0.69. This finding underlines that the data is representative of the size of the
population. However, there could still be bias in data in terms of racial representation.
Since the data covers all neighborhoods of Boston, including majority non-white neigh-
borhoods and on the basis of previously-discussed representativeness of Twitter data,
we assume that this network is representative of the population in Boston in terms of
size, race, and income.
The socio-economic characteristics –such as income level and race– of each block
group are attached to each node as the node attributes to understand the underlying
socio-economic characteristics of the mobility network. This data is obtained from the
US Census Bureau.
Network measures
The following network measures are used in this study:
Each node is a block group. Section 3.1 contains more explanation on nodes of the
network.
Weighted edges are the number of people traveling between two nodes. Wij is the
weight of the edge going from node i to node j.
Density (q) is a redundancy measure for the whole network that shows the fraction
between the total number of links (m) and the maximum possible number of links (
nðn − 1Þ
2 ).
2m
q¼
n ðn − 1Þ
Node connectivity is the minimum number of nodes that needs to be removed for
the network to be disconnected.
Network motifs are recurring patterns of connections in a network.
Network communities are locally dense subgraphs of the network that are formed in
real-world networks (Yang and Leskovec 2015).
Network communities
The communities of this network are detected using Louvain modularity algorithm.
Each community is a combination of nodes which are more likely to be connected to
each other rather than to nodes from outside of their community. In the context of a
mobility network, people who live in the same network community are more likely toMirzaee and Wang Applied Network Science (2020) 5:75 Page 10 of 20
mobilize within their own network community. We would like to emphasize that a net-
work community is merely characterized by modularity which uses edge weights and
distribution of the weights among different nodes as features. The network community
concept is not influenced by geographical neighborhoods or and should not be con-
fused with social and geographical communities.
Modularity in a network is a measure to assess the network community structure.
Modularity is based on the edge connectedness in the communities where the nodes in
the same community are more likely to connect to each other rather than to nodes
from different communities. Thus, a community is a locally relatively dense subgraph
of the network. The optimal community structure happens when the modularity of the
network is maximized. Modularity for the whole network can be calculated through the
following equation (Barabási 2016):
" #
Xnc Lc k c 2
M¼ −
c¼1 L 2L
Where L is the total weights of all the links in the network, Lc is the total weights of
all the links within the community C and kc is the total degree in that community. The
community structure in this study is detected using the Louvain algorithm (Blondel
et al. 2008). This algorithm, starts with each node as a separate community and calcu-
lated modularity for the while network. At each iteration the algorithm merges two
communities and recalculates modularity. If the modularity had increased, the algo-
rithm keeps the nodes in the same community and repeats this process. If the modular-
ity had decreased, the algorithm removes the node from the last step from the
community. The model iterates over these steps many times until it arrives at the high-
est modularity score, at which point moving one node from a community to another
will only decrease modularity. The complexity of this model and the number of itera-
tions increases as nlog2n with increase in n as number of nodes (Lancichinetti and For-
tunato 2009).
Motif detection
The motifs of this network have been identified using Cytoscape, and opensource plat-
form for complex network analysis (Shannon et al. 2003). To understand the level of
abundance of a certain motif, z-scores are used. Z-scores are defined as the difference
in the frequency of the motif and its mean frequency in a set of sufficiently large ran-
domized networks divided by the standard deviation of frequency values in the ran-
domized network (Milo et al. 2002). In simpler words, the number of appearances of a
certain motif in a network is compared to the number of its appearances in a random
network of the same size. In this study each motif type in a community is compared to
a set of 10,000 randomized networks with degree preservation to arrive at the Z-scores.
Z-scores are then normalized to enable comparison of their significance across different
communities with different sizes and are defined as (Ma et al. 2008):
Zi
N i ¼ P qffiffiffiffiffiffi
Z 2iMirzaee and Wang Applied Network Science (2020) 5:75 Page 11 of 20
The normalized z-scores of each motif along with more discussions are presented in
section 4.4.
Results
Mobility communities
The outcome of Louvain modularity algorithm divides the nodes into 21 different com-
munities, with some of the communities consisting of less than 5 nodes. This study
only focuses on the 7 major detected communities. A network community represents a
subset of nodes that are densely connected to each other and a node is more probable
to be connected to another node in the same community compared to nodes outside of
the community. In the context of this mobility network, traveling within each commu-
nity is more probable than traveling outside of the community. Each node (block
group) in the network has sociodemographic attributes such as percentage of white
population, percentage of non-white population, median income, and educational at-
tainments. These attributes are used to uncover social unbalances in this network. Fig-
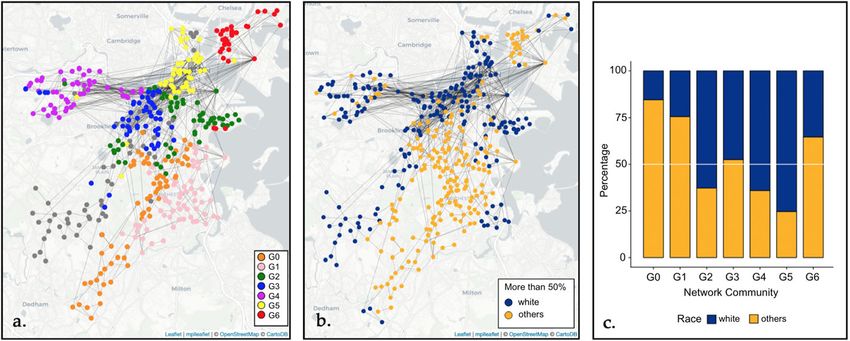
ure 1a highlights the 7 biggest network communities in different colors. Mobility is
more probable between nodes that are in the same community. G0 in orange includes
64 nodes, G1 in pink includes 60 nodes, G2 includes 57 nodes in green, G3 includes 54
nodes in blue, G4 includes 51 nodes in purple, and G5 and G6 include 50 yellow and
30 red nodes respectively. Although the network communities only follow network
structural measures such as modularity, the nodes in each community are also geo-
graphically clustered. Figure 1b shows nodes that more than 50% of their population
are either white or other races. Figure 1a and b share some resemblance in the segrega-
tion patterns. The percentage of white population versus other races in each commu-
nity is shown in Fig. 1c. Figure 2 shows the distribution of white and non-white
population of Boston among different communities with the number of people on the
left vertical axis and the percentage on the right axis. Other than G3, the six other mo-
bility communities are not racially balanced, indicating that it is more probable that mi-
norities and whites travel within themselves. This social mobility segregation is not
present in G3 where the whites and other races are more in balance with one another.
Fig. 1 a shows the community structure of the network based on modularity, detected via the Louvain
algorithm. b shows the nodes with more than 50% white vs. nodes with more than 50% minorities. c
shows the percentage of white vs. other races in each communityMirzaee and Wang Applied Network Science (2020) 5:75 Page 12 of 20
Fig. 2 The distribution of white and non-white population of Boston among different communities
There are three points that are worth mentioning here:
1. The mobility communities are spatially governed. Even with the current influence
of technology on our everyday lives, geography is still very much valid. Although
information technology shrinks time and space in many ways, the geographic space
still plays a significant role in social phenomena (Sheldon 2014). The findings align
with the ones from previous research. For example, Wang et al. (2018) found that
although marginalized residents travel longer distances on a daily basis, they are
also less likely to travel to non-poor white neighborhoods. Phillips et al. (2019)
have also shown that spatial social segregation affects the connectedness of the
neighborhoods and limits travels between two neighborhoods with different socio-
economic status.
2. We also observe that the composition of G3 community suggests a high level of
social cohesion –social cohesion is the extent of connectedness among groups in
society (Kawachi and Berkman 2000). We hypothesize that the spatial placement of
this network community and its nodes (block groups) to numerous diverse services
play a key role in this phenomenon. For example, the nodes in G3 are clustered
around boundaries of neighborhoods such as Back Bay (a hub for financial and
leisure activities in Boston), Longwood (a hub for medical services and sciences),
Northeastern University, and Boston University. The diversity of people who travel
to these educational, medical, and leisure hubs create a diverse mobility
community. The drivers of such social cohesion observed in the mobility network
deserve further investigation.
3. Communities such as G0, G1, and G5 are more segregated than other
communities. G0 and G1 are majority poor black suburban neighborhoods of
Boston, including Dorchester, Mattapan, Roxbury, and Dudley Square
neighborhoods, which all have locally low median housing values and median
household income (Compared to other neighborhoods of Boston). G5 includes
non-poor white areas of the city, including downtown, financial district, Charles-
town, and Beacon Hill areas. These neighborhoods have some of the highest me-
dian household incomes and median housing values in the city of Boston. There
can be numerous factors in play other than income and housing values, such asMirzaee and Wang Applied Network Science (2020) 5:75 Page 13 of 20
accessibility to public transportation, or availability of job opportunities, which will
be the focus of future work.
Other characteristics of the network communities
Sociodemographic attributes of each node (block group) other than race, which was
discussed in section 4.1 is used to uncover inequities of this network. These features
along with some other main network properties of the communities are presented in
Table 2. Community G3 which is racially more balanced than other communities (ratio
of white to non-white population is close to 1), has the highest density, indicating that
the subgraph is more well-connected within itself compared to others, a fact that is also
reflected in its highest average degree. It has the highest node connectivity among the
seven communities, meaning that 6 nodes need to be removed to fragment the sub-
graph into two parts. Again, majorly white communities have more network structural
advantages, such as higher density and node connectivity, and support community re-
silience to a higher degree than communities with more minority population. For ex-
ample, G0 is a majority white community with a white to non-white ration of 3. It has
considerably higher median income and higher percentage of college-educated popula-
tion. It has the second highest average node degree and node connectivity which allows
the community to be more resilient to perturbations. On the other hand, communities
such as G0 or G1 which high percentage of non-white population and low median in-
come, have considerably lower network densities and average node degrees, both indi-
cators of not well-connected communities. Their node connectivity is 1, meaning by
just removing 1 node the community can become disconnected. Such communities are
vulnerable to perturbations.
Multinomial regression
We performed multinomial regression analysis in which the network communities are
captured in a multinomial dependent variable with 7 categories. The independent vari-
ables are socioeconomic characteristics of the nodes including, percentage of white
population, percentage of black population, percentage of other races, and median
household income. Multinomial regression, a type of logit regression is used to find
causality between a categorical independent variable with two or more categories, and a
group of dependent variables.
Table 2 Other characteristics of the network communities
G0 G1 G2 G3 G4 G5 G6
Network Measures
Density 0.014 0.022 0.028 0.078 0.056 0.064 0.067
Node connectivity 1 1 3 6 4 2 2
Average node degree 2.193 2.879 4.8 10.642 7.098 9.282 4.967
Highest node degree 7 13 55 43 28 47 37
Socio-economic characteristics
Median household income (USD) 20,126 22,286 52,645 20,629 29,274 71,017 25,642
Percentage college educated 18.11 24.99 50.06 44.81 59.80 63.00 24.67
White to non-white ratio 0.219 0.351 1.857 0.923 2.125 3 0.562Mirzaee and Wang Applied Network Science (2020) 5:75 Page 14 of 20
There are 366 nodes in the network communities. We randomly chose 183 nodes
which will account for 50% of the network communities as the input to train our
model. Then we used the other half of the network as a test dataset. Because the num-
ber of observations in our dataset is small (366 data points in total) we chose a 50–50
train and test split in order to have a big-enough test set to allow for meaningful accur-
acy discussion. The regression model achieved 63.4% accuracy. Figure 3 is the confu-
sion matrix of the model that shows the number of nodes that have been placed
correctly on the right communities using the regression model on the diagonal cells.
This result indicates that more than 60% of the dynamic segregation that is present in
Boston’s mobility network can be explained by the spatial racial and income segrega-
tion of the city.
Network motifs
Table 3 presents the number of different triadic motifs in the identified network com-
munities. Communities G0 through G6 have 64, 58, 58, 59, 60, 59, and 42 nodes re-
spectively. Because of the closeness of the community sizes it is therefore possible to
compare the number of motif occurrences in the communities, which are presented in
Table 3. However, Z-score for each motif in different networks was obtained as a meas-
ure of statistical significance, which is the basis for the heatmap in Fig. 3.
Figure 4 represents a heatmap of the significance of different motif type in each com-
munity. The Z-score and normalized Z-scores of the motifs represented in the heatmap
are all negative, indicating that all motifs have low presence in the network as com-
pared to randomized networks albeit with significant differences. The low presence
could be a result of lack of connectivity or presence of hubs. As shown in Fig. 3, occur-
rences of all motif types especially motifs with more edges– are more significant in
Fig. 3 Confusion matrix resulting from multinomial regression analysis in which the dependent variable is
network communities and the independent variables are percentage of white population, percentage of
black population, percentage of other races, and median household incomeMirzaee and Wang Applied Network Science (2020) 5:75 Page 15 of 20
Table 3 Number of appearances of each triadic motif in identified network communities
Code Motif G0 G1 G2 G3 G4 G5 G6
003 38,439 30,686 25,273 17,434 15,980 14,223 2728
012 3047 2883 3373 4494 3150 3663 1082
102 118 539 329 1874 1153 1009 55
021D 16 25 31 99 47 77 42
021 U 17 23 143 127 113 166 72
021C 20 20 46 145 78 109 42
111D 3 16 32 212 132 125 19
111 U 3 19 15 157 45 94 6
030 T 0 4 10 48 14 27 10
030C 1 0 0 1 1 1 1
201 0 1 0 54 26 24 1
120D 0 1 4 42 19 25 2
120 U 0 1 2 33 21 16 0
120C 0 2 1 18 8 13 0
210 0 0 1 42 25 22 0
300 0 0 0 24 13 6 0
communities G3, G4, and G5, while communities G1, G2, and G6 mostly have less
firmly connected triads, and community G0 has the least number of every triadic motif
type. However, Table 3 shows that the number of unconnected triple nodes –motif
code 003– in communities G0 and G1 is significantly higher than other communities.
The nodes in unconnected triads are not isolated nodes and they are connected to
other nodes in (and in some cases out of) their community. However, the significant
presence of unconnected triads shows the community is not very well connected and
thus vulnerable to perturbations.
Moreover, communities with the least dense triads G0, G1, and G6 are the communi-
ties with a higher percentage of the non-white population. Mobility communities with
a higher percentage of white population –such as G4–and more racially balanced com-
munities –such as G3– tend to have a more significant presence of highly connected
triadic motifs. Densely connected triadic motifs facilitate community and social
Fig. 4 Heatmap of normalized Z-scores of different triadic motif types in different mobility communitiesMirzaee and Wang Applied Network Science (2020) 5:75 Page 16 of 20
resilience through knowledge sharing and interactions beyond cultural and economic
boundaries.
Bigger motifs
The highest frequency motifs of degree 4, 5 and 6 in the entire network and seven
major communities are shown in Table 4. Each motif’s frequency is listed beneath it.
There are a few major observations here worth mentioning. First, all motifs are low in
density indicating that major parts of the network have low densities despite the pres-
ence of some locally dense subgraphs.
Secondly, the frequent motifs in G2 and G3, and to a lesser degree G4 are very simi-
lar to the frequent motifs of the entire network, showing the domination of these three
communities in shaping the patterns of connection in the entire network.
Thirdly, the patterns of the frequent motifs in G0 and G1 significantly differ from
other communities. In G0 and G1 the flows tend to disperse from one node to others
whereas in other communities and more specifically G2, G3, and G5 flows merge and
meet in one node. This fact is an indication of fewer local attractions in G0 and G1
such as financial districts that can supply the job demands of the community. G2, G3
and G5, which have more attractive central nodes, are located in areas that are medical
or education or financial hubs in Boston area.
G4 is the only community with reciprocated flows, also known as bi-flows (two-direc-
tional flows) in the most frequent motifs. Bi-flows are strong features in a mobility
community as they show the co-independence of neighborhoods on one another and
can improve socio-economic resilience of the community. G4 is the Allston neighbor-
hood of Boston, which includes parts of Boston University as an educational hub, many
restaurants and bars as leisure hubs, and is home to socio-demographically diverse
residents.
Finally, G6 is the East Boston neighborhood, which includes Boston Logan Inter-
national Airport. The majority Hispanic population of East Boston has created a very
locally dense subgraph, which has a higher density than any other non-white commu-
nity in the network.
Limitations and future research
Although using geocoded social media data in research is becoming increasingly popu-
lar (e.g. Matamalas et al. 2016; Achrekar et al. 2011; Tremayne 2014; Grandjean 2016),
the use of twitter data encompasses limitations. While researchers have explored the
representativeness of Twitter data (Mislove et al. 2011; Wang and Taylor 2015), the
Table 4 Most frequent motifs of sizes 4, 5 and 6 in the network and its communities
Entire Network G0 G1 G2 G3 G4 G5 G6
Frequency 1354 205 41 352 355 215 327 202
Frequency 1894 549 27 692 668 409 669 329
Frequency 3012 1216 29 1684 1128 484 1114 381Mirzaee and Wang Applied Network Science (2020) 5:75 Page 17 of 20
geotagged Twitter data might not be representative of the whole demographics. How-
ever, this study serves as a mandatory basis of advancing the field. Future research
should compare results from this study to the ones derived from other data sets. Also,
although we limit our analysis to frequent visits, there could be bias in the visits re-
ported in geotagged Twitter data which could impact the structure of the mobility net-
works in Boston. Moreover, our analysis on urban resilience has been focusing on
mobility network while other aspects of the system introduced in section 1.2. deserve
future investigations. Moreover, in the study of motifs, the presence or absence of
highly connected motifs can be an indicator of imbalance in resource distribution such
as job opportunities. Our future efforts will focus on investigating the underlying shap-
ing factors of such imbalance.
Conclusion
Studying the resilience of urban areas is not a trivial task but can be achieved through
studying urban systems. This study focuses on social resilience aspect of Boston’s urban
mobility network. This study builds the aggregated mobility network of Boston as one
of the urban systems that lie within the intersection of many disciplines. The essence of
such a network is to investigate the interactions between different parts of the city with
a block-group resolution. The resulting network illustrates that the spatial social segre-
gation in Boston is also present in the network community structures where six out of
seven main mobility communities in the network are racially and economically segre-
gated, indicating that racial minorities and lower-income demographics are more likely
to move within themselves rather than interacting beyond the economic and racial
boundaries. The results of this study align with findings of Dannemann et al. (2018)
where they used cell phone data to uncover dynamic social segregation in Santiago,
Chile. The result of the multinomial regression model indicates that spatial racial and
income segregation in Boston can be used to explain 63% of the segregation in mobility
network communities. Moreover, the study of motifs of the network communities
shows dissimilar patterns of interaction in different communities. The analysis of tri-
adic motifs shows that minority dominated communities lack well-connected triads.
Thus, the interactions between nodes in those communities are weaker than the white
dominated communities in which the abundance of denser triads are more significant.
Moreover, in minority dominated network communities the study of higher degree mo-
tifs reveals common dispersal patterns where people regularly tend to scatter to differ-
ent parts. However, in majorly white communities there are more nodes that attract
flows. In those communities, people tend to gather in a central node. This finding can
potentially be an indicator of the difference in economic opportunities available to dif-
ferent communities. The only racially balanced network community (G3) has the most
significant presence of dense triadic motifs and reflects strong interaction between
nodes that can possibly help improve community, social, and economic resilience.
Overall, the findings of this study stress the imbalance in social resilience that is hap-
pening through mobility. Dynamic racial segregation, such as the ones shown in this
study, can limit the ability of people interacting beyond social and economic boundaries
and potentially prohibits upward mobility for minorities.Mirzaee and Wang Applied Network Science (2020) 5:75 Page 18 of 20
Acknowledgements
Not Applicable.
Authors’ contributions
S.M. designed computational framework, analyzed the data, and took the lead on writing the manuscript. Q.W.
acquired the data, interpreted the findings and provided feedback on the manuscript. Both authors contributed
shaping the research and analysis and developing the manuscript. Both authors approve the submitted manuscript.
Funding
This work was supported by National Science Foundation Grant HDBE-1761950; Northeastern Tier 1 Project on “Neigh-
borhood Connectivity and Social Inequality”; and Global Resilience Institute Project on “Geosocial Network Resilience”.
Availability of data and materials
The data that support the findings of this study are openly available at https://github.com/SaharMirzaee/project1/
blob/master/bostondata.csv
Competing interests
The authors declare that they have no competing interests.
Author details
1
Department of Public Policy and Urban Affairs, Northeastern University, Boston, MA 02115, USA. 2Department of Civil
and Environmental Engineering, Northeastern University, Boston, MA 02115, USA.
Received: 8 April 2020 Accepted: 6 September 2020
References
Achrekar H, Gandhe A, Lazarus R, Yu SH, Liu B (2011) Predicting flu trends using twitter data. In 2011 IEEE conference
oncomputer communications workshops (INFOCOM WKSHPS). IEEE, Shanghai, pp. 702–707
Adey P (2010) Aerial life: spaces, mobilities, affects. Wiley-Blackwell, West Sussex
Adger WN, Hughes TP, Folke C, Carpenter SR, Rockström J (2005) Social-ecological resilience to coastal disasters. Science
309(5737):1036–1039
Amir S, Kant V (2018) Sociotechnical resilience: a preliminary concept. Risk Anal 38(1):8–16
Angell RC (1947) The social integration of American cities of more than 100,000 population. Am Sociol Rev 12(3):335–342
Bagrow JP, Wang D, Barabasi A-L (2011) Collective response of human populations to large-scale emergencies. PLoS One 6:
e17680
Barabási A-L (2016) Network science. Cambridge university press, Cambridge
Barchiesi D, Preis T, Bishop S, Moat HS (2015) Modelling human mobility patterns using photographic data shared online. R
Soc Open Sci 2(8):150046
Barthélemy M (2011) Spatial networks. Phys Rep 499(1–3):1–101
Blondel VD, Guillaume JL, Lambiotte R, Lefebvre E (2008) Fast unfolding of communities in large networks. J Stat Mech
Theory Exp 2008(10):P10008
Brockmann D, Hufnagel L, Geisel T (2006) The scaling laws of human travel. Nature 439(7075):462
Bullock S, Barnett L, Di Paolo EA (2010) Spatial embedding and the structure of complex networks. Complexity 16(2):20–28
Candia J, González MC, Wang P, Schoenharl T, Madey G, Barabási A-L (2008) Uncovering individual and collective human
dynamics from mobile phone records. J Phys A Math Theor 41:224015
Chaves LF, Cohen JM, Pascual M, Wilson ML (2008) Social exclusion modifies climate and deforestation impacts on a vector-
borne disease. PLoS Negl Trop Dis 2(2):e176
Cho E, Myers SA, Leskovec J (2011) Friendship and mobility: user movement in location-based social networks. in 1082–1090.
ACM. https://doi.org/10.1145/2020408.2020579
Chopra SS, Dillon T, Bilec MM, Khanna V (2016) A network-based framework for assessing infrastructure resilience: a case
study of the London metro system. J R Soc Interface 13(118):20160113
Clegg CW (2000) Sociotechnical principles for system design. Appl Ergon 31(5):463–477
Coaffee J (2008) Risk, resilience, and environmentally sustainable cities. Energy Policy 36(12):4633–4638
Condron DJ, Tope D, Steidl CR, Freeman KJ (2013) Racial segregation and the black/white achievement gap, 1992 to 2009.
Sociol Q 54(1):130–157
Crutchfield RD, Geerken MR, Gove WR (1982) Crime rate and social integration the impact of metropolitan mobility.
Criminology 20(3–4):467–478
Cumming GS (2011) Spatial resilience: integrating landscape ecology, resilience, and sustainability. Landsc Ecol 26(7):899–909
Cutter SL, Barnes L, Berry M, Burton C, Evans E, Tate E, Webb J (2008) A place-based model for understanding community
resilience to natural disasters. Glob Environ Chang 18(4):598–606
Cuttone A, Lehmann S, González MC (2018) Understanding predictability and exploration in human mobility. EPJ Data
Science 7:1–17
Dannemann T, Sotomayor-Gómez B, Samaniego H (2018) The time geography of segregation during working hours. R Soc
Open Sci 5(10):180749
Easley D, Kleinberg J (2010) Networks, crowds, and markets, vol 8. Cambridge university press, Cambridge
Elliott A, Urry J (2010) Mobile lives. Routledge.
Erbe BM (1975) Race and socioeconomic segregation. Am Sociol Rev 40(6):801–812
Fernandes VA, Rothfuss R, Hochschild V, Silva MAVD, Silva WRD, Steiniger S, Santos TFD (2019) Urban resilience in the face of
fossil fuel dependency: the case of Rio de Janeiro’s urban mobility. urbe. Revista Brasileira de Gestão Urbana pp. 11.You can also read