How to Govern Facebook: A Structural Model for Taxing and Regulating Big Tech - Toulouse School of Economics
←
→
Page content transcription
If your browser does not render page correctly, please read the page content below
How to Govern Facebook:
A Structural Model for Taxing and Regulating Big Tech

                              Seth G. Benzell∗, Avinash Collis†‡
                                            August, 2020

                                                Abstract
           Digital platforms such as Facebook create value by connecting users, vendors, and
       contractors. Their strong supply and demand economies of scale can give them market
       power, and have led to increasing calls for special regulations and taxes. We construct
       and illustrate an approach for structural modeling of digital platforms. The model
       allows for heterogeneity in demand elasticity, disutility from advertising, and network
       effects across users. We paramaterize our model using a survey of over 57,000 US
       internet users on their demand for Facebook’s eponymous application. Facebook cre-
       ates $14 billion in social value per month, with consumer surplus concentrated among
       female and older users of Facebook. The most valuable friendships on Facebook are
       worth in excess of 50 cents per month, but most are worth far less, with connections
       to men more valuable on a per-friend basis. We find that Facebook has too low a level
       of advertising relative to their short-term profit maximizing strategy. Imputing their
       shadow value from maintaining a large user base, we estimate that the welfare lost from
       Facebook’s market power, compared to the first best of a social welfare maximizing
       Facebook, is 9.6% of current social value, or $1.3 Billion per month. We then simulate
       six proposed policies for government management of digital platforms, taking Face-
       book’s optimal response into account. Taxes are mostly incident on Facebook profit
       and properly targeted taxes can even raise consumer surplus. Achieving perfect com-
       petition in social media would raise social surplus from Facebook by 4.8% of current
       value. But a botched regulation that left the US with two smaller, non-competitive
       social media monopolies would decrease social surplus by 84.7%.

   ∗
     Argyros School of Business and Economics, Chapman University & MIT Initiative on the Digital Econ-
omy, sbenzell@mit.edu
   †
     McCombs School of Business, The University of Texas at Austin, avinash.collis@mccombs.utexas.edu
   ‡
     We thank Sinan Aral, Fiona Scott Morton, Erik Brynjolfsson, Dean Eckles, Geoffrey Parker, Xiang
Hui, Zhou Zho, Daniel Rock and Marshall Van Alstyne for their invaluable comments. We thank Andrey
Fradkin and Chris Forman for fantastic discussions. We additionally thank the MIT Initiative on the Digital
Economy for research funding. Our study was determined to be exempt by MIT’s IRB.

                                                    1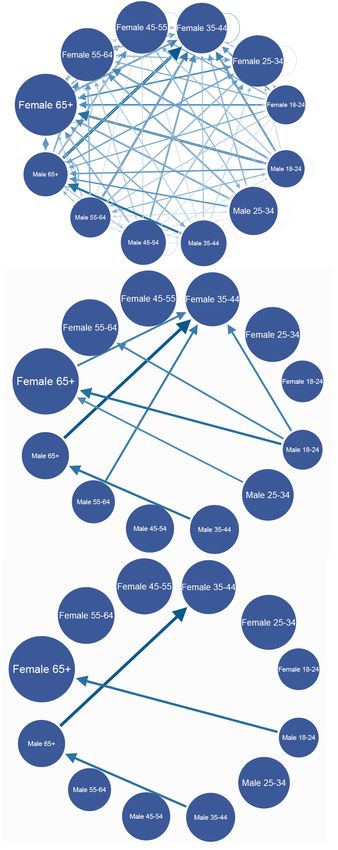
1        Introduction
       Much of the value of digital platform businesses comes from network effects. A network
       effect is an externality that one participant in a digital platform provides to another
       participant. In this paper, we propose and implement a flexible strategy for the mea-
       surement and optimal harnessing of network effects. We then use the model to simulate
       the effect of several proposed or recently implemented digital platform regulations and
       taxes.
           We make three main contributions. First, we provide a tractable framework for
       optimal pricing strategy on multi-sided platforms. This approach builds on traditional
       price discrimination models by taking into account network externalities. Second,
       we implement this model using data we collected on Facebook, introducing a novel
       methodology for the estimation of network effects. Using the calibrated model, we
       provide the first simulations of Facebook revenue, participation, and social surplus
       under counter-factual pricing policies. Finally, we use the model and data to estimate
       the social gains from various proposals by to tax and regulate “Big Tech.”
           Our paper begins by introducing a model of platform participation that allows for
       several dimensions of heterogeneity. Users vary in their opportunity cost for using the
       platform, the value they get from interacting with other types of users on the platform,
       and the disutility they receive from advertising. It is a model of an n-sided platform
       in the sense that each individual or market segment can be thought of as a node of the
       network.1 We show that the optimal pricing strategy for an n-sided platform entails
       decreasing fees or advertising for users who elastically demand the platform (the direct
       effect) and who create high amounts of network value for other profitable users who
       themselves demand the platform elastically (the network effect).
           After introducing and analyzing our model, we proceed to an empirical illustration.
       We collected information on 57,000 US internet users’ demand for Facebook using sur-
       veys and choice experiments conducted through Google Surveys. We categorize the
       surveyed into twelve demographic groups based on their age and gender. To collect
       information on demand for and network effects on the social network, we use an ex-
       perimental choice approach in the spirit of (Brynjolfsson et al., 2019) and (Allcott et
       al., 2019). These papers measure the consumer surplus generated by digital goods by
       conducting discrete choice experiments where they offer consumers the choice to give
       up access to the good in exchange for monetary compensation. We build on these
   1
    When conceived of this way, any platform, including a one-sided platform, can be thought of as an n-sided
platform once we account for the heterogeneity in users within a side. For example, a telephone network,
which is the classic example of a one-sided network, can be thought of as consisting of multiple sides that can
be distinguished based on various characteristics including business vs. personal use, demographics, regional
location, heterogeneity in activity (frequent users or not) and type of activity (always callers, callers and
receivers, always receivers).

                                                      2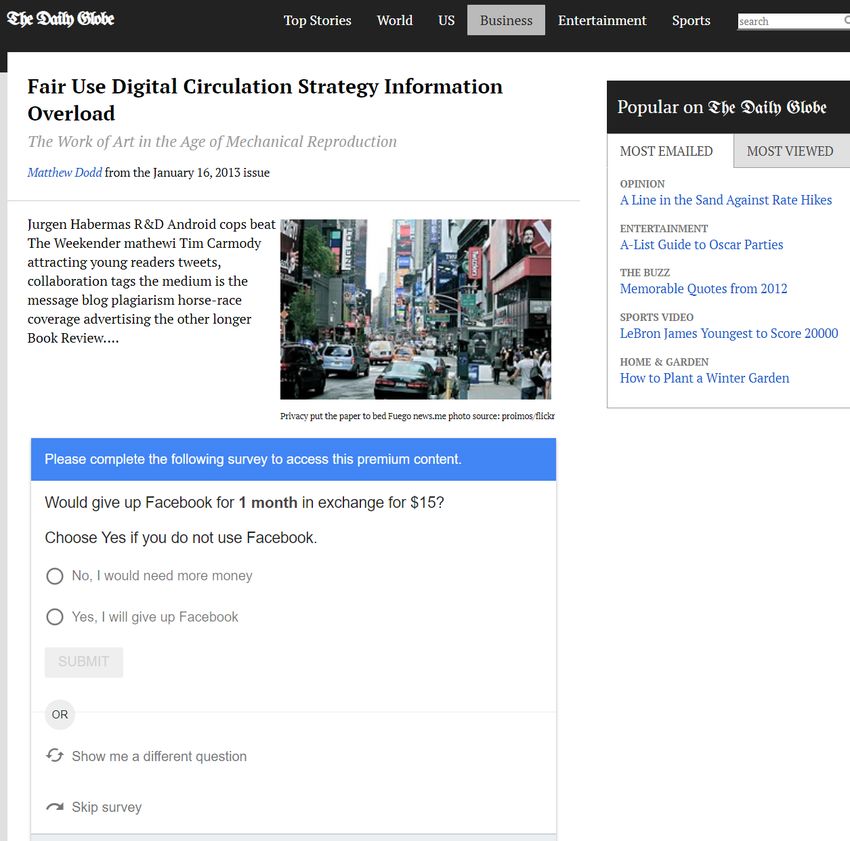
papers by asking about a new type of free good (the value of social connections) as
well as by using information from the full distribution of responses to fit a demand
curve (in our parameterization, logistic) rather than focusing on median and average
responses. We adapt this approach to our case by giving consumers the choice to give
up access to a subset of their network in exchange for monetary compensation.
   Using this information about demand for Facebook, we estimate the parameters of
a logistic demand curve for each of the twelve demographic groups, as well as the twelve
by twelve matrix of their network externalities. We complement this with additional
survey questions about friend frequency, the disutility of advertising, and publicly
available data on Facebook’s current advertising revenues by demographic group.
   With this model of individual participation, we can then calculate the effects of
counterfactual pricing policies, government policies and demand shocks. We begin
by simulating Facebook’s revenue maximizing strategy. We find that Facebook could
raise revenues by $2.38 billion dollars a month (from a baseline of $1.79 billion) if
it did not care about the size of its user base. This strategy entails squeezing value
from inelastic users, reducing Facebook usage by 49.1% and lowering total consumer
surplus by 42.1%. We infer that in addition to maximizing current revenues, Facebook
values maintaining a large user base. We impute the shadow value Facebook places on
maintaining a large user base as the one that justifies their current level of advertising
as optimal. In subsequent simulations we take into account this shadow value when
simulating Facebook’s response to policy changes.
   We then proceed to calculating the impact of changes in government policy on
Facebook revenues, participation, and consumer welfare. We estimate that a first-best
social welfare maximizing Facebook would subsidize usage, running a large deficit,
and raising social surplus by 9.6%, or $1.3 billion a month. This result assumes that
Facebook’s motivation to maintain a large user base is a publicly useful one (e.g. it
represents the non-immediately monetizable value of data collected) rather than an
only privately useful one (i.e. as a barrier to entry), as well as other assumptions
about the marginal ability of the social planner to attract users.
   We simulate three taxation and redistributive policies. We show theoretically that
a tax on ad revenues would not change Facebook’s optimal advertising level, so long
as Facebook has no other considerations. However, if Facebook values a large user
base, then a tax on advertising redirects it from raising high levels of advertising
revenue to cultivating a large user base. A tax on the number of users has the opposite
effect, leading Facebook to squeeze a smaller group of users with a higher level of fees.
Quantitatively, we find that a 3% tax on advertising revenues would raise consumer
surplus by 1.3%, and raise 2.4% of current Facebook advertising revenues in taxes. A
tax on the number of users of Facebook, which raised the same amount of revenue,

                                            3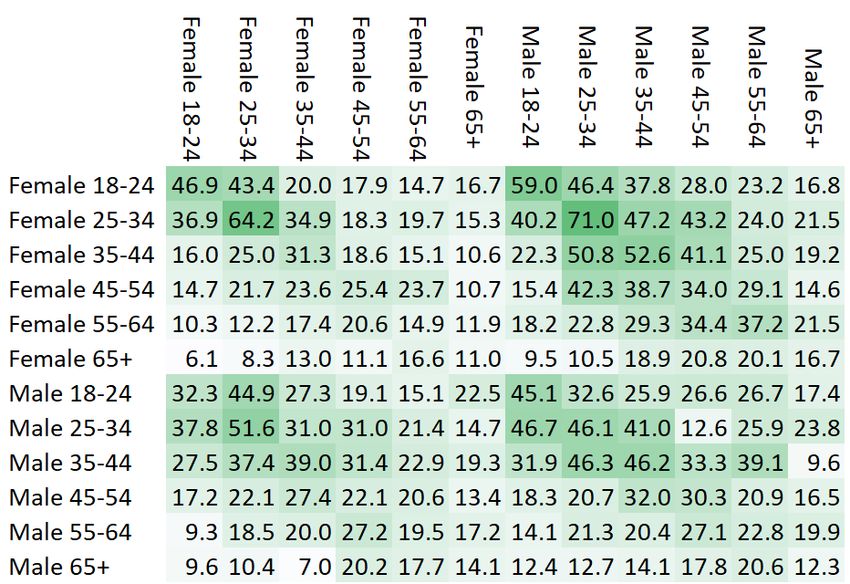
would lower consumer surplus by -.1%. Another proposed policy for redistributing the
wealth from Facebook is the “Data as Labor” framework, where internet users would
be compensated for their ‘labor’ in viewing targeted advertisements (Posner and Weyl,
2018). We conceive of this policy as a rebate of Facebook’s current advertising revenues
to users. We estimate one possible “Data as Labor” regime – i.e. rebating all current
ad revenues to users – as raising social welfare by 30.3%. This policy is better than the
first best, because it allows Facebook to continue showing ‘productive’ advertisements
(which create less than an a dollar of direct disutility per dollar of revenue) while still
providing a net subsidy to use the platform. “Data as Labor” therefore represents
the best of both worlds regarding welfare maximization, if somehow obvious obstacles,
especially the creation of ‘fake’ accounts to steal the subsidy, could be overcome.
    We also simulate three proposed regulatory interventions. The first is taking steps to
enhance the competitiveness of the social media industry, by lowering barriers to entry
and enforcing ‘interoperability’ (i.e. allowing users on a Facebook competitor to view
posts by and communicate with users of Facebook and other Facebook competitors).
We model this policy as creating perfect competition, and lowering the price of the
platform to its marginal cost – i.e. forcing the elimination of advertising and other
fees. Next we simulate the results of two ‘botched’ Facebook breakups. The first,
a botched horizontal breakup, leaves America with two monopolies over half of the
population each. The second, a botched vertical breakup, ends Facebook usage by
5% of the population with no offsetting increase in social media competitiveness. We
predict that perfect competition would raise social welfare by 4.8%. Breaking Facebook
into two non-competitive ‘baby Facebooks’ would be disastrous, lowering social welfare
by 84.7%. A botched vertical breakup would have more limited effects, lowering social
welfare by only about 10.1%.

2     Related Literature
Following the seminal work of Parker and Van Alstyne (2005) and Rochet and Tirole
(2003), platform researchers have extensively studied the impact of direct and indirect
network effects on various strategic issues including pricing (Hagiu (2009)), launch
(Evans and Schmalensee (2010)) and openness (Boudreau (2010)). The core insight of
this research is that it can be optimal for a two-sided platform to subsidize one side
and increase fees for the other side (Eisenmann et al. (2006)).
    The above papers all focus on what are known as one or two-sided platforms.
Examples of two-sided platforms are Uber (riders and drivers) and Ebay (sellers and
buyers). In a two-sided platform, it can make sense to price discriminate based on
side, because sides differ in both their elasticity of demand and in the network effects

                                            4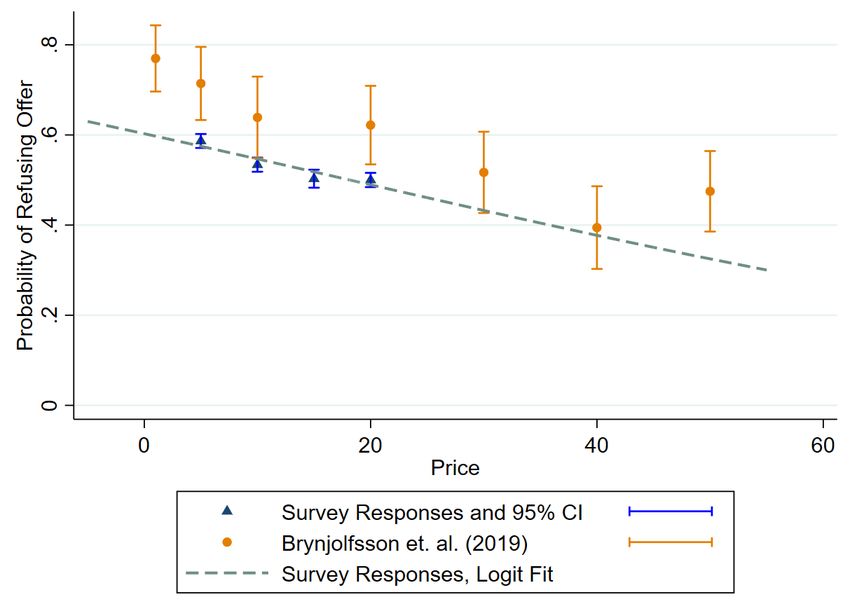
they provide. For example, an additional Uber driver in a region provides a positive
       externality to riders (they will get a ride faster) but a negative externality to other
       drivers (they will have to wait longer between fares). However, a large literature
       suggests that even within a ‘side’ of a one or two-sided platform, users are heterogenous
       in the effect their actions have on the network. The empirical literature on network
       effects uses several techniques for their estimation, including studying exogenous shocks
       to the network (e.g. Tucker (2008)), using an instrumental variable approach (e.g. Aral
       and Nicolaides (2017)) and conducting field experiments (e.g. Aral and Walker (2012)).
          There are several recent papers that model pricing in the presence of multi-dimensional
       network effects. For example, Bernstein and Winter (2012) determines a mechanism
       for optimally renting storefronts in a shopping mall where stores have heterogeneous
       externalities on other stores. Candogan et al. (2012) and Fainmesser and Galeotti
       (2015) consider monopolistic pricing of a divisible network good, where utility from
       the good is quadratic in the amount consumed and linear in the impact of neighbors’
       consumption. In (Candogan et al., 2012), the platform firm has perfect knowledge
       about all individuals’ utility functions, but allows for individuals to vary in their util-
       ity from the platform good (although this utility must be quadratic). They show that
       the problem of determining profit maximizing prices is NP hard, but derive an algo-
       rithm guaranteeing 88% of the maximum. Fainmesser and Galeotti (2015) considers a
       similar model but assume that all individuals have the same demand for the network
       good, while allowing for a random distribution of network connections. They find that
       allowing for the network to lower prices on ‘influencers’ must increase social welfare,
       but allowing firms to fully price discriminate might be harmful. The paper in this
       literature with a model most similar to ours is Weyl (2010). That paper, like ours,
       considers an indivisible platform good with network effects. It also, like this paper,
       allows for groups to vary in both their network effect on other groups and in their
       opportunity cost for using the platform. It finds that a wedge exists between the profit
       maximizing and social welfare maximizing pricing strategy.2
          Our paper builds on these prior papers along several dimensions. First, our model
       features more realistic monetization, allowing for different types of users to face different
       levels of disutility from the firm increasing their level of advertising. This is in contrast
       to Candogan et al. (2012) and Fainmesser and Galeotti (2015) which do not allow for
       such variation, and Weyl (2010) which features an unrealistic pricing scheme, where
       users are charged based on the level of participation of other users (i.e. an ‘insulating
       tariff’). Weyl (2010)’s use of insulating tariffs in pricing forces users to immediately
       jump to a desired equilibrium in response to a price change, which prevents a dynamic
   2
   The exact nature of this wedge – as a marginal, not an average distortion – was clarified in a published
comment (Tan and Wright, 2018).

                                                    5
analysis of a pricing change. Second, unlike Candogan et al. (2012) and Fainmesser
and Galeotti (2015) our model has a realistic amount of uncertainty within a side of
a model, meaning that first degree price discrimination that drives consumer surplus
to zero is impossible.3 The most important contribution of our model is that it is the
first to allow for straightforward calibration. To the best of our knowledge, no previous
paper has made quantitative model-based recommendations about multi-sided platform
pricing, or quantitatively evaluated the welfare consequences of a platform regulation
market structure change.
The illustration in our paper is of Facebook, a platform primarily monetized through
advertising. Most platforms keep the quantity of ads (“ad load” to those in the in-
dustry) shown per user fixed while showing different ads to different users based on
their characteristics and bid outcomes of ad auctions (e.g. Google (Hohnhold et al.,
2015), Pandora (Huang et al., 2018a)). Platforms with a newsfeed, such as Facebook,
WeChat and Linkedin, understand the trade-off between ad load and user engagement.
Some of them show the same number of ads per person (see Huang et al. (2018b) for
advertising on WeChat), while others fix the number of ads a user sees based on the
expected revenue generated by the user in the long term (Yan et al. (2019) describe
Linkedin’s ad load strategy). While this optimization takes user engagement into ac-
count, network externalities generated by a user are not explicitly modeled and users
generating different levels of network externalities end up seeing the same number of
ads.4 In estimating structurally the impact of market structure on social welfare in the
presence of network effects, our paper is in the tradition of Rysman (2004). That paper
has a model of an analog two-sided platform: the yellow pages. It uses instruments to
find the spillover effects of additional advertisements on phone-book quality. Rysman
finds that small decreases in competition might increase welfare, as there would be
fewer better phone-books with more utilitous advertisements.
Our paper also speaks to the growing literature on the optimal regulation of digital
platform monopolies. An important paper summary and discussion of this literature
can be found in Scott Morton et al. (2019). That paper ultimately calls for a special
‘Digital Authority’ that would have access to platforms’ internal information for the
purpose of making regulatory decisions and boosting platform competition. We hope
3
The fact that platforms cannot fully first-degree price discriminate is testified to by papers which show
that users benefit considerably on average from joining a platform. For example, Ceccagnoli et al. (2011)
find that independent software publishers experience an increase in sales and a greater likelihood of issuing
an IPO after joining a major platform ecosystem, and Brynjolfsson et al. (2019) find large consumer surplus
from the use of digital platforms.
4
Based on informal conversation with researchers who have worked with Facebook, our understanding
is that in constructing its newsfeed, Facebook gives every potential entry a score, based on the amount of
engagement the entry is expected to create in the user who sees the ad, the amount of revenue that might
be generated (if it is an advertisement) and a penalty for being similar to a recently displayed entry.
6that this structural model and its descendants could be tools for such an agency.
3 A Model of an N-Sided Platform
The foundational element of a model of network effects is a stance on how agents
connect to and gain welfare from the network. In our model, individuals with het-
erogeneous characteristics decide whether or not to participate on a platform. Their
desire to participate in the network is a function of their expectation of which other
individuals will participate. For example, Jane Doe’s desire to use Instagram is a func-
tion of which of her friends are also using Instagram. The key term in the model is
the externality that users gain from others. Unlike other models of platforms, we allow
for individuals of different characteristics to gain different amounts of value from the
participation of others on the network. These market segments are the different sides
of the platform.
Our focal example is a social network, because our illustration takes place in that
setting. Therefore, in our baseline model, other incidental network characteristics
mimic that of a social network. Once two users are using the network, there is no
additional cost for them to form a connection. All connections where both users gain
weakly positive value are immediately formed.5
The platform’s monetization is modeled as a unpleasant platform attribute (e.g.
advertising), fee or subsidy faced by each participating user: A binary function of their
decision to participate on the network.6 Users face disutility depending on how in-
tensely they are monetized by the platform. The relationship between the platform’s
degree of monitization and the user’s disutility need not be one-to-one. For exam-
ple, the platform may raise revenues from users through unpleasant advertisements or
by collecting personal data (potentially causing users the disutility of knowing one’s
data will be harvested and resold). Alternatively, it may correspond to an explicit
participation charge, such as WhatsApp’s original $1 subscription cost.
5
This abstracts from the reality that Facebook usage is not a binary choice, but rather a continuing
decision about how often to post and view other’s posts. A model with an additional decision about how
intensely to use Facebook might have slightly weaker total network effects, if the most prolific posters within
a demographic group (who presumably create the strongest local network effects), are the least likely to
leave the platform as a result of a policy or participation shock. The opposite might hold if the elasticity of
posting with respect to others’ participation was larger than the elasticity of participation. We thank Xiang
Hui for this insight.
6
While some papers have found advertising to provide benefits to platform users (e.g. Rysman (2004)),
in the context of a digital platform it is safe to assume advertisements cause disutility at the margin – it is
effectively costless to increase their supply, and so, if this were not the case, all social media platforms would
simply be an infinite feed of advertisements.
73.1 Consumers
A consumer i chooses whether to participate in the platform (Pi = 1) or not (Pi = 0).
Note that while demand functions are here defined at the individual level, as a practical
matter firms may estimate them at the level of a demographic or social group. For
this section of the paper we will refer to i’s as individuals. We tweak the model in our
calibration for an example with twelve market segments. [Seth here]
If the consumer i uses the platform (Pi = 1)), they expect to receive
E[Ui (Pi = 1)] = µi (P1 , .., PI , −φi ) (1)
where Pj is the probability individual j participates on the platform. φi is the
revenue the platform raises from individual i. A firm which monetizes using advertising
might raise $1 in revenue by displaying additional ads which create $.20 in additional
∂µi
disutility (i.e. ∂φi = .2). Other platforms, like local telephone and pre-2016 WhatsApp,
∂µi
monetize by charging a flat fee for participation (i.e. ∂φi =$1).
∂µi
∂Pj is the marginal utility given to i from j being on the network to i (if i par-
ticipates). These partial derivitives capture our model’s network effects. In our theo-
retical analysis, our only assumption is that µi be continuously differentiable. In our
calibration, we further assume that utility from the platform is linearly additive in
the network effect from friends and disutility from φ. In other words, the parametric
∂µi ∂µi
analysis assumes that ∂Pj (Ui (j) for short) and ∂φi (written as ai ) are constant.7
The value to a consumer of not using the platform, their ‘opportunity cost’, is an
ex-ante unknown random variable.
Ui (Pi = 0) = i (2)
7
The assumption that the value of platform connections are linearly additive is not a harmless one, despite
being made in all of the most similar papers extant ((Candogan et al., 2012), (Fainmesser and Galeotti,
2015), and (Weyl, 2010) all make this assumption). It means, for example, that the additional value that
Jane Doe gets from James Smith joining Instagram isn’t a function of whether any third person is already
on Instagram. This is a useful simplification in the context of social networks, but it is likely unrealistic.
Taking a food delivery platform as an example, it is likely the case that the 10th pizza delivery service
joining the platform provides less platform value to the typical user than the 1st. A related simplification
is the assumption that the value of a connection is only a function of the characteristics of the connected
individuals. In general, the value of a connection to one individual may be a function of that individuals’
connections to other individuals. We abstract from these possibilities in the calibration. The measurement
of non-linearly additive network effects introduces large measurement challenges beyond the scope of this
paper’s illustration, but is something we plan to explore in future work. If there are decreasing returns to
connections, this would suggest that at the margin the Spence distortion is relatively less important, because
reducing the size of the client base has a proportionally smaller impact on inframarginal user’s utility (To see
this, consider the case where there is no positive network effect at the margin. Then the marginal distortion
is only from monopoly markups above marginal costs). However, for larger simulated interventions, equating
the marginal network effect with the average network effect is less problematic.
8where i are independent random variables (not necessarily symmetrical or mean
0). ’s distribution may vary by individual. This means that the probability of partic-
ipating on a network, P , conditional on a given level of utility from the network good
U (P = 1) is consumer specific.8
The distribution of i determines how elastic i will be to changes in the platforms’
attractiveness. Consider the case where i is expected to be approximately equal to
the utility of participation Ui (Pi = 1) – in other words, that it is likely that the user is
‘on the fence’ about using the platform. In this case, changes in φi or other consumers’
participation will be highly likely to change i’s participation. On the other hand, if i
is two-peaked, with half of users miserable without the platform and half who are very
happy without it, use of the platform will be inelastic to changes in platform quality.
Each consumer gets to see the resolution of their private outside option i before
participating, but not the resolution of anyone else’s. Therefore, they base their de-
cision to participate on the platform based on their beliefs in the likelihood of others
participating. The ex-post consumer demand function is
P = 1 if E[Ui (Pi = 1)] > i
i
P = 0 otherwise
i
Note that Pi ’s are independent because i ’s are independent.
We can write the ex-ante demand function (i.e. expected demand before i is
known) as:
Pi = P rob[E[(Ui (Pi = 1)] > i ] = Ωi (µi ) (3)
for more useful notation, define
µi ≡ Ui ≡ E[Ui (Pi = 1)] (4)
The network is in equilibrium when individuals’ decisions to participate are optimal
responses to their beliefs about every other individuals’ decision to participate. In our
empirical illustration, we calculate the new equilibrium as a response to a shock through
evaluating a series of ‘cascades’.
For example, if the firm were to raise φi we would first calculate the direct impact
of only this change in price on user i. This is the first cascade. We would then calculate
all individuals’ decision to participate taking i0 s new participation rate as given – the
second cascade. Additional cascades estimate every groups’ rate of participation, taking
the previous cascades’ rate of participation as an input. We calculate 1000 cascades
8
By adding a negative sign, this term can also be interpreted as the value or disutility of Facebook use
in the absence of any friends or advertisements.
9in all of our simulations, but as a practical matter, the importance of cascades beyond
the third or fourth is minimal for a typical network in a stable equilibrium.
For the symmetric network (i.e. where all individuals have the same distribution
of opportunity costs , disutility from advertising A, and network externality µi (Pj )),
where utility is linearly additive in the network effects and disutility from advertising,
an equilibrium is stable so long as
∂Ω
1> U (i)(I − 1) (5)
∂U
∂µi
where U (i) = ∂Pi is the value from any consumer participating in the network to
any other consumer, and I is the number of friends each user has. Intuitively, the
network is unstable when users are very elastic and care a lot about the participation
of others on the network. When a network is in an unstable equilibrium, small changes
in platform quality can lead to unravelling (i.e. the partial derivative of participation
with respect to platform quality can be infinite). The derivation of this equation is in
appendix B.
3.2 The Digital Platform
Consider a social network that chooses a monetization level φ for each demographic
subgroup i. For now, think of monetization level as capturing the full tradeoff that
the firm makes between net-revenue and platform quality at the per-user level.9 In our
calibration of the model, we will measure this tradeoff by taking the ratio of advertising
revenue to the disutility caused by advertisements. While this is only a part of the
monitization tradeoff made by a social network in real life, cost minimization entails
all dimensions of this tradeoff have the same marginal return.
Consider the case of the profit maximizing social network. How should it choose to
set monetization levels?
The firm’s profit after uncertainty resolved is
I
X
Φ= φi Pi − F (6)
i
Where φi is the revenue collected from or distributed to consumer i if they participate
in the network. It is a choice variable from the perspective of the firm. Pi is a binary
indicator of whether the consumer participates. F is the fixed cost of the platform
firms’ operation.10
9
The reason this distinction matters is that a change in net-revenue would be treated differently than an
increase in revenues and costs by a revenue tax. In our taxation results, we assume that there is no marginal
cost of accommodating additional users, making a profit and revenue tax equivalent at the margin.
10
We assume the platform faces no marginal costs, but adding a marginal cost does not change the
10Pi ’s are independent random variables, so firms maximize
I
X
E[Φ] = φi Pi − F (7)
i
where
Pi = E[Pi ] = Ωi (Ui ) = Ωi (µi (φ1 , φ2 , ...)) (8)
the probability of a consumer participating Pi is an individual specific function of Ui .
Ωi is the effective individual specific demand function. Ultimately the equilibrium level
of participation is a function of preference parameters and the vector of φ’s, and there
are no variable costs, so the monopolist social media platforms’ problem is to select
the level of φ’s that maximizes revenues.11
Taking a derivative yields the following recursively defined first order condition
J
∂Φ ∂Pi X ∂Pj
= Pi + φi + φj (9)
∂φi ∂φi ∂φi
j6=i
where
J
!
∂Pi ∂Ωi ∂µi X ∂µi ∂Pj
= − + (10)
∂φi ∂µi ∂φi ∂Pj ∂φi
j
and,
K
!
∂Pj ∂Ωj ∂µj ∂Pi X ∂µj ∂Pk
= + (11)
∂φi ∂µj ∂Pi ∂φi ∂Pk ∂φi
k6=i
This recursion is natural as Pi is a function of Pj , which is a function of Pi , etc.
Equation (11) will converge to a finite value so long as each recursion of the network
effect “dampens out”. This will occur so long as the equilibrium is stable.
3.3 Strategic Implications
Equation 9 gives conditions for the optimal schedule of fees (or other revenue raising
monetization strategies) and subsidies for the general case. Even if not enough is
known about the entire curve of functions to find a global optimum, knowing the first
derivative of the objective function with respect to the choice parameters is useful. An
experimenting firm can simply use these equations to inch towards a local maximum
via gradient decent.
For simplicity in interpreting the first order condition, for now, consider only the
first cascade of network effects. In other words, temporarily ignore the second terms in
qualitative results.
11
Although the function ai (phii ) which relates user disutility from monetization to platform revenue might
be thought of as being net of this fixed cost.
1110 and 11. In other words, the following equations take into account only one cascade
of network effects. In the empirical calibration below we will show that the first cascade
of network effects can provide a good approximation of the total effect of the shock.
HJ !
∂Pi ∂Ωi ∂µi X HH∂µi ∂P
j
= − + H
H (12)
∂φi ∂µi ∂φi ∂Pj ∂φ
Hi
j6=i
H
H
and,
KZ
Z !
∂Pj ∂Ωj ∂µj ∂Pi X ∂µj
∂P
= + Z k (13)
∂φi ∂µj ∂Pi ∂φi ∂Pk Z
Z ∂φi
k6=
i
Z
Z
This, simplication substituted into 9, yields a useful approximate first order condi-
tion
J
∂Φ ∂µi ∂Ωi ∂µi ∂Ωi X ∂Ωj ∂µj
= Pi − φi − φj (14)
∂φi ∂φi ∂µi ∂φi ∂µi ∂µj ∂Pi
| {z } j6=i
Direct Effect | {z }
Network Effect
The simplified first order condition consists of two sets of terms. The first two
terms report the direct effect of raising the amount of advertising on individual i by
one dollar. This will raise revenue, based on that individual’s current likelihood of
participation, and lose revenue based on how elastic that individual’s participation is.
The two direct effect terms are what normal firms have to consider when pricing their
∂Ωj
products (note that when ∂Pi = 0 ∀ i, j, i.e. when no network effects are present at
the current margin, 14 reduces to this pair of terms).
The last term in equation 14 is the network effect of an advertising increase. The
increase in advertising makes i less likely to participate (in this approximation, by
∂µi ∂Ωi ∂Ωj ∂µj
an amount ∂φi ∂µi ) which leads others to stop participating (by an amount ∂µj ∂Pi ).
When these third parties stop participating, the platform loses on the current revenues
that they were paying φj . In reality, most pairs of individuals will receive no network
effect from the participation of another. In our empirical calibration we assume that
∂Ωj
∂Pi = 0 whenever i and j are not Facebook friends.
In other words, the fee or level of disutilitous advertising should be increased on user
i if the increased revenue (Pi ) is greater than the decreased revenue from the person
directly impacted possibly dropping out (second term) plus the decreased revenue from
all the charged person’s friends potentially dropping out (third term).
This simplified first order condition can be made more precise by taking into account
additional cascades of the network effect. In other words, because user i’s fee increasing
causes j to be less likely to participate, all those connected to j should be less likely
to participate as well.
12Unsurprisingly, the firms’ profit maximizing strategy deviates from social welfare
maximizing pricing. This is a type of Spence distortion (Tan and Wright, 2018). The
market failure arises because the firm only cares about network effects provided to
marginal users, and fails to internalize the social welfare of network effects that benefit
infra-marginal users. A social planner takes into account welfare changes for infra-
marginal individuals who will use the platform in any case. Appendix C reports the
social welfare maximization problem.
3.4 Theoretical Taxation and Regulation Results
The model also has important implications for taxes and regulation. It can be shown,
for example that, under mild conditions, that a tax on the number of users is weakly
harmful to consumer surplus. Our empirical calibration and simulation results com-
plement this section by putting actual dollar values on the size of these effects.
The platform’s key choice from a regulatory perspective is also φi . When network
effects are weakly positive, increases in phi will reduce consumer welfare both directly
( ∂µ
∂φ must be negative in equilibrium) and indirectly (by reducing the number of users
and their weakly positive network effects). Therefore, from a pure consumer welfare
persperctive, polities should favor taxes and regulations that lower the effective rate of
advertising (or otherwise boost platform quality), and disfavor the opposite.
To predict how taxes and regulations will impact consumer welfare, we need to
understand how the firm will react to different policies. To do so, we first modify the
firm’s objective function to allow for taxes and different sorts of regulatory interven-
tions. We also add a term to capture an important potential non-pecuniary goal for
the platform: maintaining a large user base. The firm’s revised objective function is
I
X
Φ∗ = (1 − τ1 )φi Pi − (λ − τ2 )(Pi − P̂i ) − F (15)
i
where τ1 is a tax on revenues φi Pi ,12 τ2 is a per-capita tax on the number of users,
and λ(Pi − P̂i ) is the shadow value of maintaining a large user base (or cost of having
a user base smaller than target level P̂i ).
This yields the following first order condition for the firm
J J
∂Φ∗
∂Pi X ∂Pj X ∂Pj
= (1 − τ1 ) Pi + φi + φj + (λ − τ2 ) (16)
∂φi ∂φi ∂φi ∂φi
j6=i
From this equation we can derive some important results about the impact of various
12
Alternatively, this represents a tax on profits if φ incorporates marginal costs and the tax is incident net
of fixed cost F
13policies.
Theorem 3.1. Assume a platform in a stable equilibrium has weakly positive shadow
values for a large user base (i.e. λ ≥ 0), no per capita tax (i.e τ2 = 0, and weakly
∂Ω
positive network effects (i.e. ∂Pij ≥ 0∀i, j). Then a marginal increase in revenue taxes
τ1 weakly increases consumer surplus
Proof. First note that for a platform obeying the above assumptions to be optimizing
it must be the case that monetization increases φ must reduce platform quality at the
∂µi
margin (i.e. ∂φi < 0∀i). If this were not the case, then the platform could increase its
utility by increasing φ for i: it would directly increase i participation and revenues from
i, and because of the weakly positive network effects, this would increase participation
by all types j and the total utility from those users.
This leads to the result that the above assumptions jointly imply that the platform
∂Pj
has weakly positive total network effects, i.e. ∂φi ≤ 0∀i, j. In other words, a decrease
in φi weakly increases platform participation for all users.
∂Pj
Returning to equation (16), ∂φi ≤ 0∀i, j and λ − τ2 ≥ 0 jointly entail that the
∂Φ∗
second term is weakly negative. If the second term is weakly negative when ∂φi = 0,
then the first term in (16) must be weakly positive. Increasing τ1 then weakly decreases
∂Φ∗
the right hand side of (16). If ∂φi ≤ 0 then the firm can weakly increase profits by
marginally decreasing φi .
So an increase in revenue taxes τ1 causes the firm to shift from its incentive to
squeeze a smaller user base for more monetary revenues to its goal of protecting a large
user base. It will weakly decrease φi , and this will increase consumer welfare – first
by directly increasing platform quality for i and then by boosting participation and
network effects for all users.
There is a special case, outlined in (3.1.1) when there is no net monetary incentive
to have a large number of users, the incidence of revenue taxes is fully on the platform’s
profits.
Corollary 3.1.1. Assume a platform in a stable equilibrium has λ − τ2 = 0∀j, and
∂Ω
weakly positive network effects (i.e. ∂Pij ≥ 0∀i, j). Then a marginal increase in revenue
taxes τ1 is fully incident on platform profits.
These results have clear implications for countries that are considering digital taxes.
To the extent that US digital platforms are owned by foreigners, it partially explains
why France and other countries are so eager to levy such taxes – they are only incident
on foreigners, making them very appealing sources of revenues.
On the other hand, per-capita taxes and actions that reduce the shadow value of
users will have a negative effect on welfare.
14Theorem 3.2. Assume a platform in a stable equilibrium has weakly positive network
∂Ω
effects (i.e. ∂Pij ≥ 0∀i, j). Then an increase in per-capita user taxes τ2 , or decrease in
the per-user shadow value λ, weakly decreases consumer surplus.
Proof. From equation 16, note that this would weakly increase the second term (as
∂Pj
∂φi ≤ 0 by the above arguments) without impacting the first term. This makes the
total first order condition positive, leading the platform to weakly increase monetization
∂Ωi
which weakly lowers welfare directly (through ∂φi < 0) and indirectly through lowered
participation and network effects.
While per-capita taxes may not be under serious consideration in any municipality,
there are many policies that might lower the shadow value of users. One example
would be a policy that lowered a platform’s ability to use data that it acquired in its
main app to boost the quality of another (non-modeled) application. Another example
would be a policy that reduced the risk of a new entrant stealing a platform’s clients.
To the extent that a large user base is desired as a ‘moat’, or barrier to entry, such a
reduction in potential competition would reduce consumer welfare.
A final important consequence for tax incidence arises from international connec-
tions. In our calibration, we will model Facebook’s US user base in a vacuum. But US
users of Facebook doubtless create value for foreign users, and are therefore desirable
for that purpose. To the extent that shadow values are internalizing this un-modelled
network effect, a tax on French digital revenues will reduce US λ by reducing the in-
centive to provide these un-modelled network effects. So, in addition to being incident
on Facebook’s investors, a tax on French digital revenues may lower Facebook platform
quality in all other countries. Intuitively, a tax that is incident on revenues from only
a portion of Facebook’s user base causes Facebook to de-prioritize accumulating users
who are attractive to that user base.
This particular example also illustrates that a typical revenue tax might shift both
τ1 and λ. The simplest way this could emerge is if λ is a function of expected future
revenue from the user that might be subject to the tax. In such a case, whether the
tax has a positive effect on consumer welfare depends on whether the increase in τ1 is
larger or smaller, in percentage terms, than the change in λ + τ2 .
Before moving on to the calibration, it is important to note a few features of these
theoretical results. Firstly, they do not assume any particular relationship between ad-
vertisers and the platform. In the calibration, due to data constraints, we must assume
a constant tradeoff between advertising revenues and platform quality, a restrictive as-
sumption not made here. Second, it is important to note all of these theoretical results
are at the margin. Multiple equilibria are common in network situations, and more
than a marginal change in incentives may lead the firm to move to a new stable global
15optimum.
4 Calibrating the Model for Facebook
While theoretical results are useful, in order to be more precise about the typical
magnitude of these effects, we now proceed to calibrating the model. The setting for
our empirical illustration is Facebook. Facebook is an ad-supported social network. It
was selected because it is used by a very large percentage of the US population, and
previous research has demonstrated that many value it highly.
To illustrate how our method can be used by firms to price discriminate, we collected
survey data to estimate our model. We conducted 57,195 surveys on a representative
sample of US internet population. Google Surveys provides information on a survey
participants’ gender and age group, so we distinguish market segments based on those
characteristics. We divided Facebook users into twelve market segments. These are a
pair of genders and six age brackets. The market segments we consider are
• Gender: Male or Female
• Age: 18-24; 25-34; 35-44; 45-54; 55-64; and 65+
Individuals under the age 13 are not allowed to have Facebook accounts.
We asked the following sets of questions about individuals’ demand for Facebook,
combining responses within the twelve market segments described. The list of surveys
conducted is documented in table 1 and the full list of questions and possible responses
is documented in Appendix section D.
Figure 1 gives examples of how the surveys appeared to respondents. Respondents
answered these surveys either as part of Google Rewards or to access premium content
on websites.
The very general utility function analyzed in section 3.2 is tractable enough to
lead to some analytic results, some of which we have already elucidated. However,
for the purposes of quantitative estimates, we need a more restrictive functional form
Survey Number of Responses
Number of friends on Facebook 3,509
Composition of friends by demographic group 15,660
Willingness to accept to give up Facebook for 1 month 17,649
Willingness to Accept to Give up a Friend Group on Facebook for One Month 13,356
Willingness to pay to not see any advertisements on Facebook for 1 month 7,021
Table 1: Surveys conducted and number of responses. More detail on the survey instru-
ments can be found in appendix D
.
16Figure 1: Google survey interface example. Note that each respondent only receives a
single survey question.
for the utility function. We now modify the model to account for the fact that we
are estimating it over market segments, not individuals, and for the fact that not all
individuals are friends.
We assume that the opportunity cost for using Facebook is distributed such that
demand for Facebook, Ωi , follows a logistic distribution. We estimate the parameters
of Ωi by running a logistic regression on responses to the question “Would you give
up Facebook for 1 month in exchange for $X? Choose Yes if you do not use Face-
book.”. Regressions are separately estimated for each population group i. The logistic
regression takes the form
Y = β0 + β1 X (17)
where Y is an indicator for whether the offer is accepted, and X is the amount
offered.
Figure 2 reports the willingness to accept (WTA) demand curve for giving up
Facebook for one month combining together all demographic groups in our sample.
This constitutes a representative survey of the US internet using population. The figure
plots the mean response to this question for different offers, 95% confidence intervals,
and the logistic line of best fit. The median WTA is $18.16. These findings are
17Figure 2: Probability of rejecting an offer to give up Facebook for one month for price
listed. Mean responses to the question “Would you give up Facebook for 1 month in
exchange for $X? Choose Yes if you do not use Facebook.” 95% confidence intervals are
based on binomial statistics. This survey’s findings plotted with blue triangles. Responses
are contrasted with results from a directly analagous question from Brynjolfsson et al.
(2019) (orange circles.). The logistic line of best fit for the new results is plotted with a
dashed line.
juxtaposed with those of Brynjolfsson et al. (2019) which asked a directly comparable
question. Our results are broadly in line with that previous paper, which had some
methodological differences, but indicate slightly lower valuations.
Figures A1 through A12 plot mean WTA responses and demand curves for various
subgroups of the population. Table A1 reports the estimates underlying these curves.
We convert from estimates of the CDF logistic equation to the PDF of the distri-
bution of i ’s using the equation
i −ηi
−
e si
p(i ) ∼ 2 (18)
−η
− is i
si 1 + e i
where
si = (β1,i )−1 (19)
and
ηi = (−β0,i )si (20)
18Ωi , the probability of participating on a platform as a function of the fee and all
other’s participation, is a function of both the distribution of i’s opportunity costs and
how the value of Facebook participation changes as these fluctuate. The parametric
model of consumer utility we calibrate for each market segment i is linear in the number
of friends of each type and in disutility from advertising, i.e.
J
X
µi = Ui (j)Pj zi (j)Dj − ai φi (21)
where Ui (j) is the (linear) utility an individual i receives from having a friend
∂µi
in market segment j (i.e. ∂Pj ), Pj is the percentage of Americans in group j who
use Facebook, zi (j) is the percentage of users of type j who i is friends with, Dj is
the population of demographic group j, and ai is the disutility caused by a level of
∂µi
advertising φi (i.e. ∂φi ).
We estimate the parameters of 21 through a combination of survey questions, gov-
ernment sources and information publicly available through Facebook’s ad API and
quarterly reports. Dj is taken from US Census reports for 2019. Our estimate of the
current revenues that Facebook make from users by demographic begins by noting that
Facebook raises $11.62 dollars a month in revenue from US users through displaying
them advertisements.13 To calculate initial revenue per user φi we take in data on
the cost of advertising to users of different types from Facebook’s advertisement API.
After selecting which demographic group to target, Facebook Ad API reports a range
of how many impressions you are estimated to receive per dollar of spending. We take
the inverse of this measure to be the relative value of a demographic to Facebook’s ad
revenue (When a range is provided, we use the mean). By taking as given that the
average value of a user per month is $11.62, we can then calculate the revenue per user
of a demographic using the following equations
φi = zRelative Valuei (22)
and
PI
Relative Valuei Pi Di
11.62 = q PI (23)
Pi Di
where q is a scaling term, Pi is the estimate of the initial participation rate on Facebook
by the demographic group (taken as our estimate of Ωi (µi ) − µi = 0), and Di is the
total population of the group in the US.
To estimate the share of users by type that a user of type i is friends with, we
combine the results of two sets of survey questions. We ask questions to solicit the
13
This is derived from Facebook’s 2019 Q1 annual report, where they report $ 34.86 in revenues per North
American user per quarter.
19average total number of friends by ego and alter demographic. We then ask questions
to solicit what percentage of their friends of each demographic. We re-balance these
responses to add to 100 percent (including a catchall category for individuals under
age 18, who are not directly modeled). Figure 3 presents our estimate of the average
number of friends by type for each demographic.14
Figure 3: Average number of friends someone in Y-axis market segment has of the type
in the X-axis market segment.
To estimate the value of friends by demographic group, we begin by asking users
‘On Facebook, would you unfriend all your friends who are [gender] between ages [age
bracket] for $X? Choose Yes if you do not use Facebook.” We then rescale these
responses by the estimated number of friends each demographic group has, and our
estimate of initial average welfare from Facebook (derived from our estimates of Ωi ) so
that the sum of all friend network effects is equal to our estimate of the average initial
utility per user from the platform. Finally, to estimate the disutility from advertising
ai we ask “What is the maximum amount of money (in US $) you would pay to
personally not see any advertisements on Facebook for 1 month? Select 0 if you do not
use Facebook.” We divide this number by our estimates of initial revenues per user φi
14
We reached out to Facebook to collaborate on calibrating our model, including by running internal
experiments to estimate parameters. We presented our work in progress to the Facebook core data science
team. While Facebook chose not to help us to the extent requested, they did release to us information on
friendship shares by ego and alter demographic as part of their 2020 Social Cohesion Conference. Appendix
figure A13, contrasts our survey-based estimates of these rates against official measures. We look forward to
revising our estimates if sufficient additional internal Facebook data we have requested becomes available.
20to estimate ai .
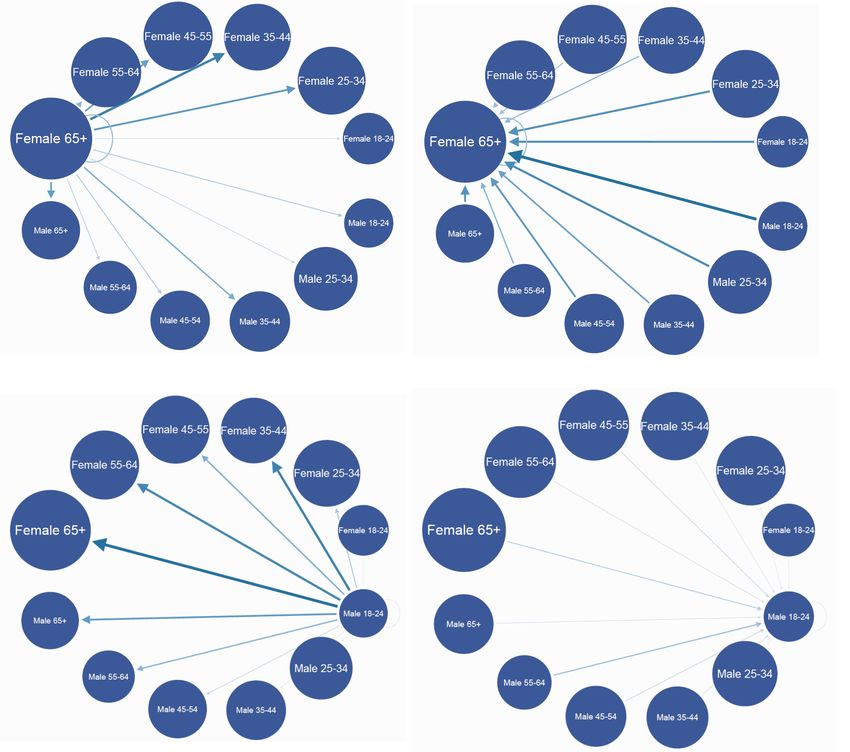
Figure 4 graphically represents Facebook usage and network externalities by market
segment. The size of each node represents the relative current size of the Facebook user
base by demographic. The thickness of the arrows corresponds to the value received by
a Facebook user of the demographic the arrow is pointing towards from an additional
∂µi
Facebook friend of the source demographic (i.e. ∂Pj ). The top figure reports all
12x12 network externalities, the middle figure reports the eight strongest externalities,
and the bottom figure reports the three strongest externalities. The three friendship
externalities in the bottom figure are all worth more than 50 cents a month on average,
with the typical friendship worth much less.
As can be seen, there are more female users of Facebook overall and within each age
group. The thickest lines in 4 flow from right to left, and from the bottom to the top. In
other words, on Facebook, value tends to flow from younger and male users to older and
female users. Figures 5 restrict attention to the Facebook friendship network effects
experienced and caused two nodes of interest: Females 65+ and Males 18-24. Females
age 65+ most value connections to men 18-24, perhaps corresponding to connections to
grandchildren and nephews. They provide the most value to middle aged women, with
young people hardly valuing the connections at all. Males 18-24 provide the most value
to elderly women, with middle aged women next. They value individual connections of
all types only slightly, but amongst these most value connections to Males age 55-64.
We calculate the impact of a change in advertising strategy, or some other change
in Facebook’s environment, over the course of multiple cascades. We denote the period
when platform changes its advertising level as t = 1. The participation rate on the
platform for a demographic group after cascade t is
XJ
Pi,t = Ωi ( Ui (j)zi (j)Dj Pj,t−1 − ai φi,t ) (24)
where Pi,0 = Pi , the initial rate of platform participation for the market segment.
We calculate the perceived welfare to a user of demographic i from the existence of
Facebook after cascade t as
Z Pi,t
(µi (P~j,t−1 , φi ) − ei (ρi )) dρi
(25)
0
where ei is the inverse of Ωi , giving the implied opportunity cost of Facebook use
for every percentile of the population, i.e.
1 − pi
ei = −si log( ) + µi (26)
pi
the total welfare to a demographic group from the existence of Facebook is the
21Figure 4: A graphical representation of Facebook usage and network externalities by
market segment. The size of each node represents the relative current size of the Facebook
user base by demographic. The thickness of the arrows corresponds to the relative value
received by a Facebook user of the demographic the arrow is pointing towards from a
friendship with a user of the source demographic (i.e. Ui (j) with i being where the arrow
is pointing towards, and j being the source of the arrow). The top figure displays all
22 only eight most valuable connections, and
bilateral connection values, the middle figure
the bottom only the three most valuable connections.Figure 5: A graphical representation of Facebook usage and network externalities by
market segment. The size of each node represents the relative current size of the Facebook
user base by demographic. The thickness of the arrows corresponds to the relative value
received by a Facebook user of the demographic the arrow is pointing towards from a
friendship with a user of the source demographic (i.e. Ui (j) with i being where the arrow
is pointing towards, and j being the source of the arrow). Only some friend valuations
displayed. Clockwise from the top left, the friend values displayed are the value from
women aged 65+ to Facebook users of different demographics, to women aged 65+, to
men aged 18-24, and from men aged 18-24.
.
23You can also read