Southern Resident Killer Whales and Ecotourism - Universidade de Lisboa Faculdade de Ciências Departamento de Biologia Animal - Sara Soares ...
←
→
Page content transcription
If your browser does not render page correctly, please read the page content below
Universidade de Lisboa
                  Faculdade de Ciências
             Departamento de Biologia Animal

Southern Resident Killer Whales and Ecotourism

                      Sara Soares

           Mestrado em Biologia da Conservação
                          2009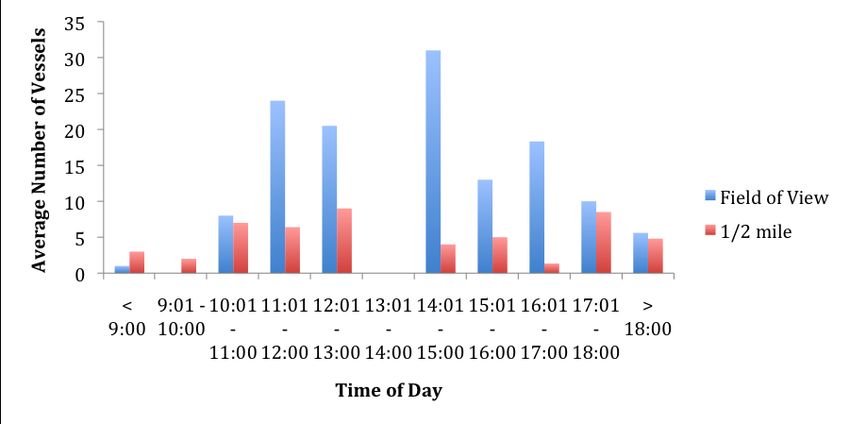
Universidade de Lisboa
                      Faculdade de Ciências
                 Departamento de Biologia Animal

Southern Resident Killer Whales and Ecotourism

                           Sara Soares

                          Orientadores:

          Prof. Dr David Bain – University of Washington
      Prof. Dra. Filomena Magalhães – Universidade de Lisboa

              Mestrado em Biologia da Conservação
                              2009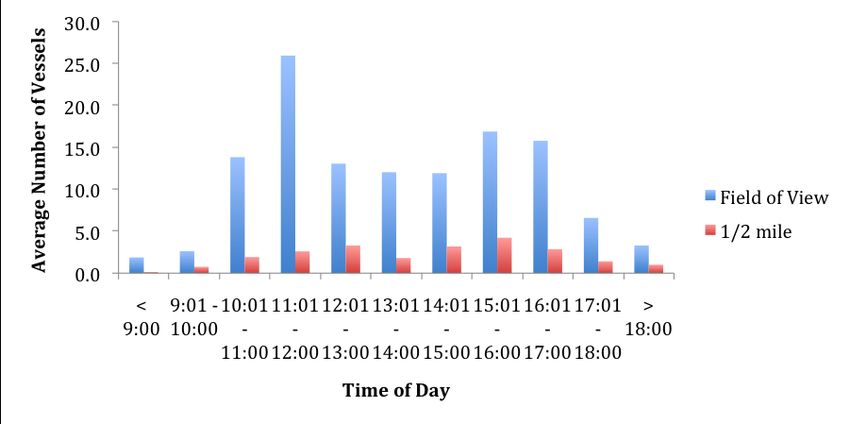
Abstract

       On a global scale, there has been a rapid growth of the whale watching industry
in the last decade. In 1998, a total of 87 countries was involved in commercial cetacean
tourist activities, with more than nine million people participating (Hoyt 2001).
       Off San Juan Island, Washington, USA, southern resident killer whales (Orcinus
orca) population is the key resource of the tourism industry. Due to its predictablility
and to the fact that it is readily found it became the main target of the industry, being
watched nearly at a daily basis from May through September. A fleet of almost 80
vessels and over 500,000 people annually engage in whale watching in this region
(Koski 2008).
       Recently, the southern resident population of killer whales experienced an
almost 20% decline (Krahn et al. 2002), resulting in their listing as ‘depleted’ under the
US Marine Mammal Protection Act (MMPA) and ‘endangered’ under the US
Endangered Species Act (ESA) and the Canadian Species at Risk Act (SARA).
       This combination of intense tourism activity and a fragile population has
unsurprisingly brought apprehensivness and several attempts to assess the effects of
tourism activities on marine mammals have been made . Recent studies have shown
that vessel presence can have short-term bahavioral impacts which may rsult in long-
term impacts.
       This study examined vessels’ density when whales are present in the west
coast of San Juan Island, and the performance of surface active behaviors (SABs) by
southern resident killer whales. The results show that over 70% of the vessels involved
in this activity are at least at ½ mile from shore, when whales are traveling very close to
shore. The performance of SABs was greater with fewer boats present. These results
allowed the assessment of further measures to regulate vessels’ traffic in this region.

Keywords: killer whale, ecotourism, whale watching, regulations, vessels.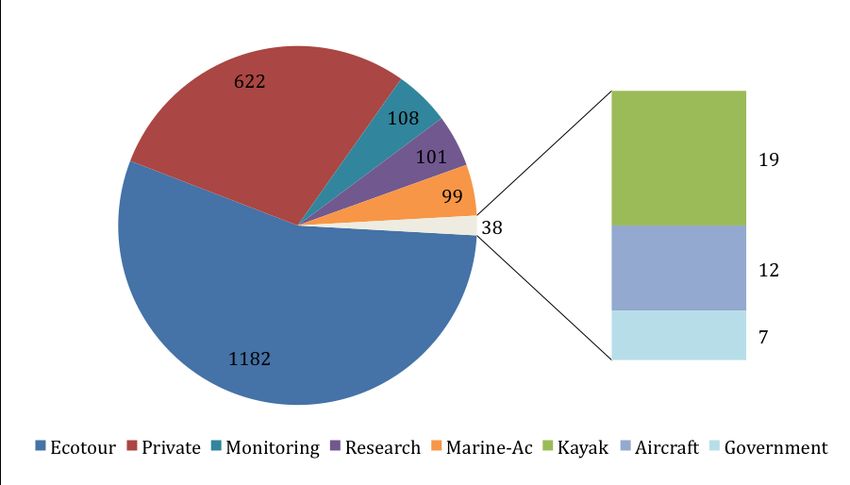
Resumo

         Muitas populações de mamíferos marinhos estão agora sujeitas a um aumento
da exposição às embarcações e sons associados. Barcos de pesca comerciais, barcos
de observação de cetáceos, embarcações de recreio, barcos de transporte de carga,
entre outros, têm aumentado dramaticamente por quase todo o planeta. Este aumento
generalizado do número de embarcações contribui de várias formas para a
degradação do ambiente marinho e seus habitantes.

         No Pacífico Nordeste são reconhecidas três formas distintas de orcas, Orcinus
orca, designadas de residentes, transeuntes e “offshores”. A distribuição geográfica
destas populações sobrepõe-se consideravelmente, no entanto são geneticamente
distintas (Stevens et al. 1989, Hoezel & Dover 1991, Hoezel et al. 1998, Barrett-
Lennard 2000, Barrett-Lennard & Ellis 2001, Hoezel 2004, Krahn et al. 2004). Também
exibem diferenças de comportamento, morfologia, ecologia e acústica (Baird 2000,
Ford et al. 2000). A população de orcas residentes integra quatro comunidades: sul,
norte, sul do Alasca e oeste do Alasca (Krahn et al. 2002, 2004). A designação de
“residente” vem de estudos iniciais (Bigg 1982), no entanto o desenvolvimento da
investigação veio mostrar que o termo não é indicativo dos padrões de movimentação
destas comunidades (Dahlheim & Heyning 1999, Baird & Whitehead 2000, Baird
2001).
         A população de orcas residentes do sul é constituída por 3 grupos de
matriarcados relacionados ou pods (J, K e L) e ocorre nas águas interiores (Estreito de
Georgia, Estreito de Juan de Fuca e Puget Sound) do Estado de Washington, EUA e
British Columbia, Canadá, principalmente durante o Verão e Outono. No entanto, esta
população ictiofágica concentra a sua actividade no Estreito de Haro (Hauser 2007),
ao longo da costa oeste da Ilha de San Juan, onde existem os principais corredores de
migração de salmão (Felleman et al. 1991, Ford et al. 2000).
         Entre 1996 e 2001, esta população sofreu um declínio drástico de quase 20%
(Krahn et al. 2002), o que resultou na sua classificação como “depleted” sob o US
Marine Mammal Protection Act (MMPA) e como “endangered” sob o US Endagered
Species Act (ESA) e sob o Canadian Species at Risk Act (SARA). Esta é uma
população que tem sido objecto de estudo por mais de 30 anos, no entanto, ainda é
desconhecida a principal causa deste declínio acentuado. A contaminação ambiental,
redução na abundância ou qualidade de presas (salmão-real, Oncorhynchus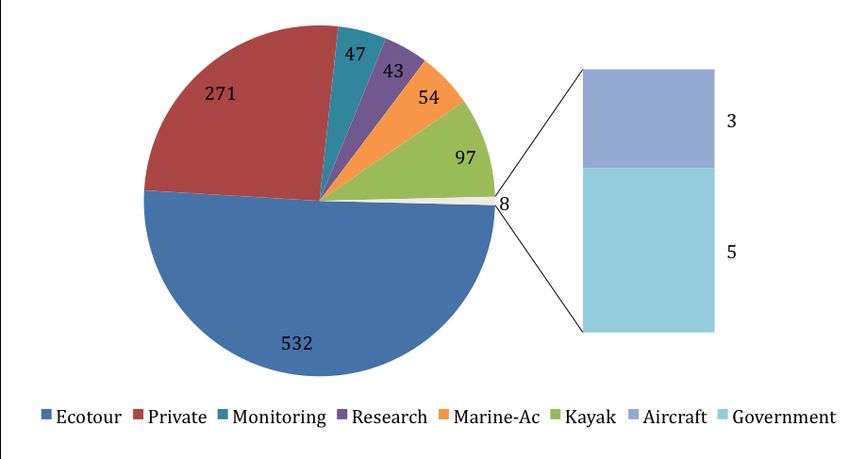
tshawytscha e salmão-cão, O. Keta) e distúrbios físicos e acústicos são apontadas
como as principais ameaças de origem humana (NMFS 2006).
       O tráfego de embarcações e a extraordinária concentração de barcos
comerciais com propósito de observação de orcas em Puget Sound estão incluídos
nas possíveis causas e podem ter contribuído de diversas formas para o declínio
observado. Ocasionalmente ocorrem colisões entre embarcações e orcas residentes
do norte que resultam em ferimentos ou morte dos animais (Visser 1999, Ford et al.
2000). Em 2005 foi observado um caso de colisão na população residente do sul (K.
C. Balcomb comunicação pessoal). A presença de embarcações pode causar stress
nos animais (Romano et al. 2004). O ruído causado pelas embarcações, ao interferir
com o seu sistema sensorial acústico altamente desenvolvido, além de potencialmente
poder suprimir os sinais de eco-localização (Bain & Dahlheim 1994) reduzindo a
eficácia na procura de presas, também interfere com o seu sistema de navegação e
comunicação com os outros indivíduos e pode provocar danos auditivos temporários
ou permanentes (Erbe 2002). Respostas comportamentais à presença das
embarcações podem resultar num aumento do dispêndio de energia ou interrupção e
redução da actividade alimentar, o que se traduz num balanço negativo de energia
(Bain & Dahlheim 1994, Gordon & Moscrop 1996, Erbe 2002, Williams et al. 2002a,
2002b).
       Em 1998, Hoyt (2001) estimou o valor da indústria de observação de cetáceos
em Washington em $13.6 milhões e em British Columbia em $69.1 milhões. Destes
valores, cerca de 60-80% provavelmente derivam da observação de orcas na Bacia de
Georgia e Puget Sound (Osborne, no prelo). A comunidade de Friday Harbor (San
Juan Island, Washington) é considerada por Hoyt (2001) uma das comunidades
transformadas pela indústria de observação de cetáceos, em termos de benefícios
económicos.
       Nesta região, o horário de funcionamento das companhias de observação de
cetáceos estende-se desde as 9:00 às 21:00H no Verão e até ao pôr-do-sol na
Primavera e início do Outono (Bain et al. 2006). Desde o nascer do sol e até ao fim do
dia, as orcas estão em contacto com embarcações, não só as de observação de
cetáceos mas também embarcações de recreio, embarcações de investigação
científica, embarcações de pesca desportiva e embarcações comerciais de transporte
de carga que estão presentes 24h por dia.
       Entre 1998 e 2008, uma média de quase 20 embarcações (comerciais,
privadas, de investigação, caiaques e outras) foi observada consistentemente, entre as
9:00 e as 18:00H, de Maio a Setembro, num raio de 804 metros (½ milha) em redor da
população de orcas residentes do sul (Koski 2008). Para o mesmo período de tempo,
o número máximo de embarcações observadas em redor das orcas, até uma distância
de 804 metros, variou de 69 a 120 barcos (Koski 2008).
Existem vários exemplos na literatura de que as perturbações crónicas podem
ser factores que reduzem a qualidade de vida dos animais, a eficiência de procura de
presas (Galicia & Balassarre 1997), o processo de acasalamento e estrutura social
(Lacy & Martins 2003) ou o sucesso reprodutivo dos animais (Safina & Burger 1983).
Nestas circunstâncias de reduzido tamanho populacional (nos últimos 18
meses 8 orcas morreram, sendo a população actual constituída por 85 indivíduos),
reduzida taxa de reprodução e existência de diversas ameaças de origem humana que
evitam a sua recuperação ou possivelmente causam um maior declínio populacional, é
urgente identificar meios de recuperação e conservação da população de orcas
residentes do sul.
Neste sentido, neste estudo foram feitas observações em três locais da costa
oeste da Ilha de San Juan, entre 15 de Junho e 25 de Setembro de 2008, com o intuito
de analisar a situação de tráfego de embarcações e inferir opções de medidas de
conservação para a população de orcas residentes do sul. Os locais escolhidos foram
Hannah Heights, Land Bank e County Park, todos eles caracterizados por grandes
concentrações de embarcações e pelo facto de as orcas estarem presentes
frequentemente e a uma distância reduzida da costa. Os dados recolhidos incluíram:
quantidade de embarcações presentes; tipo e actividade das embarcações; estados
de actividade das orcas e contabilização de comportamentos activos de superfície.
As observações relativas às embarcações foram estruturadas de acordo com a
distância ao observador e posição relativamente às orcas. Foram utilizadas quatro
categorias: “inshore of whales” (barco posicionado entre a costa e as orcas); a ¼ milha
(402 metros) do observador; a ½ milha (804 metros) do observador; campo de visão
(todas as embarcações presentes além de ½ milha do observador). As amostragens
foram realizadas sempre que as orcas estavam presentes num dos três locais de
estudo, a uma distância de ½ milha do observador.
O método de amostragem utilizado na recolha de dados foi o “scan sampling”,
a intervalos de 10 minutos, com excepção dos comportamentos activos de superfície
das orcas que foram registados continuamente.
Do total de 116 dias de esforço de amostragem, resultaram 42 dias (117horas)
de observação da actividade das orcas e embarcações. Foram feitas 329
observações; 188 em Hannah Heights, 108 em Land Bank e 33 em County Park. A
discrepância no número de observações em cada sítio é devida ao facto de os três
locais distarem pouco entre si (para o caso de Hannah Heights e Land Bank) e aofacto de que em County Park, na grande maioria dos dias em que as orcas estão
presentes, viajarem a uma distância superior a ½ milha da costa.
Durante o período de estudo, uma média de 517.8, 251.4 e 135.2 embarcações
foram contabilizadas em Hannah Heights, Land Bank e County Park, respectivamente.
O número máximo de barcos presentes num dado momento foi registado em County
Park, com um total de 69 embarcações envolvidas na actividade de observação de
cetáceos.
Nos três locais estudados, mais de 70% das embarcações observadas
encontravam-se a distâncias superiores a ½ milha da costa. Dentro de ½ milha da
costa, a maioria das embarcações presentes são embarcações comerciais, com
excepção de County Park, onde os caiaques representam 81% das embarcações.
Dentro de ¼ milha e “inshore of whales”, a maioria das embarcações presentes, são
embarcações privadas em Hannah Heights e caiaques em Land Bank e County Park.
Em Hannah Heights, foram contabilizadas um total de 2589 embarcações, das
quais 83% estavam no campo de visão (fora da ½ milha) e 17% a ½ milha do
observador. Das embarcações presentes dentro de ½ milha da costa, 8% eram barcos
comerciais de observação de cetáceos, 6% eram embarcações privadas, 2% caiaques
e 1% de outro tipo de embarcações.
Em Land Bank, foram contabilizadas um total de 1257 embarcações, das quais
84% estavam no campo de visão (fora da ½ milha) e 16% a ½ milha do observador.
Das embarcações presentes dentro de ½ milha da costa, 6% eram barcos comerciais
de observação de cetáceos, 4% eram embarcações privadas, 4% caiaques e 1% de
outro tipo de embarcações.
Em County Park, foram contabilizadas um total de 676 embarcações, das quais
73% estavam no campo de visão (fora da ½ milha) e 27% a ½ milha do observador.
Das embarcações presentes dentro de ½ milha da costa, 3% eram barcos comerciais
de observação de cetáceos, 1% eram embarcações privadas, 22% caiaques e 1% de
outro tipo de embarcações.
Em média, a maioria das embarcações são comerciais, no entanto as orcas
também atraem uma grande quantidade de embarcações privadas e caiaques. As
embarcações comerciais tendem a ficar afastadas da costa mais de ½ milha e as
embarcações privadas e caiaques navegam mais perto da costa e frequentemente
entre a costa e as orcas (principalmente em County Park). O número total de
embarcações é superior ao dobro da média de embarcações, o que significa que
nenhum dos valores é representativo das condições de tráfego de embarcações a que
esta população está sujeita.Julho e Agosto são os meses de maior actividade. O período de maior
actividade ocorre entre as 11:00 e as 16:00H, com uma pequena diminuição entre as
12:00 e as 13:00H. No entanto, os sítios estudados são usados regularmente por
quantidades consideráveis de embarcações, independentemente do mês e da hora do
dia.
Nos três locais de estudo, os comportamentos activos de superfície das orcas
ocorreram predominantemente quando poucas embarcações estavam presentes e a
actividade diminuíu com o aumento do número de embarcações. Esta tendência foi
particularmente forte em County Park (R2=0.529, F=15.592, P=0.002) e em Hannah
Heights (R2=0.718, F=15.325, p=0.008), mas menor em Land Bank (R2=0.385,
F=5.011, P=0.055). Apesar desta tendência, pequenos picos de ocorrência de
comportamentos activos de superfície foram observados em Land Bank e em County
Park, com 41 a 45 embarcações presentes, e com 21 a 25 embarcações presentes,
respectivamente.
Os efeitos da actividade humana nas populações animais são geralmente
inferidos e quantificados apartir de mudanças de comportamento verificadas nos
animais em resposta à presença humana e o grau de impacto humano medido desta
forma é posteriormente usado para definir prioridades de conservação.
No entanto, a complexidade do acesso aos impactos da actividade humana
nas populações animais, pode levar a conclusões incompletas e imprecisas (Bedjer et
al. 2006), que por sua vez comprometem os esforços de conservação.
É evidente que esta população está sujeita a uma grande pressão de tráfego
de embarcações. Devido à falta de dados relativos ao comportamento desta
população em situação de menor ou nenhum tráfego de embarcações, é
extremamente difícil avaliar quais serão as consequências a longo prazo desta
pressão turística.
No entanto, mudanças de comportamento de curto prazo foram observadas e
analisadas para as populações residentes do sul e do norte (Kruse 1991; Kriete 2002;
Williams et al. 2002a, 2002b, 2006, 2009; Foote et al. 2004; Bain et al. 2006; Noren et
al. 2007; Lusseau et al. 2009). Embora ainda seja incerto se é a presença e actividade
das embarcações, os sons por elas produzidos ou uma combinação destes factores
que causam impacto nos animais, é necessário que se adoptem medidas
precaucionárias que minimizem os impactos já observados e documentados.
Com este estudo foi possível inferir possíveis medidas para a promoção do
desenvolvimento sustentável do ecoturismo de observação de cetáceos na Ilha de San
Juan. Tendo ainda um grande grau de incerteza em relação a muitos aspectos doimpacto do ecoturismo nesta população são aqui propostas medidas de carácter
precaucionário para a regulação do tráfego de embarcações:
• Na costa oeste da ilha de San Juan, limitar ou interditar o acesso das
embarcações de observação de cetáceos, privadas e caiaques até ½ milha da costa,
durante o período do ano em que a população de orcas residentes do sul está
presente (Maio a Setembro). Com este estudo não foi possível abrangir toda a costa
oeste da ilha, no entanto existem evidências que a situação observada nestes três
locais estende-se por toda a costa (Koski 2008). Tendo em conta que mais de 70%
das embarcações que regularmente participam na actividade de observação de
cetáceos, encontram-se além de ½ milha de distância da costa, o impacto de fechar
esta área ao tráfego de embarcações seria mínimo e reduziria o tempo de exposição
às embarcações e sons associados;
• Limitar o número de licenças para a observação de cetáceos;
• Limitar o número de horas do dia permitidas para a actividade de
observação de cetáceos,
• Limitar o número de viagens que cada companhia efectua;
• Limitar o tempo de estadia com os animais;
• Incentivar a actividade de observação de cetáceos a partir da costa,
visto nesta ilha, as condições para tal serem extremamente vantajosas. Para este fim,
seria aconselhado a existência de estruturas de apoio e de suporte educacional.
Palavras-chave: orca, ecoturismo, observação cetáceos, regulação, embarcações.Table of Contents
List of Figures ..................................................................................................................ii
List of Tables .................................................................................................................. iii
1. Introduction................................................................................................................. 1
2. Methods...................................................................................................................... 4
2.1. Field site and Study population ........................................................................... 4
2.2. Sampling design .................................................................................................. 6
2.3. Data Collection .................................................................................................... 8
2.4. Sample Size ........................................................................................................ 9
2.5. Data analysis ....................................................................................................... 9
3. Results........................................................................................................................ 9
3.1. Vessel’s activity ................................................................................................. 10
3.1.1. Vessel’s activity throughout the season...................................................... 10
3.1.2. Vessel’s activity by month........................................................................... 12
3.1.3. Vessel’s activity by time of day ................................................................... 14
3.2. SABs and vessel density ................................................................................... 16
4. Discussion ................................................................................................................ 18
Bibliography.................................................................................................................. 25
iList of Figures
Figure 1. Study area, with stars indicating from West to East, approximately, the
location of County Park, Land Bank and Hannah Heights, respectively. ............... 4
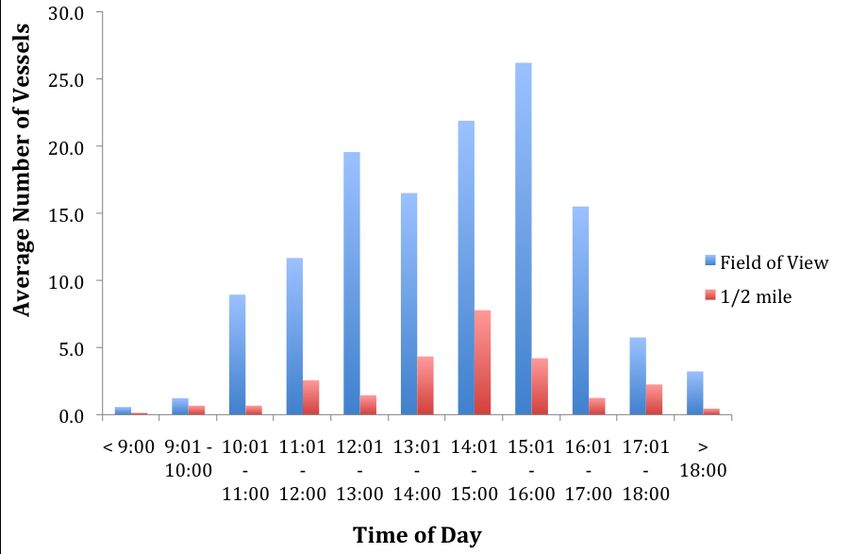
Figure 2. Vessels with whales, from June to September, within field of view............... 11
Figure 3. Vessels with whales, from June to September, within ½ mile (804m) from
shore..................................................................................................................... 11
Figure 4. Vessels with whales, from June to September, within 1/4 mile (402m) from
shore..................................................................................................................... 12
Figure 5. Vessels with whales, from June to September, on the inshore side of whales.
.............................................................................................................................. 12
Figure 6. Average number of vessels with whales within ½ mile from shore (divided by
categories Ecotour, Private and Kayak) and in the field of view, from June to
September, at the three study sites. ..................................................................... 14
Figure 7. Average number of vessels with whales by time of day, from June to
September, at the three study sites. ..................................................................... 16
Figure 8. Surface active behaviors (%) performed by southern resident killer whales,
from June to September on each study site. ........................................................ 17
Figure 9. Quantity of surface active behaviors performed in relation to the amount of
vessels present..................................................................................................... 18
iiList of Tables
Table 1. Definition of surface active behaviors performed by southern resident killer
whales, according to Noren et al. (2009). ............................................................... 7
Table 2. Vessel quantities, in the three study sites, from June to September.............. 10
iiiAcknowledgments
This thesis could not have been carried out without the support of Sharon Grace
and Paul Arons who welcomed me in San Juan Island as a part of their family. Their
invaluable contributions were crucial for the development of this work and for that I am
truly thankful.
I am also grateful for the support of The Whale Museum Soundwatch Boaters
Education Program, especially Kari Koski who guided me throughout the season. Many
researchers in the community also contributed to my work in several ways, particularly,
I would like to thank Giles and Jim, and Jeff and Amanda.
I greatly appreciate the help of Pedro Lucas, not only as a field assistant but,
and perhaps more, as a companion.
Several others have contributed to my thesis: Lynne Barre (from NOAA, for the logistic
assistance), Lime Kiln State Park, San Juan County Park, The Center for Whale
Research, Captain Hobbs, Johanna Smith and Danielle.
Lastly, I would like to thank my advisers, Filomena Magalhães and David Bain,
who guided through the development of this work.
iv1. Introduction
The worldwide increase of human communities along the coast, the recent shift
in the way people relate to whales, the demand for mass consumption and consequent
increase in possession of goods, along with the increase in number, safety and speed
of vessels has led to the spectacular growth of the whale watching industry. The
demand for high quality natural experiences, particularly those based on large
“charismatic” animals like whales appear to be limitless (Shackley, 1996).
In the northeastern Pacific Ocean, three distinct forms of killer whales Orcinus
orca are recognized: residents, transients, and offshores. The designations of
“resident” and “transient” originates from early studies (Bigg 1982), but succeeding
studies have shown that the terms are not representative of their movement patterns
(Dahlheim & Heyning 1999, Baird & Whitehead 2000, Baird 2001). These populations
do not interbreed so they are genetically distinct (Stevens et al. 1989, Hoezel & Dover
1991, Hoezel at al. 1998, Barrett-Lennard 2000, Barrett-Lennard & Ellis 2001, Hoezel
2004, Krahn et al. 2004). They also display differences in ecology, behavior,
morphology, and acoustics (Baird 2000, Ford et al. 2000). Four distinct communities
constitute the resident ecotype: southern, northern, southern Alaska, and western
Alaska (Krahn et al. 2002, 2004).
The southern resident population contains three pods – J pod, K pod, and L pod
– and occurs in Washington State, USA and British Columbia, Canada inshore waters
(Southern Strait of Georgia, Strait of Juan de Fuca, and Puget Sound), primarily in the
summer and fall (Bigg 1982, Ford et al. 2000, Krahn et al. 2002). Winter and early
spring movements are largely unknown but the southern residents are known to travel
as far south as Monterey Bay in central California and as far north as the Queen
Charlotte Islands, British Columbia. These piscivorous whales concentrate their
summer activity throughout Haro Strait (Hauser 2007) where are the major corridors of
migrating salmon (Felleman et al. 1991; Ford et al. 2000).
The southern resident population of killer whales experienced an almost 20%
decline from 1996 to 2001 (Krahn et al. 2002), resulting in their listing as ‘depleted’ in
May 2003 under the US Marine Mammal Protection Act (MMPA) and ‘endangered’ in
April 2004 under the US Endangered Species Act (ESA) and in June 2003 under the
Canadian Species at Risk Act (SARA). As the ESA requires, NOAA Fisheries as
designated critical habitat for the southern resident killer whales, on November 2006.
1Three areas were designated: a core summer area around the San Juan Islands, a
fall/winter area in Puget Sound and a transit corridor along the Strait of Juan de Fuca.
The major threats to the recovery of this distinct population segment (DPS)
include reduction in prey (chinook salmon, Oncorhynchus tshawytscha and chum
salmon, O. keta) availability and quality, pollution and contaminants, small population
size and effects from vessels and sound. Although intensive ecological and biological
research has been conducted on this DPS it is still unknown which of the factors have
caused the decline or if it was caused by one of the threats or the combination and
cumulative effects of exposure to all these factors.
Vessel traffic may have contributed to the decline through a variety of
mechanisms, including collisions (Ford et al. 2000), toxins from unburned fuel and
exhaust (Lachmuth 2008), stress (Ayres & Wasser unpublished data), and reduced
foraging efficiency due to masking of echolocation signals (Bain 2002, Williams et al.
2009).
Whale watching as a commercial endeavor — with important educational,
environmental, scientific, and other socioeconomic benefits — is now at least a $1
billion USD industry attracting more than 9 million participants a year in 87 countries
and territories (Hoyt 2001). In 1998, Hoyt (2001) estimated the value of the overall
whale-watching industry in Washington at US$13.6 million and in British Columbia at
US$69.1 million, based on estimated customer expenditures for tours, food, travel,
accommodations, and other expenses. An estimated 60-80% of this value likely
originated from the viewing of killer whales in the Georgia Basin and Puget Sound
(Osborne, unpublished data). The community of Friday Harbor, San Juan Island, was
considered by Hoyt (2001) to be one of the communities transformed by whale
watching.
A vast fleet of whale watching companies originating from nearby inland water
ports in the United Sates and Canada largely uses the core summer area of the
southern residents summer range (Hauser 2007). Operating from May to September,
the whale watching companies offer one to six daily trips (Osborne & Otis, 2000).
Commercial viewing activity runs from about 09:00 to 21:00 in summer, and until
sunset in spring and early fall (Bain et al. 2006). Apart from the whale watch industry
fleet, many other vessels use this area regularly, these include: private leisure vessels,
scientific research vessels, monitoring vessels, kayaks, seiners, gill-netters and freight
vessels.
The mean number of vessels following groups of killer whales during the peak
summer months increased from five boats in 1990 to 18-26 boats from 1996-2005
2(Osborne et al.1999, Baird 2001, Erbe 2002, Koski, 2008). Annual maximum counts of
72-120 boats were made near whales from 1998-2005 (Koski 2004, 2006).
It is evident that southern resident killer whales are exposed to a high level of
vessel traffic. As Hoyt (2001) denoted Haro Strait may well present a case of whale
watching in numbers greater than is ideal from the point of view of tourists and the
marine environment.
Effects of vessel traffic have been documented in a wide range of cetacean
species. These studies show that cetacean-watching tourism elicit long and short-term
behavioral changes which include stopping feeding, resting, social interaction and
abandoning nursing areas (Jurasz & Jurasz 1979; Baker et al. 1983; Dean et al. 1985;
Glockner-Ferrari & Ferrari 1985, 1990; Norris et al. 1985; Bauer & Herman 1986; Hall
1982; Krieger & Wing 1984; Salden 1988; Forest 2001; Morton & Symonds 2002;
Lusseau 2003a, 2005; Constantine et al. 2004; Bejder 2006a, 2006b); decreasing use
of primary habitats and even relocating to other areas (Allen & Read 2000; Lusseau
2005); changing travel patterns to avoid vessels (Au & Perryman 1982; Kruse 1991; Au
& Green 2000; Constantine 2001; Nowaceck et al. 2001; Williams et al. 2002a, 2002b;
Lusseau 2003b, 2006; Bejder et al. 2006a; Lemon et al. 2006; Williams & Ashe 2007);
altering spatial distribution among individuals (Au & Perryman 1982; Bejder et al. 1999,
2006a; Nowaceck et al. 2001; Jelinski et al. 2002); effects on acoustic behavior (Van
Parijs & Corkeron 2001); effects on energy budgets (Chilvers et al. 2003, Coscarella et
al. 2003; Lusseau 2003a, 2004; Constantine et al. 2004; King & Heinen 2004; Lemon
et al. 2006; Williams et al. 2006; Hodgson & Marsh 2007; Lusseau et al. 2009); and
altered surface and dive durations (Janik & Thompson 1996; Au & Green 2000; Jahoda
et al. 2003; Lusseau 2003a, 2003b; Ng & Leung 2003).
Furthermore, previous studies specifically concerning the southern resident
killer whales population have shown that vessel presence can have acoustic (Erbe
2002, Foote et al. 2004, Holt et al. 2009) and short-term behavioral impacts which may
result in increased energy expenditure, or disrupt feeding activity, which in turn may
reduce energy acquisition (Kruse 1991; Bain et al. 2006; Lusseau et al. 2009; Noren et
al. 2009; Williams et al. 2002a, 2006, 2009).
This study aimed to analyze the present situation of near shore vessel’s activity
when whales are present in the west coast of San Juan Island and to determine how
the performance of surface active behaviors (SABs) by southern resident killer whales
varies with the amount of vessels present. These behaviors imply energetic costs
(Yazdi et al. 1999) and given the present situation of this population with possible food
limitations (Ford et al. 2005), added energetic expenditures should be regarded with
concern.
3The analyses of these data was used to assess conservation measures that
can be taken to limit this population’s exposure to vessel traffic and associated sounds.
2. Methods
2.1. Field site and Study population
San Juan Island, Washington State (48º 33’ N, 123º 05’ W) is well known for its
whale watching industry. Killer whales are the main target species of the industry,
easily surpassing other species such as gray whales, porpoises, and pinnipeds (Hoyt
2001). Owing to the fact of being more reliable and predictable than transients or
offshores, the southern residents are the primary attraction for tourists.
Figure 1. Study area, with stars indicating from West to East, approximately, the location of
County Park, Land Bank and Hannah Heights, respectively.
This population has been studied and monitored for over 30 years, and in
addition the Center for Whale Research has gathered a photo-identification database
that allows the individual identification of each of the members of the southern
residents.
4The southern resident stock of killer whales peaked at 97 animals in the 1990’s
and then declined to 79 in 2001. On July 1, 2009, the population was composed by 85
individuals (Center for Whale Research, unpublished data).
Commercial, vessel-based, whale watching tourism in this region began in
1977. Between 1984 and 1998, it increased almost continuously until a peak of 80
vessels engaged in the activity (Osborne et al. 2002, Koski 2004). Since 2000, the
annual number of vessels has stabilized (Koski 2008). In 2008 there were 76 active
commercial whale watch vessels, of which 54 were from Canadian companies and 22
from U.S. companies.
Commercial whale-watching boats range in size and configuration from open
vessels measuring less than 7 m in length, capable of holding 6-16 people to large 30
m vessels which can carry up to 280 customers (NMFS 2006). Koski (2008) estimated
that over 500,000 people annually engage in whale watching in Haro Strait.
Consistently, from 1998 to 2006, an average of nearly 20 vessels have been observed
within a half-mile range of the whales between 09:00 and 18:00H from May to
September (Koski 2008).
Besides the commercial vessels, also private boaters, kayaks and small
numbers of aircraft participate in viewing whales whenever the opportunity arises.
Only very recently a state bill with the prohibition of approaching killer whales
within 100 yards (approximately 92 meters) was approved, becoming effective in June
2008.
Under the ESA and the MMPA the harassment of marine mammals by the
public, including commercial whale watch operators, is prohibited. The MMPA defines
harassment as “any act of pursuit, torment, or annoyance which: (i) has the potential to
injure a marine mammal or marine mammal stock in the wild; or (ii) has the potential to
disturb a marine mammal or marine mammal stock in the wild by causing disruption of
behavioral patterns, including, but not limited to, migration, breathing, nursing,
breeding, feeding, or sheltering” (MMPA 2007).
The Whale Watch Operators Association Northwest (WWOANW) has developed
the ‘Best Practices Guidelines’ for commercial operators to follow when observing
southern residents (WWOAN 2004). There are also the “Be Whale Wise” guidelines
developed by the National Marine Fisheries Service (NMFS) Northwest Regional Office
in partnership with The Whale Museum Soundwatch Boater Education Program (USA),
Straitwatch (Canada), commercial operators, whale advocacy groups, whale
researchers, and United States and Canadian government agencies and enforcement
divisions.
These guidelines recommend that boaters parallel whales no closer than 100
5yards, approach animals slowly from the side rather than from the front or rear, and
avoid putting the vessels within 400 yards (approximately 366 meters) in front of or
behind the whales. Vessels are also recommended to reduce their speed to less than 7
knots (13 km/h) within 400 yards of the whales, and to remain on the offshore side of
the whales near shore.
The guidelines specific for kayaks recommend that kayakers should not
intentionally position themselves in the path of whales, paddle into groups of whales or
chase whales. Kayakers should also leave a distance of at least 100 from whales,
position themselves towards the shore, raft up together and stop paddling.
2.2. Sampling design
From 12 June to 25 September 2008, the behavior of whales and the density of
boats were monitored from three land-based observation sites along the West coast of
San Juan Island. One site, hereafter referred to as Hannah Heights, was located at 48º
29’ 33’’ N, 123º 07’ 10’’ W. The other site was located at San Juan County Land Bank
(48º 30’ 22’’ N, 123º 08’ 32’’ W), a short distance North of Hannah Heights and
adjacent to Lime Kiln State Park. This site was chosen because, together with Lime
Kiln State Park and San Juan County Park, it provides daytime public access and it’s
one of the few places were whale watching is practiced from shore. These two sites
were chosen because whales are known to pass them frequently while traveling and
socializing (Felleman et al. 1991, Hoezel 1993, Heimlich-Boran 1988) very close to
shore.
The third site was located at approximately 11 miles (5Km) North of Land Bank,
at the San Juan County Park (48º 32’ 34’’ N, 123º 09’ 41’’ W). This site was chosen
because it is popular among kayakers as well as other boaters. It is a free launching
site for kayaks, and the great majority of the commercial companies in the island and
from other places use it to get access to the water. Furthermore, at this location, the
whales seldom travel close to shore.
The three sites are situated within the Whalewatch Exclusion Zone of the San
Juan County Marine Stewardship Area were there is a voluntary no-boat zone of ½
mile (804 meters) from the lighthouse beacon and ¼ mile (402 meters) offshore
elsewhere when whales are present.
At each site surface active behaviors, henceforth SABs (Table 1), and vessel’s
activity were surveyed concurrently.
6The data collected regarding vessel’s activity included counts of vessels by type
and activity, and by distance to the shore: within the field of view, within ½ mile (804m)
and ¼ mile (402m), and inshore of whales. The vessels considered on field of view,
were all the vessels present beyond ½ mile from shore. The vessels considered within
½ mile were all the vessels present from shore up to ½ mile (including the vessels at ¼
mile and inshore of whales). Also, the vessels considered at ¼ mile were all the
vessels present at this distance from shore and depending on the whale’s position, it
can also include vessels that are on the inshore side of whales.
In compliance with The Whale Museum Soundwatch Boaters Education
Program, a set of standardized vessel types and activities, established in 2007, and
agreed upon with US and Canadian management and research agencies, was used to
categorize vessel’s activity (Koski 2006).
Vessel activity categories included transiting; whale oriented; fishing; research,
enforcement; acoustic. Vessel type categories included ecotour vessels (Canadian,
US, kayak, aircraft); commercial (aircraft); private (aircraft, kayak/paddle, motor, sail);
marine (charter, fishing, tug with log barge, monitoring, cruise ship, tug with tow, ferry,
freighter); government (BC Parks, Coast Guard, DFO, military, NOAA, WDFW);
research.
Table 1. Definition of surface active behaviors performed by southern resident killer whales,
according to Noren et al. (2009).
Surface Active Behaviour Description
Breach The body of the whale clears the water completely and
then lands on the lateral or ventral side, generating a
large splash.
Cartwheel The whale performs an exaggerated tail slap by hurling the
posterior portion of the body, from the dorsal fin to the tail,
out of the water and over its head. The entire posterior end
of the whale (dorsal, lateral or ventral side up) lands,
generating a large splash.
Dorsal Slap The whale slaps the water with its dorsal fin by rolling onto
its side with force, generating a splash.
Half breach One half to two-thirds of the anterior portion of the whale
7clears the water and then lands on the lateral or ventral side,
generating a large splash.
Pectoral fin slap The whale slaps one or both pectoral fins (ventral or lateral
side up), generating a splash.
Spyhop The whale rises vertically out of the water so that the both
eyes are exposed. The pectoral fins can either be in or out of
the water.
Tail slap The whale slaps its tail (dorsal or ventral side up) on the
surface of the water, generating a splash.
2.3. Data Collection
Shore-based observations were conducted whenever the whales were present
at one of the field sites within a ½ mile (804 meters) range from the shore, following a
research schedule based on a combination of reports from monitoring of VHF
commercial traffic and the local sighting network. Vessel and whale positions and
activity were recorded using a Bushnell 40x spotting scope and binoculars. Distances
were measured using a TruPulse laser range finder hypsometer.
Scan sampling was conducted at 10 minute intervals to characterize the activity
state and the number of vessels within the field of view, within an ½ mile (804 meters),
and a ¼ mile (402 meters) radius from shore, and on the inshore side of whales.
Taking in consideration that the distances from shore to the vessels were taken
using a laser range finder pointing to different vessels in a semi circular area, distances
to vessels directly out in front of the observer are accurate but there is a source of error
for distances taken to vessels not straight out from the observer position, these vessels
were, in some circumstances, closer to shore.
Continuous, all-occurrence sampling was used to collect SABs. All SABs were
pooled, regardless of the individuals sex, age, and pod membership. Having in
consideration that Williams et al. (2009), found no sex-specific or age-specific
differences in SABs performance in the southern resident population.
82.4. Sample Size
The observations were conducted whenever the whales were present at the
study sites, and the weather conditions were suitable (data taken in rain, fog, or
Beaufort sea state over 3 conditions was neglected). Data were collected from all three
killer whale pods (J, K, L).
In total 116 days were spent searching for whales, and 42 days (117 hours)
were spent monitoring vessel’s and whales’ activity. In these 42 days, 329 observations
were made: 188 at Hannah Heights, 108 at Land Bank and 33 at County Park.
The discrepancy in observations at the three sites is due to the movements and
speed of the whales. Often, when going up the island the whales would change to the
opposite direction and vice versa or would gain speed, making it impossible to observe
their activity in all three sites. Furthermore, the small quantity of data at County Park is
explained through the fact that the whales travel by this site in a very different manner,
compared to the first two sites. In the bulk of the time spent at this location the whales
were outside the ½ mile study area.
2.5. Data analysis
Data analysis focused on quantifying variation in vessel activity among
locations, months and time of day. Descriptive statistics (i.e. means and standard
deviations) were calculated for each variable, and pie charts and histograms were
produced when necessary.
Statistical associations between SABs performance and vessel’s density were
quantified using linear regression analyses (Zar 1996).
The data collected were analyzed using Excel 2004 (Microsoft) and the
Statistica 7.0 software. Significance of statistical testing was set at P3.1. Vessel’s activity
From June to September, 329 scans were conducted and subsequently
analyzed. Throughout the season southern resident killer whales have had an average
of 13.8, 11.6 and 20.5 at Hannah Heights, Land Bank and County Park respectively,
vessels around them. The maximum number of vessels observed in a moment with
whales was 69 at County Park.
3.1.1. Vessel’s activity throughout the season
At Hannah Heights and Land Bank (Table 2), the proportion of vessels within
field of view and ½ mile ranges are very similar, with over 80% of the vessels present
outside the ½ mile range and only 17% and 16%, inside the ½ mile range, respectively.
Also proportion of vessels by categories inside the ½ mile range is almost identical,
with commercial whale watch vessels in majority followed by private vessels and
kayaks.
At County Park, the proportion of vessels inside the ½ mile range increases to
nearly 30% and the majority of vessels observed inside this range are kayaks reaching
22%(Table 2).
Table 2. Vessel quantities, in the three study sites, from June to September. N=total number of
observations; n=total number of vessels present throughout the season.
Average number Vessels in Vessels at Vessels at 1/2 mile
of vessels field of view (%) 1/2 mile (%) by categories (%)
per observation
Hannah Heights 13.8 83 17 8 Ecotour
N=188 6 Private
n=2589 2 Kayak
1 Others
Land Bank 11.6 84 16 6 Ecotour
N=108 4 Private
n=1257 5 Kayak
1 Others
County Park 20.5 73 27 3 Ecotour
N=33 1 Private
n=676 22 Kayak
1 Others
10The observations conducted in the field of view range (Figure 2) show a
majority (more than 50%) of commercial whale watch vessels present for the three
study sites, followed by private vessels (more than 20%). Differences occur in the case
of the kayaks, which are predominantly present at County Park.
In the ½ mile range (Figure 3) at Hannah Heights, as in the field of view, the
majority of vessels present are commercial whale watch vessels followed by private
vessels. Yet, the amount of kayaks increases in the ½ mile range, relatively to field of
view. At Land Bank, commercial whale watch boats are also in majority but now
followed by kayaks and after by private vessels. In County Park the setting changes
dramatically, with kayaks representing almost the totality of vessels present.
Within a ¼ mile from shore (Figure 4) and on the inshore side of whales (Figure
5) we can observe a similar situation. At Hannah Heights the majority of boats present
are private vessels, followed by kayaks. At Land Bank and County Park, almost
exclusively kayaks are present.
Hannah Heights Land Bank County Park
Figure 2. Vessels with whales, from June to September, within field of view.
Hannah Heights Land Bank County Park
Figure 3. Vessels with whales, from June to September, within ½ mile (804m) from shore.
11Hannah Heights Land Bank County Park
Figure 4. Vessels with whales, from June to September, within 1/4 mile (402m) from shore.
Hannah Heights Land Bank County Park
Figure 5. Vessels with whales, from June to September, on the inshore side of whales.
3.1.2. Vessel’s activity by month
The total monthly number of vessels in the field of view for Hannah Heights
reached its peak in August, with 958 vessels. The monthly maximum number of
vessels was 553 whale watch vessels in July. Within the ½ mile range, from June to
September, 212 commercial whale watch vessels were observed followed by 123
private vessels and 38 kayaks. The monthly maximum number of vessels observed
was 120 whale watch vessels in July. Within the ¼ mile range and inshore of whales
the category with the monthly maximum number of vessels was private vessels with 16
in August.
The total monthly number of vessels in the field of view for Land Bank reached
its peak in August, with 544 vessels. The monthly maximum number of vessels was
257 whale watch vessels in July. Within the ½ mile range, from June to September, 73
commercial whale watch vessels were observed followed by 68 kayaks and 51 private
vessels. The monthly maximum number of vessels observed was 42 whale watch
vessels in August. Within the ¼ mile range and inshore of whales the category with the
monthly maximum number of vessels was kayaks with 37 in August.
12The total monthly number of vessels in the field of view for County Park reached
its peak in July, with 252 vessels. The monthly maximum number of vessels was 143
whale watch vessels in July. Within the ½ mile range, from June to September, 150
kayaks were observed followed by 17 commercial whale watch vessels and 10 private
vessels. The monthly maximum number of vessels observed was 61 kayaks in August.
Within the ¼ mile range and inshore of whales the category with the monthly maximum
number of vessels was kayaks with 49 and 57, respectively, both registered in August.
The monthly average number of vessels with whales (Figure 6) is below 1 within
½ mile from shore, for whale watch vessels and private vessels in the three study sites.
The average number of kayaks is clearly higher at County Park with an average
number of 6.8 kayaks and an average of nearly 1 for Hannah Heights and Land Bank.
In the field of view, the average number of vessels is much higher than in the ½
mile in all three sites. At Hannah Heights the average number of vessels present
reached 17.6 in September, in Land Bank 14.7 in August, and in County Park 20.1 in
August.
The busiest months are July and August in all three sites.
Hannah Heights
13Land Bank
County Park
Figure 6. Average number of vessels with whales within ½ mile from shore (divided by
categories Ecotour, Private and Kayak) and in the field of view, from June to September, at the
three study sites.
3.1.3. Vessel’s activity by time of day
In Hannah Heights and Land Bank, vessels were constantly present from before
09:00 until after 18:00. In County Park, there is an interruption between 13:00 and
1414:00. In all three sites, the hours between 11:00 and 16:00 are the busiest, with a
slight decrease around 12:00 and 13:00 (Figure 7).
Hannah Heights
Land Bank
15County Park
Figure 7. Average number of vessels with whales by time of day, from June to September, at
the three study sites.
3.2. SABs and vessel density
The occurrence of the seven specific display behaviors (Table 1) selected for
analyzes was observed in 29% of the observations made at Hannah Heights, in 39% of
the observations at Land Bank and in 48% of the observations made at County Park.
Tail slaps were the most frequently observed type of behavior in all three sites
(Figure 8), representing practically half of the total observations in Hannah Heights and
surpassing 50% in Land Bank. In County Park, tail slaps were observed fewer times
than in the prior sites, representing almost 40% of the observations.
The second most observed behavior was breach, being more represented in
County Park, with 34%. The other behaviors were observed in a lesser degree, and
cartwheel was seldom observed.
In all three sites, SABs occurred predominantly when fewer vessels were
present, decreasing as the amount of vessels increased (Figure 9). At Hannah Heights
and County Park, the majority of SABs occurred in the presence of 0 to 25 vessels. At
Land Bank, the performance of SABs was greater when 0 to 15 vessels were present.
Aside from this observed trend, a small peak in SABs occurrence was observed in
16Land Bank and County Park, with 41 to 45 vessels present, and with 21 to 25 vessels
present, respectively.
This trend was strong in County Park (R2=0.529, F=15.592, P=0.002) and
Hannah Heights (R2=0.718, F=15.325, p=0.008), but slighter in Land Bank (R2=0.385,
F=5.011, P=0.055).
Hannah Heights Land Bank County Park
Figure 8. Surface active behaviors (%) performed by southern resident killer whales, from June
to September on each study site.
Hannah Heights
17Land Bank
County Park
Figure 9. Quantity of surface active behaviors performed in relation to the amount of vessels
present.
4. Discussion
Overall, the majority of vessels present tend to be whale watch vessels.
However the vessels that come closer to shore are private vessels and kayaks. With
extremely few exceptions, all the boats observed are whale oriented.
18There is a lot of variation in the number of vessels around the whales, and the
maximum number was more than double the mean number.
July and August are the most crowded months and June and September tend to
have less traffic. Nevertheless, altogether the three sites studied are used regularly by
a considerable amount of vessels, independently of the month or time of the day.
In compliance with the Whale Watch Operators Association Northwest
voluntarily imposed code of conduct, the commercial whale watch vessels, with some
exceptions, tend to stay out of the ½ mile range from shore, although this type of
vessels represents the majority of vessels present in this range. Contrarily, the private
boaters and kayaks get much closer to shore and often on the inshore side of whales.
This is not surprising, regarding that many of the private boaters come from other
regions in the country and may not be informed on the “Be Whale Wise” guidelines.
Nevertheless, even after being informed several private boaters keep on approaching
the whales and the shore, more often than what it would be desirable (personal
observation). The kayaks are generally in compliance with the recommendations,
which advises them to stay close to shore. Nevertheless a substantial amount of
kayakers (including commercial companies) do go outside the ½ mile range from shore
to follow the whales.
The scenery in the field of view and ½ mile from shore at Hannah Heights and
at Land Bank is very similar with whale watching vessels representing the bulk of
vessels present, followed by private vessels and small quantities of kayaks. Although in
Land Bank the quantity of kayaks is higher than in Hannah Heights.
County Park is a free launching site for kayakers, therefore the great number of
this type of vessel present in this study site. In the field of view range, the same
tendency of the prior study sites remains, but in the ½ mile range, the number of
kayaks surpasses the quantities of whale watch and private vessels.
Although the function of performing SABs is still poorly understood, these
behaviors are performed during several contexts and have been associated with
several purposes. In previous studies of killer whales SABs have been associated to
vessel approaches (Duffus & Baird 1995; Noren et al. 2009; Williams et al. 2002a, b,
2009), to social behavior (Ford et al. 2000) and to feeding behavior (Simila & Ugarte
1993). Other studies with cetaceans, associate the performance of SABs to sexual and
aggressive behaviors (Cephalorhynchus hectori, Sloten 1994) and to social behaviors
(Physeter macrocephalus, Waters & Whitehead 1990).
It is worth mentioning that, during this study, in one close encounter between a
kayak and a calf, the progenitor relocated herself between the kayak and the calf and
19You can also read