Genome-wide assessment elucidates connectivity and the evolutionary history of the highly dispersive marine invertebrate Littoraria flava ...
←
→
Page content transcription
If your browser does not render page correctly, please read the page content below
Biological Journal of the Linnean Society, 2021, 133, 999–1015. With 5 figures.

Genome-wide assessment elucidates connectivity and
the evolutionary history of the highly dispersive marine
invertebrate Littoraria flava (Littorinidae: Gastropoda)
THAINÁ CORTEZ1,*, , RAFAEL V. AMARAL1, THADEU SOBRAL-SOUZA2 and

                                                                                                                              Downloaded from https://academic.oup.com/biolinnean/article/133/4/999/6272942 by guest on 10 August 2021
SÓNIA C. S. ANDRADE1,
Departamento de Genética e Biologia Evolutiva, Universidade de São Paulo, SP, Brazil
1

Departamento de Botânica e Ecologia, Universidade Federal do Mato Grosso, Cuiabá, MT, Brazil
2

Received 2 February 2021; revised 13 March 2021; accepted for publication 14 March 2021

An important goal of marine population genetics is to understand how spatial connectivity patterns are influenced
by historical and evolutionary factors. In this study, we evaluate the demographic history and population structure
of Littoraria flava, a highly dispersive marine gastropod in the Brazilian intertidal zone. To test the hypotheses that
the species has (1) historically high levels of gene flow on a macrogeographical spatial scale and (2) a distribution
in rocky shores that consists of subpopulations, we collected specimens along the Brazilian coastline and combined
different sets of genetic markers (mitochondrial DNA, ITS-2 and single nucleotide polymorphisms) with niche-based
modelling to predict its palaeodistribution. Low genetic structure was observed, as well as high gene flow over long
distances. The demographic analyses suggest that L. flava has had periods of population bottlenecks followed by
expansion. According to both palaeodistribution and coalescent simulations, these expansion events occurred during
the Pleistocene interglacial cycles (21 kya) and the associated climatic changes were the probable drivers of the
distribution of the species. This is the first phylogeographical study of a marine gastropod on the South American
coast based on genomic markers associated with niche modelling.

ADDITIONAL KEYWORDS: ecological niche modelling – Littorinidae – marine connectivity – phylogeography
– population genomics.

                    INTRODUCTION                                   that this presumption is not entirely true (Bucklin,
                                                                   2000; Cowen, 2000; Launey, 2002; Taylor, 2003;
Molluscs are the second largest phylum in terms of the
                                                                   Rynearson & Armbrust, 2004; Sotka et al., 2004;
number of species and play a fundamental role in rocky
                                                                   Carini & Hughes, 2006; Kramarenko & Snegin, 2015).
shore communities. Similar to most coastal marine
                                                                   The genetic differentiation of the populations of rocky
invertebrates, these species often have a sedentary
                                                                   shore molluscs depends not only on dispersal capacity
adult phase following a pelagic larval period, during
                                                                   but also on larval duration and behaviour, local
which gene flow occurs among populations. Therefore,
                                                                   adaptation, hydrographical barriers and life-history
larval dispersal success potentially plays a crucial role
                                                                   traits (Palumbi, 2003; Ayre et al., 2009).
in connectivity in populations, recolonization rate,
                                                                     Highly heterogeneous environments, such as rocky
species distribution and local population persistence/
                                                                   shore intertidal zones, present physical and biological
extinction over time in marine ecosystems (Levin,
                                                                   gradients over short geographical distances. Such
2006; Cowen & Sponaugle, 2009). It has been widely
                                                                   heterogeneity can be measured by several predictors
assumed that the pelagic larval phase facilitates
                                                                   and could favour different genotypes in different
dispersal over broad scales, in turn promoting high
                                                                   microhabitats (Carini & Hughes, 2006; Funk et al., 2012;
levels of gene flow and geographically uniform genetic
                                                                   Kramarenko & Snegin, 2015). Littorinids are a taxonomic
structure. Nonetheless, several studies have shown
                                                                   group of herbivorous gastropods that inhabit the global
                                                                   intertidal zones. For example, Littoraria flava (King &
*Corresponding author. E-mail: thainacortez@usp.br and             Broderip, 1832) has a continuous and broad distribution
soniacsandrade@ib.usp.br                                           in the supratidal areas of rocky shores and estuarine

© 2021 The Linnean Society of London, Biological Journal of the Linnean Society, 2021, 133, 999–1015                  999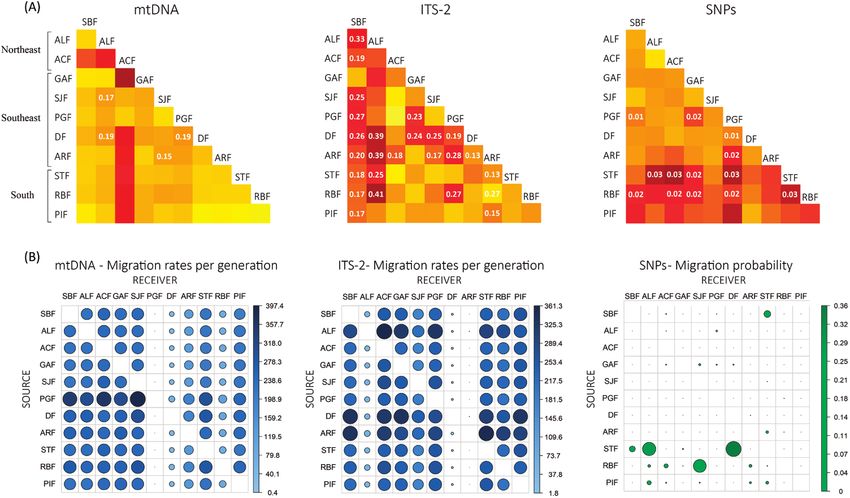
1000     T. CORTEZ ET AL.

environments of the Western Atlantic Ocean (Beasley             south-eastern (SE) and southern (S) regions of the
et al., 2005; Reid et al., 2010; Rodrigues et al., 2016; Lima   Brazilian coast (Fig. 1) under the Instituto Chico
et al., 2017). Although the adults are relatively sedentary,    Mendes de Conservação da Biodiversidade licence
its planktotrophic larvae show great dispersal capacity,        no. 56726-1. In six of the 11 localities, samples were
with durations ranging between 3 and 10 weeks (Reid,            collected along horizontal transects in the supralittoral
1986, 1999; Rios, 1994).                                        zone toward the sea, according to the experimental
   The gene flow dynamics in L. flava have been                 design of Andrade & Solferini (2007). The distances
assessed from allozyme markers (Andrade et al., 2005;           among the sites were established using the following
Andrade & Solferini, 2007), which revealed a moderate           formula: Dn = 2n−1, where D is the distance in metres
genetic structure at the macrogeographical scale and            and n is the sequence number of the site. The samples
strong variation across only a few metres, based on             were collected within 1 m2 of the marked point at sites

                                                                                                                                 Downloaded from https://academic.oup.com/biolinnean/article/133/4/999/6272942 by guest on 10 August 2021
subpopulations within single rocky shores. These                0, 4, 8, 16, 32 and 64 m along the transect. Three sites
findings suggest asynchronous spawning associated               with the highest specimen abundance in each transect
with recurrent colonizations, as mostly reported for            were sampled. The approach allowed the investigation
direct developing species (Janson, 1987; Johannesson            of genetic structure at both the macro and micro spatial
& Tatarenkov, 1997; Tatarenkov & Johannesson, 1999).            scales. For mtDNA and ITS-2 sequencing, at least two
The ecological importance of L. flava (Reid, 1986,              individuals from each locality were selected, without
1999) and its extensive geographical distribution, high         discerning the sites within transects. The collected
abundance and highly dispersive larvae with short               individuals were stored in liquid nitrogen until DNA
generation time are conducive for investigations on             extraction.
genetic connectivity in marine ecosystems at both the
broad and narrow scales.
   Here, we aimed to assess the population dynamics              DNA extraction, amplification and sequencing
and phylogeographical patterns underlying the                   Genomic DNA was extracted according to the CTAB
connectivity of a non-model organism, L. flava. To              protocol of Doyle & Doyle (1987). DNA integrity
gain insights into the demographic history of the               was checked by 1% agarose gel electrophoresis
species, we combined genetic data from genomic single           and quantified using a dsDNA BR Assay kit
nucleotide polymorphisms (SNPs), mitochondrial DNA              (Invitrogen, Carlsbad, CA, USA) on a Qubit v3
(mtDNA) and nuclear internal transcribed spacer 2               fluorometer (Invitrogen). Partial sequences of the
(ITS-2) with palaeoclimatic simulations to predict the          mitochondrial genes cytochrome oxidase subunit
palaeodistribution of the species. Based on the dispersal       1 (COI), 16S ribosomal RNA (16SrRNA) and the
capacity of L. flava in the highly heterogeneous                ITS-2 were obtained for subsequent analyses. The
intertidal environment, we (i) reconstructed a likely           COI fragment was amplified using the primer pair
demographic scenario using coalescent methods in                LCO1490/HCO2198 (LCO1490: 5′-GGTCAACAA
Brazilian populations to determine their connectivity           ATCATAAAGATATTGG-3′, HCO2198: 5′-TAAAC
levels and (ii) expected to reveal the genetic structure        TTCAGGGTGACCAAAAAATCA-3′, Folmer et al.,
at the microspatial scale (Andrade & Solferini, 2007).          1994). The primer sets 16SrRNAH/16SrRNAR
To the best of our knowledge, this is the first study           (16SrRNA-H: 5′-CGCCTGTTTATCAAAAACAT-3′,
to elucidate the evolutionary history and connectivity          16SrRNA-R: 5′-CCGGTCTGAACTCAGATCACGT-3′,
patterns of a widespread marine invertebrate on the             Palumbi, 1991) and ITS-1F/jfITS-1-3r (ITS-1F:
Brazilian coast by combining genome-wide genetic                5′-GTTTCCGTAGGTGAACCT-3′, Rokicka et al.,
markers, mtDNA and palaeoclimate simulations.                   2007; jfITS-1-3r: 5′-GAGCCGAGTGATCCACCGC
                                                                TAAGAGT-3′, Dawson & Jacobs, 2001) were used
                                                                for amplification of 16SrRNA and ITS-2 partial
                                                                sequences.
           MATERIALS AND METHODS
                                                                  Polymerase chain reactions (PCRs) were carried
To assess the population dynamics and demographic               out in a total volume of 20 µL containing 1 × PCR
history of L. flava, we applied the methodological steps        buffer, 2.5 U Taq DNA Polymerase, 1.5 mM MgCl 2,
illustrated in Supporting Information Fig. S1 and               200 μM of each dNTP, 0.35 µM of each oligonucleotide
detailed in the following sections.                             and ultrapure water to achieve the reaction volume
                                                                (Taq PCR Master Mix, Qiagen). The cycling profile
                                                                on the thermal cycler involved a denaturation step at
        Sampling and experimental design                        94 °C for 1 min, 35 cycles of denaturation at 94 °C for
Ninety-three L. flava individuals were collected                1 min; annealing temperature for 1 min, extension at
between January 2018 and January 2019 from 11                   72 °C for 1 min; and extension at 72 °C for 10 min.
locations distributed across the north-eastern (NE),            Annealing temperatures were 52.5 °C for COI, 51 °C

                          © 2021 The Linnean Society of London, Biological Journal of the Linnean Society, 2021, 133, 999–1015
L. FLAVA CONNECTIVITY AND DEMOGRAPHIC HISTORY                            1001

                                                                                                                                 Downloaded from https://academic.oup.com/biolinnean/article/133/4/999/6272942 by guest on 10 August 2021
Figure 1. Distribution of sampling locations along the Brazilian coastline. The blue dots indicate sampling collection
points, and the orange dots indicate the occurrence points of Littoraria flava, according to GBIF, used in the niche modelling
analyses.

for 16SrRNA and 49 °C for ITS-2. PCR products were                     Library construction and SNP calling
purified with polyethylene glycol solution 15% (PEG)             Individual libraries were generated based on the
and then amplified for sequencing using a BigDye                 genotyping-by-sequencing method described by
Terminator Cycle Sequencing Kit v.3.1 (Applied                   Elshire et al. (2011). Briefly, the genomic DNA of each
Biosystems) at the Myleus Sequencing Facility (Belo              sample was digested with the PstI restriction enzyme
Horizonte, Brazil).                                              (5′-CTGCAG-3′) and ligated to barcode and common
  Chromatograms were analysed using Geneious                     adaptors with appropriate sticky ends. The products
v.9.1.8 (Biomatters Ltd), which was used to perform              were grouped into sets of 40–53 samples and then
BLAST searches (http://blast.ncbi.nlm.nih.gov) to check          amplified by PCR using generic primers matching the
for contamination or sequencing errors. Individual               common adaptors under the following conditions: 5 min
consensus sequences were aligned using MEGA v.7.0                at 72 °C, 30 s at 98 °C, 18 cycles of 10 s at 98 °C, 30 s at
(Kumar et al., 2016). The 16SrRNA and COI data                   65 °C and 30 s at 72 °C, and an extension step of 5 min
were concatenated with DnaSP v.5.10.01 (Librado &                at 72 °C. The presence of spare adapters and the sizes
Rozas, 2009) into a mitochondrial haplotype (mtDNA).             of the DNA fragments were assessed by quantification
Based on the heterozygous sites, the phased haplotypes           on an Agilent 2100 Bioanalyzer (Agilent Technologies)
of ITS-2 were obtained with PHASE (Stephens &                    with the Agilent DNA 1000 kit and by quantitative
Donnelly, 2003) from DnaSP, according to IUPAC                   PCR on a Light Cycler 480II (Roche) with a Kapa
ambiguity codes and using a minimum posterior                    Biosystems kit for library quantification. Libraries
probability of 0.9 (Garrick et al., 2010). Finally, the          were constructed by EcoMol Consultoria (Piracicaba,
mtDNA and ITS-2 haplotypes were concatenated with                SP, Brazil), and sequencing was performed at the
DnaSP into a final single haplotype. In summary, three           Center for Functional Genomics Applied to Agriculture
different datasets were obtained: the mitochondrial              and Agroenergy (Animal Biotechnology Laboratory,
DNA (mtDNA with COI + 16SrRNA), nuclear DNA                      LZT/ESALQ/USP, Piracicaba, SP, Brazil) on a HiSeq
(ITS-2) and concatenated (mtDNA + ITS-2) datasets.               2500 platform (Illumina Inc., San Diego, CA, USA).

© 2021 The Linnean Society of London, Biological Journal of the Linnean Society, 2021, 133, 999–1015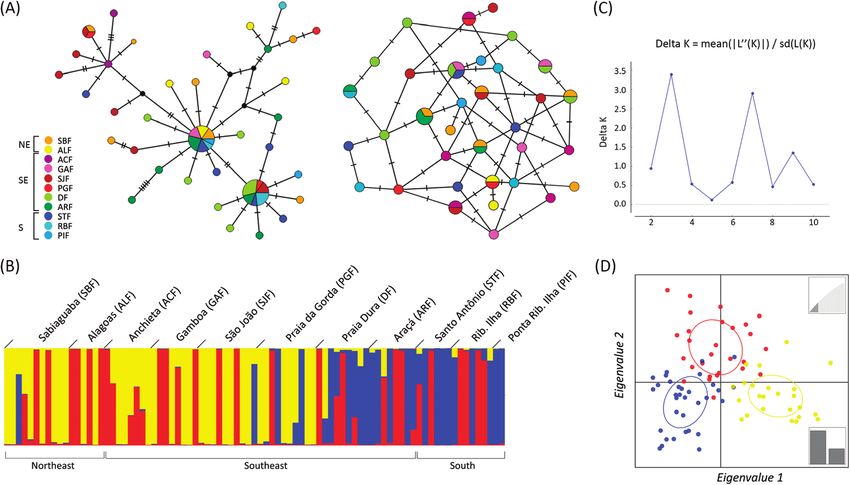
1002    T. CORTEZ ET AL.

   The SeqyClean pipeline (Zhbannikov et al.,                 and 200 sampling increments with a burn-in of 20 000
2017) was used to filter out sequences smaller than           were applied, in addition to an adaptive heating
50 bp and remove adapter sequencess and other                 scheme.
contaminants from the UniVec database (NCBI, ftp://
ftp.ncbi.nlm.nih.gov/pub/UniVec/). The iPyrad v.0.7.28
program (Eaton, 2014) was used to assign reads to             Single nucleotide polymorphisms
individual samples and to edit and cluster reads into         Clustering analyses was performed on SNPs from (1)
consensus sequences through paralogue identification.         all sampled individuals from the 11 localities and (2)
The density of missing data per locus was analysed            individuals within each transect, separately, using the
through matrix occupancy (de Medeiros & Farrell,              Bayesian method in STRUCTURE v.2.3.4 (Pritchard
2018). The obtained VCF file (Variant Call Format)            et al., 2000). After the most likely lambda (λ) was

                                                                                                                               Downloaded from https://academic.oup.com/biolinnean/article/133/4/999/6272942 by guest on 10 August 2021
was converted to other program-specific input formats         determined according to the author’s recommendation,
using PGDSpider v.2.1.15 (Lischer & Excoffier, 2012).         the population number (K) was allowed to vary from
PLINK (Purcell et al., 2007) was used to remove SNPs          1 to 11. The program ran each K-value 20 times with
with minimum allele frequency lower than 1%, missing          a burn-in of 50 000, followed by 1 000 000 MCMC
genotypes higher than 20% and linkage disequilibrium          iterations. The most likely number of genetic groups
(r2 = 0.50).                                                  was selected based on ΔK using STRUCTURE
                                                              HARVESTER (Earl & vonHoldt, 2012) and graphically
                                                              illustrated using the pophelper package (Francis, 2017)
                 Genetic diversity                            implemented in R. Discriminant analysis of principal
The number of haplotypes (H), number of polymorphic           components (DAPC, Jombart, 2008) was implemented
sites (S), number of segregating sites (θ S ) and             using the adegenet package to describe the genetic
nucleotide diversity (θ π) were measured for mtDNA            variance among the data. The analysis was performed
and ITS-2 data per location in Arlequin v.3.5 (Excoffier      with the clusters identified by STRUCTURE as
& Lischer, 2010). Multi-loci estimates of expected            prior information, and with a number of principal
heterozygosity (H E ) and observed heterozygosity             components (PCs) selected according to the α-score
(HO) were calculated for SNPs, also in Arlequin. The          function. Genetic differentiation was assessed with
fixation index FIS (Weir & Cockerham, 1984) across loci       AMOVA, following the methodology and hierarchical
and its significance were computed with the adegenet          levels applied for mtDNA and ITS-2 markers. Within
package v.1.4 (Jombart, 2008) in R (R Core Team, 2013)        transects, each site was considered a population unit,
with 10 000 permutations, 10 000 dememorization and           which were also tested for the isolation-by-distance
100 000 Markov chains Monte Carlo (MCMC) steps                (IBD) model using the Mantel test implemented in
(P < 0.05).                                                   adegenet (10 000 permutations). For that, based on the
                                                              localities’ coordinates, the geographical distances were
                                                              transformed into Euclidean distances using the dist
               Population structure                           function of R.

Mitochondrial DNA and ITS-2
Minimum spanning networks (MSNs) were constructed                    Demographic history and niche-based
in PopART v.1.7 (Leigh & Bryant, 2015) for mtDNA                                      modelling
and ITS-2. Arlequin was used to calculate genetic             To explore historical demography from mtDNA and
differentiation based on the unbiased FST estimator           ITS-2 data, the demographic processes over time
θ (Weir & Cockerham, 1984), where the significance            were assessed using Tajima’s D (Tajima, 1989) and
was determined by running 10 000 permutations                 Fu’s F S (Fu, 1997) neutrality tests, and mismatch
and 100 000 MCMC steps in analysis of molecular               distribution analyses (Harpending et al., 1993),
variance (AMOVA, P < 0.05). To avoid mixing different         performed by Arlequin with 10 000 permutations.
population units, the AMOVA followed hierarchical             Considering the absence of a clear fossil record
levels, considering (1) individuals within a location         and molecular clocks of L. flava for these markers,
and (2) individuals within a region (South, Southeast         estimation of the divergence times between clades was
and Northeast) as population units. For each marker,          conducted using BEAST v.2.6.2 (Drummond et al.,
Migrate v.4.4.3 (Beerli, 2009) was used to estimate           2012) for the concatenated dataset (mtDNA + ITS-2)
long-term gene flow by calculating the population size        with the GTR+G nucleotide substitution and a time-
parameter (θ) and the average number of migrants              calibrated topology based on the estimated L. flava
per generation (Nm) using the formula: Nm = θi × Mj→i.        origin, ±36 Mya (Reid et al., 2010). Parameters
Two parallel runs with 2 × 10⁵ recorded genealogies,          applied were the uncorrelated relaxed-clock, and

                        © 2021 The Linnean Society of London, Biological Journal of the Linnean Society, 2021, 133, 999–1015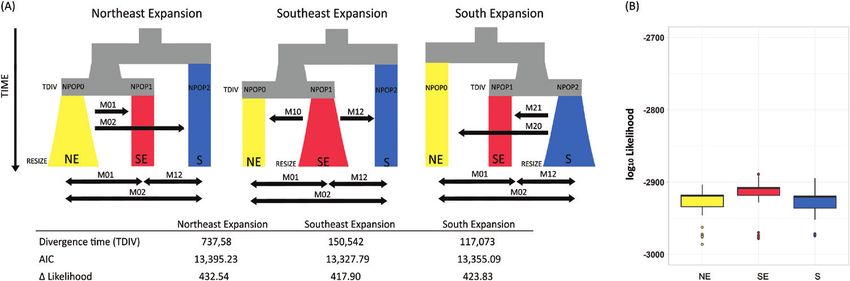
L. FLAVA CONNECTIVITY AND DEMOGRAPHIC HISTORY                          1003

400 million steps were sampled every 5000 steps,                    The niche-based models were developed using five
with a burn-in of 400 000. The tree was rooted with              mathematical algorithms to improve the reliance of
Littoraria intermedia as the outgroup (accession                 models, which were (1) envelope score from Bioclim (Booth
numbers KT149308 and KT149304). The convergence                  et al., 2014); (2) Domain–Gower distance (Carpenter et al.,
of effective sample size was assessed using the Tracer           1993); (3) support vector machines (Tax & Duin, 2004);
v.1.7.1 program (Rambaut & Drummond, 2003), and                  (4) maximum entropy (MaxEnt) (Phillips & Dudík, 2008)
the resulting tree was edited with FigTree v.1.4.4               and (5) Random Forest (Breiman, 2001). All models were
(Rambaut, 2007).                                                 developed to predict mH and LGM climate conditions
   Alternative evolutionary scenarios and relevant               using the dismo (Hijmans et al., 2017) and kernlab
population parameters were estimated using                       (Karatzoglou et al., 2004) R packages. To evaluate the
Fastsimcoal v.2.6 (Excoffier & Foll, 2011) based on              models, we used a bootstrap method to randomize the

                                                                                                                               Downloaded from https://academic.oup.com/biolinnean/article/133/4/999/6272942 by guest on 10 August 2021
the 6094 SNPs. This program uses the minor allele                occurrence points into two subsets of 2 k-folding (training
site frequency spectrum (SFS) parameter, computed                and test), repeated 20 times to decrease data collinearity.
with Arlequin (1000 bootstraps), to infer demographic            We conducted an ensemble forecasting approach (Araujo
and population parameters. We tested three distinct              & New, 2007) to predict a consensual map with the
demographic scenarios: the first assumed an expansion            frequency of species in each site. Finally, we produced one
of the Northeastern populations in the past (divergence          map with current species distribution patterns, one for
time backward in time), where all individuals migrate            the mH and one for the LGM.
to the other two regions. The second and third models
assumed expansion events with post-migration in the
Southeastern and Southern populations, respectively.                                 Data availability
The time of divergence (TDIV) was allowed to range               The raw de-multiplexed sequences generated in
from one to 500 000 generations back in time. For                this study are available in NCBI SRA as BioProject
each model, we ran 50 independent replicates, each               Accession PRJNA656564. mtDNA and ITS-2 sequences
including 40 estimation loops (-L 40) with 300 000 (-n           were deposited in GenBank and accession numbers
300 000) coalescence simulations. The probability of             are listed in the Supporting Information (Table S1).
each model given the observed data was determined
based on both the maximum likelihood value and
Akaike’s information criterion (AIC).
   The palaeodistribution of L. flava was fitted                                          RESULTS
through ecological niche modelling (ENM) based
on information on known occurrence locations and                                          Datasets
climate variables to predict the niches of species               A total of 93, 63 and 46 samples were analysed
(Ferrier & Guisan, 2006; Stigall, 2012; Alvarado-                for the SNPs mtDNA, and ITS-2, respectively
Serrano & Knowles, 2014). We collected species                   (Table 1; Supporting Information, Table S1). The
occurrence records from the GBIF dataset (https://               differences in the sizes of dataset samples among the
www.gbif.org/) and our sampled locations, totalling 59           markers resulted from difficulties in obtaining the
occurrence points (Fig. 1). Eighteen marine variables            amplification products, especially for ITS-2. At least
available on the MARSPEC database (http://marspec.               six individuals per location were sequenced, except at
weebly.com/) (Sbrocco & Barber, 2013) for current,               PIF, which allowed us to conduct comparative analysis
mid-Holocene (mH, 6 kya) and Last Glacial Maximum                among the distinct datasets. The COI and 16SrRNA
(LGM, 21 kya) temporal scenarios were used as                    sequences were 626 and 487 bp, respectively, with 31
environmental predictors for model fitting. Marine               and 19 polymorphic sites. The single mitochondrial
variables were downloaded at a spatial resolution                haplotype measured 1113 bp, with 46 variables sites,
of 5 arc-minutes (~10 × 10 km, in Equator region)                13 parsimony-informative sites and 33 singletons.
(Sbrocco, 2014), clipped to the South Atlantic Ocean,            ITS-2 sequences were 405 bp with 11 polymorphic
spanning 50°S to 15°N latitude, and 80°W to 45°W                 sites, ten parsimony-informative sites and one
longitude. A factorial analysis with Varimax rotation            singleton. The concatenated dataset (mtDNA + ITS-2)
was conducted to select non-correlated predictors                was 1518 bp, in which 44 sites were polymorphic and
that explain environmental variation in the study                parsimony-informative.
area (see details in Sobral-Souza et al., 2015). The                The library construction resulted in 322 479 123 reads
predictors included bathymetry, plan curvature,                  of 93 L. flava individuals (BioProject PRJNA656564).
profile curvature, salinity of the saltiest month,               Seqyclean removed ~29% of the reads (Supporting
annual salinity range and annual sea temperature                 Information, Table S2). Of the remaining 227 380 970
range (°C).                                                      sequences, the first quality filter, using iPyrad,

© 2021 The Linnean Society of London, Biological Journal of the Linnean Society, 2021, 133, 999–1015
1004 T. CORTEZ ET AL.
Table 1. Geographic coordinates of sampling locations and sample sizes of each genetic marker.
GPS coordinates Sample size
Location Sites Abbr. Lat. (°S) Long. (°W) SNPs mtDNA ITS-2
Northeast Region (NE)
Sabiaguaba NA SBF 3°47′24″ 38°25′23″ 11 7 6
Pier das Algás NA ALF 9°36′57″ 35°44′13″ 6 5 2
Southeast Region (SE)
Anchieta 4, 8, 64 m ACF 20°48′37″ 40°39′39″ 8 2 5
Gamboa 0, 2, 32 m GAF 20°53′19″ 40°45′55″ 8 3 4
Downloaded from https://academic.oup.com/biolinnean/article/133/4/999/6272942 by guest on 10 August 2021
Barra de São João 0, 8, 32 m SJF 22°35′55″ 41°59′25″ 10 7 5
Praia da Gorda 0, 8, 32 m PGF 22°43′48″ 41°58′20″ 10 5 3
Praia Dura 4, 16, 64 m DF 23°29′32″ 45°09′55″ 9 10 7
Araçá 4, 16, 64 m ARF 23°48′47″ 45°24′31″ 8 10 4
South Region (S)
Santo Antônio NA STF 27°30′46″ 48°30′57″ 7 7 4
Ribeirão da Ilha NA RBF 27°42′45″ 48°33′40″ 14 5 4
Ponta de Ribeirão da Ilha NA PIF 27°49′54″ 48°34′14″ 2 2 2
Total 93 63 46
The table presents the abbreviation (Abbr.) used of each location and whether the sampling was performed randomly (NA) or through transects. The
sample size is given for each genetic marker (SNPs, mtDNA, and ITS-2).
Table 2. Diversity indices based on mtDNA (COI + 16SrRNA), ITS-2, and SNPs of Littoraria flava.
mtDNA ITS-2 SNPs
Location N H θS θπ N H θS θπ N HO HE FIS
Northeast Region
SBF 7 6 6.5 4.5 6 12 2.6 3.6 11 0.16 0.18 0.09
ALF 5 4 3.8 3.2 2 4 1.6 1.8 6 0.22 0.26 0.10
Southeast Region
ACF 2 2 3.0 3.0 5 4 3.2 3.8 8 0.20 0.21 0.05
GAF 3 2 1.3 1.3 4 4 3.8 4.5 8 0.18 0.21 0.11
SJF 7 6 4.4 4.3 5 8 3.0 3.6 10 0.17 0.19 0.10
PGF 5 4 5.7 5.4 3 6 3.1 3.3 10 0.16 0.19 0.11
DF 10 7 3.8 2.8 7 14 2.2 3.3 9 0.18 0.20 0.08
ARF 10 7 4.2 3.4 4 8 2.3 2.3 8 0.19 0.22 0.14
South Region
STF 7 7 3.6 3.1 4 6 3.1 3.8 6 0.20 0.26 0.16
RBF 5 3 3.8 3.6 4 6 3.9 4.6 7 0.19 0.24 0.17
PIF 2 2 3.0 3.0 2 4 3.2 3.6 2 0.50 0.54 0.05
Sample size (N), haplotype number (H), nucleotide differences (θS), nucleotide diversity (θπ), observed heterozygosity (HO), expected heterozygosity
(HE), and fixation index (FIS) are shown for each location according to the genetic marker. Significant values of FIS and differences between HE and HO
(P < 0.05) are shown in bold. Abbreviations as in Table 1.
retained 19 133 SNPs within 2249 loci, with 12.67% Genetic diversity
of data missing per locus on average. Eight samples Nucleotide diversity (θπ) between individuals was often
were removed owing to the relatively large amount of low, ranging from 1.33 in Gamboa (SE) to 5.40 in Praia
missing data (>35% per individual). The number of raw da Gorda (SE) for mtDNA and from 1.83 in Alagoas (NE)
reads per sample ranged from 203 705 to 10 356 692 to 4.64 in Gamboa (SE) for ITS-2 (Table 2). In contrast,
(Table S3). After PLINK filtering, we obtained 6094 the segregating sites were often high, with the highest
SNPs within 1572 loci from 85 individuals. values observed in Sabiaguaba (NE) for mtDNA and in
© 2021 The Linnean Society of London, Biological Journal of the Linnean Society, 2021, 133, 999–1015L. FLAVA CONNECTIVITY AND DEMOGRAPHIC HISTORY 1005
Ribeirão da Ilha (S) for ITS-2. SNP analyses revealed represent a population unit, the mtDNA did not reveal
that the observed heterozygosity across all loci was significant structuring (F ST = 0.024, P = 0.1283) in
significantly lower than the expected heterozygosity in contrast to the observation based on ITS-2 (FST = 0.057,
five out of 11 localities (P < 0.05) (Table 2). Eight of the P = 0.0016) and SNPs (FST = 0.006, P = 0.008).
11 average FIS values across the loci were significant, The pairwise FST calculated based on mtDNA and
with the highest being 0.167 in Ribeirão da Ilha (S). ITS-2 revealed that of the 55 pairwise tests, four
The mtDNA MSN had a star-shaped configuration, and 25 comparisons, respectively, were significant
with the most abundant haplotypes as sources (Fig. (Fig. 3A). For SNPs, 13 out of 55 were significant
2A), and multiple unique haplotypes diverging based comparisons, mostly in the Southeastern locality Praia
on only a few substitutions. The most diverse haplotype da Gorda (SE). Overall, such pairwise comparisons
included individuals from all coastal regions. There was were not consistent with patterns of IBD for any local
Downloaded from https://academic.oup.com/biolinnean/article/133/4/999/6272942 by guest on 10 August 2021
no clear geographical pattern of haplotype distribution population.
across localities for either ITS-2 or mtDNA. The Bayesian STRUCTURE assignment analysis
revealed clear distinction among three clusters
(K = 3): the first is mainly composed of individuals
Population structure
from the Northeast and Southeast regions; the
Among localities second, individuals from the Southeast and South
The results of AMOVA with all genetic markers regions; and the third, individuals from the three
revealed most of the total variance within localities regions, with no predominance of any of the groups
and low yet significant FST and FSC indices (mtDNA (Fig. 2B, C). The scatter plot from the results of
FST = 0.077, ITS-2 FST = 0.162 and SNPs FST = 0.014) DAPC revealed slight differentiation among the
(Table 3). Assuming all individuals from a region three clusters (Fig. 2D).
Figure 2. Haplotype networks and clustering analysis of Littoraria flava. A, minimum spanning network of mtDNA, to
the left, and ITS-2 data, to the right. Each node represents a haplotype, its size corresponds to the haplotype frequency and
its colours indicate the locality. Black nodes represent inferred ancestral nodes. B, assignment plot based on STRUCTURE
analyses with 6094 SNPs and K = 3. Each vertical bar corresponds to one individual, and the colour indicates the proportion
of membership in each genetic cluster. C, K = 3 inferred by STRUCTURE HARVESTER for the genetic assignment based on
6094 SNPs. D, DAPC density plot for 85 L. flava individuals. Dots represent individuals, with colours denoting the genetic
groups identified by STRUCTURE. Abbreviations are as in Table 1.
© 2021 The Linnean Society of London, Biological Journal of the Linnean Society, 2021, 133, 999–10151006 T. CORTEZ ET AL.
Table 3. Analysis of molecular variance (AMOVA) results from all genetic markers. Each group corresponds to a region
from the Brazilian coast (Northeast, Southeast, and South).
Marker Source of variation d.f. Variance components % Variation
mtDNA Among groups 2 0.002 0.10
Among localities 8 0.15 7.57
FST = 0.077* Among individuals 53 179.84 92.32
FSC = 0.076* Total 63 179.99
ITS-2 Among groups 2 0.01 0.46
Among localities 8 0.33 15.78
FST = 0.162** Among individuals 65 174.09 83.77
Downloaded from https://academic.oup.com/biolinnean/article/133/4/999/6272942 by guest on 10 August 2021
FSC = 0.158** Total 75 207.83
SNPs Among groups 2 0.09 0.22
Among localities 8 0.17 0.40
FST = 0.014** Among individuals 159 4198.64 99.38
FSC = 0.011* Total 169 4198.91
The results indicate the source of variation with its degrees of freedom (df), variance of component, and percentage variation (% Variation). * P < 0.05;
** P < 0.01.
Figure 3. Population differentiation and migration results for mtDNA, ITS-2 and SNP markers from 11 sampled locations.
A, heatmaps of the pairwise FST for each genetic marker. Colour coding illustrates the observed FST value. Only significant
indices are shown (P < 0.05). On the left, the localities are grouped according to the coastline regions. B, migration rates
per generation according to Migrate-n analysis for both mtDNA and ITS-2. On the right, migration probabilities according
Fastsimcoal for SNPs. The circle sizes and colours represent the rates of migrants from the source locality (rows) toward the
receiver locality (columns). Abbreviations are as in Table 1.
The migration rates per generation, estimated localities, Praia Dura (SE), Araçá (SE) and Praia
using Migrate-n for mtDNA and ITS-2, were da Gorda (SE) (Fig. 3B; Supporting Information,
inconsistent among markers for the Southeastern Table S4). While the mtDNA indicated that the
© 2021 The Linnean Society of London, Biological Journal of the Linnean Society, 2021, 133, 999–1015L. FLAVA CONNECTIVITY AND DEMOGRAPHIC HISTORY 1007
rates of migrants toward Praia da Gorda (SE) were Demographic history and ecological niche
close to zero, the ITS-2 data showed rates almost modelling
300 times higher for the same locality. The opposite The population events investigation highlighted the
trends were observed in Praia Dura (SE) and Araçá contrasting patterns between the mtDNA and ITS-2
(SE), where the mtDNA indicated rates of migrants data. While the mtDNA data only revealed significant
approximately 50–100 times higher than the rates negative D for the Northeastern localities (P < 0.05;
associated with the ITS-2 data. All other locations Supporting Information, Table S5), the ITS-2 data
had high numbers of migrants – usually greater revealed significant negative values of Fu’s FS test for
than 200, either sender or receiver – indicating high eight out of 11 localities, and only Praia da Gorda (SE)
levels of gene flow, even across large distances. The showed a significant Harpending’s raggedness index.
Fastsimcoal results for 6094 SNPs revealed high The topology provided by BEAST did not recover
Downloaded from https://academic.oup.com/biolinnean/article/133/4/999/6272942 by guest on 10 August 2021
probabilities of past migration among populations a geographical pattern at the origin of the current
from different regions of the coastline, such as between distribution of L. flava populations (Figure S3).
Santo Antônio (S) and Alagoas (NE) and between Nonetheless, the tree topology with several diverging
Ribeirão da Ilha (S) and Barra de São João (SE) branches suggests demographic expansion over
(Fig. 3B). The highest probability of migration was time. The first ancestral divergence seemed to have
from Santo Antônio (S) and Praia Dura (SE). generated two major clades: one (~16.7 Mya) mostly
represented by the Southeastern localities and the
second (~27.03 Mya) comprising individuals from all
Within transects regions of the Brazilian coastline.
STRUCTURE clustering analyses based on SNPs The optimal-fitting model tested by Fastsimcoal,
from individuals sampled along the transects according to the highest likelihood (-2903.53)
showed no signs of genetic structure, according to and the lowest AIC (13,327), was the one in
the sites established during sampling. Instead, two which the population divergence was initiated
clusters (K = 2) were detected for Gamboa (SE) and in the Southeastern region toward the other
Praia da Gorda (SE), and five clusters (K = 5) were two regions (Figure 4). The best model assumes
identified for all remaining locations (Supporting i n i t i a l u n i d i r e c t i o n a l g e n e f l o w, f o l l o w e d b y
Information, Fig. S2). Nonetheless, there was no bidirectional migration across all regions. The low
clear microgeographical pattern for any location. variation in likelihoods (Δ likelihood = 417.90)
The results of both pairwise F ST and Mantel’s obtained from each replicate of the best model
tests among the sites within transects revealed no indicated robust estimates. The divergence time
statistically significant correlation. from the Southeastern populations was ~150 000
Figure 4. Comparisons among all demographic models, where the best-fitting scenario assumes the divergence of Littoraria
flava populations originating in the Southeastern region around 150 000 generations backward in time. A, illustrations
of demographic models tested using Fastsimcoal with topologies showing the origins of divergence from the Northeast,
Southeast and South regions. Numbers below the models are divergence times, Akaike information criterion values and
the delta likelihood (difference between maximum possible and maximum obtained model likelihood in log10 units) of each
model. B, boxplots showing the log10 likelihood distributions based on the observed SFS. Individuals were grouped according
to their region of the Brazilian coastline, represented by the different colours.
© 2021 The Linnean Society of London, Biological Journal of the Linnean Society, 2021, 133, 999–10151008 T. CORTEZ ET AL.
Downloaded from https://academic.oup.com/biolinnean/article/133/4/999/6272942 by guest on 10 August 2021
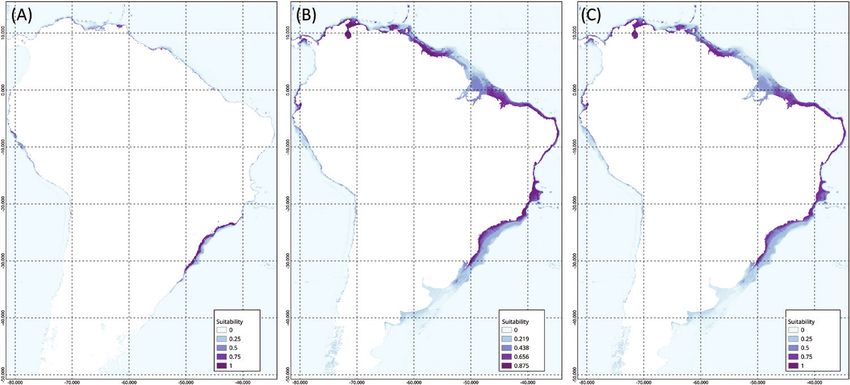
Figure 5. Modelled distributions of Littoraria flava for (A) Last Glacial Maximum (21 kya), (B) mid-Holocene (6 kya) and
(C) present (0 kya) scenarios. The suitability value predicts how adequate the environment is for the species occurrence.
generations ago. The second-best model (highest obtained robust evidence from coalescent analysis and
likelihood = −2894.81, AIC = 13 355) assumed a palaeodistribution reconstruction that the distribution
divergence (~417 generations ago) from the Southern of L. flava has retracted since the LGM, probably due
region, and presented greater variation of estimates to increasing sea surface temperature (SST), which has
(Δ likelihood = 423.83). already been suggested for other littorinids.
ENM indicated a geographical retraction from
the LGM to the present time (Fig. 5). Geographical
stability was proposed under the present and mH
Intra-populational diversity and
climate scenarios. The current and mH distribution
microgeographical variation
showed that L. flava was potentially distributed
across almost the entire Brazilian coast, in addition Genetic diversity analysis based on mtDNA and
to French Guiana, Suriname, Guyana, Venezuela and ITS-2 revealed greater diversity within populations
part of Colombia. However, a considerable reduction and numerous shared sequences among locations.
was noted in the distribution during the LGM, with Similar patterns have been reported for littorinids,
the most suitable areas for L. flava being restricted to with both direct and planktotrophic development
the Southeastern locations of the Brazilian coast. (Je Lee & Boulding, 2009; Evangelisti et al., 2017;
Nehemia et al., 2019), and seem to be caused
by high gene flow among populations and large
population sizes. There was no clear structuring
within transects based on the delimited sites, which
DISCUSSION
is inconsistent with the result of a previous study
To the best of our knowledge, this is the first investigation (Andrade & Solferini, 2007). This difference could be
of the evolutionary history and connectivity patterns caused by the different mutation rates of SNPs and
of a widely distributed marine invertebrate along the allozyme markers (Johannesson & Tatarenkov, 1997;
Brazilian coastline based on genomics in combination Sunnucks, 2000; Schlötterer, 2004) and, because
with ENM. Our combined genetic data support the allozymes are involved in metabolic functions,
hypothesis that L. flava has been dispersing over natural selection might be involved (Tatarenkov &
large distances for a long time, with the populations Johannesson, 1999; Johannesson et al., 2004; Carini
distributed in distant locations currently interconnected & Hughes, 2006; Kramarenko & Snegin, 2015). The
by gene flow. Besides a high rate of gene flow, the observed microgeographical structure within the
genetic structure exhibited three clusters distributed transect did not exhibit an IBD model (Supporting
across the study area, which could be due to oceanic Information, Fig. S2). The observed structure among
circulation and local environmental conditions. We sites, with cluster numbers varying from two to
© 2021 The Linnean Society of London, Biological Journal of the Linnean Society, 2021, 133, 999–1015L. FLAVA CONNECTIVITY AND DEMOGRAPHIC HISTORY 1009
five, could be due to variation in environmental monomorphic sites were only found in Anchieta (SE),
and temporal conditions, in addition to variance in the null alleles are unlikely to generate heterozygosity
reproductive success, which together could result deficits in so many populations (Carlson et al., 2006;
in differences in the genetic composition of larvae Crooks et al., 2013). The Wahlund effect is a plausible
that colonize an area. Such interactions might explanation for our results if there was chaotic
result in apparently chaotic genetic patchiness recruitment of cohorts from different origins or if
(Hedgecock et al., 2007; Liu & Ely, 2009; Villacorta- many breeding groups constituted each population,
Rath et al., 2018), primarily because only a small which might explain the structuring within the
fraction of individuals contribute to the subsequent transects. Although such mechanisms may not be
generations (Hedgecock & Pudovkin, 2011). Natural entirely responsible for our results, we cannot exclude
selection driven by heterogeneous environmental the possibility that they have shaped the population
Downloaded from https://academic.oup.com/biolinnean/article/133/4/999/6272942 by guest on 10 August 2021
conditions, either during the larval stage or after dynamics of L. flava (Andrade et al., 2003, 2005).
settlement, might also generate similar patterns Heterozygote deficiency could also be explained by
(Hedgecock et al., 1994). Few marine studies have gene flow dynamics according to a metapopulation
attempted to link environmental factors with model, where the history of extinctions would yield
genetic differentiation patterns at the fine spatial low heterozygosity rates and the frequent population
scale (Berkström et al., 2013; DiBattista et al., 2017; turnover would decrease genetic variation among
Coscia et al., 2020). local populations (Gilpin, 1991; Smedbol et al.,
2002). Andrade & Solferini (2007) found significant
temporal variation among individuals living in the
same rocky shore. Furthermore, based on the sizes
Population divergence and gene flow of individuals, previous work (our unpubl. data) has
The findings of the our study corroborate the also demonstrated the asymmetric abundance of
assumption of interconnected populations across broad L. flava adults and juveniles on distinct rocky shores
spatial scales with high levels of gene flow (Figs 2, 3; during the same period, indicating asynchronous
Supporting Information, Table S4), given the lack of a and asymmetrical rates of arrival of new recruits.
clear geographical pattern (Fig. 2A). The findings also If asynchronous colonization is true for the species,
suggest high numbers of migrants per generation and we could also assume a possibility of local extinction
high effective population size (Fig. 3B). Nevertheless, at any time. Our findings seem to be consistent with
there were some discordant patterns between mtDNA the hypothesis that interconnected populations
and ITS-2 marker results for Praia Dura, Araçá are composed of heterogeneous larval and recruit
and Praia da Gorda, probably due to the different cohorts, resulting in unrecognizable local variation
evolutionary dynamics and inheritance mechanisms, patterns.
as already reported from phylogeographical studies The three clusters identified by STRUCTURE do not
(King et al., 1999; Chu et al., 2001; Presa et al., 2002; highlight a geographical pattern through the species
Ni et al., 2012; Santos-Neto et al., 2016). Overall, the distribution (Fig. 2B). There is a clear distinction
migration probabilities estimated from Fastsimcoal between the clusters mostly represented by individuals
are quite similar across all regions, supporting the from Northeastern + Southeastern localities and
hypothesis of gene flow among distant locations. The Southeastern + Southern localities (clusters in
highest migration probabilities obtained from SNPs yellow and blue in Fig. 2B, respectively). The clusters,
are consistent with the non-significant pairwise FST however, are not composed of the same individuals that
comparisons (Fig. 3). share the two most common mtDNA haplotypes (Fig.
The low values of FST observed for SNPs (Fig. 3A) 2A). Within our study area, the passage of cold fronts
suggests large effective population sizes or high along the Cabo Frio coast (Rio de Janeiro) is capable
levels of genetic connectivity among sites (Bohonak, of completely modifying the wind patterns (Carbonel,
1999; Marko & Hart, 2011). Nonetheless, we observed 2003; Coelho-Souza et al., 2012), directly affecting
significant heterozygote deficiency and high positive FIS coastal circulation and SST variation, explaining our
estimates in several localities (Table 2). Such patterns palaeodistribution simulation patterns. Considering
have already been reported for L. flava (Andrade et al., the geographical proximity of Cabo Frio and Praia
2005) and many other marine invertebrates (Addison da Gorda (~22 km), which seems to be the transition
& Hart, 2005; Costantini et al., 2007; Knutsen et al., area between the two major genetic clusters, these
2003), usually attributed to natural selection, null coastal events may be the sources of such disturbances
alleles, inbreeding and the Wahlund effect (Gajardo in larvae dispersal of L. flava, resulting in genetic
et al., 2002; Whitaker, 2004). Because we removed differentiation, and possibly the retraction during the
individuals with a high amount of missing data and LGM. Such an explanation has already been proposed
© 2021 The Linnean Society of London, Biological Journal of the Linnean Society, 2021, 133, 999–10151010 T. CORTEZ ET AL.
in population genetics and community studies in MSN topology, palaeodistribution and coalescent
lobsters and fishes in the same region (Ekau, 1999; simulations (Slatkin & Hudson, 1991; Rogers, 1995;
Maggioni et al., 2003; Freitas & Muelbert, 2004). The Avise, 2009). However, the fossil record for littorinids
third genetic cluster (in red in Fig. 2B) may represent from Brazil is scarce and unsuitable for testing this
those individuals that were able to cross the expansive hypothesis. The tree topology was also consistent with
distance across the three coastal regions, despite the a continuum of population expansion, as there are
oceanographic and climatic disturbances, due to the several clades with individuals from all regions of the
plastic larval behaviour influenced by biophysical coastline originating from the initial clade, without
conditions (Leis & Clark, 2005; Berumen et al., 2012; any apparent geographical isolation (Supporting
Faillettaz et al., 2018). Because no study has adopted Information, Fig. S3).
a similar genomic approach in studying the genetic In the present study, we have provided a first glimpse
Downloaded from https://academic.oup.com/biolinnean/article/133/4/999/6272942 by guest on 10 August 2021
structure of a marine invertebrate organism in the of the demographic processes that have shaped the
Brazilian coastline, we could not compare these results population structure of a widespread intertidal
with other studies of high-dispersal species along the Brazilian littorinid. Although our demographic
same area. inferences based on genetic data do not reveal the
actual demographic processes that occurred in the
past, by integrating palaeodistribution simulations
Demographic history and niche modelling
with our genetic data, we obtained robust evidence
While the mtDNA data revealed significant Tajima’s that L. flava has experienced some type of departure
D only for Sabiaguaba and Alagoas, the ITS-2 data from population equilibrium since LGM, probably
revealed that more than half of the localities had due to increasing SST. Despite comprehensive
significant negative values of Fu’s FS, and only Praia understanding of the biotic and abiotic factors
da Gorda had a significant Harpending’s raggedness influencing local species abundance and distribution
index. Nevertheless, both sets of data presented clear on rocky shores, the interactive effects of such
evidence that L. flava populations had expanded features over large temporal scales remain unclear.
demographically, as supported by both coalescent Our combined genetic data support the hypothesis
and palaeodistribution simulations. Both approaches that L. flava has been dispersing over large distances
revealed geographical and population expansion from for a long time, with the populations distributed in
the Southeastern area (Figs 4, 5), and the ENM results distant locations currently interconnected by gene
suggested that the events occurred during the LGM flow. Here, we propose that during glacial periods,
(21 kya). These findings indicate that past climate L. flava underwent geographical and population
change could have had effects on broad-scale species retraction followed by subsequent expansion during
distribution or diversity, and highlight their effect on multiple global glacial–interglacial cycles. Such
population expansion after cooler and drier periods. patterns can be reliably used to explain the current
Previous palaeoclimate investigations suggest diversity patterns of other marine species in rocky
that the tropics were generally significantly cooler shores in the South Atlantic.
during the LGM, even with regard to SST (Stute
et al., 1995; Otto-Bliesner et al., 2006). Simulations
for the mH (6 kya) revealed a small but significant ACKNOWLEDGEMENTS
amount of annual cooling over the tropical oceans,
often associated with reduced levels of methane and We are grateful to the Instituto de Biociências – USP,
annual solar anomalies. Overall, precipitation in and the Centro de Biologia Marinha da Universidade
oceans seems to have increased between the LGM and de São Paulo (CEBIMar) staff; to all colleagues at
the mH (Otto-Bliesner et al., 2006). Organisms from the Laboratório de Diversidade Genômica, especially
the intertidal ecosystem tend to respond more rapidly Cecili Mendes, for assisting in the fieldwork; to EcoMol
to climate change by, for instance, an alternation in staff for library preparation; and to Darwin server
their geographical distribution ranges (Williams administrators for their assistance. We are also grateful
& Morritt, 1995; Menge, 2000; Menge et al., 2007). to Cristina Yumi Miyaki, Vera Nisaka Solferini and
Thus, the range of a species sensitive to climatic Gustavo Muniz Dias for helpful suggestions during
fluctuation, such as L. flava, could have extended the discussion of the results, and the two anonymous
into the Brazilian coast in response to progressive reviewers for their comments. We would like to thank
warming following the LGM, a process that would have Editage (www.editage.com) for English language
involved serial bottleneck events. Such scenarios have editing. This work was supported by CAPES and the
already been suggested for other littorinids (Je Lee & Fundação de Amparo à Pesquisa do Estado de São
Boulding, 2009; Silva et al., 2013; Evangelisti et al., Paulo (FAPESP, processes 2015/20139-9, 2018/05118-3
2017), and would explain our neutrality test results, and 2019/11478-5). The authors declare that they have
© 2021 The Linnean Society of London, Biological Journal of the Linnean Society, 2021, 133, 999–1015L. FLAVA CONNECTIVITY AND DEMOGRAPHIC HISTORY 1011
no known competing financial interests or personal Bucklin A. 2000. Population genetic variation of Calanus
relationships that could have appeared to influence finmarchicus in Icelandic waters: preliminary evidence of
the work reported in this paper. genetic differences between Atlantic and Arctic populations.
ICES Journal of Marine Science 57: 1592–1604.
Carbonel C. 2003. Modelling of upwelling–downwelling cycles
caused by variable wind in a very sensitive coastal system.
REFERENCES
Continental Shelf Research 23: 1559–1578.
Addison JA, Hart MW. 2005. Spawning, copulation and Carini G, Hughes J. 2006. Subdivided population structure
inbreeding coefficients in marine invertebrates. Biology and phylogeography of an endangered freshwater
Letters 1: 450–453. snail, Notopala sublineata (Conrad, 1850) (Gastropoda:
Alvarado-Serrano D, Knowles L. 2014. Ecological Viviparidae), in Western Queensland, Australia: population
niche models in phylogeographic studies: applications, genetic structure and phylogeography of N. sublineata.
Downloaded from https://academic.oup.com/biolinnean/article/133/4/999/6272942 by guest on 10 August 2021
advances and precautions. Molecular Ecology Resources Biological Journal of the Linnean Society 88: 1–16.
14: 233–248. Carpenter G, Gillison A, Winter J. 1993. DOMAIN: a flexible
Andrade S, Magalhaes C, Solferini V. 2003. Patterns of modelling procedure for mapping potential distributions of
genetic variability in Brazilian Littorinids (Mollusca): a plants and animals. Biodiversity and Conservation 2: 667–680.
macrogeographic approach. Journal of Zoological Systematics Carlson CS, Smith JD, Stanaway IB, Rieder MJ,
and Evolutionary Research 41: 249–255. Nickerson DA. 2006. Direct detection of null alleles in SNP
Andrade S, Medeiros H, Solferini V. 2005. Homogeneity genotyping data. Human Molecular Genetics 15: 1931–1937.
test of Hardy–Weinberg deviations in Brazilian littorinids: Chu K, Li C, Ho H. 2001. The first Internal Transcribed
evidence for selection? Journal of Molluscan Studies 71: Spacer (ITS-1) of ribosomal DNA as a molecular marker for
167–174. phylogenetic and population analyses in Crustacea. Marine
Andrade S, Solferini V. 2007. Fine-scale genetic structure Biotechnology 3: 355–361.
overrides macro-scale structure in a marine snail: nonrandom Coelho-Souza S, López M, Guimarães J, Coutinho R,
recruitment, demographic events or selection?. Biological Candella R. 2012. Biophysical interactions in the Cabo Frio
Journal of the Linnean Society 91: 23–36. upwelling system, southeastern Brazil. Brazilian Journal of
Araujo M, New M. 2007. Ensemble forecasting of species Oceanography 60: 353–365.
distributions. Trends in Ecology & Evolution 22: 42–47. Costantini F, Fauvelot C, Abbiati M. 2007. Fine-scale
Avise J. 2009. Phylogeography: retrospect and prospect. genetic structuring in Corallium rubrum: evidence of
Journal of Biogeography 36: 3–15. inbreeding and limited effective larval dispersal. Marine
Ayre D, Minchinton T, Perrin C. 2009. Does life history Ecology Progress Series 340: 109–119.
predict past and current connectivity for rocky intertidal Coscia I, Wilmes S, Ironside J, Goward-Brown A,
invertebrates across a marine biogeographic barrier? O’Dea E, Malham S, McDevitt A, Robins P. 2020. Fine-
Molecular Ecology 18: 1887–1903. scale seascape genomics of an exploited marine species, the
Beasley C, Fernandes C, Gomes C, Brito B. 2005. Molluscan common cockle Cerastoderma edule, using a multimodelling
diversity and abundance among coastal habitats of Northern approach. Evolutionary Applications 13: 1854–1867.
Brazil. Ecotropica 11: 9–20. Cowen R. 2000. Connectivity of marine populations: open or
Beerli P. 2009. How to use MIGRATE or why are Markov closed? Science 287: 857–859.
chain Monte Carlo programs difficult to use. Population Cowen RK, Sponaugle S. 2009. Larval dispersal and marine
Genetics for Animal Conservation 17: 42–79. population connectivity. Annual Review of Marine Science 1:
Berkström C, Lindborg R, Thyresson M, Gullström M. 443–466.
2013. Assessing connectivity in a tropical embayment: fish Crooks L, Carlborg Ö, Marklund S, Johansson AM.
migrations and seascape ecology. Biological Conservation 2013. Identification of null alleles and deletions from SNP
166: 43–53. genotypes for an intercross between domestic and wild
Berumen M, Almany G, Planes S, Jones G, Saenz- chickens. G3: Genes, Genomes, Genetics 3: 1253–1260.
Agudelo P, Thorrold S. 2012. Persistence of self- Dawson M, Jacobs D. 2001. Molecular evidence for cryptic
recruitment and patterns of larval connectivity in a marine species of Aurelia aurita (Cnidaria, Scyphozoa). The
protected area network: Connectivity Patterns in An MPA Biological Bulletin 200: 92–96.
Network. Ecology and Evolution 2: 444–452. DiBattista J, Travers M, Moore G, Evans R, Newman S,
Bohonak A. 1999. Dispersal, gene flow, and population Feng M, Moyle S, Gorton R, Saunders T, Berry O.
structure. The Quarterly Review of Biology 74: 21–45. 2017. Seascape genomics reveals fine-scale patterns of
Booth T, Nix H, Busby J, Hutchinson M. 2014. BIOCLIM: dispersal for a reef fish along the ecologically divergent
the first species distribution modelling package, its early coast of Northwestern Australia. Molecular Ecology 26:
applications and relevance to most current MAXENT 6206–6223.
studies. Diversity and Distributions 20: 1–9. Doyle J, Doyle J. 1987. A rapid DNA isolation procedure for
Breiman L. 2001. Random forests. Machine Learning 45: small quantities of fresh leaf tissue. Phytochemical Bulletin
5–32. 19: 11–15.
© 2021 The Linnean Society of London, Biological Journal of the Linnean Society, 2021, 133, 999–10151012 T. CORTEZ ET AL.
Drummond A, Suchard M, Xie D, Rambaut A. 2012. genotypes, lost alleles, and systematic bias in parameter
Bayesian phylogenetics with BEAUti and the BEAST 1.7. estimation. BMC Evolutionary Biology 10: 118.
Molecular Biology and Evolution 29: 1969–1973. Gilpin M. 1991. The genetic effective size of a metapopulation.
Earl D, vonHoldt B. 2012. STRUCTURE HARVESTER: a Biological Journal of the Linnean Society 42: 165–175.
website and program for visualizing STRUCTURE output Harpending H, Sherry S, Rogers A, Stoneking M. 1993.
and implementing the Evanno method. Conservation The genetic structure of ancient human populations. Current
Genetics Resources 4: 359–361. Anthropology 34: 483–496.
Eaton D. 2014. PyRAD: assembly of de novo RADseq loci for Hedgecock D, Launey S, Pudovkin A, Naciri Y,
phylogenetic analyses. Bioinformatics 30: 1844–1849. Lapègue S, Bonhomme F. 2007. Small effective number
Ekau W. 1999. Topographical and hydrographical impacts of parents (Nb) inferred for a naturally spawned cohort
on zooplankton community structure in the Abrolhos Bank of juvenile European flat oysters Ostrea edulis. Marine
region, East Brazil. Archive of Fishery and Marine Research Biology 150: 1173–1182.
Downloaded from https://academic.oup.com/biolinnean/article/133/4/999/6272942 by guest on 10 August 2021
47: 307–320. Hedgecock D, Li G, Nelson K. 1994. The central stock of
Elshire R, Glaubitz J, Sun Q, Poland J, Kawamoto K, Northern anchovy (Engraulis mordax) is not randomly
Buckler E, Mitchell S. 2011. A robust, simple genotyping- mating population. California Cooperative Oceanic Fisheries
by-sequencing (GBS) approach for high diversity species. Investigations Report. 35: 121–136.
PLoS ONE 6: e19379. Hedgecock D, Pudovkin A. 2011. Sweepstakes reproductive
Evangelisti F, Bellucci A, Sabelli B, Albano P. 2017. The success in highly fecund marine fish and shellfish: a review
periwinkle Echinolittorina punctata (Mollusca: Gastropoda) and commentary. Bulletin of Marine Science 87: 971–1002.
tracked the warming of the Mediterranean Sea following the Hijmans R, Phillips S, Leathwick J, Elith J, Hijmans MRJ.
Last Glacial Maximum. Marine Biology 164: 34. 2017. Package ‘dismo’. Circles 9: 1–68.
Excoffier L, Foll M. 2011. fastsimcoal: a continuous-time Janson K. 1987. Allozyme and shell variation in two marine
coalescent simulator of genomic diversity under arbitrarily snails (Littorina, Prosobranchia) with different dispersal
complex evolutionary scenarios. Bioinformatics 27: abilities. Biological Journal of the Linnean Society 30:
1332–1334. 245–256.
Excoffier L, Lischer H. 2010. Arlequin suite ver 3.5: a new Je Lee H, Boulding E. 2009. Spatial and temporal population
series of programs to perform population genetics analyses genetic structure of four northeastern Pacific littorinid
under Linux and Windows. Molecular Ecology Resources 10: gastropods: the effect of mode of larval development on
564–567. variation at one mitochondrial and two nuclear DNA
Faillettaz R, Paris C, Irisson J. 2018. Larval fish swimming markers. Molecular Ecology 18: 2165–2184.
behavior alters dispersal patterns from marine protected Johannesson K, Lundberg J, André C, Nilsson P. 2004.
areas in the North-Western Mediterranean Sea. Frontiers in Island isolation and habitat heterogeneity correlate with
Marine Science 5: 97. DNA variation in a marine snail (Littorina saxatilis): island
Ferrier S, Guisan A. 2006. Spatial modelling of biodiversity isolation and habitat heterogeneity. Biological Journal of the
at the community level. Journal of Applied Ecology 43: Linnean Society 82: 377–384.
393–404. Johannesson K, Tatarenkov A. 1997. Allozyme variation in
Folmer O, Black M, Hoeh W, Lutz R, Vrijenhoek R. 1994. a snail (Littorina saxatilis) – Deconfounding the effects of
DNA primers for amplification of mitochondrial cytochrome microhabitat and gene flow. Evolution 51: 402–409.
c oxidase subunit I from diverse metazoan invertebrates. Jombart T. 2008. adegenet: a R package for the multivariate
Molecular Marine Biology and Biotechnology 3: 294–299. analysis of genetic markers. Bioinformatics 24: 1403–1405.
Francis R. 2017. pophelper: an R package and web app to Karatzoglou A, Smola A, Hornik K, Zeileis A. 2004.
analyse and visualize population structure. Molecular Kernlab—an S4 package for kernel methods in R. Journal of
Ecology Resources 17: 27–32. Statistical Software 11: 1–20.
Freitas D, Muelbert J. 2004. Ichthyoplankton distribution King P, Broderip W. 1832. Description of the Cirrhipeda,
and abundance off Southeastern and Southern Brazil. Conchifera and Mollusca: in a collection formed by the
Brazilian Archives of Biology and Technology 47: 601–612. Officers of HMS Adventure and Beagle employed between
Fu Y. 1997. Statistical tests of neutrality of mutations against the years 1826 and 1830 in surveying the southern coasts
population growth, hitchhiking and background selection. of South America: including the Straits of Magalhaens
Genetics 147: 915–925. and the Coast of Tierra Del Fuego. Zoological Journal 5:
Funk W, McKay J, Hohenlohe P, Allendorf F. 2012. 332–349.
Harnessing genomics for delineating conservation units. King TL, Eackles MS, Gjetvaj B, Hoeh WR. 1999.
Trends in Ecology & Evolution 27: 489–496. Intraspecific phylogeography of Lasmigona subviridis
Gajardo G, Cancino J, Navarro J. 2002. Genetic variation (Bivalvia: Unionidae): conservation implications of range
and population structure in the marine snail Chorus discontinuity. Molecular Ecology 8: S65–S78.
giganteus (Gastropod: Muricidae), an overexploited endemic Knutsen H, Jorde PE, André C, Stenseth NC. 2003. Fine‐
resource from Chile. Fisheries Research 55: 329–333. scaled geographical population structuring in a highly
Garrick R, Sunnucks P, Dyer R. 2010. Nuclear gene mobile marine species: the Atlantic cod. Molecular Ecology
phylogeography using PHASE: dealing with unresolved 12: 385–394.
© 2021 The Linnean Society of London, Biological Journal of the Linnean Society, 2021, 133, 999–1015You can also read