Upper Cretaceous paleoenvironmental changes and petrophysical responses in lacustrine record (Songliao Basin, NE China) and marine sedimentary ...
←
→
Page content transcription
If your browser does not render page correctly, please read the page content below
Journal of Geophysics and Engineering
Journal of Geophysics and Engineering (2021) 0, 1–24 doi:10.1093/jge/gxaa066

Upper Cretaceous paleoenvironmental changes and
petrophysical responses in lacustrine record
(Songliao Basin, NE China) and marine sedimentary

 Downloaded from https://academic.oup.com/jge/advance-article/doi/10.1093/jge/gxaa066/6056650 by guest on 01 February 2021
deposit (Goban Spur Basin, NW Europe)
Kouamelan Serge Kouamelan1 , Changchun Zou1,* , Konan Roger Assie2 , Cheng Peng1 ,
Koffi Alexis N’dri3 and Ohouo Rebecca Mondah3
1
 School of Geophysics and Information Technology, China University of Geosciences, Beijing 100083, China
2
 Institute of Earth Sciences, China University of Geosciences, Beijing 100083, China
3
 School of Earth Sciences and Resources, China University of Geosciences, Beijing 100083, China
*
 Corresponding author: Changchun Zou. E-mail: zoucc@cugb.edu.cn

Received 23 April 2020, revised 7 September 2020
Accepted for publication 3 December 2020

Abstract
The Cretaceous interval is marked by several important geological changes whose prints are
buried in both continental and marine sytems. Although significant paleoenvironmental details
of this period have been inferred from biological and geochemical indicators, little is known
about the physical proxies. Through scientific borehole data, petrophysical properties of Upper
Cretaceous Songliao Basin (SB) in NE China and Goban Spur Basin (GSB) in NW Europe were
intercorrelated to investigate the critical geological paleoenvironmental shifts and their
petrophysical responses, through statistical, wavelet and spectral approaches. The results
demonstrated that petrophysical features, particularly gamma-ray and resistivity reactivities, were
responsive to past environmental changes in both terrestrial and marine systems. Shifts in
organic-rich shale deposition and brine bearing shale showed a correlation to a probable period
of seawater incursion in SB, while the gamma log, resistivity and density reactivities were
interrelated to the basin paleo-structuration. At GSB, the gamma-ray and resistivity reactivities
are tied-up to the Mid-Atlantic seabed motion, marine-water level shifts and paleoceanographic
instabilities. In both paleo-basins, a decrease in the gamma-ray reactivity occurred from Turonian
to Maastrichtian and is consistent with a regional or global increase in hydrodynamic energy. The
oceanic/lacustrine anoxic events related to low sedimentation rate occurred in both basins and
are associated with high gamma-ray and resistivity signals (SB); high gamma-ray and low
resistivity signals (GSB). These changes correlated with geochemical evidence, suggesting that
gamma-ray and resistivity can represent alternative means for marine and continental
paleoenvironmental comparison.
Keywords: Songliao Basin, Goban Spur Basin, Upper Cretaceous paleoenvironment,
petrophysical properties, electro-facies analysis

© The Author(s) 2021. Published by Oxford University Press on behalf of the Sinopec Geophysical Research Institute. This is an Open Access article distributed under the terms of 1
the Creative Commons Attribution License (http://creativecommons.org/licenses/by/4.0/), which permits unrestricted reuse, distribution, and reproduction in any medium,
provided the original work is properly cited.
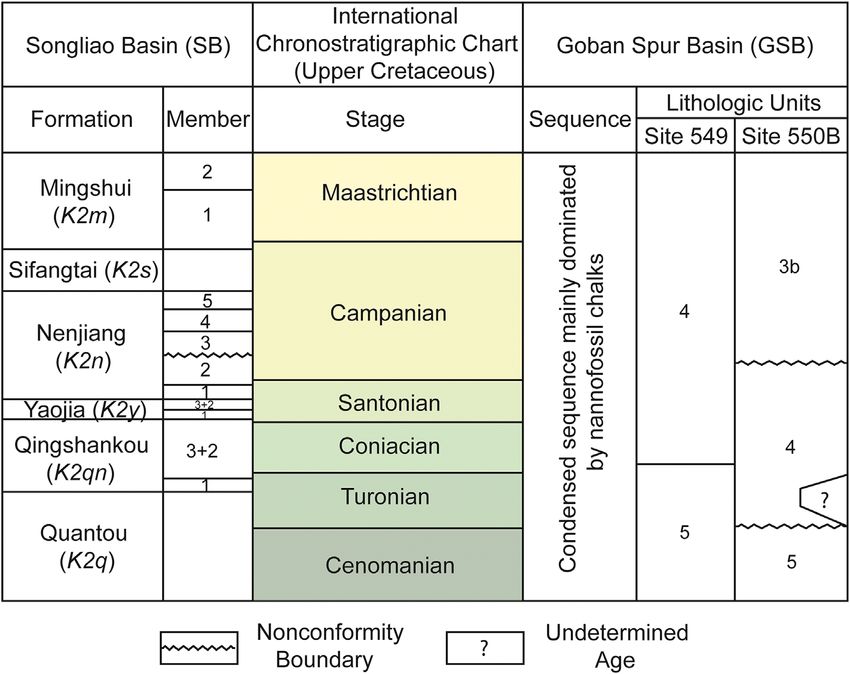
Journal of Geophysics and Engineering (2021) 0, 1–24 Kouamelan et al.

1. Introduction drilled were used. This attempt was achieved by correlat-
 ing the non-marine Cretaceous Songliao Basin in NE Asia
The Cretaceous represents in the geological record by far
 with the Goban Spur paleo-basin located in NW Europe. The
the last and extensive unit of the whole Mesozoic. Consti-
 responses obtained were then compared to a geochemical
tuting the warmest period in the Mesozoic, this is a key
 dataset.
period where the Earth has undergone major geological
 Leg 80 in GSB was prearranged to probe into the Eu-
changes such as high sea level and oceanic anoxic events
 ropean continental margin evolution (De Graciansky et al.
(OAEs), large-scale volcanic activities and Late Cretaceous
 1985). During this scientific project, Upper Cretaceous sedi-
mass-eradication episode ( Jones 2001; Schulte et al. 2010;
 ments were recorded from shallow and deep marine settings
Haq 2014; Witts et al. 2018). The traces of these events
 throughout two drilling sites (549 and 550B). The project

 Downloaded from https://academic.oup.com/jge/advance-article/doi/10.1093/jge/gxaa066/6056650 by guest on 01 February 2021
are concealed in both marine and terrestrial proxies that are
 highlighted several significant findings, such as the accumu-
mostly chemical, biological and physical indicators, which,
 lation of organic-rich carbon, expansion of the seafloor and
when analysed, provide some valuable details on paleoenvi-
 the accumulation and erosion of continental margin debris.
ronmental fluctuations.
 The Songliao paleo-basin is an important non-marine
 However, a substantial part of our current knowledge of
 Cretaceous paleo-basin filled with an impressive volume of
the Cretaceous paleoclimate and paleoenvironmental alter-
 deposits (Wang et al. 2013b), including a nearly entire Creta-
ations is mainly one-sided since previous investigations have
 ceous lacustrine records. Planned to recover continuous and
focused principally on marine datasets (Hasegawa 2003;
 complete non-marine Cretaceous sediments under the um-
Wang et al. 2013a; Wu et al. 2014; Yoshino et al. 2017), and
 brella of international collaboration, the Chinese Continen-
are generally based on biological or geochemical parameters
 tal Scientific Drilling Project carried out the first scientific in-
through core analysis. With time, problems such the difficulty
 vestigation (SK1) throughout two main boreholes, namely
of drilling continuous and complete cores, and limited out-
 the north borehole (SK1N) and south borehole (SK1S).
crop make it sometimes challenging to obtain continuous,
 The studied paleo-basins were located within the middle
high-resolution and long geological time-span data. Besides,
 latitudes climate zones of the Northern Hemisphere during
well logging data is another valuable alternative.
 the Upper Cretaceous, making them comparable (figure 1a).
 Lately, through international scientific cooperation, ter-
 This investigation contributes to the advancement of our un-
restrial Cretaceous investigations have emerged. However, al-
 derstanding of the possible paleoenvironmental changes re-
though previous paleoenvironmental studies have gradually
 lated to global or regional factors in the middle latitudes re-
enhanced our knowledge of Cretaceous changes in both ter-
 gion and their petrophysical responses throughout the Late
restrial and marine systems, few Cretaceous terrestrial and
 Mesozoic era.
marine correlative studies have been conducted (Wang et al.
2013b), and the comparison based on petrophysical proper-
ties has not yet been explored.
 Intended for oil research in the early stages, petrophys- 2. Geological setting
ical properties are no longer limited to hydrocarbon stud- 2.1. Songliao Basin (SB)
ies, but are increasingly becoming more useful in investigat-
ing past environmental shifts (Chow et al. 2005; Williams The SB, located in NE of China, covers roughly a total
et al. 2012; Peng et al. 2017; Jafarian et al. 2018). Unlike area of 260 000 km² across Heilongjiang, Jilin, and Liaon-
core sample study, well logging has the following advantages ing provinces (Wang et al. 2013a). The basin is geographi-
(Goldberg 1997; Peng et al. 2017): it is possible to carry out cally situated at mid-latitudes between 119°40́ and 128°24́ E,
high-precision continuous sampling, measurement of in situ 42°25́ and 49°23́ N and subdivided into six first-order struc-
properties, analysis of a volume of a rock that is often greater tural segments (figure 1c).
than the one represented by a core or plug and the acquisi- The tectonic framework of SB can be summarised into
tion processes are impacted less by human factors, reducing four different stages: pre-rifting, syn-rifting, post-rifting and
the effects of contamination. Therefore, studies of well logs compression. The basin is filled with a substantial volume
in past environmental change research can provide useful de- of deposits (up to 9000 m thick), which are mainly Creta-
tails that are of interest to geoscientists. ceous volcaniclastic, fluvial and lacustrine sediments (Wang
 To understand the changes in petrophysical properties et al. 2002). According to Wu et al. (2009), a regional incon-
tied to the Upper Cretaceous paleoenvironmental variations formity subdivides the Late Jurassic and Cretaceous strata
in both terrestrial and marine systems, petrophysical datasets into two stratigraphic sequences. The upper section repre-
from both milieus need to be intercorrelated. In the current senting the SB’s well-known sequence is upwardly composed
study, well logging data from ocean and continental drilling of Denglouku (K1 d), Quantou (K2 q), Qingshankou (K2 qn),
projects where an Upper Cretaceous sediments have been Yaojia (K2 y), Nenjiang (K2 n), Sifangtai (K2 s) and Mingshui

 2
Journal of Geophysics and Engineering (2021) 0, 1–24 Kouamelan et al.

 Downloaded from https://academic.oup.com/jge/advance-article/doi/10.1093/jge/gxaa066/6056650 by guest on 01 February 2021

Figure 1. (a) Northern hemisphere paleogeography and paleoclimate during the Late Cretaceous (80 Ma) and location of study area (modified from
scotese.com/lcretcli.htm); (b)–(e) Borehole locations and geological map of the Songliao Basin and the Goban Spur Basin (modified from Yang et al.
(2018) and Luft de Souza et al. (2018), respectively, with permission from Elsevier).

(K2 m) lithofacies deposited from nearly Aptian for K1 d to containing an upward sequence of lacustrine to fluvial facies
Maastrichtian for K2 m, representing the end of the Meso- with some probable marine evidence in the first two (Wang
zoic in SB (figures 1e and 2). K2 qn is divided into three et al. 2013b). K2 s is dominated by fluvial facies. The strati-
members and is essentially a deep-lake environment deposit. graphic sequence ends with K2 m, composed of formations
K2 y is composed of deltaic to lacustrine sediments with two alternating between fluvial and shallow lake deposits. The SB
stratigraphic members. K2 n is subdivided into five members experienced some episodes of oil shale deposition with the

 3
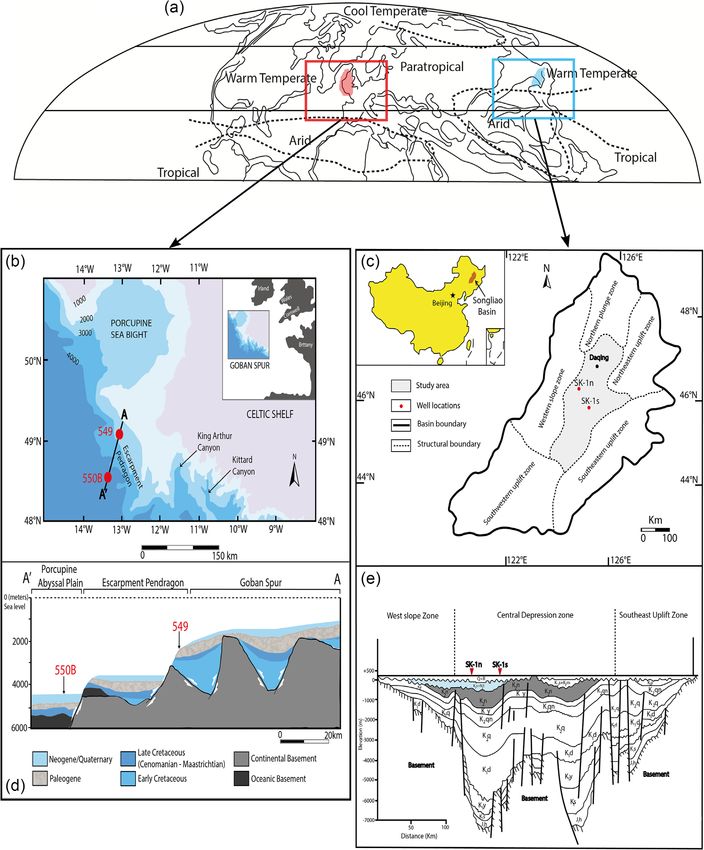
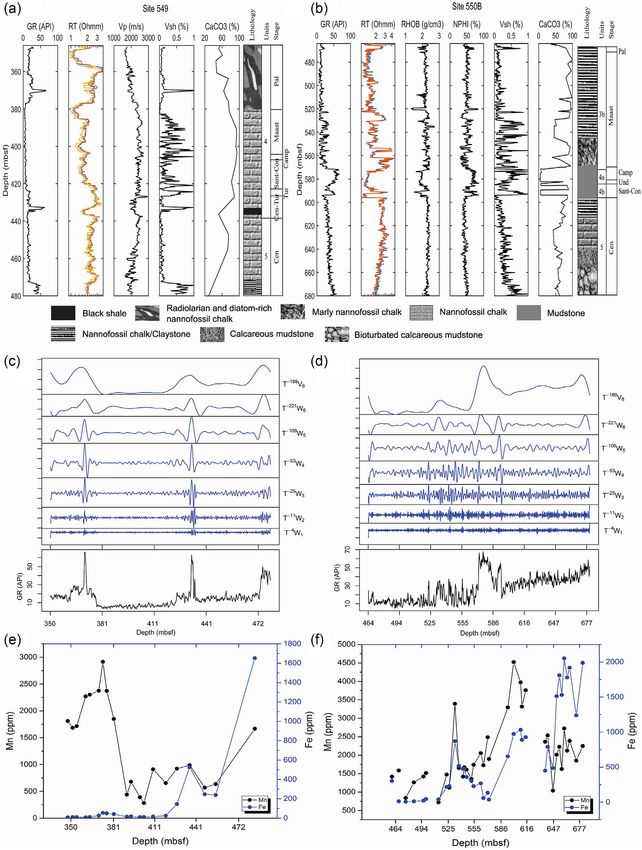
Journal of Geophysics and Engineering (2021) 0, 1–24 Kouamelan et al.

 Downloaded from https://academic.oup.com/jge/advance-article/doi/10.1093/jge/gxaa066/6056650 by guest on 01 February 2021
Figure 2. Synthesis of the stratigraphic column of Songliao Basin (based on Wu et al. (2013, 2014)) and Goban Spur Basin (based on De Graciansky
et al. (1985)).

most important and well-known episodes occurring during tions, constituting a large series of horsts, graben and tilted
the Turonian (in K2 qn) and late Santonian (in K2 n) (Wang fault groups with a nearly parallel trend toward the main
et al. 2013b; Xu et al. 2015). Celtic/Armorican Shelf edge (Dingle & Scrutton 1979).
 Detailed drill core analyses indicated that deposits associ- According to Colin et al. (1992), the Goban Spur has gen-
ated with marine and brackish water developed in the paleo- erally experienced three major geological episodes; namely
basin. Marine ingression was probably a consequence of five an extensional phase of basin initiation in the Triassic and ex-
marine transgressive episodes from Valanginian to late Santo- tending into the Early Jurassic (pre-rifting), a relatively quies-
nian (Sha 2007; Xi et al. 2011a), originating from the north- cent phase during the rest of the Jurassic and the Lower Cre-
western Paleo-Pacific Ocean. taceous, with low sedimentation rate (Syn-rifting) and the
 The Cretaceous’s paleoclimate in the paleo-SB was chiefly lower Cretaceous deepening phase that enhanced through
temperate and humid with relatively abundant rainfall cou- the early Paleocene (post-rifting). Large listric fault trends
pled with some rapid environmental change episodes (Wang parallel to the actual margin orientation developed within the
et al. 2013a). Paleomagnetic studies revealed approximately a Hercynian basement during the rifting. Based on De Gra-
paleolatitude of 40–50°N (Fang et al. 1990), which is similar ciansky et al. (1985), these fault trends formed half-grabens
to the basin’s actual position making SB a potential candidate in which a variety of non-marine and shallow-marine syn-rift
for terrestrial paleoenvironment investigation. sediments were deposited (figure 1d).
 The Upper Cretaceous unit, consisting of two lithologic
 series at site 549 and three at site 550B is mainly domi-
2.2. Goban Spur Basin (GSB)
 nated by nannofossil chalks (figure 2). There are intervals
Located at the junction between the northwest Celtic mar- of organic-rich shale deposition and burial befell near the
gin and the northward Porcupine Seabight and Irish mar- Cenomanian-Turonian transition. At site 549, the Upper
gin, GSB is a marginal submarine plateau at a latitude of Cretaceous sequence is composed of mainly white chalks in
49°N in NE Atlantic (figure 1b). It was formed by the es- the upper section, while black shale is present in the lower
tablishment of the North Atlantic gateway between Europe Turonian deposits. Dark claystone with calcareous mud-
and North America during the Cretaceous period (Bullock & stones and nannofossils chalks with calcareous turbidites are
Minshull 2005). The GSB is underlaid by a basement made the main sediments recorded at site 550 (De Graciansky et al.
up of pre-rifting Hercynian granites and Paleozoic forma- 1985).

 4
Journal of Geophysics and Engineering (2021) 0, 1–24 Kouamelan et al.
Table 1. Conventional petrophysical properties and their particular applications (ODP Logging Manual, 2004: odplegacy.org).

 Applications

 Paleoclimate High
 Petrophysical paleoenviron- Sedimentology Magnetostrati- Structural temperature
Logs parameters ment stratigraphy graphy Geochemistry geology Hydrogeology environment

Nuclear Natural x x x x
 properties gamma ray
 Magnetic sus- x x
 ceptibility

 Downloaded from https://academic.oup.com/jge/advance-article/doi/10.1093/jge/gxaa066/6056650 by guest on 01 February 2021
 Porosity x x x
 Density x x x x x
Electrical Resistivity x x x
 properties
 Electrical x x x
 image
Sonic Acoustic x x
 properties velocity
 Acoustic x
 image

 Paleontological evidence (Linnert et al. 2011), revealed a (GR) log, acoustic log, compensated neutron log, dual lat-
paleoclimate marked by a slight cooling period throughout erolog, spontaneous potential log, density log, array induc-
the Cretaceous at Goban Spur. The Upper Cretaceous, es- tion and caliper (CAL) logs.
pecially the latest Campanian and Maastrichtian period de- During DSDP Leg 80, the variable length hydraulic pis-
noted for the first time that marine deposits were continu- ton corer drilling system and the rotary coring were used. At
ously and widely distributed across the whole GSB and its site 549 (2535.5 m water depth), four different logs were run:
proximate regions (Snyder et al. 1985) coupled with carbon- dual induction, GR, sonic and CAL. Only the GR log was run
ate accumulation. Thereby, conducting a paleoenvironmen- in the whole hole. Hole 550B was drilled to a depth of 4430 m
tal study using Upper Cretaceous strata from GSB might be underwater and the log data recorded included GR, neutron
suitable for the understanding of local, regional and likely porosity, bulk density, resistivity, sonic and CAL.
global environmental changes.

 3.2. Methods
3. Data and methods
 3.2.1. Time-series analysis. The fast and robust pyrami-
Geophysical well logs represent in situ physical and/or chem- dal algorithm maximal overlap discrete wavelet transform
ical parameters that characterise the formations crossed by (MODWT) implemented by Percival & Walden (2000)
the drilling and their surroundings and therefore contain ge- and the evolutive of time scale optimisation algorithm
ological and/or petrophysical details. Several among these (eTimeOpt) of spectral analysis (Meyers 2015) were con-
logs are very useful for facies and depositional environment ducted on the petrophysical properties for data analysis in SB
analysis (Table 1). Although both sites (SB and GSB) have and GSB.
been drilled and logged with different logging tools and For high-resolution datasets analysis of periodicities in
in different contexts, the physical parameters recorded are time-series data, diversified mathematical modus operandi
mostly similar. such as fast Fourier transform, short-time Fourier trans-
 form, wavelet transform (WT), trend analysis, Lomb, period
 scanning and autocorrelation have been widely used (Gos-
3.1. Data
 sel & Laehne 2013; Hloupis & Vallianatos 2015) in several
Based on two different drilling techniques (the oil explo- domains. The WT based on multi-resolution analysis is a
ration drilling method in SK1S and the geologic core drilling widely used band-pass filter for nonlinear and non-stationary
technology in SK1N), previous significant research and the signal characterisation (Upadhyaya & Mohanty 2016). Ac-
situation of drilling times, three well logging suites were ap- cording to Hloupis & Vallianotos (2015), WT operates by
plied during SK1. The geophysical logs acquired in the bore- decomposing a signal function or vector into a set of sim-
hole SK1N and borehole SK1S included natural gamma-ray pler, fixed blocks at different scales and positions. Percival

 5
Journal of Geophysics and Engineering (2021) 0, 1–24 Kouamelan et al.

 Downloaded from https://academic.oup.com/jge/advance-article/doi/10.1093/jge/gxaa066/6056650 by guest on 01 February 2021
Figure 3. Block diagram of MODWT decomposition and box plot description (IQR = interquartile range or middle 50%).

 n = 0,…, N − 1, where h̃ j, l ≡
& Walden (2000) determined and classified two principal hj, l
 √ (for high-pass filtering) and
types of wavelets namely continuous wavelet transform and 2
 g j, l
discrete wavelet transform (DWT), which uses the sequence g̃ j, l ≡
 √
 2
 (for low-pass filtering).
defined essentially over a range of integers (usually t = 0, The eTimeOpt is a statistical approach for untuned strati-
1,…, N − 1, where N denotes the number of values in the graphic data that comprehensively evaluates the possible evo-
time series). Dissimilar to the orthonormal partial DWT, the lution of the formations deposit process (Meyers 2015). This
MODWT works as a highly linear redundant filtering oper- algorithm attempts to identify the sedimentation rate for
ation that transforms a level J0 of a time series X in column a given depth-scaled paleoclimate/paleoenvironment proxy
vectors W ̃ 2 ,…, W
 ̃ 1, W ̃ J and Ṽ J , each of dimension N. The de- data series (wdata ) through three main phases, which inde-
 0 0
composition of an infinite sequence {Xn } to Jn levels theoret- pendently evaluate the amplitude modulation and spectral
ically involves the application of Jn pairs of filters (figure 3a). power, and later on integrate these outcomes. By using fil-
Therefore, the decomposition phase at the jth level provides ters and the Hilber algorithm, the observed astronomical
a set of wavelet coefficients (W ̃ j ) and a set of scaling coeffi- precession-set amplitude envelope is extracted for each sed-
 ̃
cients (Vj ) through high/law-pass filtering using equations imentation rate based on equation (3), where the more suit-
(1) and (2), respectively. able model at each sedimentation rate is determined through-
 out least squares (Meyers 2015):
 Lj −1
 ∑ wenvelope = Ae e + , (3)
 ̃ j,n =
 W h̃ j,l Xn−l mod N, (1)
 l=0 where wenvelope represents the precession-set amplitude
 envelope for the temporally calibrated paleoclimate/
 Lj −1 paleoenvironment data series, Ae a trigonometric
 ∑
 Ṽ j,n = g̃j,l Xn−l mod N, (2) matrix (cosine and sine function) predictor terms
 l=0
 6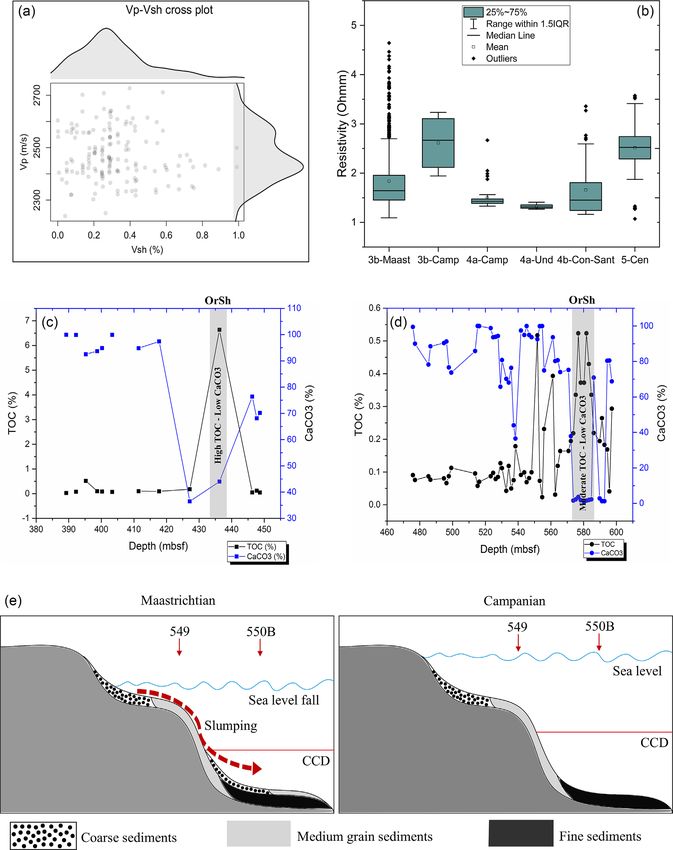
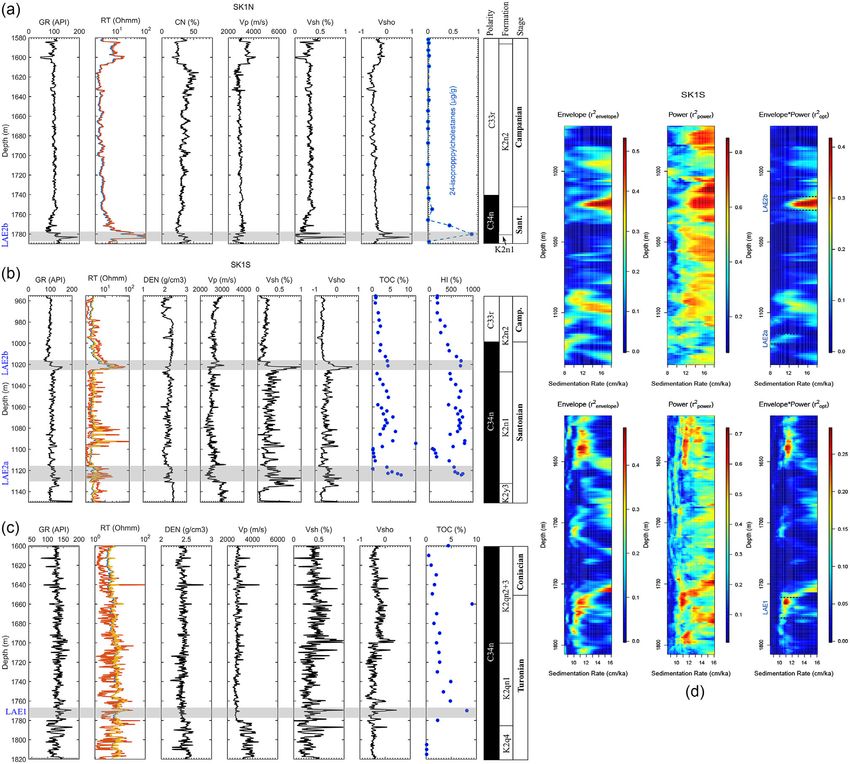
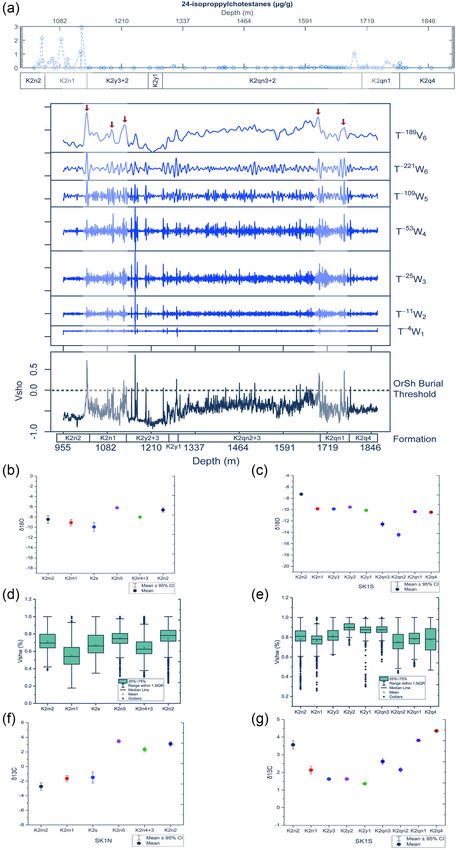
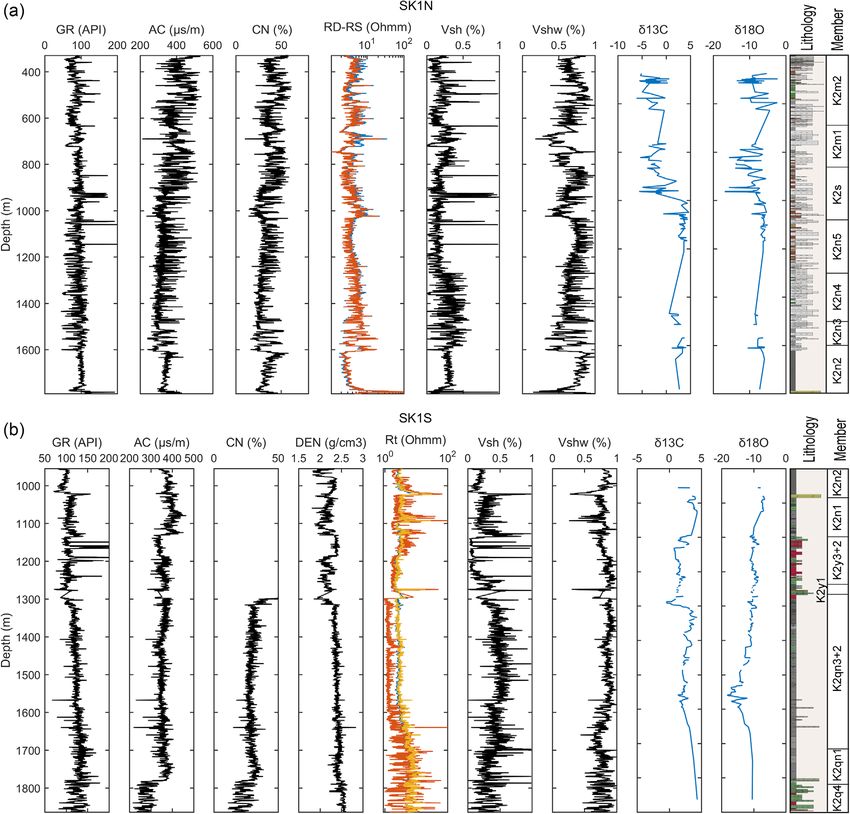
Journal of Geophysics and Engineering (2021) 0, 1–24 Kouamelan et al.

representing the eccentricity phases, e a vector of re- Among these components, the brine and the organic mat-
gression constants for each estimator and a vector of error ter are the most sensitive to influence the resistivity of the
terms. deposits.
 Equation (3) operates across a lattice of sedimentation
rates and then allow the evaluation of the quality of the fit
at each sedimentation rate through a bivariate correlation be- 4. Results
tween the subtracted envelope wenvelope and the fitted eccen- The statistical evaluation of the petrophysical proprieties
tricity phase, g(Ae , e ). The resulting correlation modulus from SK1 and Leg 80 has been assessed and displayed in
 2
namely renvelope represents the fraction of variance shared be- figures 4 and 5, indicating that the lacustrine and marine
tween the model and temporally calibrated amplitude enve- sediments deposited in both paleo-basins during the Upper

 Downloaded from https://academic.oup.com/jge/advance-article/doi/10.1093/jge/gxaa066/6056650 by guest on 01 February 2021
lope at a given sedimentation rate (Meyers 2015). Cretaceous showed more or less variable physical properties.
 By using the linear regression (equation 4), the spectral Based on GR trend analysis, a regular decrease in radioac-
 2
power (rspectral ) for each temporal tuning is evaluated, with tivity was identified at both the SK1 and Leg 80 sites. In SK1
wdata (temporally tuned data series), Aep (trigonometric ma- the drop of GR was recorded from Turonian (K2 qn forma-
trix), ep (regression coefficients vector) and (vector of tion) to Maastrichtian (K2 m formation) (figure 4a and b).
error terms). The boundary between Member 1 and Member 2 of K2 n for-
 mation at approximatively 1780 m (figure 6a) and 1030 m
 wdata = Aep ep + . (4) (figure 6b) were dominated by an upward increase in the
 GR response (serrated bell shape) and increased resistivity
 The final fit combining the amplitude envelope and the
 responses in both north and south boreholes.
spectral power is estimated using equation (5), where r2 opt
 In SK1, the highest value of GR and shale volume in the
is the product of the fraction shared between envelope and
 studied interval have been recorded in the south borehole
data (Meyers 2015).
 precisely in K2 qn formation (figure 4b and d), which is Tur-
 2
 ropt = rspectral
 2 2
 renvelope . (5) onian and Coniacian in age. On the other hand, the lowest
 GR and shale content are recorded in north borehole namely
This astronomical approach is accordingly useful for high- in K2 m formation deposited during the Maastrichtian
resolution evaluation of the formation sedimentation rate. (figure 4a and c). The analysis of the GR log showed that
 particular picks of GR counts appear almost in the lower
3.2.2. Statistical analysis. A statistical approach based on Member 1 and Member 2 of K2 n formation, and the first
box-plot analysis was used for data comparison. Dissimilar member of K2 qn unit (figure 6a and b). Similar to the GR
to the bar chart for data representation, the box plot is a and shale volume, the resistivity and velocity decreased from
powerful approach that uses statistical summaries that are the Turonian formations to the Maastrichtian formations
robust in the presence of skewness and outliers and require (figure 5a, b and e, f). The description of core samples
no prior assumption about the samples (Nuzzo 2016). This recorded at SK1N and SK1S during SK1 showed that the for-
tool presents several advantages as (i) complete details can mations ranged roughly from mudstone-dominated oil shale
be drawn from the full range of the data (figure 3b), (ii) in K2 qn formation, to colored mudstones in K2 n formation.
can be used for small size sample data (n = 5) and (iii) Based on tequations (6) and (7) and resistivity log data,
quick and complete side-by-side correlation between groups the estimated organic-bearing shale content (VSho ) exhibited
(figure 3c). high values in lower Member 1 and Member 2 of K2 n for-
 mation, and the first member of K2 qn unit (figure 7a). The
3.2.3. Lacustrine brine shale content and organic-rich shale brine bearing shale content of the Songliao paleo-lake was es-
(OrSh) estimation. The resistivity log is an ideal parameter timated and correlated to the carbon and oxygen stable iso-
through which the OrSh content can be evaluated. The sedi- topes (figure 7b–g). In borehole south, the box plots show
mentary shaly formations can be subdivided into background that the mean of the evaluated Vshw closely mimics the vari-
or matrix, brine shale content (VShw ) and organic matter ation of 18 O in the whole section of the intervals studied
(VSho ) (Nie et al. 2017). The VShw and VSho can be estimated (figure 7c and e).
using equations (6) and (7), respectively: In Goban Spur, the log gamma reflects a consistent de-
 VShw = 10(log(Rsh)−log(RT))∕d , (6) crease in radioactivity from the bottom to the top intervals
 with some higher gamma responses in some of the in be-
 VSho = VSh − VShw , (7) tween intervals (figure 8a and b). The resistivity response
 shows a shift in resistivity across these intervals. The maxi-
where Rsh is the resistivity of pure shale formation, d is an mum GR count and shale volume through the intervals stud-
index varying between 1 and 2, and VSh is the shale volume. ied were identified at site 550B in the Campanian deposit

 7
Journal of Geophysics and Engineering (2021) 0, 1–24 Kouamelan et al.

 Downloaded from https://academic.oup.com/jge/advance-article/doi/10.1093/jge/gxaa066/6056650 by guest on 01 February 2021

Figure 4. Statistical analysis of the petrophysical properties (gamma-ray (GR) and shale volume) in Songliao Basin (a–d) and Goban Spur Basin
(e–h) at different periods (Maast = Maastrichtian, Camp = Campanian, Sant = Santonian, Con = Coniacian, Tur = Turonian, Cen = Cenomanian
and Und = undetermined).

 8
Journal of Geophysics and Engineering (2021) 0, 1–24 Kouamelan et al.

 Downloaded from https://academic.oup.com/jge/advance-article/doi/10.1093/jge/gxaa066/6056650 by guest on 01 February 2021

Figure 5. Statistical analysis of the petrophysical properties (resistivity, velocity and porosity) in Songliao Basin (a, b, e, f) and Goban Spur Basin (c, d,
g, h) at different periods (Maast = Maastrichtian, Camp = Campanian, Sant = Santonian, Con = Coniacian, Tur = Turonian and Cen = Cenomanian).

 9
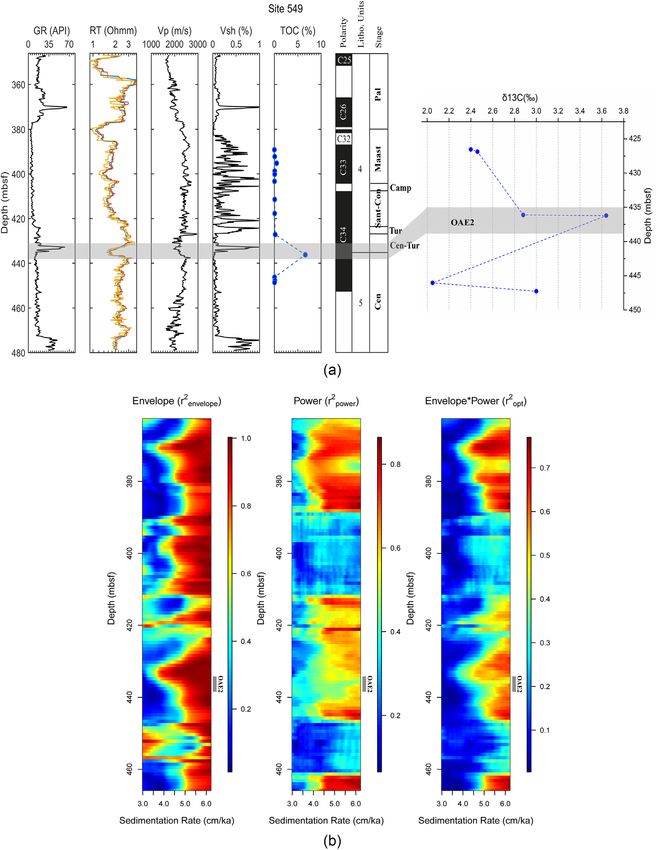
Journal of Geophysics and Engineering (2021) 0, 1–24 Kouamelan et al.

 Downloaded from https://academic.oup.com/jge/advance-article/doi/10.1093/jge/gxaa066/6056650 by guest on 01 February 2021
Figure 6. Well logs responses correlated to oxygen and carbon isotopes data in SK1N (a) and SK1S (b). For resistivity log, blue = RD, orange = RS and
light orange = RM.

(figure 4f and 4h) (approximately 574–573 mbsf). The esti- posits at site 549, while the lowest shale content was recorded
mated mean of shale volume was around 0.5%. Through this through the Cenomanian formations at drilling site 549
short-term depositional interval, the deposit is mostly domi- (figure 4e and 4g). The resistivity response showed an
nated by a massive non-calcareous mudstone. The increasing increasing mean resistivity from Cenomanian to Turonian
trend of the GR value is related to the deposition of fine-grain deposits and later a decreasing trend for the Coniacian-
size deposits. Santonian and Maastrichtian deposits at drilling site 549
 At site 549, the GR log exhibited a decreasing trend from (figure 5c). At site 550B, the mean resistivity decreased from
Cenomanian to lower Paleocene (figure 8a), from approxi- Cenomanian to Coniacian-Santonian formations and in-
mately 480 to 383 mbsf. Particularly, a peak of radioactivity creased through the Campanian to Maastrichian formations
associated with low resistivity was observed in a Turonian- (figure 5d). The GR decreased from Cenomanian to Maas-
Santonian deposit at nearly 436 mbsf (figure 8a). The lowest trichtian (680 to 465 mbsf) (figure 8b), except for 594.3 to
GR value in this paleo-basin was read in Maastrichtian de- 570.68 mbsf. In both boreholes, the porosity and velocity

 10
Journal of Geophysics and Engineering (2021) 0, 1–24 Kouamelan et al.

 Downloaded from https://academic.oup.com/jge/advance-article/doi/10.1093/jge/gxaa066/6056650 by guest on 01 February 2021

Figure 7. Scaling coefficient of the estimated OrSh and changes in Vshw in Songliao Basin. (a) Correlation between the estimated OrSh deposition and
marine bio-marker (data from Hu et al. (2015)) and (b–g) correlation between the estimated brine bearing shale content based on resistivity log and
oxygen and carbon isotopes data.

 11
Journal of Geophysics and Engineering (2021) 0, 1–24 Kouamelan et al.

 Downloaded from https://academic.oup.com/jge/advance-article/doi/10.1093/jge/gxaa066/6056650 by guest on 01 February 2021

Figure 8. (a, b) Well log responses in Goban Spur Basin; correlation of scaling coefficient of GR response with Mn and Fe content variation at site 549
(c, e) and site 550B (d, f). For resistivity log, blue = RD, orange = RS and light orange = RM.

 12
Journal of Geophysics and Engineering (2021) 0, 1–24 Kouamelan et al.

responses increased from Cenomanian to Campanian de- et al. 2013; Xu et al. 2015). Previous studies have shown that
posits and dropped through Maastrichtian formations during the deposition of these layers, the paleo-basin passed
(figure 5g and 5h). The mean resistivity at this site was lower from shallow lake in the K2 y formation to a deep-lake envi-
compared to site 549 (figure 5c and 5d). ronment (Wu et al. 2013). The downward decrease in the
 porosity of the formation (a function of hydrogen index) in
 lower K2 n Member 2 may indicate that the hydrogen con-
5. Discussion centration decreased before an abrupt shift at the base of the
5.1. Petrophysical properties as indicator of paleo-lake section (figure 6a). The drop in porosity suggests the weak-
 environment changes ening of OrSh, oxygenation dominated deposits, and hence
 the lowering of the water depth during the deposition of this

 Downloaded from https://academic.oup.com/jge/advance-article/doi/10.1093/jge/gxaa066/6056650 by guest on 01 February 2021
5.1.1. Deposition of OrSh. The sedimentary history of the interval. This seems consistent with some scholars who de-
non-marine Songliao Basin has shown that the basin expe- scribed that Songliao paleo-lake experienced relatively shal-
rienced some periods of oil shale deposition most impor- lower episodes during the deposition of Members 1 and 2
tantly throughout the depositional time of K2 qn and K2 n for- of K2 n (Xi et al. 2011b; Bechtel et al. 2012). The deposition
mations (Xu et al. 2015), and are mainly Turonian and late of the low porosity interval is preceded by high porosity de-
Santonian in age. The GR reactions have been used to ex- posits from ̴roughly 1787 to 1775 m (bottom of the inter-
plore and examine changes in paleo-depositional facies and val), which is associated with high radioactivity, high resistiv-
sequences in marine organic-rich settings (Luning & Kolonic ity and high transit time features, showing that this section
2003), due to its spontaneous sensitivity to sequence bound- is organically rich and accordingly was deposited in deep-
aries and/or organic materials. It represents one of the gen- lacustrine paleo-settings (Burton et al. 2014). This correlated
erally used physical parameter in the evaluation of origanic- with the increase in OrSh content and consequently a deep-
rich deposits (Kamali & Allah Mirshady 2004). However, the ening of the paleo-lake in upper Member 1 and lower Mem-
response of GR log in lacustrine systems can present a sig- ber 2 of the K2 n formation (figure 7a).
nificantly different trend from marine records (Bohacs 2012; Therefore, the variations in the OrSh content obtained
Tänavsuu-Milkeviciene et al. 2017). Resistivity is another through resistivity log data may be as a consequence of
important log for organic matter identification (Nie et al. past environmental changes in SB. During the deposition of
2017). Member 1 of K2 qn and Members 1 and 2 of the K2 n forma-
 The estimated VSho in SK1 firmly supports the existence tions, the deepening of the paleo-lake induced by rapid basin
of OrSh deposition in lower Member 1 of both K2 n and subsidence and/or marine-water ingression (Wang et al.
K2 qn formations and was well expressed in south borehole 2013b) generated an oxygen-depleted water bottom (anoxic
(figure 7a) and correlated well with the changes in the lithol- environment) in the lake. The anoxic bottom water would
ogy (figure 6). Due to its organic matter content, the lacus- have favored the deposition and/or preservation of OrSh
trine OrSh can exhibit low bulk density and high porosity during the deposition of lower K2 qn and K2 n formations that
(Burton et al. 2014). The evaluation of the density (DEN) affected the physical properties, especially the resistivity.
and porosity (CN) log responses indicated a dense and
porous deposit, in the identified high VSho intervals (figures 6 5.1.2. Brine bearing shale (Vshw ) content, paleoclimate and sea-
and 7a), which seems to suit the work of Burton et al. (2014) water ingression. Climatic changes easily affect the lacustrine
also conducted in a non-marine system. The variation of VSho constituents, i.e. water flux level and deposits (Risacher &
shows that the deposition of OrSh was lower in Member Fritz 2009). The periodical shifts in the climate alter the cy-
4 of the K2 q formation, increased during the early stage of cles of the sediments and the volume of water in the lake,
K2 qn formation (Member 1) and decreased in Members 2 which tends to increase with the increase in precipitation.
and 3 of K2 qn formation (figure 7a), which may be due to The brine content (pore-water salinity) included in the de-
the changes in the depositional environment. Similar trends posits can fluctuate as the climate oscillates (Lowenstein et al.
have been described by Wang et al. (2013b) and Peng et al. 1994). For instance, increasing aridity with high evapora-
(2017). The OrSh tends to settle in deep depositional envi- tion intensifies the salinity of water (Lowenstein et al. 1994;
ronments. The paleoenvironmental studies referred to by Wu Risacher et al. 2003). Similarly, geochemical elements such as
et al. (2013) showed that Member 4 of K2 q, Member 1 of stable isotopic elements ( 18 O and 13 C) rise with enhanced
K2 qn and Members 2 and 3 of K2 qn were deposited in the salinity (Keith & Weber 1964; Cao et al. 2015). Here, the
meandering river, deep-lacustrine and sub-deep-lacustrine changes in the computed brine bearing shale content was put
settings, respectively. This description ties with the variations in parallel with the past environmental fluctuations. The use
recorded in the estimated VSho . of brine bearing shale content to connect with past environ-
 Other significant intervals of OrSh deposition occurred mental changes in lacustrine settings was motivated by the
throughout Members 1 and 2 of the K2 n formation (Wu work of Tomonaga et al. (2017) who found a clear rapport

 13
Journal of Geophysics and Engineering (2021) 0, 1–24 Kouamelan et al.

between paleo-lake environmental changes and pore-water lower, and in relatively hot and arid conditions, paleosalin-
salinity, highlighting the potential of brine content to infer pa- ity is high due to increased evaporation. Following this line
leoenvironmental fluctuations. of thought, a second member of K2 n was deposited in hu-
 In K2 qn formation, the Vshw content decreased from mid to sub-humid context (Wang et al. 2013b), which should
Member 1 to Member 2, and increased through Member have result in low salinity and low Vshw content accordingly.
2 and 3. From Member 1 to Members 2 and 3 of K2 qn, However, the brine content was amplified indicating that the
the Songliao passed from subtropical semi-humid to tropi- increased Vshw content in Member 2 of K2 n was more likely
cal warm humid climate (Wang et al. 2013a), which likely not due to the paleoclimate.
led to the shift in stable isotope 18 O and 13 C contents Most brines in paleo-sedimentary basins are related in
(figure 7c and g), and most probably in the drop of Vshw. This some way to seawater phenomena (Sanders 1991; Birkle

 Downloaded from https://academic.oup.com/jge/advance-article/doi/10.1093/jge/gxaa066/6056650 by guest on 01 February 2021
environmental changes are also supported by the presence of et al. 2009; Lüders et al. 2010; Bagheri et al. 2014). Indeed,
the red bed record considered as an arid print in Members 2 based on sedimentary details, anterior research showed an
and 3 of K2 qn, while in Member 1 these deposits are missing enhanced salinity and anoxic bottom-water strata in Mem-
(Xi et al. 2011b; Wang et al. 2013a). The arid episode pro- bers 1 and 2 of K2 n (Wang et al. 2011), which promoted the
longed to Members 2 and 3 of K2 y formation, and probably settling of organic-rich deposits. These organic-rich source
would have led to an increase in the degree of evaporation rocks were, in some way, the consequence of seawater ingres-
as the climate became dry and hot (Xi et al. 2011b). Conse- sion into SB (Xi et al. 2011a; Hu et al. 2015). If our dataset is
quently, an increasing long trend Vshw occurred from Mem- accurate, we speculate that during the deposition of Member
ber 2 of K2 qn to Member 2 of K2 y formation, and was asso- 2 of K2 n formation, the salinity of the paleo-lake increases.
ciated with an increase in 18 O (figure 7c and e). Through This increase in paleosalinity may likely be related to an un-
the late stage of K2 y formation (Member 3) and early stage common change in the basin, such as seawater ingression.
of K2 n (Member 1), the Vshw as well as 18 O dropped, al- The seawater would have favored an establishment of a
though these layers were formed in subtropical semi-humid brackish water environment leading to an enhanced salin-
conditions with a slightly dry and hot episode in Member 3 of ity stratified water column, which helped the development
K2 y. The climatic context changed from arid to humid, likely of OrSh during the formation of Members 1 and 2 of K2 n.
leading to the decrease in evaporation and thus the drop in This matches with the analysis of specific marine evidence
Vshw . Based on Wang et al. (2013a), SB experienced a drop (figure 7a), where the peaks of these biomarkers show that
in temperature from late K2 y to Members 1 and 2 of K2 n for- Members 1 and 2 of the K2 n formation were affected by sea-
mation. This drop in temperature correlates to the fall in tem- water ingression. Subsequently, the sediments deposited in
perature records from the Far East Cretaceous climate (Wang such milieu for an extended period can archive the change
et al. 2013a). in the salinity in their pore space (Strassmann et al. 2005).
 The Vshw content increases from Member 1 of K2 n forma- Therefore, we correlated the increase in Vshw content associ-
tion to Member 2 as do 18 O and 13 C (figure 7c, e and g). ated with increasing 18 O and 13 C isotopes in Member 2 of
However, the climatic context remained as subtropical humid K2 n formation to a seawater event during the deposition of
to semi-humid during the deposition of Member 2 of K2 n K2 n 1 and 2, as described in several studies (Xi et al. 2011a;
formation. Therefore, the significant changes in the recorded Hu et al. 2015), which contributed to the brine bearing shale
Vshw content and stable isotopes may not be due to the cli- enrichment and deposition of OrSh.
mate, but either acid rain or the introduction of saline water, During the deposition of mid-K2 n (Members 3 and 4),
which helped the rise of the paleo-lake salinity. Through its the Vshw content drops as well as 18 O and 13 C, and later
long evolution, the Earth has undergone large volcanic erup- increases through late K2 n (Member 5), implying that the
tions that could have generated acid rain and lake acidifica- phenomenon responsible for their rise ceased in the mid-
tion (Bailey et al. 2005; Varekamp 2008), including some K2 n. From mid-K2 n through to the late K2 n, Songliao went
parts of NE China during the Early Cretaceous (Zhou et al. from subtropical humid to the subtropical semi-arid environ-
2016). However, though the volcanic events have been ad- ment (Wang et al. 2013b), which led to the paleo-lake to go
mitted as normal events in SB during the Upper Cretaceous, through increased evaporation and accordingly an increased
according to Li et al. (2017) they probably happened during Vshw . This increasing tendency is also evident in 18 O and
K2 qn formation deposition. Therefore, lake acidification due 13 C contents (figure 7b, d and f). The Vshw decreases in
to probable acid rain caused by volcanic events may not be K2 s formation, and also 18 O and 13 C contents, although
the result of increased Vshw and stable isotopes observed from the paleoenvironment remains subtropical semi-arid (Wang
Member 1 of K2 n to Member 2 of K2 n formations. et al. 2013b). From K2 s to the first member of K2 m forma-
 Many studies have reported the relationship between pale- tion, Vshw content decreases and correlates well with a de-
oclimate and salinity. For example, Cao et al. (2015) claimed crease in 13 C and an increase in 18 O. The paleo-lake shifted
that in a relatively humid climatic context, paleosalinity is from subtropical semi-arid to subtropical humid, and ended

 14
Journal of Geophysics and Engineering (2021) 0, 1–24 Kouamelan et al.

up as warm temperate semi-humid in late K2 m (Wang et al. laminated organic shale and fine-grained carbonate deposits
2013b). The 13 C was still dropping during the deposition with high neutron porosity and low density. Therefore, the
of late K2 m, whereas the Vshw content and 18 O increased. high porosity and low density (figure 9a–c), associated with
Since isotopes 18 O and 13 C did not undergo important the presence of marly organic shale, especially in lower K2 qn,
fluctuations, but kept increasing and decreasing, respectively, supports our assumptions that the changes in porosity and
the changes in Vshw content from K2 s formation to late K2 m density are tied to changes in the paleofacies. With the de-
may not have been due to the climatic variation only. Accord- scription of specific marine evidence, i.e. C30 steranes (Hu
ing to previous studies, the paleo-basin underwent a period et al. 2015) in these LAE intervals (figures 7a and 9), it has
of basin restructuring where the paleo-lake shrunk gradually been suggested that seawater helped in the setting-up of an
from K2 s to the end of K2 m formation (Bechtel et al. 2012). anoxic system in SB (Xi et al. 2011a; Wang et al. 2013b).

 Downloaded from https://academic.oup.com/jge/advance-article/doi/10.1093/jge/gxaa066/6056650 by guest on 01 February 2021
This reorganisation would have affected the changes in Vshw Previous LAEs investigations have proven that an elevated
content. pCO2 due to volcanic events promoted the development of
 In the north borehole where the upper K2 n is well ex- anoxic conditions in a vast lacustrine system in SW China
plored, the result of the wavelet decomposition showed a de- (Xu et al. 2017), indicating that terrestrial LAEs can be initi-
crease in radioactivity from Member 2 of K2 n toward the ated by volcanic activities. The massive volume of CO2 pro-
top, which seemed to indicate that the hydrodynamic en- duced during the eruptions can affect the hydrological cy-
ergy increases from the Member 2 up to K2 m formation and cles and accordingly intensify the flux of nutrients toward
then decreases in shale content. As the shale is predominantly the lakes boosting the lacustrine bioproduction and sediment
made up of fine-grain size fractions of sediments and sedi- storage (Xu et al. 2017). However, in SB the prints of volcanic
mentary rocks, they are mostly deposited in a deep environ- activities during the Upper Cretaceous were observed only in
ment or fare from the wave zone in the aquatic environment. lower Member 3 of K2 qn formation (Li et al. 2017). The exis-
In line with this argument, the Songliao paleo-lake became tence of LAEs in K2 qn first Member and K2 n Members 1 and
shallower during its late stage. A similar trend has been de- 2 implies that their deposition and volcanic activities may not
scribed by several scholars such as Wu et al. (2009), and Wang be coeval. Moreover, the weak petrophysical features, espe-
et al. (2013a), who have suggested that the Late Cretaceous cially GR and resistivity, show no evidence of volcanic ash de-
strata of SB (K2 s and K2 m formations) were deposited in a position since these deposits are indicative of typically high
shallow environment, during the waning of the basin’s life. GR and resistivity response. Thus, the LAEs developed in
Thus, the variation in Vshw content may be the consequence deep-lacustrine paleoenvironment with likely small scale ma-
of paleoclimatic fluctuations and basin reorganisation. rine ingression into the paleo-basin, which helped to increase
 the bio-productivity of the surface waters of the paleo-lake,
5.1.3. Timing of the Lake Anoxic Events (LAEs) and petrophys- and subsequently led to the establishment of weakly oxidized
ical responses. In SB, intervals with enhanced organic car- or dysoxic to anoxic water bottom (Xi et al. 2011b). This
bon described as deposited in anoxic water context under probably contributed to the settling and/or preservation of
high productivity and/or preservation conditions have been OrSh with typically high GR, high resistivity, high porosity,
recorded in Member 1 of K2 qn formation, and Members 1 low density and low velocity. The peaks of OrSh content and
and 2 of K2 n formation (Xi et al. 2011a, 2018; Wu et al. shale volume appear in lower Member 2 of K2 n and corre-
2013; Xu et al. 2015). The stratigraphic details showed that late well with the increase in marine biomarkers (figure 7a),
these layers were deposited when the paleo-basin was en- suggesting that deep water under probable strong seawater in-
larged (Feng et al. 2010), thus limiting the entry and depo- gression developed in lower K2 n than lower K2 qn formation
sition of detrital clastic sediments, which helped the organi- during the LAE periods (Xi et al. 2016).
cally rich settling in the paleo-basin. In the lacustrine environment, previous studies reported
 These LAEs strata are associated with high GR, high re- a relationship between paleo-redox conditions and the
sistivity, high shale volume and high OrSh (figure 9a–c) in changes in the sedimentation rate (Ding et al. 2015). As the
Member 1 of K2 qn Formation and Members 1 and 2 of K2 n change in the paleo-redox state is vital during the anoxic
formation. This may suggest increased organic-rich deposi- event ( Jenkyns 2010), a relationship exists between the sed-
tion under strong productivity and/or preservation (Robin- imentation rate and LAEs. Based on time scale optimisation,
son et al. 2004). Additionally, the increased GR count, shale the high-resolution sedimentation estimated by using the
volume and presence of OrSh demonstrates that the LAEs GR log correlated these LAEs sections to a high frequency
occurred when the paleo-lake was deep environment. This of power spectrum and low sedimentation rate (figure 9d).
is supported by the porosity, neutron log responses and the This indicates that the sedimentation process declined dur-
lithology, which is mainly organic shale (Wan et al. 2013). ing the LAEs in both K2 n and K2 qn formations. In Wu et al.
Indeed, according to Burton et al. (2014), in deep-lacustrine (2013) study, a similar correlation was described in SB, in-
environments, the lithofacies are defined by the presence of dicating that valuable information concerning the sediment

 15
Journal of Geophysics and Engineering (2021) 0, 1–24 Kouamelan et al.

 Downloaded from https://academic.oup.com/jge/advance-article/doi/10.1093/jge/gxaa066/6056650 by guest on 01 February 2021
Figure 9. LAEs petrophysical characterisation in Songliao Basin. (a) Correlation of LAEs and variation of petrophysical properties in SK1N, (b, c) in
SK1S and (d) correlation between the LAEs and change in the sedimentation rate. For resistivity log, blue = RD, orange = RS and light orange = RM.

accumulation during LAEs can be drawn from petrophysical uniform lithology and constant energy overall (Emery &
properties. Myers 1996; Nazeer et al. 2016), with some increasing phase
 in Cenomanian–Turonioan deposit. This trend seems to be
 consistent with the lithology composed chiefly of nannofos-
5.2. Impact of Sea Environmental Changes on the sil chalk with black shale intercalation at approximately 436.6
 Petrophysical Properties mbsf, deposited through Cenomanian–Turonian. The depo-
5.2.1. Seafloor spreading. At GSB, De Graciansky et al. sition of this interval with high radioactivity marks a signifi-
(1985) categorised the Upper Cretaceous lithological units cant changes in the paleo-basin, as also described by Luft de
into two units, namely lower Unit 4 and Unit 5 in hole 549, Souza et al. (2018) in the similar depositional interval.
and three units in hole 550B, i.e. Unit 3, Unit 4 and Unit 5. From Coniacian-Santonian to Maastrichtian, the radioac-
At site 549, the GR indicated changes in the sedimentary en- tivity presents a smooth decreasing trend (figures 4e and 8a),
vironment from Cenomanian to lower Paleocene. This in- showing that either the content of radioactive elements de-
terval includes two depositional stages associated with low creased or the deposited materials are coarse sediments.
and extremely low radioactivity and is characterised by a However, the mean of the shale volume increased from
serrated cylindrical shape (figure 8a), which may indicate Coniacian–Santonian to Maastrichtian (figures 4g and 8a),

 16
Journal of Geophysics and Engineering (2021) 0, 1–24 Kouamelan et al.

which was further revealed by the decrease in the resistivity. factors; among them, silica and carbonate elements tend to
This is consistent with the work of De Graciansky & Bourbon increase the velocity while clay content, porosity, microfis-
(1985), implying that the grain size is probably not the main sures, current and paleo-overpressure tend to decrease the
factor controlling the GR response. Similarly, from Ceno- sonic log values. The velocity tendency from Cenomanian
manian to Turonian, the radioactivity displayed a decreasing to Campanian is more likely related to the lithological vari-
trend as the shale volume increased (figure 4e and g). These ation because, based on De Graciansky et al. (1985), CaCO3
changes are not arbitrary, but are related to variations in the content varies from 65 to 90% through unit 5 to 90–95 in
sedimentary environment. unit 4. However, although characterised by high carbonate
 According to Andrianiazy & Renard (1985), the North concentration, the sonic velocity drops from Campanian to
Atlantic seabed dynamism experienced several variations. Maastrichtian and the velocity–shale volume crossplot dis-

 Downloaded from https://academic.oup.com/jge/advance-article/doi/10.1093/jge/gxaa066/6056650 by guest on 01 February 2021
During the Cretaceous, the seabed extension was rapid plays a weak interrelation between clay distribution and ve-
through the Aptian-Albian time due to an active rifting. This locity indicative of a weak influence of these factors on the
extension rate declined during the Late Cretaceous and ap- velocity (figure 10a). Therefore, the variation of the sonic ve-
proached zero, and later reopened during the early Paleocene. locity from Campanian to Maastrichtian may likely be due to
This trend correlates well with the changes in the radioactiv- the porosity, low silica content or microfractures.
ity activity, as shown by the results of the WT (figure 8c) and At site 550B, the changes in GR is more likely interrelated
the statistical analysis (figure 4e). Therefore, the GR reactiv- to the shale content (figure 4c and 4f). The radioactive ac-
ity is compared to the Mn and Fe variation, because based on tivity of this site located on the oceanic basement is higher
Renard et al. (1979); Corbin et al. (2000), these geochemi- than that of site 549 nearly located on a slope, which could
cal elements are useful proxies for evaluation of the seafloor either be due to its proximity from the extension and there-
spreading. Figure 8c and e point out that the scaling coef- fore archived more radioactive elements or due to its setting
ficient of GR reactivity relatively mimics the trend of Mn in a deep marine milieu, which is suitable for deposition of
and Fe distribution. The Mn and Fe contents roughly de- fine-grain size deposits. The shale proportion indicates the
crease from Cenomanian to Maastrichtian and increase dur- same trend. Furthermore, by intercorrelating Mn and Fe dis-
ing the Paleocene, and they correlate well with North Atlantic tribution and GR reactivity, a light correlation was exhibited
seafloor spreading (Andrianiazy & Renard 1985), which con- (figure 8d and 8f). In conclusion, because site 550B is located
trols the deposition of materials. Therefore, if our data are in the deep environment and has undergone different sedi-
correct, then there is a correlation between the North At- mentary processes due to the basin build-up (De Graciansky
lantic seafloor motion and the decrease in radioactivity from et al. 1985), the changes in the water energy and the carbon-
Cenomanian to Maastrichtian and the abrupt change at early ate compensation depth (CCD) could affect the grain size of
Paleocene highlighted by the scaling coefficients and the box the sediments and consequently the GR reactivity.
plot. This can also be explained by the variation in shale vol-
ume and CaCO3 deposition. During the time of spreading, 5.2.2. OrSh deposition, sea-level change and carbonate compen-
the deposition of sediments ceases or decreases, leading to sation depth (CCD). The sediments at GSB accumulated un-
the absence of sediments or deposition of thin sediments, der various paleoenvironmental conditions (De Graciansky
which affect the shale volume and the CaCO3 deposition. et al. 1985), with deposition of some organic-rich intervals.
By examining the shale volume, associated with CaCO3 ten- In borehole 549, the radioactivity increased through the up-
dency (figure 8a), it is clear that the shale volume, CaCO3 per Cenomanian-lower Turonian deposit, and was assocated
and GR response are approximately inversely proportional. with black shale deposition (Luft de Souza et al. 2018). This
The interval of high GR correlates to a time of decreasing indicates that the sharp rise in the GR radiation is a conse-
shale volume and CaCO3 content. The development of the quence of OrSh deposition, which fall in line with Luning &
Mid-Atlantic seafloor seems to have affected the accumula- Kolonic (2003). The presence of OrSh suggests that this sed-
tion of the radioactive elements and sediments deposition, imentary interval has probably accumulated in deep-water
with high GR and declined deposits during the active spread- settings. Through this interval, the CaCO3 content is low, in-
ing phases, resulting in a low sedimentation rate. This is con- dicating that it was deposited in a deep environment (likely
sistent with the works of De Graciansky et al. (1985), who below the CCD) where the proportion of carbonate input
reported that during the Upper Cretaceous, site 549 in GSB was lower.
underwent sediments cut off on several times, causing a dras- At site 550B, an interval with a high radioactivity corre-
tic decrease in the sedimentation rate. lated with slightly high TOC and low CaCO3 content dat-
 The velocity log evaluation showed an increasing ve- ing from Coniacian-Santonian with dark mudstone as lithol-
locity trend from Cenomanian to Campanian deposits and ogy (figures 8b and 10d). This period indicates the deposi-
later decreased toward the Danian sediments. According to tion of faint OrSh. The modest TOC count adjoined with
Nelson (2010), velocity response is affected by several low CaCO3 and the depositional details (De Graciansky et al.

 17
Journal of Geophysics and Engineering (2021) 0, 1–24 Kouamelan et al.

 Downloaded from https://academic.oup.com/jge/advance-article/doi/10.1093/jge/gxaa066/6056650 by guest on 01 February 2021

Figure 10. (a) Velocity–Vsh crossplot of Campanian–Maastrichtian sediment at site 549 using Kermel density; (b) statistical analysis of the formations
resistivity response at site 550B; TOC and carbonate content variation at site 549 (c) and site 550B (d) (data from Luft de Souza et al. (2018)) used for
comparison and (e) geological model of the Goban Spur Basin from Campanian to Maastrichtian.

 18
Journal of Geophysics and Engineering (2021) 0, 1–24 Kouamelan et al.

1985; Alves et al. 2018) suggests that this interval was likely in the sea level could affect the deep water pressure and,
deposited in deep-water environment below the CCD, which consequently, the deepening of the CCD, leading to de-
correlates well with the high GR response. Previous stud- position of carbonate and likely to the slump in the basin
ies described a high stand sea level through the Turonian to slope. This slumping may be responsible for the turbidites
Campanian with a long phase of stasis up till the Campa- formation during the Late Campanian–Early Maastrichtian
nian (Cool 1982; Haq 2014). Based on paleoecologic de- (figure 10e), and seems to affect site 549 with the deposition
tails, Alves et al. (2018) correlated this same period to an of some slumped beds (De Graciansky et al. 1985).
elevated sea level during which a vast system of CCD de- From 578.40 to 573 mbsf (unit 4a), the resistivity is low
veloped in North Atlantic deep paleo-basin. From Campa- (figure 10b), although it has been described as high TOC
nian to Maastrichtian, the GR reactivity and shale content content (De Graciansky et al. 1985; Alves et al. 2018; Luft

 Downloaded from https://academic.oup.com/jge/advance-article/doi/10.1093/jge/gxaa066/6056650 by guest on 01 February 2021
declined, and was tied to a decrease in TOC content, while de Souza et al. 2018). This trend appears as a result of the im-
the CaCO3 content exhibited a high value (figures 8a, b and maturity of the organic content (De Graciansky et al. 1985),
10c, d), indicating that the sediments were most likely de- which seems to be affected by the quality of the preserva-
posited in a high water energy environment at both sites. In- tion or the sedimentation process, probably due to the CCD
deed in shallow water settings, usually, the current flow is or sea-level change. Alves et al. (2018) depicted almost the
high and hence suited for coarse sediments settling, while same section (between 578.40 and 575.40 mbsf) as barren
accumulation of fine-size sediments marks the deep-water in calcareous nannofossils, although with a slightly higher
settings. TOC and lower CaCO3 , and attributed this to many fac-
 By comparing our well log data to the lithology composed tors, namely sea-level fluctuation or CCD. The decrease in
of chalks interbedded with mudflow and turbidites, with the resistivity from Unit 3b Campanian section to unit 4a
high CaCO3 contents from 510 to 470 mbsf, mainly from Campanian deposit is related to the change in the lithology
the Maastrichtian age, and dark mudstones at approximately from chalk to mudstone (figure 8b). However, the variation
600 to 570 mbsf deposited from the Coniacian–Santonian to in the resistivity between the Campanian deposits and the
Campanian (De Graciansky & Bourbon 1985), the response Maastrichtian sediments within unit 3b is more complex and
of the GR was consistent with the hypothesis that in deep ma- challenging to explain lithologically. We speculate that the
rine settings, the upward coarsening reflects a gradual change lower resistivity from Unit 3b Campanian sediments to those
from clastic to carbonate deposition (Emery & Myers 1996). deposited through the Maastrichtian may be related to the
Furthermore, the low TOC value in subunit 3b compared to provenance of the sediments as depicted by Thiede et al.
the underlying subunit 4a (De Graciansky et al. 1985) points (1980) or likely local chemical changes.
out to a probable gradual drop in anoxicity from the lower The changes in the GR reactivity and shale content are
section toward the top of the interval studied, and is related well recorded in TOC and CaCO3 distribution from Ceno-
to a significant decrease in radioactivity. Moreover, Emery & manian to Maastrichtian deposits at GSB and may be likely
Myers (1996) described the upward coarsening in the deep related to the significant paleoenvironmental changes such
marine environment might be as a result of a gradual drop in as rifting, sea-level variations and paleoceanography event
anoxicity and neither necessarily interrelated to an ascending (CCD) during the Upper Cretaceous. This is consistent with
shallowing or a progradation of a depositional facies. How- the observations made by Thiry & Jacquin (1993), by center-
ever, some previous analyses showed a marine level decline ing on the clay minerals dispersal from the north and south
from Campanian to Maastrichtian in North Atlantic (Haq Atlantic Cretaceous deep ocean deposits. While the varia-
2014; Luft de Souza et al. 2018), after long stability through- tions observed in the resistivity and sonic velocity logs are
out the Campanian. If our data are correct, the decrease in more likely related to the changes in the lithology however,
radioactivity and shale content, associated to the decrease the impact of the paleoenvironmental changes cannot be
in TOC trend and increase in CaCO3 from Campanian to neglected.
Maastrichtian, seems to correlate with seawater lowering.
This is consistent with the works of Christian (2008), who, 5.2.3. Timing of oceanic anoxic events (OAEs) and petrophys-
based on nannofossil observations, showed that the Late Cre- ical responses. At GSB, based on 13 C dataset at site 549,
taceous deposits in GSB accumulated in shallow water. Dur- Linnert et al. (2011) described an interval with high or-
ing the Campanian, where the seawater was high, the sedi- ganic carbon deposition at nearly 436.25 mbsf, likely as the
ments were mainly fine-grain sediments and were deposited consequence of OAE 2. This interval belongs to the mag-
in deep water, as shown by dark claystone and high shale con- netic reversal C34n and is Cenomanian–Turonian in age
tent, associated with a high GR log count. With the lowering (figure 11a).
of the sea level, the depositional environment became more Brewton (2008), while studying the log signature for
oxygenated with the deposition of light sediments charac- OAEs in several ODP holes, found a significant increase in
terised by the low GR response. Furthermore, the drop the GR response through the interval related to OAEs. Other

 19
You can also read