Assessment of and Adaptation to Beach Erosion in Islands: An Integrated Approach
←
→
Page content transcription
If your browser does not render page correctly, please read the page content below
Journal of
               Marine Science
               and Engineering

Article
Assessment of and Adaptation to Beach Erosion in Islands: An
Integrated Approach
Olympos Andreadis, Antonis Chatzipavlis                       , Thomas Hasiotis *, Isavela Monioudi             , Evangelia Manoutsoglou
and Adonis Velegrakis

                                          Department of Marine Sciences, University of the Aegean, 81100 Mytilene, Lesvos, Greece;
                                          Olympos@marine.aegean.gr (O.A.); a.chatzipavlis@marine.aegean.gr (A.C.); imonioudi@marine.aegean.gr (I.M.);
                                          eman@marine.aegean.gr (E.M.); afv@aegean.gr (A.V.)
                                          * Correspondence: hasiotis@aegean.gr

                                          Abstract: Island beaches, which form significant natural and economic resources, are under increasing
                                          erosion risk due to sea level rise. The present contribution proposes an integrated methodological
                                          framework for the evaluation of the socio-economic significance of beaches and their vulnerability
                                          to sea level rise and the design of effective adaptation measures. The approach comprises four
                                          steps: (i) beach ranking on the basis of their socio-economic significance and vulnerability in order
                                          to prioritize adaptation responses; (ii) monitoring of the hydro- and morphodynamic regime of
                                          the most highly ranking beaches using field observations and modelling, (iii) assessment of the
                                          sediment volumes required for beach nourishment under different scenarios of sea level rise and
                                          nourishment designs; (iv) evaluation of the marine aggregate potential of the adjacent areas that can

                                          be used for beach nourishment. The framework was applied to the Greek island of Chios, which has
                                   many beaches that are already under erosion. The methodology was shown to provide a structured
Citation: Andreadis, O.;                  approach for the assessment and response to erosion of the most vulnerable beach.
Chatzipavlis, A.; Hasiotis, T.;
Monioudi, I.; Manoutsoglou, E.;           Keywords: coastal erosion; morphodynamics; beach nourishment; marine aggregates; multi-criteria
Velegrakis, A. Assessment of and          methods; coastal management; Chios island
Adaptation to Beach Erosion in
Islands: An Integrated Approach. J.
Mar. Sci. Eng. 2021, 9, 859. https://
doi.org/10.3390/jmse9080859               1. Introduction
                                               Beaches are critical coastal environments. They form a substantial fraction of the
Academic Editor: Rodger Tomlinson
                                          global coastline [1], are important habitats in their own right [2], have a high hedonic
                                          value and provide protection from coastal flooding to their backshore ecosystems, assets
Received: 23 July 2021
Accepted: 8 August 2021
                                          and infrastructure [3]. Tourism, an important economic activity, has been increasingly
Published: 10 August 2021
                                          associated with vacationing wholly, or partially, at coastal locations and beach recreational
                                          activities according to the Sun–Sea–Sand (3S) model [4]. Therefore, beach aesthetics and
Publisher’s Note: MDPI stays neutral
                                          adequate carrying capacity and infrastructure are crucial for the tourism sector and the
with regard to jurisdictional claims in
                                          economy as a whole [5,6].
published maps and institutional affil-        At the same time, beaches face increasing erosion [1,7–11]. Beach erosion can be differ-
iations.                                  entiated into: (a) irreversible shoreline retreat due to mean sea level rise and/or negative
                                          coastal sedimentary budgets that force beach landward migration and/or drowning [12]
                                          and (b) short-term erosion caused by storm surges and waves, which may or may not result
                                          in permanent shoreline retreats but can, nevertheless, be devastating [13].
Copyright: © 2021 by the authors.
                                               Erosion is particularly alarming for island beaches due to: (i) their (generally) lim-
Licensee MDPI, Basel, Switzerland.
                                          ited dimensions and diminishing sediment supply, e.g., [14]; (ii) the deterioration of the
This article is an open access article
                                          nearshore ecosystems that provide protection from marine erosion [15,16]; (iii) their in-
distributed under the terms and           creasing backshore development, which has increased asset exposure and their crucial role
conditions of the Creative Commons        in the island economies [4,17,18]. The projected relative mean sea level rise, combined
Attribution (CC BY) license (https://     with potential increases in the intensity/frequency of energetic events [19], will certainly
creativecommons.org/licenses/by/          exacerbate beach erosion with severe impacts on coastal ecosystems, infrastructure/assets
4.0/).                                    and the beach hedonic value and carrying capacity for recreation/tourism [20,21].

J. Mar. Sci. Eng. 2021, 9, 859. https://doi.org/10.3390/jmse9080859                                           https://www.mdpi.com/journal/jmse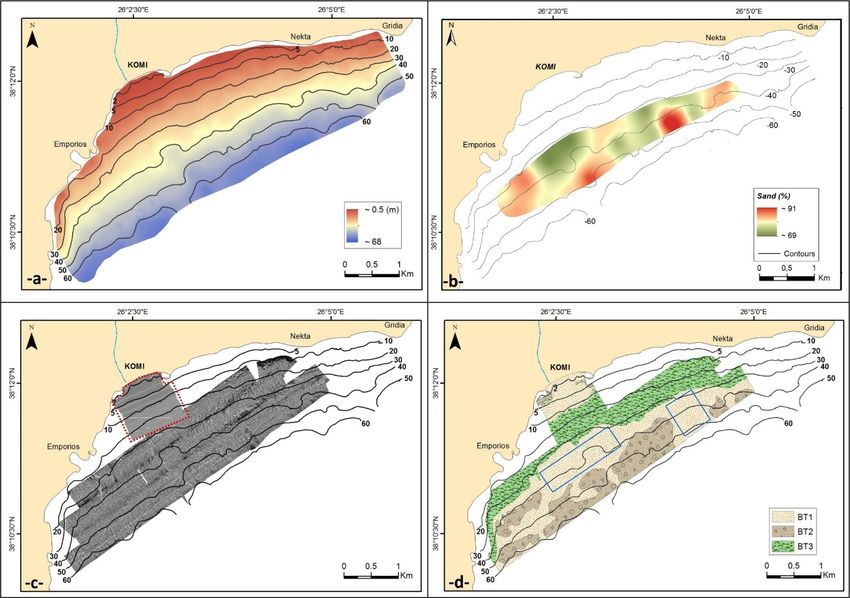
J. Mar. Sci. Eng. 2021, 9, 859                                                                                            2 of 22

                                       It appears that the assessment of the current and future beach erosion risk, and the
                                 availability and effectiveness of requisite adaptation options is fundamental for the re-
                                 silience and sustainable development in island settings [22,23]. At the same time, there are
                                 limitations in the feasibility of the risk assessment with the required spatio-temporal reso-
                                 lution as well as in the design and implementation of effective adaptation options, despite
                                 their obvious socio-economic benefits [24], due to the limited availability of the necessary
                                 financial and human resources, e.g., [13,25]. Therefore, assessments at island (regional)
                                 scales are particularly important, e.g., [21,26], as they can inform the planning of integrated
                                 adaptation policies at the island level and efficient allocation of the limited resources.
                                       Regarding adaptation options, the socio-economic importance of beaches and the
                                 low effectiveness of hard coastal defenses (groynes, offshore breakwaters, seawalls and
                                 revetments) to protect the beach carrying capacity for recreation under increasing sea
                                 levels, e.g., [27,28], suggest that beach nourishment (replenishment) should be considered
                                 as the first potential adaptation option, at least for beaches with high socio-economic
                                 significance. However, beach nourishment in island settings depends on the availability
                                 of suitable filling sediments, preferably from local sources. As marine aggregates (MA)
                                 form the most suitable, but often scarce, material for beach replenishment [29,30], the
                                 availability/sustainability of local MA deposits should also be considered.
                                       Against this background, the aim of this contribution is to develop and implement,
                                 on an island scale, a methodological framework for the evaluation of and the adaptation
                                 to beach erosion. This framework incorporates four different steps: (a) ranking of island
                                 beaches in terms of their socio-economic significance, exposure and vulnerability to sea
                                 level rise in order to prioritize the adaptation response; (b) study of the hydro- and mor-
                                 phodynamics of the highest ranking beach (according to the previous assessment) to gain
                                 a better insight on the erosion processes at local level; (c) assessment of the needs for
                                 sedimentary material required for the beach nourishment under different scenarios; (d)
                                 evaluation of the marine aggregate potential in the adjacent region. Chios island in the
                                 North Aegean Sea, Greece (Figure 1a) was selected as the case study for the proposed
                                 framework due to its size (the fifth largest Greek island), its developing touristic activity
                                 and its increasing beach erosion problems, e.g., [31].

                                 2. Materials and Methods
                                 2.1. Prioritization Framework Using a Multi-Criteria Approach (Step 1)
                                        An indicator-based framework was developed to rank beaches, at an island scale,
                                 according to their socio-economic significance and vulnerability to sea level rise. Informa-
                                 tion on the geo-spatial characteristics (length, max. width, area, sediment type), human
                                 development features (i.e., accessibility, density of backshore assets) and socio-economic
                                 parameters (e.g., beach carrying capacity, touristic activity) was collated for all Chios
                                 beaches, on the basis of the satellite images and related optical information/tools available
                                 in the Google Earth Pro application. The subaerial (‘dry’) beaches were digitized from
                                 the most recent images as polygons, bounded on their landward side by either natural
                                 boundaries (vegetated dunes and/or cliffs) or permanent artificial structures (i.e., coastal
                                 embankments, seawalls, roads, and buildings) and on their seaward side by the shoreline.
                                 To avoid inconsistency, digitization was carried out by a unique analyst who followed con-
                                 sistently the above beach delimitation rules. Following this procedure, the characteristics of
                                 the 153 Chios beaches were identified. From the historical imagery available on the Google
                                 Earth Pro application, the most recent clear satellite image was selected for the digitization
                                 of each beach. The available remote sensing images are not synoptic at the island scale,
                                 i.e., they have been collected in different years and seasons (within the period 2006–2017).
                                 There are inherent uncertainties, particularly with regard to the synoptic widths due to
                                 inter-annual and seasonal variability. Nevertheless, such uncertainty cannot be avoided
                                 when working at an island scale.
                                        The first stage of the prioritization analysis was to select the most important beaches,
                                 in terms of their touristic development/ecosystem services, using the Technique for Order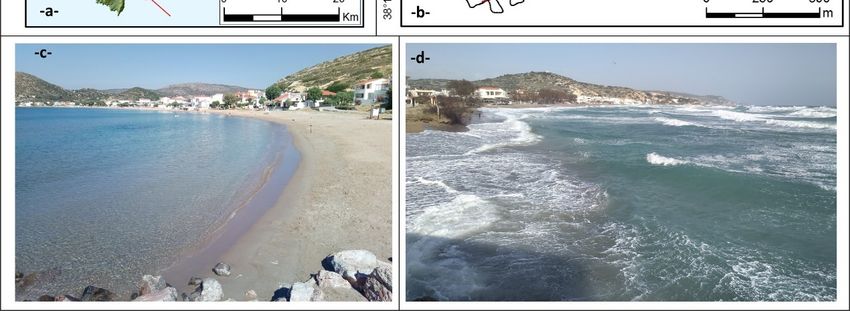
J. Mar. Sci. Eng. 2021, 9, 859                                                                                                     3 of 22

                                      of Preference by Similarity to Ideal Solution (TOPSIS) multi-criteria method. TOPSIS was
                                      chosen because of the large number (153) of studied beaches, which makes the pairwise
                                      Analytical Hierarchy Process (AHP) method complicated and time-consuming; according
                                      to Zavadskas et al. [32], the TOPSIS ranking performance is much less affected by this
                                      number as well as by the number of criteria (indicators) used compared with other available
                                      methods. The socio-economic and environmental indicators that were selected were: (1) the
                                      degree of touristic activities, based on the number of hotels and restaurants at and in the
                                      vicinity of the beach; (2) the number and frequency of the visitors at the beach (interviews
                                      from the locals and optical information available online); (3) beach accessibility, on the
                                      basis of the state of the road that leads to the beach and the distance from the main road
                                      network (none, in the case of only marine access); (4) beach development based on the
                                      presence of facilities and organized recreational/touristic activities (e.g., changing rooms,
                                      bins, umbrellas, sun beds, sea sports, lifeguards); (5) the beach carrying capacity, which
                                      is directly associated with the beach area (10 m2 /per person); (6) Blue Flag awards (in
                                      2021), which play an important role in attracting tourists as they are perceived as markers
                                      of beach quality by users [33]; (7) special environmental protection regime (e.g., NATURA
J. Mar. Sci. Eng. 2021, 9, x FOR PEER REVIEW
                                      2000 and wetlands protected by Presidential Decree 229/AAP/2012). All indicators        3 ofare
                                                                                                                                   22
                                      qualitative, with the exception of the beach carrying capacity (beach area).

      Figure 1.
      Figure 1. (a)
                (a) Chios
                    Chios island
                          island and
                                 and Komi
                                     Komi beach
                                            beach (red
                                                  (red arrow);
                                                       arrow); the
                                                               the blue
                                                                   blue line
                                                                        line and
                                                                             and circle
                                                                                 circle show
                                                                                        show the
                                                                                               the Katraris
                                                                                                   Katraris river
                                                                                                            river and
                                                                                                                  and the
                                                                                                                      the Kalamoti-
                                                                                                                           Kalamoti-
      Katraris Dam.  (b) Field observations (KR: Katraris River). Photos  of Komi beach,  (c) from  the ENE  under  calm  conditions
      Katraris Dam. (b) Field observations (KR: Katraris River). Photos of Komi beach, (c) from the ENE under calm conditions
      and (d) from WSW during a storm.
      and (d) from WSW during a storm.

                                  2. Materials   and Methods
                                        The second    stage involved a detailed pairwise Analytical Hierarchy Process (AHP)
                                  2.1. Prioritization
                                  multi-criteria      Framework
                                                  approach       Using beaches,
                                                           for selected a Multi-Criteria
                                                                                i.e., the Approach
                                                                                          15 highest(Step 1) beaches (from the first
                                                                                                     ranking
                                       An indicator-based framework was developed to rank beaches, at an island scale,
                                  according to their socio-economic significance and vulnerability to sea level rise.
                                  Information on the geo-spatial characteristics (length, max. width, area, sediment type),
                                  human development features (i.e., accessibility, density of backshore assets) and socio-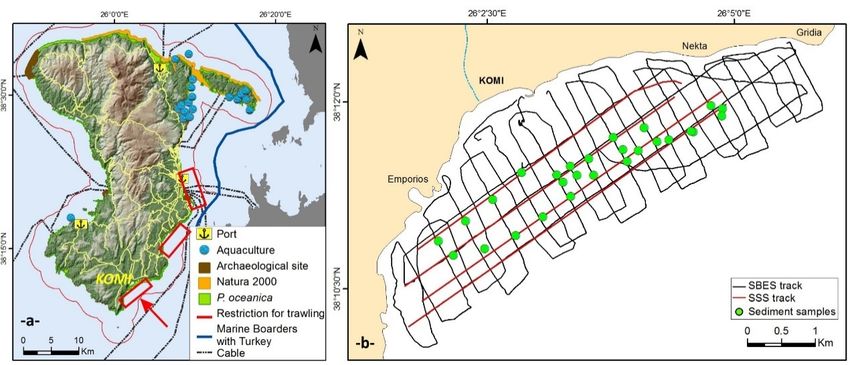
J. Mar. Sci. Eng. 2021, 9, 859                                                                                           4 of 22

                                 stage) in order to prioritize them in terms of not only their socio-economic/environmental
                                 significance but also in terms of their erosion risk under climate variability and change
                                 (CV&C). The selected beaches have been mostly classified as ‘developed’, and, also, a large
                                 number of them have been awarded with “Blue Flag” certifications (2021) and are easily
                                 accessible. So, the indicators 3, 4 and 6 were no longer useful for the second part of the
                                 analysis. Regarding beach vulnerability to sea level rise (a) the maximum beach width, (b)
                                 the sediment texture and (c) the beach “urbanization”, that is, the density (%) of backshore
                                 infrastructure/assets in relation to the shoreline length, were selected as indicators. Beach
                                 width is a crucial feature, as this not only controls the vulnerability to beach erosion but
                                 also the exposure of the backshore infrastructure/assets. The sediment texture not only
                                 influences the beach erosion potential but can also be used as an indicator of the beach
                                 recreational (hedonic) value since sandy beaches are more preferable to users than those
                                 consisting of gravel, pebbles or mixed sediments. Indicators (a) and (c) are quantitative
                                 and were estimated using the tools available in the Google Earth Pro application. For
                                 the sediment texture, quantitative data were not available and a value of 1–9 as weight
                                 value scale [34,35] was used. Sandy beaches were assigned a nine (9), beaches with mixed
                                 sediment texture (sand, gravel and pebbles) a five (5) and those with coarse sediments
                                 (gravels and pebbles) a three (3). The major potential impact of the CV&C on beaches is
                                 associated with the increasing erosion under sea level rise, with the exposure increasing
                                 with decreasing beach dimensions. Beach retreat due to relative sea level rise (RSLR) was
                                 estimated through morphodynamic model ensemble, based on the methodology described
                                 in Monioudi et al. [21]. Astronomical tide was also considered in the estimations. The
                                 RSLR under CV&C and tide projections along the Chios coastline were abstracted from the
                                 JRC (Joint Research Centre) database (https://data.jrc.ec.europa.eu/dataset/deff5a62-07
                                 4c-4175-bce4-f8f13e0437a3, accessed on 7 June 2021) [36]. The multi-criteria approach was
                                 performed under the current conditions and under 2 future scenarios, the RCP4.5 and for the
                                 years 2050 and 2100. The analysis (see Section 3.1) found that Komi beach (Figure 1) not only
                                 ranks very high in terms of economic and environmental significance but it also appears to
                                 be the most vulnerable beach to erosion; thus, Komi beach was selected for further study.

                                 2.2. Coastal Geomorphology and Hydrodynamics (Step 2)
                                       Onshore and inshore morphological and sedimentological information was collected
                                 down to about 25 m water depth during repeated field surveys (24 February 2020,
                                 4–5 July 2020, 3–6 January 2021 and 10–12 February 2021) (Table 1 and Figure 1b). The
                                 ‘dry’ beach was mapped using a dense grid of elevation measurements (cross-shore tran-
                                 sects spaced at about 50 m) with an RTK-DGPS (Topcon HiPer) system. Bathymetry was
                                 recorded once, using a digital (Hi-Target HD 370) echosounder operating at 200 kHz and
                                 a TopCon DGPS, deployed from a 5.2 m rigid hull inflatable boat (RIB) along a grid of
                                 dense crossing transects (23 transects spaced approximately every 40–50 m, crossed by
                                 9 lines almost parallel to the shoreline). The tidal range in the area was small, being less
                                 than 0.2 m [37]. In addition, a Starfish 450F high-resolution side scan sonar (SSS) and
                                 the SonarWiz 6.2 software for post-processing, analysis and mosaicking of the collected
                                 sonographs were also used to map the morphology, texture and habitats of the seabed.
                                 This information was ground-truthed with 18 surficial samples using a Van Veen grab and
                                 13 drop camera (GoPro Hero 3+ silver edition with 720 p video resolution, mounded on a
                                 rigid frame) stations (Figure 1b). Shoreline sediment samples at 8 stations along the beach
                                 were also repeatedly (3 times—Table 1) collected with a small shovel. In the laboratory, the
                                 samples were split using the quartering method and they were washed with distilled water
                                 (for the removal of salt particles). No other sediment treatment was caried out (i.e., organic
                                 matter removal). Due to the coarse nature of the sediments, the samples were dry-sieved
                                 with a set of −4 to 4 Ø screens, at 1 Ø interval following Folk [38] and the grain size
                                 statistical parameters were calculated using the Gradistat software [39].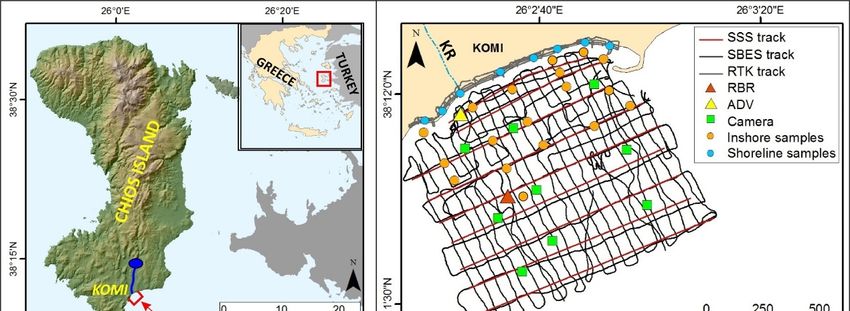
J. Mar. Sci. Eng. 2021, 9, 859                                                                                              5 of 22

                                    Table 1. Periods of field surveys and type of data collected.

                                         February 2020         July 2020        October 2020        January 2021   February 2021
             RTK beach and
                                                X                  X                                     X              X
        shoreline measurements
           Shoreline sampling                   X                  X                                     X
          Inshore bathymetry,
                                                                   X
         morphology, sampling
          Offshore bathymetry,
                                                                                      X
         morphology, sampling
                RBR data                                                              X                  X              X
    High frequency ADV experiment                                                                                       X
               Meteo data                                                                                               X

                                       In order to monitor the nearshore wave conditions during the energetic winter period,
                                 a RBRvirtuosoD wave pressure sensor operating in high frequency (6 Hz) and a burst
                                 mode was deployed during a 5-month period (4 October 2020–5 March 2021) at about 8 m
                                 water depth (Figure 1b) to obtain a (medium term) record of the energetic winter wave
                                 conditions. This information was supplemented by additional nearshore, high frequency
                                 hydrodynamic information collected in a 2-day experiment during an energetic event
                                 (10–12 February 2021). In this experiment, an Acoustic Doppler Velocimeter (ADV—Nortek
                                 Vector) was deployed at a water depth of 1.7 m and operated at a sampling frequency
                                 of 8 Hz in a dense burst mode (burst duration of 256 s, burst interval of 15 min). The
                                 ADV sensor was installed at a distance of 0.2 m above the seabed so that its sampling
                                 volume was within the bed boundary layer, close to the seabed (4 cm above). It is noted
                                 that, due to the increased sediment mobility during the deployment, the ADV sensor was
                                 buried towards the end of the deployment; thus, records after 12 February 2021–11:05 (after
                                 the 178th burst of the time series) are not included in the analysis. In addition, a Davis
                                 Vantage Vue Pro2 meteorological station was deployed at the beach (at 4 m elevation)
                                 recording, among others, wind velocity and direction (1 min sampling period) for the
                                 period of the experiment.
                                       In order to gain further insights into the nearshore hydrodynamics, an advanced
                                 hydro–morphodynamic model was employed. The model solves high order Boussinesq
                                 equations to describe nearshore hydrodynamics. The classical Boussinesq equations have
                                 been extended so as to include higher order nonlinear terms that can describe better the
                                 propagation of highly nonlinear waves in the shoaling zone. Detailed description of the
                                 model has been provided elsewhere [40–44]. The model was set up using the detailed
                                 beach elevation/water depth information collected in the present study and forced by
                                 representative wave conditions as recorded by the RBR sensor and estimated by previous
                                 studies through wind-wave hindcasting using wind information from the area [31]. More
                                 specifically, the model was run in a stationary mode for 2 wave forcing conditions: (1) a case
                                 of moderate wave action (Hs of 1.4 m, Tp—6.0 s, simulation duration of 12 h), and (2) a
                                 case of increased wave action (Hs—2.5 m, Tp—6.6 s, simulation duration of 9.5 h). Wave
                                 angle was set almost perpendicular to the beach in both cases (approaching from the
                                 southeast—157.5◦ N). Validation of the results on the nearshore hydrodynamics was
                                 provided through the short-term, high-frequency hydrodynamic observations obtained by
                                 the ADV deployment (Figure 1b).
                                       ArcGIS 10.2 was used for comparison of shoreline positions and mapping purposes
                                 and Matlab R2016a scripts for the meteo-ocean time series analysis.

                                 2.3. Estimation of Beach Nourishment Requirements (Step 3)
                                      Due to the high economic significance and the high vulnerability of Komi (and the
                                 other beaches) to the present and the future climatic conditions, adaptation measures are
                                 considered as necessary. As mentioned above, there can be different adaptation options,
                                 including ‘hard’ (e.g., groynes, seawalls, offshore breakwaters) and ’soft’ (beach replen-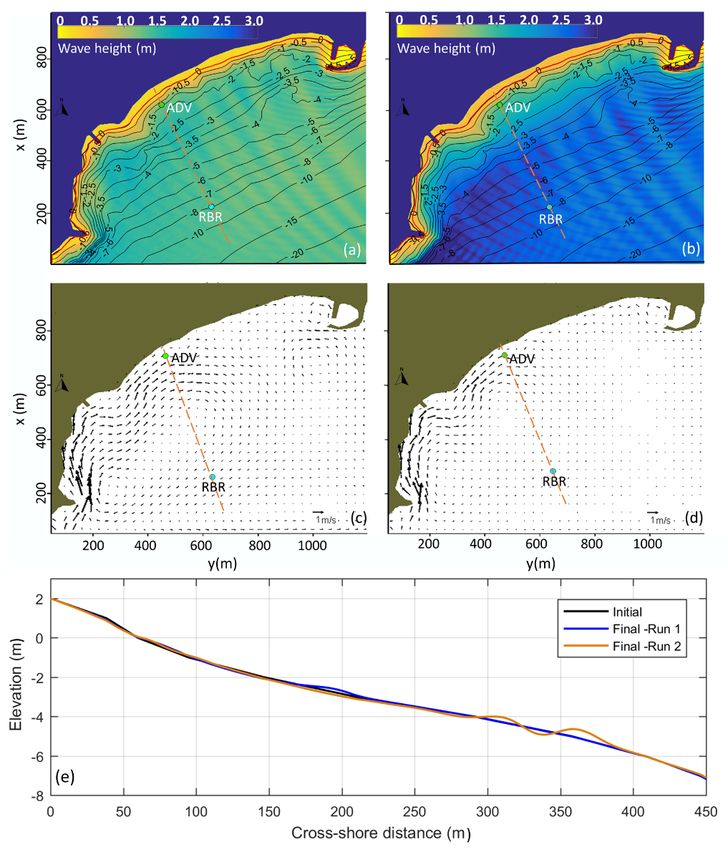
J. Mar. Sci. Eng. 2021, 9, 859                                                                                             6 of 22

                                 ishment) measures. However, as it appears vital for the island economies to maintain the
                                 beach carrying capacity under sea level rise (and storm erosion), e.g., [5,6], beach nourish-
                                 ment should be considered as the ‘Plan A’ option. Therefore, the sediment volume (and
                                 costs) required to nourish sustainably the beach under sea level rise has been estimated
                                 according to the following procedure.
                                       A beach morphodynamic parameter of crucial importance for the design of both beach
                                 nourishment and hard coastal protection schemes is the closure depth, i.e., the maximum
                                 offshore water depth that limits the offshore extent of the beach sediment ‘reservoir’ [45].
                                 In the present study, the closure depth has been estimated according to Hallermeier [46],
                                 who proposed an expression based on the annual extreme wave heights and corresponding
                                 periods that occur for at least 12 h each year. This information was provided by the analysis
                                 of the available RBR winter records, assuming that the most energetic events occur during
                                 this period. As the Hallermeier [46] expression for the closure depth estimation utilizes the
                                 offshore (deep water) extreme wave heights and corresponding periods, the RBR records
                                 obtained at 8 m water depth were translated to deep water conditions using linear wave
                                 theory e.g., [47].
                                       The widely used approach proposed by Dean [45] was then used to estimate the
                                 volume of the nourishing (filling) sediments, taking into account the type of beach profile
                                 (‘intersected’ or ‘non-intersected’) following the beach nourishment as well as the required
                                 sediment size. Eight (8) nourishment scenarios, divided into two main groups, were
                                 considered. The first group comprised four scenarios, according to which the beach width
                                 would be increased by 10 m (∆y0 = 10 m), whereas the second group also comprised four
                                 scenarios with a double beach width increase (∆y0 = 20 m). For both of these groups, two
                                 different scenarios of beach elevation increase (B = 0.5 and 1.0 m) and two scenarios of
                                 filling sediment sizes (i.e., d50F of 1.5 mm (−0.6 Ø), similar size to the average original beach
                                 sediment, and d50F of 2.0 mm (−1 Ø), slightly coarser than the original beach material)
                                 were considered. For indicative purposes, nourishment costs for the entire beach (1100 m
                                 long) were estimated, assuming a gross mean market price of the filling sediment of EUR
                                 10 per m3 .

                                 2.4. Marine Aggregate Survey (Step 4)
                                       The methodological approach for the MA survey comprised evaluation of the avail-
                                 able information on the local geology/geomorphology that provided some indications for
                                 potentially favorable locations of MA deposit occurrence [29,30]. In addition, environmen-
                                 tal constraints and human activities were also considered. Three areas (Figure 2a) were
                                 finally identified for further study, which met the set criteria. However, the restrictions due
                                 to the COVID-19 pandemic in the previous year limited the available fieldwork time and,
                                 thus, only the closest site (offshore of the Komi beach) was finally surveyed (Figure 2).
                                       Bathymetric data in the wider area (down to about 75 m water depth) were collected
                                 with the same systems used in the inshore survey (Figure 2b) along 28 transects spaced
                                 at about 200 m. A C-MAX CM2 side scan sonar (SSS) operated at 100 kHz was employed
                                 for the study of the seabed morphology, texture and habitats along 4 parallel survey
                                 lines. The SSS survey was constrained by the water depth (30–55 m isobaths) due to
                                 limitations stemming from the nearshore occurrence of Posidonia oceanica (priority habitat
                                 1120, European Directive 92/43/EEC)) and the dredging capabilities. Twenty-four (24)
                                 Van Veen grab seabed samples were collected from areas deeper than 35 m (Figure 2b).
                                 A TopCon DGPS was used for navigation and positioning during all survey operations.
                                       SSS data analysis/mapping and the sediment size analysis followed the same proce-
                                 dures as in the inshore survey. Yet, since the offshore samples consisted also of fine-grained
                                 material, the sediments were primarily wet-sieved through a 63 µm sieve and the finer
                                 grains were analyzed through the pipette method [38]. The coarse fraction was dried and
                                 passed through a set of sieves.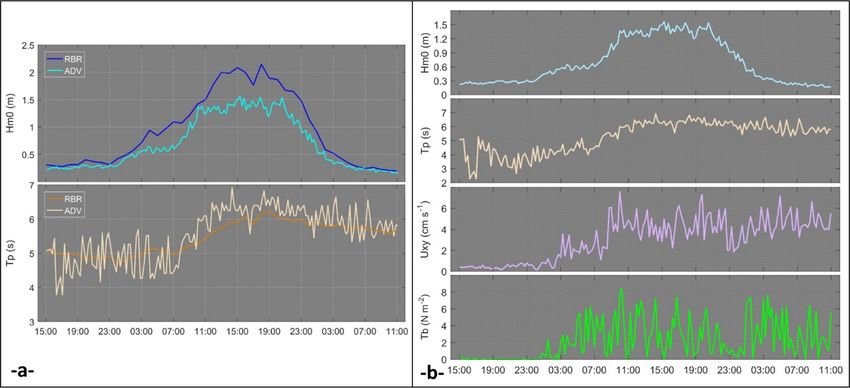
grab seabed samples were collected from areas deeper than 35 m (Figure 2b). A TopCon
                                  DGPS was used for navigation and positioning during all survey operations.
                                       SSS data analysis/mapping and the sediment size analysis followed the same
                                  procedures as in the inshore survey. Yet, since the offshore samples consisted also of fine-
                                  grained material, the sediments were primarily wet-sieved through a 63 μm sieve and the
J. Mar. Sci. Eng. 2021, 9, 859                                                                                          7 of 22
                                  finer grains were analyzed through the pipette method [38]. The coarse fraction was dried
                                  and passed through a set of sieves.

      Figure 2. (a) Distribution of various natural and human features and marine use restrictions around Chios, and the 3 sites
      (red boxes)
      (red boxes) selected
                  selected for
                           for MA
                               MA investigations
                                    investigations (red
                                                   (red arrow
                                                        arrow to
                                                              to Komi).
                                                                 Komi). (b) SBES and SSS tracks and surficial sediment samples of
      the Komi
      the Komi MA
                MA survey.
                     survey.

                                               Framework Implementation
                                  3. Results: Framework      Implementation
                                  3.1. Island Beach Prioritization for Adaptation
                                  3.1. Island Beach Prioritization for Adaptation Response
                                                                                  Response
                                        For the
                                        For   thefirst stage
                                                   first     of the
                                                          stage  of analysis, in order
                                                                     the analysis,  in toorder
                                                                                          definetothe weights
                                                                                                    define the(orweights
                                                                                                                  relative importance)
                                                                                                                           (or relative
                                  importance) of the indicators (1–7) adopted for the application of the TOPSISAHP
                                  of the  indicators     (1–7) adopted   for  the  application   of the TOPSIS    method,          was
                                                                                                                              method,
                                  initially  used   to  perform   pairwise  comparisons     based   on expert  judgments
                                  AHP was initially used to perform pairwise comparisons based on expert judgments and      and  using
                                  a 1–9 scale [34,35]. Adjustments were made to ensure the consistency of the derived
                                  using a 1–9 scale [34,35]. Adjustments were made to ensure the consistency of the derived
                                  pairwise matrix (Consistency Ratio, CR = 0). After identification of the possible pairs,
                                  pairwise matrix (Consistency Ratio, CR = 0). After identification of the possible pairs,
                                  suitable weights were assigned to each indicator/criterion using an eigenvector method.
                                  suitable weights were assigned to each indicator/criterion using an eigenvector method.
                                  The selected indicators are not all measured in the same units; thus, vector normalization
                                  The selected indicators are not all measured in the same units; thus, vector normalization
                                  was used to ensure uniformity and comparability among the data. Then, the TOPSIS
                                  method was applied to estimate the preference scores (Figure 3a). The 15 selected beaches
                                  with the higher scores are depicted with the red color in Figure 3b.
                                        For the second stage of the analysis, the indicators 1, 2, 5 and 7 (from the first stage)
                                  were used to describe the socio-economic and environmental significance, and the indica-
                                  tors (a), (b) and (c) to describe the exposure/vulnerability to sea level rise. Beach erosion
                                  risk under CV&C (RSLR + tide) was estimated using the morphodynamic model ensemble.
                                  Due to the different conditions used in the model set ups, the ensemble produced a range
                                  of beach erosion projections. The reduction in “dry” beach widths was estimated through
                                  the comparison between the projected ranges of beach retreat and the maximum recorded
                                  beach width. For the latter the “width reduction” expressed as a percentage of the current
                                  maximum width was used as an indicator instead of the “maximum width” to account for
                                  the sea level rise impacts. Sea level rise of 0.22–0.3 m, projected for the year 2050 under
                                  RCP4.5, could result in erosion/retreat of the selected beaches of between 2.5 m and 11.4 m
                                  and, consequently, to a substantial reduction in “dry” beach width (Table 2). For the year
                                  2100 under the same RCP scenario, it appears that the selected beaches would be seriously
                                  affected due to the projected sea level rise (0.54–0.63 m); beach retreat is estimated between
                                  5.7 m and 21.7 m and six (out of eight) beaches might be reduced by up to 100% (Table 2).
                                  Many of these beaches lack the accommodation space to retreat landwards and, as such,
                                  will suffer coastal squeeze without appropriate replenishment schemes.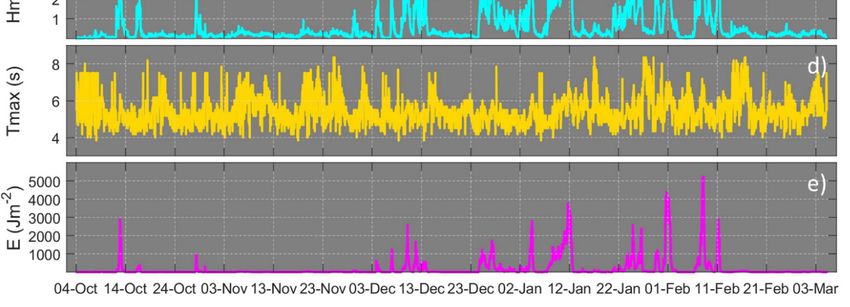
procedure as in the previous stage. AHP was also used to perform pairwise comparisons
                                 among the alternatives (beaches) (consistency of all the matrices was ensured) and then, using
                                 the eigenvector method, priority scales were defined for all alternatives and for each
                                 indicator/criterion. The final (global) preference score for each alternative (beach) was
J. Mar. Sci. Eng. 2021, 9, 859   calculated using the Weighted Product Model (WPM). The whole procedure was totally       8 of 22
                                 repeated three times for the current status and for two future scenarios (Figure 3c and Table
                                 2).

      Figure 3. (a) Ranking scores of all 153 recorded beaches of Chios (TOPSIS method) according to their socio-economic and
      environmental significance; the 15 most highly ranked beaches are shown in the red color; (b) digitized polygons of the
      beaches (clockwise beach numbering starting from the north) and selected beaches; (c) ranking scores of the 15 selected
      beaches (AHP method) based on their vulnerability to CV&C (under current and future conditions).

                                      The AHP multi-criteria approach was applied in order to rank the 15 selected beaches.
                                 The weights (or relative importance) of the indicators/criteria were defined using the same
                                 procedure as in the previous stage. AHP was also used to perform pairwise comparisons
                                 among the alternatives (beaches) (consistency of all the matrices was ensured) and then,
                                 using the eigenvector method, priority scales were defined for all alternatives and for each
                                 indicator/criterion. The final (global) preference score for each alternative (beach) was
                                 calculated using the Weighted Product Model (WPM). The whole procedure was totally
                                 repeated three times for the current status and for two future scenarios (Figure 3c and
                                 Table 2).
                                      Komi, followed by Agia Fotini and Karfas consistently showed the highest scores,
                                 suggesting that these beaches are, at the same time, the most socio-economically impor-
                                 tant and vulnerable to beach erosion under CV&C and, thus, are highest in the list for
                                 adaptation measures. Scores were not substantially affected if minimum or maximum
                                 retreat projections were used. It should be mentioned that the above ranking, depends
                                 on the weights assigned to each indicator, which has been based on expert judgments; if
                                 increasing the number of the experts interviewed, then the scores might be adjusted.

                                 3.2. Geomorphology and Hydrodynamics
                                      Komi beach has a length of approximately 1100 m, a maximum recorded width of 35 m
                                 at the mouth of the ephemeral Katraris river and is bounded by a coastal rock formation
                                 and a small fishing harbor to the west and east, respectively. Katraris river, a major supplier
                                 of beach sediments was dammed (Kalamoti-Katraris Dam) in 2008 (Figure 1).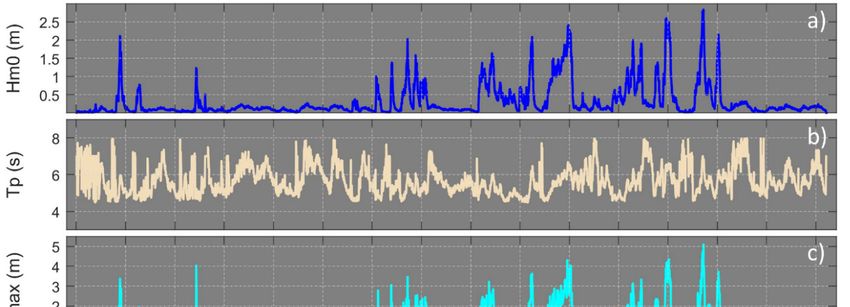
J. Mar. Sci. Eng. 2021, 9, 859                                                                                                                                                             9 of 22

      Table 2. Beach retreat results and ranking scores (AHP analysis) regarding the beach vulnerability to RSLR. Results are for the current status and future projections under the RCP4.5
      emission scenario for the years 2050 and 2100. Width loss refers to the projected reduction of the max. beach width. For beach location see Figure 1a.

                           Current                                   RCP4.5, 2050                                                                   RCP4.5, 2100
  Beach Name                Score    RSLR + Tide (m)     Retreat Range (m)     Width Loss (%)          Score          RSLR + Tide (m)       Retreat Range (m)      Width Loss (%)      Score
  8. Giosonas               0.044          0.3                3.3–11.4              16–54               0.046                0.63                6.6–21.7             32–100           0.045
    34. Agios
                            0.024          0.3                3.3–11.4              37–100              0.025                0.63                6.6–21.7             74–100           0.025
     Isidoros
    36. Glaroi              0.019           0.3               3.3–11.4              14–47               0.019                0.63                6.6–21.7              28–90           0.019
 41. Ormos Lo               0.085           0.3               3.3–11.4              37–100              0.089                0.63                6.6–21.7             74–100           0.087
 53. Bella Vista            0.077          0.22                2.5–8.9               6–22               0.076                0.54                5.7–18.9              14–46           0.076
   60. Kontari              0.075          0.22                2.5–8.9              10–37               0.074                0.54                5.7–18.9              24–79           0.074
   63. Karfas               0.092          0.22                2.5–8.9               8–27               0.090                0.54                5.7–18.9              17–57           0.091
   65. Megas
                            0.090          0.22                2.5–8.9              21–24               0.089                0.54                5.7–18.9             48–100           0.090
   Limnionas
 72. Agia Fotini            0.092          0.22                2.5–8.9              13–47               0.091                0.54                5.7–18.9             30–99            0.091
      85. Viri              0.068          0.22                2.5–8.9              15–53               0.067                0.54                5.7–18.9             34–100           0.067
    90. Komi                0.113          0.22                2.5–8.9               9–31               0.111                0.54                5.7–18.9              20–65           0.112
   93. Mavra
                            0.026          0.22                2.5–8.9               8–28               0.026                0.54                5.7–18.9              18–59           0.026
       Volia
    118. Lithi              0.087          0.24               2.7–9.5                8–30               0.087                0.57                6.0–19.8              19–62           0.087
 133. Managros              0.041          0.26               2.9–10.2               5–16               0.042                0.58                6.1–20.1              10–32           0.042
    140. Agia
                            0.068          0.26               2.9–10.2              11–38               0.069                0.58                6.1–20.1              23–75           0.068
    Markella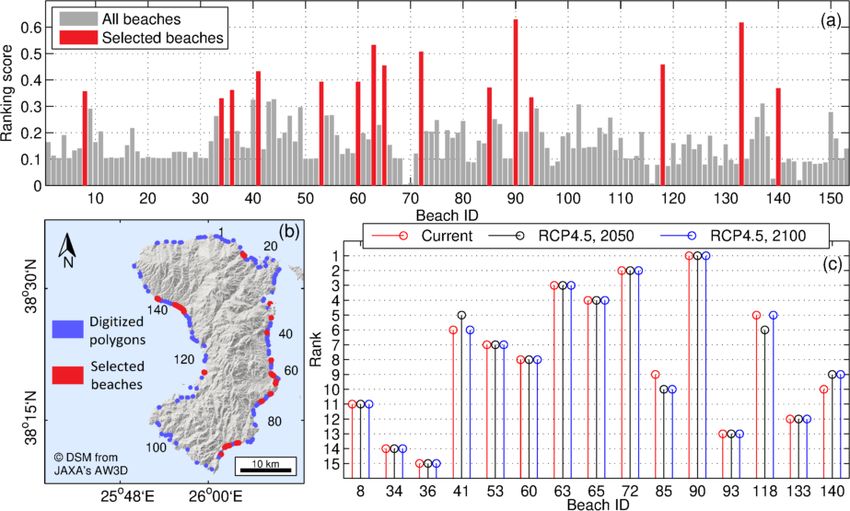
J. Mar. Sci. Eng. 2021, 9, x FOR PEER REVIEW 10 of 22
J. Mar. Sci. Eng. 2021, 9, 859 10 of 22
(Figure 4c) and sediment sampling validated that BT1 corresponds to sandy sediments,
locally showing symmetrical ripples due to the wave action, BT2 relates to hard substrate
outcropping,
3.2.1. locally neighbored by Posidonia patches, and BT3 correlates with a dense
Geomorphology
Posidonia oceanica meadow.
The shallow
In terms bathymetric
of shoreline survey
dynamics, showed aof
comparison generally smooth
the shoreline morphology
positions from thedown
RTK- to
the 20 m depth and small seabed irregularities shallower than
DGPS surveys found a large difference between February 2020 and February 2021, the 4 m isobath due to
the outcropping
suggesting a dry rock
beachformations
loss (erosion)to of
the west
1800 m2 and the presence
in a year, of an intermittent
although locally some dry beach small
nearshore longshore bar (Figure 4a). Analysis of the SSS mosaic (Figure
gain was also observed (Figure 4d). In general, the shoreline shows a retreat or accretion 4b) revealed three
backscatter types (BT) (see Section 3.4 (Figure 8d)). BT1 has a medium
of up to 9.5 m. Even at the mouth of the (dammed) Katraris stream, erosion of up to 6 m reflectivity pattern
suggesting
was recorded, the presence
although theof medium
sedimentgrained
volume sediments
appeared to atincrease
water depths
onshore shallower
suggesting than
approximately 11–13 m. BT2 returns
some sediment discharge at the same period. small high backscatter areas, with small acoustic
shadow zonessediment
Inshore locally, suggesting an uneven
samples, collected relief;than
shallower this 8occurs
m, hadata water depths
mean grain shallower
size of 2.2
than about 5 m. BT3 shows a high reflectance variability, with wavy stripes
−2.8 Ø, corresponding to fine-grained sand (Figure 4e). Only in the two samples collected of alternating
high
alongandthelow backscatter
nearshore bars that
did occurs at water
the sediment depths
mean sizedeeper than
increase, 11–13 m.
reaching −1.1Drop camera
Ø (small
(Figure 4c) and
granules). The sediment
samples weresampling validated
moderately wellthat BT1 (0.51–0.70
sorted corresponds Ø),toexcept
sandyfromsediments,
the
locally showing
longshore symmetrical
bar sediments that ripples due to
were poorly to the
verywave
poorlyaction,
sortedBT2 relates to
(1.58–2.48 Ø)hard substrate
(Figure 4e).
outcropping, locally shallower
In general, towards neighbored by Posidonia
waters, sedimentspatches,
were found and to
BT3becorrelates with awith
slightly coarser dense
Posidonia oceanica meadow.
better sorting.
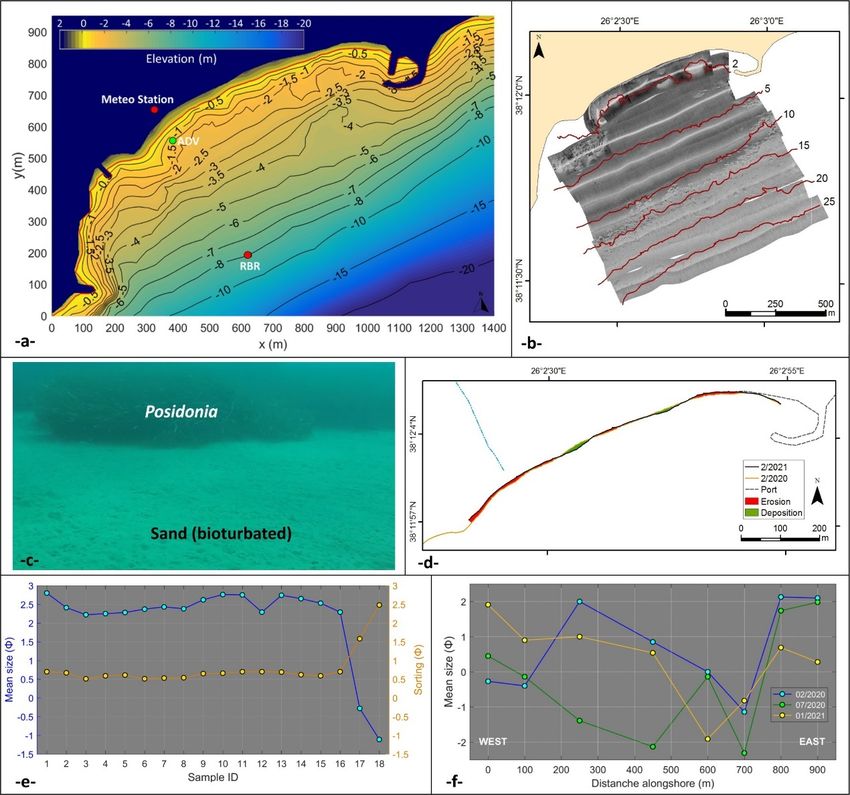
Figure 4. (a) Bathymetric chart of the inshore area, also showing the location of the deployed instruments (the red line
represents the shoreline), (b) shallow water SSS mosaic (for interpretation see Section 3.4, Figure 8d), (c) underwater camera
photo showing the boundary between Posidonia oceanica and sandy sediments at about 10 m depth, (d) one year shoreline
location variability, (e) mean grain-size and sorting (in Ø units) variations of the inshore samples and (f) mean grain size (in
Ø units) differences along the shoreline.J. Mar. Sci. Eng. 2021, 9, 859 11 of 22
In terms of shoreline dynamics, comparison of the shoreline positions from the RTK-
DGPS surveys found a large difference between February 2020 and February 2021, suggest-
ing a dry beach loss (erosion) of 1800 m2 in a year, although locally some dry beach gain
was also observed (Figure 4d). In general, the shoreline shows a retreat or accretion of up
to 9.5 m. Even at the mouth of the (dammed) Katraris stream, erosion of up to 6 m was
recorded, although the sediment volume appeared to increase onshore suggesting some
sediment discharge at the same period.
Inshore sediment samples, collected shallower than 8 m, had a mean grain size
of 2.2–2.8 Ø, corresponding to fine-grained sand (Figure 4e). Only in the two samples
collected along the nearshore bars did the sediment mean size increase, reaching −1.1 Ø
(small granules). The samples were moderately well sorted (0.51–0.70 Ø), except from the
longshore bar sediments that were poorly to very poorly sorted (1.58–2.48 Ø) (Figure 4e).
In general, towards shallower waters, sediments were found to be slightly coarser with
better sorting.
Sediments collected repeatedly along the shoreline at specific locations proved that the
grain size fluctuates through the year considerably with no apparent trends, seemingly due
to the prevailing hydrodynamic regime (Figure 4f). Sediments are finer to the east, close to
the fishing harbor, where also the shoreline shows minimum dynamics. In comparison, the
mean grain size fluctuates considerably at the central section of the beach and towards the
west, suggesting modifications also related to more intense shoreline changes. The mean
grain size ranges between medium sand and small gravel, although locally, large gravels
are encountered.
3.2.2. Hydrodynamic Observations
Analysis of the 5-month wave records showed that the most energetic wave events
(>3000 Jm−2 , zero-moment wave heights (Hm0 ) > 2 m) occurred between January–February
2021 (Figure 5). In total, 11 wave events were found to have wave heights of Hm0 > 1.5 m
and maximum wave heights (Hmax ) >3.0 m, with a duration of more than 12 h (a time
criterion used for the isolation of storm events [48,49]), and most of these occurring after
December (with the exception of the event recorded on 13 October 2020). The maximum
recorded wave height at 8 m water depth was 5.1 m (8 February 2021), whereas the
longer energetic event (Hm0 > 1.5 m) had a duration of about 5 days (7–12 January 2021).
Interestingly, significant wave heights did not exceed 0.5 m during November. Regarding
wave periods (both Tp and the period corresponding to Hmax (Tmax)) were found to
range between 4 and 8 s in all cases.
Concurrent wave records (from the RBR and the ADV) from one of the aforementioned
energetic wave events (44 h duration, 10–12 February 2021), showed that at the beginning
and the end of the event, when significant wave heights were low (about 0.4 m), there were
not large differences between the significant wave heights at 8 m water depth (RBR) and
those recorded at 1.7 m water depth (ADV). However, as the event energy built up, the
differential between the wave heights recorded at 8 m and 1.7 m water depths increased
significantly (Figure 6a). During this period, the maximum Hm0 at 8 m water depth was
about 2.2 m (with a peak wave period (Tp) of 6.2 s), whereas the corresponding wave
conditions recorded at 1.7 m water depth were 1.5 m (Hm0 ) and 6.8 s (Tp). Wind data
from the meteorological station deployed for the period of the simultaneous wave records
showed that during the first day, wind was blowing from the southern sector (150−180◦ )
with velocities progressively increasing, reaching ~12 m s−1 (corresponding to 5–6 Beaufort)
in most cases. Towards the end of the deployment period the wind velocity gradually
decreased, and the direction progressively shifted to the northern sector.J.J.Mar.
Mar.Sci.
Sci.Eng. 2021,9,9,859
Eng.2021, x FOR PEER REVIEW 12 of
12 of 22
22
J. Mar. Sci. Eng. 2021, 9, x FOR PEER REVIEW 13 of 22
during this period. Following the peak of the energetic event, wave heights progressively
decreased to Hm0 values of approximately 0.3 m, whereas the Tp stabilized at around 6 s.
Figure5.5. Wave
Figure Wave characteristics
characteristics extracted
However,
extracted from the
it appears
from thethat
RBRrecords:
RBR records:
this wave (a)height
(a) zero-moment
decrease
zero-moment wave
wavedid height,
(b)(b) peak
not significantly
height, peak wave
wave period,
affect
period,the(c)flow
(c) maximum recorded wave height,
maximum recorded wave velocity (d)
height, (d)
and wave
wave period
bedperiod corresponding
shear corresponding to
stress (Figureto6b). the maximum
theItmaximum wave heights,
wavethe
is noted that heights, and (e)
(e) wave energy
wave
and velocities
low flow energy
recorded
corresponding
correspondingtotothe
thezero-moment
zero-moment
were duewave
wave heights.
heights.
to the small distance (4 cm) of the measurement location from the seabed.
Concurrent wave records (from the RBR and the ADV) from one of the
aforementioned energetic wave events (44 h duration, 10–12 February 2021), showed that
at the beginning and the end of the event, when significant wave heights were low (about
0.4 m), there were not large differences between the significant wave heights at 8 m water
depth (RBR) and those recorded at 1.7 m water depth (ADV). However, as the event
energy built up, the differential between the wave heights recorded at 8 m and 1.7 m water
depths increased significantly (Figure 6a). During this period, the maximum Hm0 at 8 m
water depth was about 2.2 m (with a peak wave period (Tp) of 6.2 s), whereas the
corresponding wave conditions recorded at 1.7 m water depth were 1.5 m (Hm0) and 6.8 s
(Tp). Wind data from the meteorological station deployed for the period of the
simultaneous wave records showed that during the first day, wind was blowing from the
southern sector (150°−180°) with velocities progressively increasing, reaching ~12 m s−1
(corresponding to 5–6 Beaufort) in most cases. Towards the end of the deployment period
the wind velocity gradually decreased, and the direction progressively shifted to the
northern sector.
Hydrodynamic conditions were mild at the beginning of the deployment and up to
the beginning of the next day (11 February 2021, 00:00), maximum zero-moment wave
heights did not exceed 0.3 m, whilst the mean flow (Uxy) close to the seabed was less than
2 cm s−1 and the Reynolds shear stress (Tb) was very small (almost 0 N m−2) (Figure 6b).
Figure
Figure 6.
6. (a)
(a) Wave conditions (zero-moment
Wave conditions (zero-moment wave
wave height—H
height—Hm0 m0 and
and peak
peak wave
wave period—Tp)
period—Tp) ofof aa 44-h
44-h energetic
energetic event
event for
for
which concurrent RBR (at 8The
m energy
depth) increased
and ADV (atsignificantly
1.7 m depth) over the next hours
hydrodynamic and
records areup to the night
available ofFebruary
(10–12 the same day
which concurrent RBR (at 8 m depth) and ADV (at 1.7 m depth) hydrodynamic records are available (10–12 February 2021).−1
(11mean
2021). (b) Wave characteristics, February 2021,
flow and 22:00),
bed shear with
stressHs, Uxy and
recorded TbADV
by the ranging between 0.3–1.6 m, 2–8 cm s and
sensor.
(b) Wave characteristics, mean flow and bed
up to 8 N m−2, shear stress recorded by the ADV sensor.
respectively. The recorded peak wave period also increased from 4 to 7 s
3.2.3. Simulations
With regard to the simulated waves approaching the beach, it was found that wave
breaking is strongly related with the nearshore bathymetry (Figure 7). The mild slope of
the nearshore bathymetry (contours of 0.5 and 2 m water depths are located at about 20J. Mar. Sci. Eng. 2021, 9, 859 13 of 22
Hydrodynamic conditions were mild at the beginning of the deployment and up to
the beginning of the next day (11 February 2021, 00:00), maximum zero-moment wave
heights did not exceed 0.3 m, whilst the mean flow (Uxy) close to the seabed was less than
2 cm s−1 and the Reynolds shear stress (Tb) was very small (almost 0 N m−2 ) (Figure 6b).
The energy increased significantly over the next hours and up to the night of the same day
(11 February 2021, 22:00), with Hs, Uxy and Tb ranging between 0.3–1.6 m, 2–8 cm s−1 and
up to 8 N m−2 , respectively. The recorded peak wave period also increased from 4 to 7 s
during this period. Following the peak of the energetic event, wave heights progressively
decreased to Hm0 values of approximately 0.3 m, whereas the Tp stabilized at around 6 s.
However, it appears that this wave height decrease did not significantly affect the flow
velocity and bed shear stress (Figure 6b). It is noted that the low flow velocities recorded
were due to the small distance (4 cm) of the measurement location from the seabed.
3.2.3. Simulations
With regard to the simulated waves approaching the beach, it was found that wave
breaking is strongly related with the nearshore bathymetry (Figure 7). The mild slope of
the nearshore bathymetry (contours of 0.5 and 2 m water depths are located at about 20
and 100 m from the shoreline respectively) seems to provide effective protection from the
incoming wave action, at least for the wave conditions studied. This was more evident
when checking the bathymetry of the shallow bar located at the western part of the beach
(at x about 200 m, close to the groyne in Figure 7). In this area, the incoming waves break at
different locations, depending on their height. In both simulations, waves did not exceed
0.2 m at the area nearshore of the 0.5 m depth contour.
The wave induced current circulation follows a similar pattern in both simulations.
Current velocities of large magnitude with directions almost parallel to the coastline have
been projected at and close to the rock headland at the western boundary of the beach;
these progressively decrease towards the shallow bar identified to the northeast of the
groyne (simulated velocities close to 0.5 ms−1 at x about 200 m) (Figure 7). Eastwards of
this area (at x about 200–700 m), the nearshore circulation appears complex, affected by
the seabed morphology and evidence of an offshore water transport. In the remaining
eastern section of the beach (i.e., from x > 700 m) the projected current velocity is very
low (J. Mar. Sci. Eng. 2021, 9, 859 14 of 22
the conditions studied. This is in general agreement with the changes identified from the
dry beach shoreline surveys (see also Figure 4d). Secondly, it appears that there could be
J. Mar. Sci. Eng. 2021, 9, x FOR PEER sediment
REVIEW movement offshore under the high energetic conditions, involving mostly 14 ofthe
22
finer fraction of the sediments; in this case, some of these sediments will be likely trapped
in the offshore Posidonia fields (see also Section 3.4, Figure 8).
Figure 7. Hydrodynamic
Figure 7. Hydrodynamic modelmodel output.
output. Wave
Wave height
height propagation
propagation and
and current
current circulation
circulation driven
driven by
by the
the considered
considered wave
wave
conditions: (a,c) Hs—1.4 m, Tp—6.0 s; (b,d) Hs—2.5 m, Tp—6.6 s. (e) Bed morphological changes along a cross-shore
conditions: (a,c) Hs—1.4 m, Tp—6.0 s; (b,d) Hs—2.5 m, Tp—6.6 s. (e) Bed morphological changes along a cross-shore profile
(location at panels
profile (location ata–d) projected
panels from thefrom
a–d) projected morphodynamic simulations.
the morphodynamic simulations.
The wave induced current circulation follows a similar pattern in both simulations.
Current velocities of large magnitude with directions almost parallel to the coastline have
been projected at and close to the rock headland at the western boundary of the beach;
these progressively decrease towards the shallow bar identified to the northeast of the
groyne (simulated velocities close to 0.5 ms−1 at x about 200 m) (Figure 7). Eastwards ofJ. Mar. Sci. Eng. 2021, 9, 859 15 of 22
J. Mar. Sci. Eng. 2021, 9, x FOR PEER REVIEW 17 of 22
Figure
Figure 8.
8. (a)
(a) Bathymetric
Bathymetric chart
chart of
of the
the study
study area,
area, (b)
(b) distribution
distribution of
of sand
sand percentage
percentage (restricted
(restricted at
at the
the limits
limits of
of the
the offshore
offshore
sample
sample locations) (c) SSS mosaic and (d) geomorphological map of the study area. Blue boxes designate areas where sand
locations) (c) SSS mosaic and (d) geomorphological map of the study area. Blue boxes designate areas where sand
could potentially be extracted.
could potentially be extracted.
The collected
3.3. Beach Nourishment sediment samples showed that the surficial sediments range from
Requirements
slightly gravelly muddy sands to gravelly sands with a mean size ranging between 0.63
The closure depth at Komi beach was calculated on the basis of the RBR wave in-
and 3.52 Ø. Sand is mainly terrigenous, whilst the gravel fraction is mostly biogenic (small
formation. Specifically, using the mean values of the maximum wave heights and the
intact or broken shells). The majority of the examined samples have a mud content
corresponding wave periods for 12 h (6 h before and after the time of the most extreme
between 10 and 20%. In general, the sand fraction ranges between 69 and 91% (Figure 8b),
recorded wave event (8 February 2021, 16:00—Hmax = 5.0 m, Figure 5)), from which the
with the extreme
offshore prevailing wavefraction
heightbeing
(and very fine sand. period)
corresponding Their mixed origin (terrigenous
was estimated by linear wave and
biogenic) and varying grain size produce a poor to very poor sorting
theory e.g., [47]. Using the offshore values and the Hallermeier [46] approach, the closure (1.17 to 2.08 Ø) for
the sediments.
depth (hc ) at Komi beach was found to be at about 7.9 m. It is noted that the deployment
The
period ofcollected
the RBR was information
not annual, suggests that the offshore
as the literature suggestsBT1 area,
when whichto
it comes is the
‘sandwiched’
estimation
between the Posidonia meadows (BT3) and the area with
of Hsx and Tsx values. However, the 5-month deployment period covers the most patchy seabed hardgrounds
energetic
(BT2),
months represents
of the year anand,
area thus,
comprising loose sandy
it is considered sediments.
to be Unfortunately,
representative of the annualthe thickness
extreme
of this surficial deposit remains
wave conditions (see also Figure 7). uncertain, as the planned sub-bottom (SBP) survey could
not beNourishment
carried out due to the aforementioned fieldwork difficulties (Section
estimates are sensitive to the grain size of the filling material (d50F ) 2.4).
Considering
(Table 3). The volume the ofspatial
materialdistribution
with similar of grain
the surficial
size to that sandy
of thesediments
beach (d50F and depth
= 1.5 mm
restrictions for dredging operations, assuming that the deposit thickness
or −0.6 Ø) needed per m of beach, was found to be three to four times higher in all scenario is sufficient and
taking into 120
cases (e.g., account
and 30 commonly
m3 /m forapplied
scenariosenvironmental terms for MAalso
(5) and (6), respectively), extraction
affecting(e.g.,
the
extraction
cost (EUR of a surficial
1,320,000 and sediment layer ofrespectively,
EUR 330,000, about 0.5 m for thicktheand,
samein any case, not more3).
scenarios—Table than
In
2comparison,
m thick [51]), the0.85
beach× 10 6 to 3.4 × 10⁶ m3 of sediment could be potentially available for
elevation after nourishment (B) does not appear to significantly
extraction. However,
affect the cost of the ifreplenishment
a more rational (in terms
(e.g., 42,900ofand
operation m3 needed
48,400 logistics andforenvironmental
the cases of
considerations) extraction plan was to be adopted, i.e., constraining
scenarios (1) and (3), respectively), whereas the desired beach width after nourishment extraction to two
orthogonal
(∆y0 ) appears blocks (Figure
to control 8d), thenboth
significantly the filling
MA volume
volumesavailable
and costs,for extraction
being ranges
approximately
between approximately 0.48 × 10⁶ and 1.9 × 10⁶ m3. This estimation suggests a significantJ. Mar. Sci. Eng. 2021, 9, 859 16 of 22
2.5–3 times higher in the case of ∆y0 = 20 m (e.g., estimated nourishment volumes of 17,600
and 44,000 m3 for scenarios (4) and (8), respectively) (Table 3).
Table 3. Estimated volumes, filling costs of nourishment for Komi beach according to different scenarios.
Mean Grain Volume of
Total
Nourishment Nourishment Size of Nourishment
Nourishment Total Cost
Scenario ID Width Height Nourishment Material per m
Volume (EUR)
(∆y0 —m) (B—m) Material of Beach
(V—m3 )
(d50F —mm) (VN —m3 /m)
(1) 10 0.5 1.5 39 42,900 429,000
(2) 10 0.5 2.0 11 12,100 121,000
(3) 10 1.0 1.5 44 48,400 484,000
(4) 10 1.0 2.0 16 17,600 176,000
(5) 20 0.5 1.5 120 132,000 1,320,000
(6) 20 0.5 2.0 30 33,000 330,000
(7) 20 1.0 1.5 130 143,000 1,430,000
(8) 20 1.0 2.0 40 44,000 440,000
The results show that nourishment with material of larger grain size can significantly
reduce nourishment costs. Sediments with greater grain size are also less prone to sediment
mobilization and transport and, thus, could enhance beach resilience. It is noted that,
although nourishment filling material with grain sizes similar to the native beach material
might be preferrable with regard to the beach bio-geological composition and aesthetics, the
granulometry of the filling material depends also on the availability of suitable sediment
sources. If such sediments can be found offshore of the beach region, the nourishment
logistics and costs could be significantly reduced.
3.4. Marine Aggregate (MA) Potential for Beach Nourishment
First, an assessment of the Chios onshore geology and the location of the land drainage
systems, which may have potentially provided suitable land-sourced sediments to offshore
deposits, e.g., [30], was carried out. Other limiting factors for MA extraction were consid-
ered, including (Figure 2): water depth limitations to dredging activities, the distribution of
Posidonia meadows offshore of Chios, the extent of the Greek territorial waters (6 nautical
miles), restrictions due to trawling activities, the presence of marine archaeological sites,
the Natura 2000 network, the occurrence of submarine cables, aquaculture activities (mostly
located along the northeastern Chios coast) and the location of suitable ports that could
support MA activities. Taking into account these constraints, three sites were selected
(Figure 2), all of them located relatively close to the Chios main port, which could facilitate
MA operations. Reported wrecks of archaeological importance rest a safe distance from
these sites [50]. Marine traffic, which according to www.marinetraffic.com/ (accessed on
18 June 2021) appears to be intense along the eastern coast of Chios, does not appear to
considerably affect the two southernmost sites. Finally, the study focused, for logistical
reasons (see Section 2.4), on the site offshore of the Komi beach.
The overall bathymetric survey involved water depths down to 75 m. The seabed
shows a generally smooth relief with low slope gradients that increase slightly along
both sides of the surveyed zone (Figure 8a). The SSS survey offshore Komi (Figure 8c,d)
revealed the same backscatter types as in the inshore area with small deviations in the
acoustic signatures. BT1 appears as a medium to low reflectivity pattern corresponding to
the presence of slightly finer sediments. BT2 shows a much patchier acoustic backscatter
suggesting the presence of a micro-relief, which, considering its particular shape and depth
extent, could be associated to small coralligenous formations; no active sediment transport
could be inferred in this area since there was no evidence of flow-induced bedforms in the
sonographs. Finally, BT3 was found to correspond to Posidonia meadows.J. Mar. Sci. Eng. 2021, 9, 859 17 of 22
The collected sediment samples showed that the surficial sediments range from slightly
gravelly muddy sands to gravelly sands with a mean size ranging between 0.63 and 3.52 Ø.
Sand is mainly terrigenous, whilst the gravel fraction is mostly biogenic (small intact or
broken shells). The majority of the examined samples have a mud content between 10
and 20%. In general, the sand fraction ranges between 69 and 91% (Figure 8b), with the
prevailing fraction being very fine sand. Their mixed origin (terrigenous and biogenic) and
varying grain size produce a poor to very poor sorting (1.17 to 2.08 Ø) for the sediments.
The collected information suggests that the offshore BT1 area, which is ‘sandwiched’
between the Posidonia meadows (BT3) and the area with patchy seabed hardgrounds (BT2),
represents an area comprising loose sandy sediments. Unfortunately, the thickness of this
surficial deposit remains uncertain, as the planned sub-bottom (SBP) survey could not be
carried out due to the aforementioned fieldwork difficulties (Section 2.4).
Considering the spatial distribution of the surficial sandy sediments and depth restric-
tions for dredging operations, assuming that the deposit thickness is sufficient and taking
into account commonly applied environmental terms for MA extraction (e.g., extraction of
a surficial sediment layer of about 0.5 m thick and, in any case, not more than 2 m thick [51]),
0.85 × 10⁶ to 3.4 × 10⁶ m3 of sediment could be potentially available for extraction. How-
ever, if a more rational (in terms of operation logistics and environmental considerations)
extraction plan was to be adopted, i.e., constraining extraction to two orthogonal blocks
(Figure 8d), then the MA volume available for extraction ranges between approximately
0.48 × 10⁶ and 1.9 × 10⁶ m3 . This estimation suggests a significant MA potential in this
area, sufficient for the Komi beach nourishment in terms of volume (Table 2) under all
studied scenarios, as well as cost-effective; according to Bigongiari et al. [52] cost-effective
MA deposits for beach nourishment should have a volume of at least 1 × 10⁶ m3 . Still, in
order to verify the thickness and suitability (in terms of texture and composition) of these
deposits, an SBP survey ground-truthed by a (vibro) coring survey should be carried out.
4. Discussion and Conclusions
Beach erosion, which is projected to greatly increase under CV&C, can endanger
island sustainable development, e.g., [22]. There could be important socio-economic
implications including for tourism revenues, coastal asset values and insurance costs, with
significant effects on the local and national economies, e.g., [53]. In addition, the scale
of the problem and the potential costs of the requisite adaptation measures, e.g., [25],
require an approach that can prioritize responses according to different criteria in order to
allocate more efficiently the limited, in most cases, financial and human resources. Thus,
structured methodological approaches are needed to evaluate/grade the beach erosion risk
and inform feasible and effective adaptation plans. The present work attempts to answer
this call by developing an integrated approach that combines diverse methodologies, which
was then applied to the Greek island of Chios.
The proposed framework, to prioritize the needs for and the selection of potential
responses to beach erosion, could provide an effective roadmap for coastal management
planning under CV&C in island (and other coastal) settings. It comprises four different
steps: ranking of island (regional) beaches in terms of their socio-economic significance,
exposure and vulnerability to sea level rise in order to prioritize the adaptation responses;
study of the hydro- and morphodynamics of the (highest) ranking beach(es) to gain an
insight on the beach erosion processes at a local level; assessment of the needs for ‘borrow’
material for beach nourishment; evaluation of the marine aggregate potential of the adjacent
offshore areas, which could be used for beach nourishment.
In the first step of the framework, the beach ranking, several indicators were selected
as well as their relative ranking weights [5,54] that strike a balance between the major
ecosystem services, development and resilience to beach erosion under CV&C. All 153
recorded beaches of Chios, particularly those that rank high in the evaluation, constitute
valuable natural resources, which are also under increased erosion risk and will most
probably require technical adaptation measures. There could be significant impacts of seaYou can also read