Seasonal and Ephemeral Snowpacks of the Conterminous United States
←
→
Page content transcription
If your browser does not render page correctly, please read the page content below
hydrology
Article
Seasonal and Ephemeral Snowpacks of the Conterminous
United States
Benjamin J. Hatchett

                                           Western Regional Climate Center, Desert Research Institute, Reno, NV 89512, USA; benjamin.hatchett@dri.edu

                                           Abstract: Snowpack seasonality in the conterminous United States (U.S.) is examined using a recently-
                                           released daily, 4 km spatial resolution gridded snow water equivalent and snow depth product
                                           developed by assimilating station-based observations and gridded temperature and precipitation
                                           estimates from PRISM. Seasonal snowpacks for the period spanning water years 1982–2017 were
                                           calculated using two established methods: (1) the classic Sturm approach that requires 60 days of
                                           snow cover with a peak depth >50 cm and (2) the snow seasonality metric (SSM) that only requires 60
                                           days of continuous snow cover to define seasonal snow. The latter approach yields continuous values
                                           from −1 to +1, where −1 (+1) indicates an ephemeral (seasonal) snowpack. The SSM approach is
                                           novel in its ability to identify both seasonal and ephemeral snowpacks. Both approaches identify
                                           seasonal snowpacks in western U.S. mountains and the northern central and eastern U.S. The SSM
                                           approach identifies greater areas of seasonal snowpacks compared to the Sturm method, particularly
                                           in the Upper Midwest, New England, and the Intermountain West. This is a result of the relaxed
                                           depth constraint compared to the Sturm approach. Ephemeral snowpacks exist throughout lower
                                           elevation regions of the western U.S. and across a broad longitudinal swath centered near 35° N
                                           spanning the lee of the Rocky Mountains to the Atlantic coast. Because it lacks a depth constraint,
                                           the SSM approach may inform the location of shallow but long-duration snowpacks at risk of
                                           transitioning to ephemeral snowpacks with climatic change. A case study in Oregon during an
                                 extreme snow drought year (2014/2015) highlights seasonal to ephemeral snowpack transitions.

                                           Aggregating seasonal and ephemeral snowpacks to the HUC-8 watershed level in the western U.S.
Citation: Hatchett, J.B. Seasonal and      demonstrates the majority of watersheds are at risk of losing seasonal snow.
Ephemeral Snowpacks of the
Conterminous United States.                Keywords: ephemeral snow; snow; snowpack; seasonal snow; United States
Hydrology 2021, 8, 32. https://
doi.org/10.3390/hydrology8010032

Academic Editor: Shaktiman Singh
                                           1. Introduction
Received: 25 January 2021
Accepted: 11 February 2021
                                                 Snowfall occurs over a wide range of landscapes worldwide [1–3], providing es-
Published: 18 February 2021
                                           sential services to ecosystems and human society [4–6]. Environmental drivers, notably
                                           precipitation, radiation, and wind, govern the temporal persistence and spatial extent of
Publisher’s Note: MDPI stays neu-          snow cover as well as the amount of water stored in the snowpack by driving patterns of
tral with regard to jurisdictional clai-   snow accumulation and its ablation [7–9]. For seasonal (i.e., non-perennial) snowpacks,
ms in published maps and institutio-       these processes vary across time scales ranging from minutes to seasons and space scales
nal affiliations.                          from meters to thousands of kilometers [7]. Vegetation and topographic characteristics,
                                           such as canopy cover, slope, aspect, and elevation also determine the behavior of snow
                                           cover [10–12]. Ultimately, interactions between the topoclimate, meteorology, and land
                                           surface conditions determine the physical character of snow cover during and following
Copyright: © 2021 by the authors. Li-
                                           snow deposition [7,8,13,14].
censee MDPI, Basel, Switzerland.
                                                 Classifying snow cover in terms of its seasonal and physical characteristics has long
This article is an open access article
                                           been a focus of cryospheric and hydrologic science [13] with the earliest classification
distributed under the terms and con-
                                           systems developed in the early 1900s [15,16]. Prior to the advent of remote sensing and nu-
ditions of the Creative Commons At-
                                           merical modeling, snow classifications were primarily qualitative [16] and based upon field
tribution (CC BY) license (https://
creativecommons.org/licenses/by/
                                           observations, though more quantitative characteristics were later incorporated [17]. Sturm
4.0/).
                                           et al. [13] introduced a physically-based classification system based upon multiple physical

Hydrology 2021, 8, 32. https://doi.org/10.3390/hydrology8010032                                           https://www.mdpi.com/journal/hydrology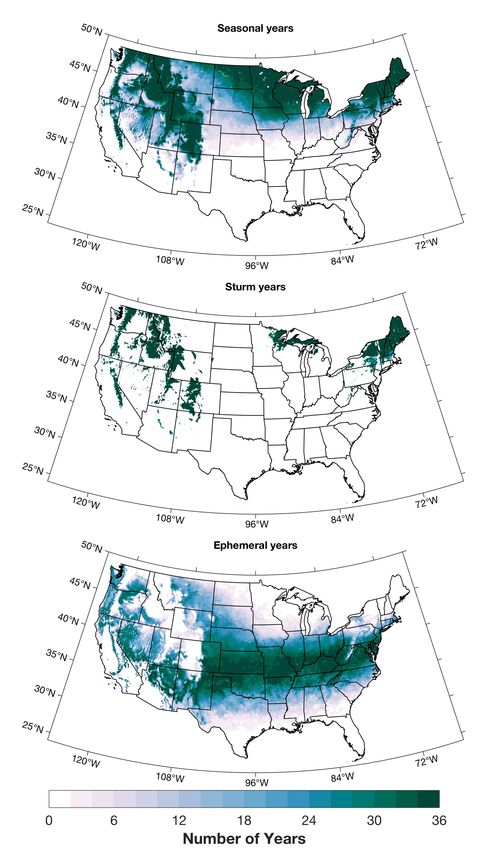
Hydrology 2021, 8, 32                                                                                            2 of 19

                        snowpack parameters with the goal of global applicability. The approach developed by [13]
                        has since become a widely-used standard.
                              Delineating regions of seasonal and ephemeral snow at scales relevant to decision mak-
                        ing (i.e., typically less than 10 km) aids identification of regions where climate change poses
                        the greatest risks for snow and the systems that depend on snowpack [18–21]. Shifts from
                        seasonal to ephemeral snowpacks will disrupt upstream and downstream environments
                        by altering terrestrial hydrological processes and states and their predictability [5,9,22].
                        Vegetation adapted to seasonal snow cover and its associated hydrologic regime may be
                        less resilient under a shift towards an ephemeral snow regime characterized by a longer
                        and drier growing season [21]. Increased watershed contributing area with a growing
                        transient snow zone area enhances flood risk [23], especially as the snowline rises [24] and
                        the fraction of precipitation falling as snow declines [25]. A compounding impact results
                        as these changes can also increase the price of water [5].
                              Because of their importance as natural freshwater reservoirs [5], especially in moun-
                        tains [4,6,26], seasonal snowpacks persisting for longer than two months [13] receive the
                        bulk of scientific attention [4,9,27]. Seasonal snowpacks tend to experience distinct accu-
                        mulation and ablation seasons that are sequential in time [7]. Higher elevation (i.e., colder
                        and typically wetter) watersheds with seasonal snowpacks produce peak streamflows in
                        summer, recharging reservoirs at the time of peak downstream demand, and are important
                        sources of warm season baseflows for aquatic ecosystems [4]. Changes in seasonal snow-
                        pack accumulation and melting patterns have the potential to alter both peak streamflow
                        and late warm season low flows [18,20] as well as vegetation dynamics [21], disturbance
                        regimes [28], soil water availability [29], and water and solute transport in upland water-
                        sheds [27]. Seasonal snowpacks also provide economic benefits to rural economies from
                        recreation [30–34] and agriculture [5,35].
                              Ephemeral snowpacks form the transition region between seasonal snow regions (if
                        one exists) and non-nival (i.e., snow-free) regions. These shallow and warm snowpacks
                        often result from a single snowfall event [13]. Ephemeral snowpacks differ from seasonal
                        snowpacks by experiencing accumulation and melting processes nearly simultaneously [7].
                        This aspect makes them challenging to observe and model [9,14]. Ephemeral snowpacks
                        occur in the transient snow zone, defined by Harr [36] as the location of where snow falls
                        and melts more than once per year. This transient zone is an important region from erosion
                        and flooding perspectives [23,36], as rapid melting of shallow, low cold content snowpacks
                        can produce higher rates of water input to soil than direct precipitation. Regions with
                        ephemeral snow also demonstrate different soil moisture and other hydrologic responses
                        compared with seasonal snowpacks [9] as well as markedly different surface energy
                        budgets [7].
                              The increasing availability of spatially distributed (i.e., gridded) and temporally con-
                        tinuous snow products increases our ability to classify and evaluate change in snowy
                        but often sparsely instrumented regions [37] thereby improving our ability to identify
                        regions most sensitive to potential shifts towards increased ephemerality and associated
                        impacts. These products are typically developed using observational data derived from
                        satellite measurements [2,38–43], station observations [44,45], or numerical models using
                        station-based or remotely sensed observations as input [46–49]. As noted by [13], diffi-
                        culty in producing generic snow classifications that can be measured and applied across
                        landscapes limits the applicability of many approaches. Applying snow seasonality classi-
                        fication schemes to readily available parameters (e.g., snow water equivalent; SWE) from
                        spatially distributed products at daily temporal resolution allows for easy calculation and
                        comparison of seasonality definitions.
                              My aim here is to demonstrate the application of both classic [13] and recently-
                        developed [9] snow seasonality classification schemes to a newly-available spatially dis-
                        tributed snowpack reanalysis product [45] in order to highlight similarities and differences
                        between these classification regimes across the varied landscapes of the United States (U.S.).
                        The classification schemes used herein rely on indicators of snow presence (e.g., non-zero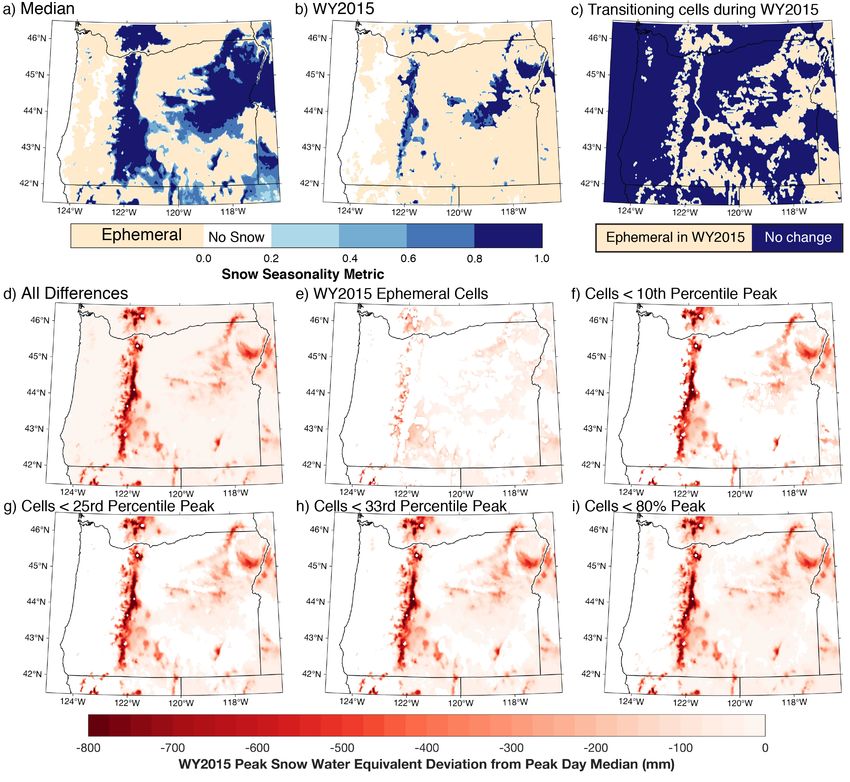
Hydrology 2021, 8, 32                                                                                         3 of 19

                        SWE) and do not require field-based measurements of snowpack stratigraphy or grain
                        size [13]. However, they do require continuous daily values, which can be difficult to
                        obtain from remotely-sensed platforms resulting from cloud cover or satellite overpass
                        frequency. A central goal, beyond providing a reference for the seasonality classification
                        of a given regions snowpack, is to motivate continued analysis of spatially distributed
                        snowpack products, especially projections, in order to identify regions sensitive to transi-
                        tions from seasonal to ephemeral snowpacks in both lowland and montane environments.
                        Identification of such locations will aid assessments of impacts of snow seasonality change
                        to human and natural systems. The analyses performed herein represent an initial effort
                        to broadly classify and identify sensitive (or “at-risk” [19]) seasonal snowpacks across the
                        U.S. at the native 4 km scale and aggregated to the scale of small watersheds. By identify-
                        ing vulnerable regions and assessing impacts for a range of past and projected scenarios,
                        adaptation strategies can be identified, prioritized, and implemented to minimize negative
                        outcomes on the environment and economy.
                              The manuscript is organized as follows: Section 2 describes the University of Arizona
                        Snow product, how the snow seasonality classifications used are defined, and the digital
                        elevation and hydrologic datasets used to evaluate snow seasonality across topography
                        and at the small watershed scale. In Section 3, the key results are highlighted from each
                        seasonality classification and are compared against one another, showing that seasonal
                        snowpacks have greater snow water equivalent and snow depth and are confined to the
                        higher elevations in the mountainous western U.S. and lower elevation regions of the high
                        latitude regions of the eastern U.S. Section 3 also provides results from a case study of an
                        extreme snow drought year in Oregon and the identification of ‘at-risk’ small watersheds
                        throughout the western U.S. The discussion in Section 4 explores possible reasons for
                        differences between the snow seasonality classification schemes, highlights possible condi-
                        tions leading to loss or retention of seasonal snowpacks in low-snow or shorter-duration
                        snowpack years and the implications of these losses. It provides suggestions for future
                        research, which largely focus on incorporating additional datasets and products to better
                        constrain average snowpack seasonality and its variability. A brief summary of the paper
                        and its primary conclusions and suggestions for future work are provided in Section 5.

                        2. Materials and Methods
                        2.1. The University of Arizona Snow Product (UAswe)
                             I used the daily gridded 4 km snow product developed by the University of Ari-
                        zona [45]; hereafter UAswe). The UAswe product provides continuous spatial coverage
                        through assimilation of in situ measurements of snow water equivalent (SWE) and snow
                        depth (SD) from the Natural Resources Conservation Survey’s Snow Telemetry Network
                        (SNOTEL) and National Weather Service Cooperative Observer Network and gridded 4
                        km temperature and precipitation from the Parameter-elevation Regressions on Indepen-
                        dent Slopes Model (PRISM; [50]). Specific details about the methodology used to develop
                        UAswe and various tests of its robustness can be found in [44,51,52].
                             UAswe spans water years 1982–2017. In the western United States, a water year
                        begins on October 1 and ends on September 30 of the following year, with the ending
                        year corresponding to the named year (e.g., water year 2017 spans 1 October 2016–30
                        September 2017). Water year definitions vary by location in terms of their start and end
                        times, but generally correspond to the period covering a full cycle of accumulation from
                        zero to peak snowpack and then complete melting back to zero SWE. This may span
                        2 calendar years (e.g., northern hemisphere) or could plausibly fit within a single calendar
                        year (e.g., southern hemisphere), but ultimately depends on regional snow accumulation
                        and melting cycles. Glaciated and permanently snow-covered (firn) regions, which cover a
                        very small total area in the conterminous U.S., are exempt from the UAswe dataset. As
                        such, the vast majority of water resources derived from frozen water in the conterminous
                        U.S. originate from seasonal and ephemeral snowmelt and not runoff from glacial or firn
                        regions. For example, the Colorado River Basin has no ice cover and the Columbia River in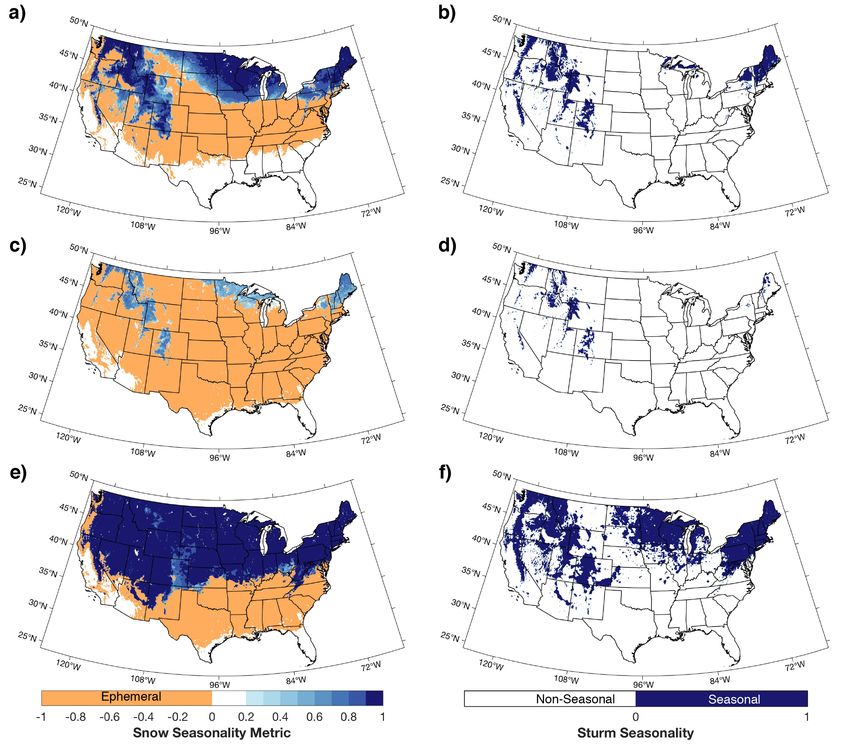
Hydrology 2021, 8, 32                                                                                                          4 of 19

                                 the northwestern U.S. has only 0.31% ice cover [4]. Elevation analyses were performed by
                                 re-gridding the 800 m PRISM elevation digital elevation model to the 4 km resolution of the
                                 UAswe product using two-dimensional bilinear interpolation. For reference, a topographic
                                 map of the conterminous U.S. is provided in Figure 1 with key regions and mountain
                                 ranges discussed in the text labeled.

      Figure 1. Topography of the conterminous U.S. and surrounding ocean bathymetry from the 1 arc-minute ETOPO digital
      elevation map [53]. Regions (light purple italicized text) and mountain ranges (black standard text) discussed in the main
      text are highlighted.

                                 2.2. Snow Seasonality Definitions
                                      Snow seasonality can be categorized utilizing snowpack variables including snow
                                 cover duration, snow depth, and snow density (e.g., [13]). I defined snow climates in two
                                 ways, both of which can be readily calculated using daily SWE and snow depth. First, I
                                 used the Sturm et al. [13] method (hereafter “Sturm”) where 60 days of continuous SWE are
                                 required with a peak depth of at least 50 cm. This approach lumps the tundra, taiga, alpine,
                                 and maritime snowpack classifications based upon the duration of snow cover [13]. By
                                 providing both SWE and snow depth, the UAswe product allows the calculation of Sturm
                                 seasonal snowpacks without requiring assumptions about snowpack density to calculate
                                 depth from SWE (or vice-versa). Second, I calculated the snow seasonality metric (SSM)
                                 introduced by Petersky and Harpold [9], which did not include a depth criteria and only
                                 required an indicator of snow presence at the daily timescale. The SSM was previously
                                 applied over the Great Basin region of the Intermountain West by Petersky and Harpold [9]
                                 using gridded output from the Snow Data Assimilation System model [47]. The SSM is
                                 defined as follows: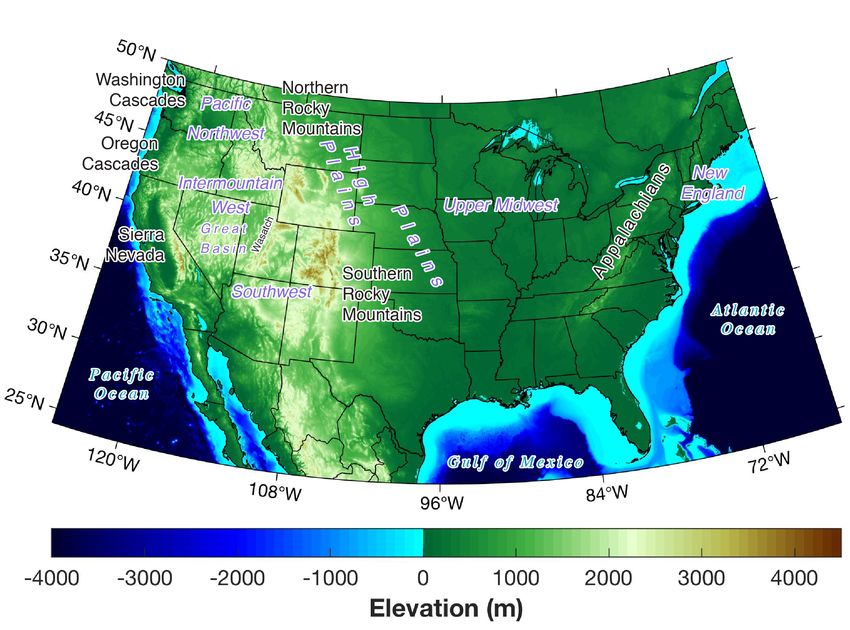
Hydrology 2021, 8, 32                                                                                            5 of 19

                                                        DaysSeasonal Snow − Days Ephemeral Snow
                                                SSM =                                                               (1)
                                                                  Days with Snow
                        where days with seasonal snow are defined as the number of days with at least 60 days of
                        continuous non-zero SWE. The SSM is calculated over a water year and thus represents
                        an annual measure of snow seasonality. Completely ephemeral snowpacks receive a
                        value of −1 whereas completely seasonal snowpacks receive a value of +1. The SSM is
                        an ideal approach to use with spatially distributed snow estimates because most in situ
                        snow observations are located in regions characterized by historically seasonal snow, only
                        becoming ephemeral in extreme years [9]. In practice, because early or late season snowfall
                        events led to additional days with snow that were classified as ephemeral, fewer ‘perfectly’
                        seasonal snowpacks (i.e., SSM = 1) were identified than otherwise might be expected. In
                        a few cases, I identified double seasonal peaks. In these cases a seasonal snowpack was
                        established, melted to zero SWE, then a second seasonal snowpack formed. In this situation
                        I considered the longest-running continuous snowpack as the value for the seasonal snow
                        days term in Equation (1).
                             Snowpack classifications from the 4 km UAswe product were further evaluated in two
                        ways. First, I grouped classifications into 1◦ latitudinal bins to provide a distribution of
                        snowpack seasonality classification across elevations for each latitudinal bin. Second, I used
                        the eight digit U.S. Geological Survey Hydrologic Unit Codes (HUC-8) watersheds [54]
                        to aggregate cells categorized as seasonal or ephemeral. I report the percentage declines
                        between “expected” (more than 28 of 36 years classified as seasonal) and minimum (or
                        “worst in record”) seasonal cells to highlight ‘at-risk’ watersheds where losses of seasonal
                        snowpacks may impact water resource management or ecosystem processes. For transi-
                        tioning cells, the volume of water no longer stored in seasonal snow for each HUC-8 and
                        percentage decrease in seasonal snow proportion is reported. For the Oregon case study, I
                        selected water year (WY) 2015. Characterized by above-average precipitation but below-
                        normal snowpack, WY2015 motivated development of the concept of warm snow droughts
                        in maritime mountain regions [55–57]. In addition to examining how a warm snow drought
                        influences snow seasonality, I explored the use of percentiles to help identify grid-cell level
                        snow drought conditions with the goal to test whether a percentile-based approach can
                        identify anomalies associated with transitions from seasonal to ephemeral snowpacks.

                        3. Results
                        3.1. Snow Seasonality
                             The SSM approach categorized large regions of the conterminous U.S. as a seasonal
                        snowpack, particularly in the coastal Cascades and Sierra Nevada, Intermountain West,
                        Northern Plains, Upper Midwest, and New England (Figure 2a). The total area of median
                        seasonal snowpack (SSM > 0) equaled 2,651,936 km2 . A slope from the highest SSM values
                        (SSM > 0.9) towards lower SSM values was observed along the periphery of mountain
                        regions or elevated terrain in the western U.S. and along the southern margin of the
                        seasonal snowpacks of the High (northern) Plains, Upper Midwest, and New England. The
                        larger the median value of SSM, the greater the seasonality of the snowpack (i.e., more days
                        of seasonal snowpacks and/or more frequent years of seasonal snowpacks). The Sturm
                        method generally identified similar regions but with roughly two-thirds less areal extent
                        (Figure 2b); a total of 736,864 km2 of Sturm snowpacks are classified. Seasonal snowpacks
                        identified by the SSM but absent from the Sturm approach included the High Plains, much
                        of the Upper Midwest, and areas of New York and Pennsylvania. Overlapping areas
                        of median values satisfying the Sturm and SSM approach are shown in (Figure 3). The
                        majority of overlap was found in major western U.S. mountain ranges, the Great Lakes
                        region of the Upper Midwest, the Appalachians of the Virginias and New England. The
                        vast majority of overlap fractions exceeded 0.9; lower values were found sporadically in
                        the Upper Midwest and New England with the overlapping areas following the Sturm-
                        classified seasonal snowpacks (cf. Figure 2b).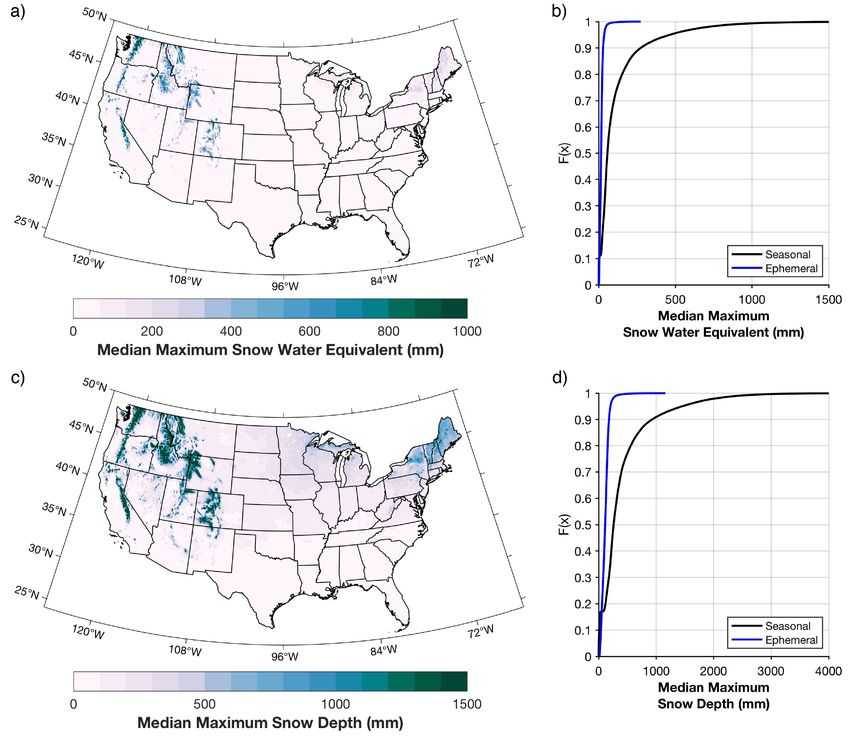
Hydrology 2021, 8, 32                                                                                                       6 of 19

Figure 2. (a) Median snow seasonality metric (SSM). (b) Median Sturm seasonality. (c) Minimum snow seasonality metric. (d) Minimum
Sturm seasonality. (e) Maximum extent of seasonal snow based on the snow seasonality metric. (f) Maximum extent of seasonal snow
based on the Sturm approach.

                                      Minimum values of the SSM indicated a large fraction of the conterminous U.S. can
                                 experience an ephemeral snowpack (Figure 2c). The UAswe method never created any
                                 type of snowpack in the low elevation and coastal regions of California, Arizona, and near
                                 the Gulf of Mexico coast. Areal coverage of seasonal snowpacks can contract, as shown
                                 by smaller values of SSM and the reduced spatial extents of values greater than 0. The
                                 transitions from seasonal to ephemeral snowpacks were most prominent in the maritime
                                 ranges of the Cascades and Sierra Nevada of the western U.S. and the Intermountain
                                 ranges of eastern Oregon, eastern Nevada, southern Utah, as well as northern Arizona
                                 and New Mexico. The northern Cascades of Washington and the Rocky Mountains and
                                Wasatch Range (northern central Utah) maintained seasonal snowpacks, though the lower
                                values of SSM indicated additional days that are classified as ephemeral, during these
                                ‘worst in record’ years. Reductions in seasonal snowpacks were also possible during poor
                                 snow years with the Sturm approach (Figure 2d). The largest reductions agreed with the
                                 SSM approach in the western U.S., however the Sierra Nevada remained classified as a
                                 seasonal snowpack. The Upper Midwest and New England regions underwent extensive
                                 losses of seasonal snowpack in minimal years. Note that both the minimum and maximum
                                values (discussed next) corresponded to ‘all time’ minimum/maximum values for each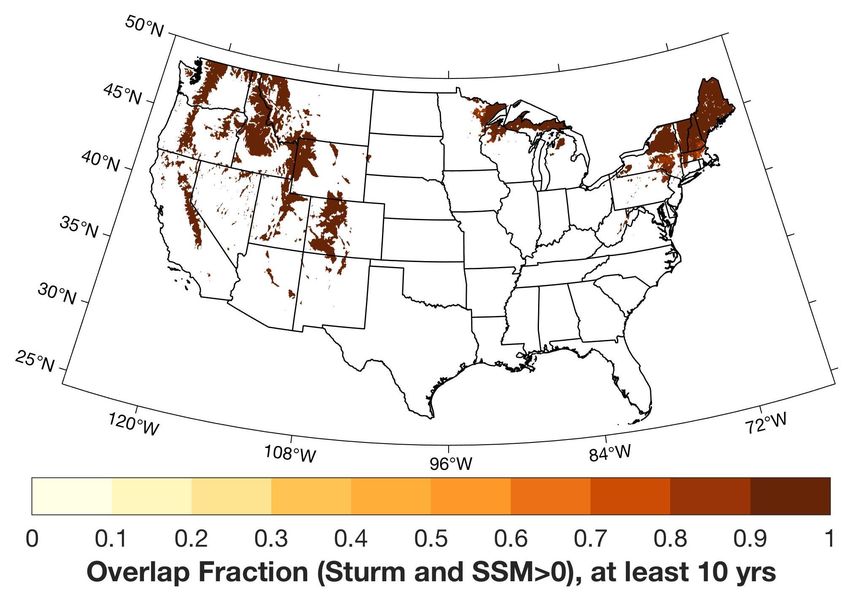
Hydrology 2021, 8, 32                                                                                                       7 of 19

                                individual gridpoint and two adjacent points may experience minimum or maximum
                                values in different years.

Figure 3. Agreement (overlap fraction) between seasonal snowpacks identified via the snow seasonality metric and Sturm seasonality
classification schemes. Only grid cells with at least 10 years of snow observations were considered.

                                     Maximum SSM values highlighted that over half the conterminous U.S. could potentially
                                experience a seasonal snowpack (Figure 2e). East of the Rocky Mountains, the seasonal
                                snowpack formation occurred north of 37◦ N. Because of the 50 cm depth requirement in
                                the Sturm method, less spatial expansion of seasonal snowpacks was evident (Figure 2f)
                                compared to the SSM maximum values (Figure 2e). Seasonal Sturm snowpacks could expand
                                in western mountains and in the Upper Midwest, High Plains, and New England.
                                     Counts of years satisfying either seasonal or ephemeral snowpacks are shown in Figure 4.
                                These counts can be interpreted as the frequency of which a given type of year occurred;
                                different methods identified varying numbers of years satisfying the given classification
                                scheme. In the case of the SSM, this can help identify locations that experienced some number
                                of seasonal and ephemeral years rather than all seasonal or all ephemeral. Comparing counts
                                of seasonal years defined by the SSM approach (Figure 4a) with counts of Sturm seasonal
                                years (Figure 4b) further demonstrated the impact of the 50 cm depth criteria in the Sturm
                                approach. This criteria led to nearly all years satisfying the criteria or none of the years. In
                                contrast, seasonal snowpacks identified via the SSM approach were most common in the
                                regions described previously, but the gradation in frequency (a decrease in counts of years)
                                of seasonal years highlighted the transition from locations that nearly always achieved a
                                persistent snowpack towards those that did not achieve one. Prime examples occurred along
                                the southern periphery of the High Plains, Upper Midwest, and New England as well as
                                throughout the Intermountain West. The lower elevation coastal regions of the western U.S.,
                                as well as the Southwestern U.S. rarely achieved seasonal snowpacks. Seasonal snowpacks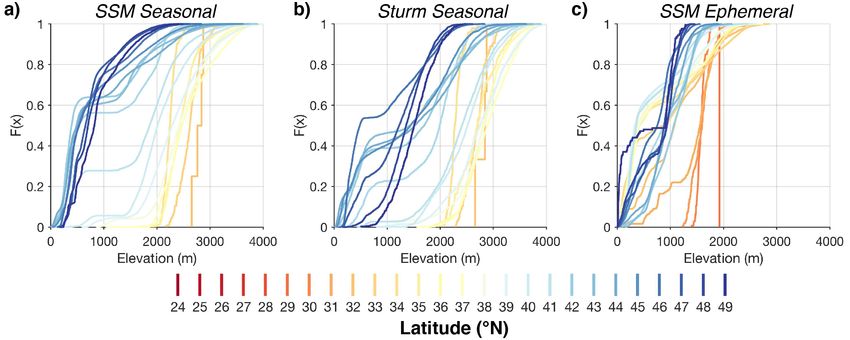
Hydrology 2021, 8, 32                                                                                             8 of 19

                        occurred with decreasing frequency east of the Rocky Mountains from 40◦ N southwards.
                        Seasonal snowpacks abruptly declined in frequency immediately in the lee of the Rocky
                        Mountains in central Montana southeastwards across Wyoming and then southwards across
                        the Front Range of Colorado into northern New Mexico.

                        Figure 4. Counts of years (maximum of 36) that each classification was satisfied: (top) Seasonal
                        snowpacks defined by the snow seasonality metric (SSM); (middle) Seasonal snowpacks defined by
                        the Sturm method; (bottom) Ephemeral snowpacks defined by the snow seasonality metric (SSM).

                             A peak in ephemeral snowpack frequency was found across the eastern half of the U.S.
                        (east of the Rocky Mountains; Figure 4c), increasing in frequency (i.e., counts) consistent
                        with the decrease in frequency of seasonal snowpacks. In the mountainous western U.S.,
                        ephemeral snowpacks were found along the flanks of major mountain ranges (e.g., the
                        Sierra Nevada of California and the Cascades of Washington and Oregon) or in elevated
                        basins of the Intermountain West (eastern Oregon and Washington and northern Nevada).
                        The southeast-trending band from central Montana to eastern Wyoming demonstrates a
Hydrology 2021, 8, 32 9 of 19
balance between seasonal and ephemeral years. Further south along the lee of the Rocky
Mountains, ephemeral years became more common, extending into the Texas Panhandle,
much of New Mexico, and northern Arizona. The peak in ephemeral snowpack frequency
was found along a zonal (east-west) band spanning 35–39◦ N before declining southwards
into the climatologically warmer and more humid Gulf of Mexico coastal region of the
southeastern U.S.
3.2. Peak Snow Water Equivalent and Snow Depth
Figure 5a provides a map of the median annual maximum (or peak) SWE across the
conterminous U.S. for reference. The “natural reservoirs” of the high mountains of the
western U.S. were highlighted by maximum SWE values greater than 300 mm. Consistent
with these regions were areas of median annual maximum snow depths exceeding 500 mm
(in the highest areas exceeding 1500 mm; Figure 5c). Cumulative distribution function
plots showed how in all but the most extreme cases, ephemeral snowpacks exhibited lower
values of SWE compared to seasonal snowpacks (Figure 5b) and demonstrated shallower
snow depths (Figure 5d). Outside of the uppermost percentiles, ephemeral snowpacks did
not exhibit a wide range in peak SWE or snow depth. This is to be expected by definition
because these snowpacks accumulated and quickly melted, rarely accumulating more
than 100 mm SWE (Figure 5b) or 250 mm of depth (Figure 5d). The differences between
snowpack types diverges das one moved upwards from the lower quintile into the upper
quintile of the distributions. This is reflective of both the upper bound of ephemeral
snowpack accumulation and the ability for high elevation western U.S. mountains to
develop deep snowpacks storing substantial water.
3.3. Snow Seasonality Relations to Elevation and Latitude
The distribution of seasonal and ephemeral snowpacks as a function of elevation
indicated the role of elevation and latitude in defining snowpack seasonality (Figure 6). In
all cases, only grid points with at least 10 years of either a seasonal or ephemeral snowpack
were considered. Both the SSM (Figure 6a) and Sturm (Figure 6b) approaches agreed on
lower (i.e., south of 35◦ N) and middle (e.g., between 35◦ N and 40◦ N) latitude regions
necessitating elevation to achieve seasonal snowpacks. The consistencies between the two
approaches declined with increasing latitude: the rightwards shift in Sturm seasonality
compared with the SSM highlighted the 50 cm depth criteria that relegated Sturm-defined
seasonal snowpacks to mountainous or otherwise elevated regions in lower latitudes.
In contrast, by not having this constraint, the SSM had a greater frequency of seasonal
snowpacks at lower-to-middle elevations ranging between 500 and 1500 m. Ephemeral
snowpacks were largely absent from upper elevations except in the lowest latitude regions
(i.e., south of 37◦ N) and were confined to elevations below 2000 m in higher latitudes (i.e.,
north of 37◦ N; Figure 6c).Hydrology 2021, 8, 32 10 of 19 Figure 5. (a) Median annual maximum snow water equivalent and (b) the cumulative distribution functions of median maximum snow water equivalent for seasonal (black line) and ephemeral (blue line) snowpacks. (c,d) As in (a,b) but for median annual maximum snow depth. Figure 6. Cumulative distribution functions of snowpack classifications (requiring 10 years of snow observations) distributed by 1◦ latitude bins for: (a) Seasonal snowpacks defined by the snow seasonality metric (SSM); (b) Seasonal snowpacks defined by the Sturm method; (c) Ephemeral snowpacks defined by the snow seasonality metric (SSM).
Hydrology 2021, 8, 32 11 of 19
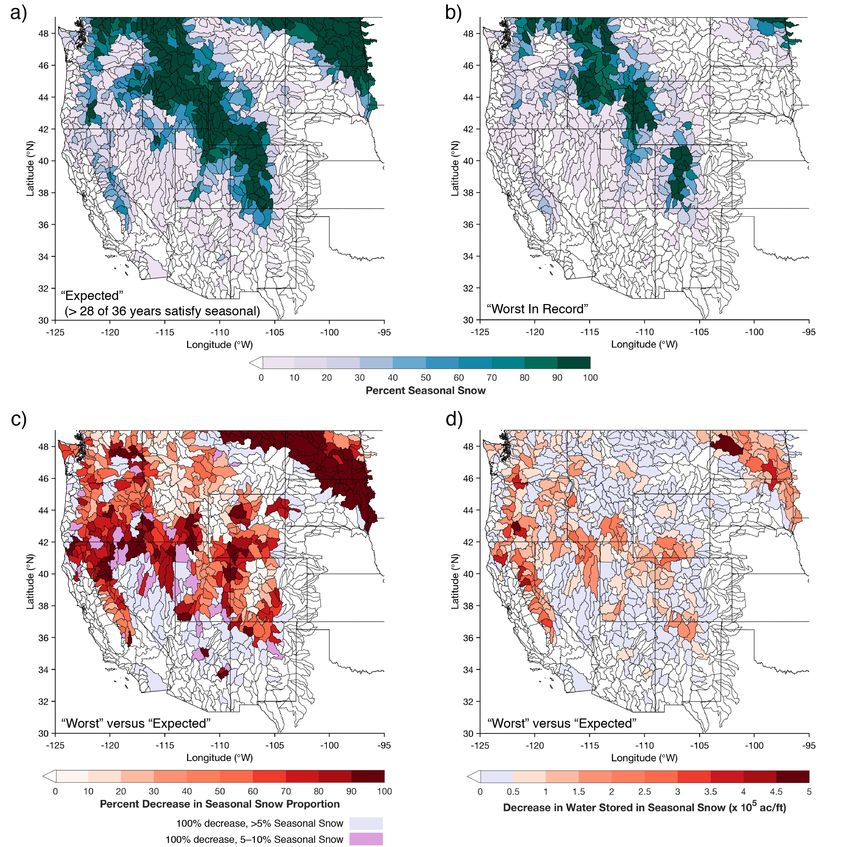
3.4. “Expected” and “Worst In Record” Snow Seasonality at the HUC-8 Scale
To provide a perspective on a potential impact of changing snow seasonality for water
resource management, percent seasonal snow (using cells with SSM > 0 and SSM < 0,
for seasonal and ephemeral snow, respectively) was aggregated to HUC-8 watersheds.
Percentage decreases in seasonal snow proportion and decreases in water stored in sea-
sonal snow were calculated for “Expected” conditions compared to “Worst In Record”
conditions, and are interpreted as the contraction of seasonal snowpacks due to various
hydrometeorological conditions (e.g., increases in rain versus snow proportion, dry spells,
or mid-winter melt events). The HUC-8 maps shown in Figure 7a,b mirror the differences
shown Figure 2a,c. The watersheds of the maritime ranges in the far-western U.S. (Oregon
Cascades and California Sierra Nevada) demonstrated the transitional nature of having
both ephemeral and seasonal snow with 30–70% percent seasonal snow. Mountains in
the Intermountain West and Rocky Mountains, as well as the cold, higher latitude High
Plains, showed the dominance of seasonal snowpacks. During the “Worst In Record” years
(Figure 7b), substantial reductions in seasonal snow proportions occurred throughout
the western U.S. (Figure 7c). Only the mountains in central Idaho, western Wyoming,
far-northern Washington, and central Colorado did not show more than 20% decreases in
seasonal snow proportion. By calculating the volume of water stored in snow that was
no longer seasonal, Figure 7d shows where the impacts of the seasonal snow reductions
may have been most notable. Though many areas lost all seasonal snow in the “Worst
In Record” conditions (Figure 7c), the decreases in volumes of water tended to be less
than 50,000 ac/ f t in many basins. However, Oregon, California, Nevada, Washington,
North Dakota, northern New Mexico, southern Idaho, and the northern Utah/southern
Wyoming/northwestern Colorado regions showed small watersheds with decreases in
water stored in seasonal snow on the order of more than 200,000 ac/ f t).
3.5. WY2015 Oregon Cascades Case Study
Water year (WY) 2015 in the Pacific Northwest was characterized by above-normal
accumulated precipitation but below-normal snowpack. These conditions came to be
recognized as a warm snow drought [55] and were often characterized by an anomalous
frequency of warmer-than-normal storms that produced rain instead of snow [56,58], which
is a concern for a warming future [57] in lower elevation regions known to be at risk for the
impacts of climatic change [19]. The mountains of Oregon, particularly the Cascades, are
susceptible to a warming climate as a result of their low elevation. During WY2015, seasonal
snow climates retreated considerably compared to median seasonality (Figure 8a,b) in the
Cascades but also in interior ranges such as the Blue (central eastern Oregon), Wallowa
(northeastern Oregon), and Steens (southeastern Oregon) Mountains. These changes are
exemplified in Figure 8c, which shows the upslope contraction of seasonal snowpacks as
lower elevations transitioned to ephemeral snowpacks along the flanks of the Cascades and
throughout the eastern half of the state. Ephemeral snowpacks were also lost in the Coastal
Ranges (not shown, but can be identified by comparing (Figure 8a,b). Peak SWE anomalies
were greatest in the Cascades, with reductions on the order of 500–800 mm compared to
the median peak value (Figure 8d). Drier, colder interior ranges (e.g., the Blue and the
Wallowa Mountains) underwent changes of smaller magnitude, with reductions on the
order of 300—500 mm.
The sensitivity to a transition from a seasonal snowpack to an ephemeral snowpack is
highlighted in Figure 8e. Only SWE anomalies for cells defined as ephemeral in WY2015
are shown; the magnitudes of negative SWE anomalies range from 25–400 mm with lower
values observed in interior parts of the state and the largest anomalies being observed
along the windward (western) side of the Cascades and along the leeside of the southern
Cascades. Several thresholds of SWE anomalies, both percentile-based and based upon the
arbitrary threshold of 80% of 1981–2010 average used by [56] are shown in Figure 8f–i. Each
criteria only shows anomalies for cells with less than a given threshold of peak SWE. In the
most strict case (Figure 8f), changes are confined to higher topography and mountainousHydrology 2021, 8, 32 12 of 19
regions and generally reflect regions of remaining seasonal snowpack (cf. Figure 8b). Little
difference appears between the 25th and 33rd percentiles (Figure 8g,h). All but the smallest
negative anomalies appear when using the 80% of average threshold (Figure 8i).
Figure 7. Percent seasonal snow aggregated to HUC-8 watersheds across the western U.S., defined using the snow seasonality metric,
for: (a) “Expected” seasonal snowpacks (defined as more than 28 of 36 years (78%) satisfying a seasonal snowpack) and (b) “Worst In
Record”, or the fewest seasonal snowpack cells in a watershed (cf. Figure 2c). Only grid cells receiving snow (seasonal or ephemeral)
were considered. (c) Percent decrease in seasonal snow proportion for the “Worst In Record” years versus the “Expected” conditions.
Watersheds with less than 5% (5–10%) seasonal snow experienced 100% losses in the worst years and are shown as light purple (purple)
to reduce visual impact. (d) Decrease in water stored in seasonal snow (units of 100,000 ac/ f t) in “Worst In Record” years versus
“Expected” conditions.Hydrology 2021, 8, 32 13 of 19
Figure 8. Example application of snow seasonality metric (SSM) to a snow drought year in Oregon. (a) Median SSM across all years;
(b) SSM during water year (WY) 2015); (c) Cells that transitioned from seasonal to ephemeral in WY2015 are colored in tan; all other
cells that remained seasonal or did not change are colored in blue. Deviations in peak WY2015 snow water equivalent (SWE; in mm)
from all year median values for (d) All cell differences; (e) Only ephemeral cells; (f) Cells with less than 10th percentile of peak SWE;
(g) Cells with less than 25th percentile of peak SWE; (h) Cells with less than 33rd percentile of peak SWE; (i) Cells with less than 80% of
average peak SWE (subjective criteria used to define snow drought by [56]).
4. Discussion
The comparison of two methods to identify seasonal snowpacks highlights how the
50 cm depth criteria in the Sturm approach creates substantial differences in regions achiev-
ing a seasonal snowpack (2,651,936 km2 for the SSM versus 736,864 km2 for Sturm). The
continuously valued nature of the SSM approach compared to the binary classification of
the Sturm method yields a gradation of areas that display the potential to experience a
seasonal snowpack (Figure 2a) and demonstrates sensitivity to a wider range of expansions
and contractions of seasonal snowpacks (Figure 2c,e). The more restrictive Sturm approach
leads to the overlap fraction mirroring the Sturm distribution (Figure 3) in all but a few
locations. In the case of the SSM, relaxation of the depth criteria implies that the seasonal
term only refers to the duration of snow cover. The lack of a snow depth requirement
poses a limitation for applications where depth is important for ecosystem processes or
is critical to recreation. Snow of sufficient depth provides insulation from cold atmo-Hydrology 2021, 8, 32 14 of 19
spheric temperatures, allowing sub-nival animals and vegetation to live at the snow/soil
interface [59,60]. Sufficient snow depth also allows safe over-snow vehicle operation and
human-powered recreation [32], which are important revenue-generating components
of many rural economies [30,31] throughout the U.S. and other snowy regions world-
wide [33,34]. Further, shallow but persistent snowpacks are prone to temperature-gradient
metamorphism that promotes weakening of snowpack structure and increases avalanche
hazard upon further loading from additional snowfall [61]. Therefore, consideration of the
depth of snow, and how it varies across landscapes in time, is an important facet of many
regions to include when also considering the duration of snow cover (i.e., its seasonality).
A simple improvement to the SSM allowing it to capture the importance of snow depth
would be the development of locally-relevant depth (or density) thresholds, such as the 30
cm depth used to determine sufficient depth for safe over-snow vehicle travel [32], and
require this value to be met just as is required by the Sturm method. Threshold depth
values should be based on the application of interest, reflect local climate and adaptations
of plants and animals to historic snow depth, and include characteristic snow density for
each region. In the case of snowpack stability pertaining to avalanche hazard, variables
such as snow depth, snow density, and other factors pertaining to mass and energy fluxes
would need to be considered, and likely would require the integration of more complex,
physically-based snowpack modeling (e.g., [62].
Minimum values (Figure 2c,d and Figure 7b) highlight seasonal snowpack “refugia”
in years experiencing low snowfall or frequent melt events due to anomalous weather
conditions such as rain-on-snow, high humidity and wind conditions, or radiation excesses
(e.g., downwelling longwave radiation from persistent cloud cover; [63]) that reduce areal
coverage of seasonal snowpacks. The HUC-8 results highlight how this reduction has the
potential to decrease the amount water stored in seasonal snowpacks (Figure 7b,c). While
the precise magnitudes of water volumes no longer stored in seasonal snowpacks reported
in Figure 7d should be interpreted with caution, this analysis suggests a non-negligible
volume of water is being discharged [18] and may not be captured for downstream use
(depending on factors such as infrastructure or reservoir operations). This previously
seasonal snow becomes available for evapotranspiration as it melts and contributes to
soil water [29]. The latter outcome reduces watershed runoff efficiency leading to lower
streamflow [64] and alters patterns of vegetation water use [21].
The Oregon case study demonstrates how warm snow drought produces an ups-
lope retraction of seasonal snowpacks in both maritime and intermountain mountains
(Figure 8b,c). In both seasonal classification schemes, high mountains in the western U.S.
(with the exception of Nevada and Arizona) appear more resilient to seasonal snowpack
losses. Regions like the Sierra Nevada of California may transition towards a less seasonal
and more ephemeral classification because a greater number of days may be classified as
ephemeral due to snowpack formation and subsequent melting, especially at lower eleva-
tions. This offers a possible explanation for the greater contraction of seasonal snowpacks
using the SSM approach versus the Sturm approach (Figure 2b,c), as certain areas become
more dominated by ephemeral snow characteristics.
Seasonal snowpacks are notably absent along the lee (eastern side) of the Rocky
Mountains in the High Plains along a northwest-southeast transect from central Montana
to western Nebraska (Figure 4a). One explanation for this may be mid-winter snow ablation
events caused by dry downslope Chinook (’snow-eater’) winds that warm adiabatically
and favor snowpack reduction via melting and sublimation [65,66], which may further be
accelerated by snow-albedo and other feedback mechanisms [67,68]. The leeside of the
Rocky Mountains frequently experience winter and spring downslope Chinook winds [69].
The results from the snow seasonality calculations suggest the eastward extent of their
influence spans beyond the immediate lee of the Rockies into the Dakotas and northern
Nebraska (Figure 4a). This indicates a widespread climatological influence of Chinook
winds on snow seasonality in this region.Hydrology 2021, 8, 32 15 of 19
Intercomparisons of snow seasonality with additional snow reanalysis [41,46] or
model products [46,47,49], and/or remotely-sensed data [14,70] are reasonable next steps.
A comparison using both satellite data and ground-based observations could also be used
to further validate the UAswe snow depth product in forested or topographically complex
terrain, where measurements of snow cover are challenging [10,71]. To further this valida-
tion across a range of snow-covered environments, citizen science observations of snow
depth, such as the Community Snow Observations effort [72] could be leveraged. Compar-
isons against global monthly snow products such as TerraClimate [69] may be applicable if
assumptions are made such as increasing the duration requirement to three months and
including a depth requirement during the peak month. Further disentangling changes
in snow cover duration and depth during transitional years will provide insight into the
role of various dynamic physical processes such as wind redistribution and scour, ablation
through energy fluxes such as sublimation and melting, and changes in accumulation
(e.g., rain-on-snow), and static controls including topography and elevation [9]. Physically-
based models, such as the Snow Data Assimilation System [47] or SnowModel [7] offer
valuable tools to estimate the relative roles of these mechanisms in ephemeral snowpacks or
weakly seasonal snowpacks (e.g., [9]) to further identify and prioritize areas of interest for
further study. The continuous and daily data availability of UAswe facilitates anomalous
accumulation or ablation events to be identified in data sparse regions for further modeling
or meteorological analysis of synoptic mechanisms [14].
Loss of seasonal snowpacks, whether achieved through permanent disappearance
or reduced frequency of occurrence will have implications for all aspects of their local
and downstream environment. These losses may not require substantial changes in SWE
(Figure 8e). Overall, the implied increase in ephemerality, which corresponds to a decrease
in water stored in seasonal snow (Figure 7d), reduces the predictability of snowmelt, runoff,
and soil moisture and groundwater recharge [9]. Improved evaluation of the physical
processes at work and their roles in driving change will add clarity to the ecohydrological
and economic impacts in regions undergoing shifts towards more ephemeral snow. Overall,
these changes will decrease water availability [73] and reduce drought predictability [22].
In watersheds with a transitional climate where both rain and snow occur, this shift leads
to water being managed as a hazard rather than a resource to reduce flood risks [23]. As
snowpacks shift towards more ephemeral and seasonal snow cover duration declines [70],
later warm season ecosystem stress increases as less soil water is available to plants [9] and
aquatic systems [20]. Throughout the warm season, this contributes to earlier drying of finer
fuels like grasses or shrubs [74] that influence wildfire connectivity across landscapes [75]
and long-term drying and drought stress of timber, increasing wildfire potential [28].
Finally, winter recreation opportunities will decline in areas currently near the periphery
of historically seasonal snowpacks [30] as these areas have less reliable snow upon which
to recreate.
All of these outcomes will require local and regional management shifts to ensure
negative economic and ecosystem impacts are minimized while still aiming to achieve
long-term management goals. Possible adaptations might include broadening the portfolio
of recreation opportunities (e.g., expanding trail networks), utilizing available, but often
costly adaptive capacities (e.g., snow-making; [34]), implementing restoration projects with
techniques to induce drought-tolerance in native plants [76], exploration of alternative
water management strategies [77], and changes in reservoir operations [78]. This analysis
demonstrated a substantial fraction of the western U.S., Upper Midwest, and Northeastern
U.S. is susceptible to shifting from a seasonal to an ephemeral snowpack (cf. Figure 2a,c and
Figure 7a,b). The western and southern portions of the Oregon Cascades (Figure 8e) provide
one example during a warm snow drought season [57]. Identifying the most vulnerable of
these regions, i.e., those with at-risk socioeconomic assets or ecosystems, at the regional or
watershed level (e.g., Figure 7d) to further examine drivers of snowpack seasonality change
is recommended.Hydrology 2021, 8, 32 16 of 19
5. Conclusions
A spatially distributed snowpack reanalysis product was used to classify seasonal and
ephemeral snowpacks throughout the conterminous U.S. Two methods, one developed
by Sturm et al. [13] and one introduced by Petersky and Harpold [9] were utilized to
identify seasonal snowpacks. The second method estimates snow seasonality using the
calculation of a snow seasonality metric (SSM). The SSM is continuously valued, sensitive
to interannual variability in snow cover, and is able to identify ephemeral snowpack
presence. The sensitivity of the SSM results from a lack of a depth constraint and its ability
to quantify seasonal and ephemeral snow cover duration. By including a locally-relevant
depth constraint, the SSM could offer a metric to identify and assess transitions from
seasonal snow to ephemeral snow that builds on the well-established Sturm method.
Both techniques showed seasonal snowpacks being most common in the mountainous
western U.S. and in the high latitudes of the Midwestern and Northeastern U.S. Seasonal
snowpacks are increasingly limited to higher elevations with decreasing latitude. Many
locations with normally occurring seasonal snowpacks can also have years characterized
by ephemeral snow. During these minimal snowpack years, seasonal snowpack reten-
tion occurs largely in the highest elevations of the Cascades and Rocky Mountains or in
scattered high latitude areas in the Upper Midwest and Northeastern U.S. The retraction
of seasonal snowpack area corresponds to non-negligible decreases in water stored in
seasonal snow that is made available for earlier runoff or evapotranspiration. A key benefit
of the SSM method is its ability to identify ephemeral snowpacks and variability in the
frequency of seasonal snowpacks. Ephemeral snowpacks can form throughout much of the
U.S. north of approximately 31◦ N. In the western U.S., ephemeral snowpacks bounded
seasonal snowpacks in lower elevation terrain, whereas east of the Rocky Mountains
ephemeral snowpacks increased in frequency with increasing latitude until approximately
37◦ N before declining in frequency as seasonal snowpacks became more common. The
transition from seasonal to ephemeral snowpacks was highlighted by a case study during
the warm snow drought of water year 2015 in Oregon. This case study indicated negative
snowpack anomalies on the order of 50–100 mm of snow water equivalent were present in
transitioning regions.
I recommend that future efforts compare climatological snow seasonality across varied
snowpack reanalyses, examine sensitivities based upon varied depth thresholds (e.g.,
30 cm depth for over-snow vehicle travel), and assess future transitions from seasonal
to ephemeral snow using climate projections from regional models. I also recommend
the development of locally-relevant depth thresholds to increase the ability of the SSM
approach to identify locations of meaningful seasonal snowpacks. Depending on data
availability, regional weather or climate model output and/or physically-based snowpack
models should be used to assess the roles of various physical processes in driving transitions
and to identify thresholds where shifts in snowpack classifications occur.
Funding: This research was funded by faculty start-up funds at the Desert Research Institute.
Institutional Review Board Statement: Not applicable.
Informed Consent Statement: Not applicable.
Data Availability Statement: The UAswe product is available from the National Snow and Ice Data
Center Distributed Active Archive Center. Please see: Broxton, P., X. Zeng, and N. Dawson. 2019.
Daily 4 km Gridded SWE and Snow Depth from Assimilated In-Situ and Modeled Data over the
Conterminous US, Version 1. [1982–2017]. Boulder, Colorado USA. NASA National Snow and Ice
Data Center Distributed Active Archive Center. doi: https://doi.org/10.5067/0GGPB220EX6A.
(accessed on 20 April 2020).
Acknowledgments: I thank Alan Rhoades, Erica Siirila-Woodburn, and Ty Brandt for helpful con-
versations. Four anonymous reviewers are thanked for their constructive input and encouragement
regarding the manuscript. All errors and omissions are my own.Hydrology 2021, 8, 32 17 of 19
Conflicts of Interest: The authors declare no conflict of interest. The funders had no role in the design
of the study; in the collection, analyses, or interpretation of data; in the writing of the manuscript, or
in the decision to publish the results.
Abbreviations
The following abbreviations are used in this manuscript:
UAswe University of Arizona Snow Product
SNOTEL Snow Telemetry Network
SSM Snowpack Seasonality Metric
SWE Snow Water Equivalent
U.S. United States
References
1. Robinson, D.A.; Dewey, K.F.; Heim, R.R., Jr. Global Snow Cover Monitoring: An Update. Bull. Am. Meteorol. Soc. 1993,
74, 1689–1696. [CrossRef]
2. Robinson, D.A.; Frei, A. Seasonal Variability of Northern Hemisphere Snow Extent Using Visible Satellite Data. Prof. Geographer
2000, 52, 307–315. [CrossRef]
3. Bormann, K.J.; Brown, R.D.; Derksen, C.; Painter, T.H. Estimating snow-cover trends from space. Nature Clim. Change 2018,
8, 924–928. [CrossRef]
4. Huss, M.; Bookhagen, B.; Huggel, C.; Jacobsen, D.; Bradley, R.; Clague, J.; Vuille, M.; Buytaert, W.; Cayan, D.; Greenwood, G.; et al.
Toward mountains without permanent snow and ice. Earth’s Future 2017, 5, 418–435. doi:10.1002/2016EF000514. [CrossRef]
5. Sturm, M.; Goldstein, M.A.; Parr, C. Water and life from snow: A trillion dollar science question. Water Resour. Res. 2017,
53, 3534–3544. doi:10.1002/2017WR020840. [CrossRef]
6. Immerzeel, W.W.; Lutz, A.F.; Andrade, M.; Bahl, A.; Biemans, H.; Bolch, T.; Hyde, S.; Brumby, S.; Davies, B.J.; Elmore, A.C.; et al.
Importance and vulnerability of the world’s water towers. Nature 2020, 577, 364–369. [CrossRef] [PubMed]
7. Liston, G.E.; Elder, K. A Distributed Snow-Evolution Modeling System (SnowModel). J. Hydrometeorol. 2006, 7, 1259–1276.
[CrossRef]
8. Mott, R.; Vionnet, V.; Grünewald, T. The Seasonal Snow Cover Dynamics: Review on Wind-Driven Coupling Processes. Front.
Earth Sci. 2018, 6, 197. [CrossRef]
9. Petersky, R.; Harpold, A. Now you see it, now you don’t: A case study of ephemeral snowpacks and soil moisture response in
the Great Basin, USA. Hydrol. Earth Syst. Sci. 2018, 22, 4891–4906. [CrossRef]
10. Rittger, K.; Raleigh, M.S.; Dozier, J.; Hill, A.F.; Lutz, J.A.; Painter, T.H. Canopy Adjustment and Improved Cloud Detection for
Remotely Sensed Snow Cover Mapping. Water Resour. Res. 2020, 56, e2019WR024914. doi:10.1029/2019WR024914. [CrossRef]
11. Grünewald, T.; Bühler, Y.; Lehning, M. Elevation dependency of mountain snow depth. Cryosphere 2014, 8, 2381–2394. [CrossRef]
12. Painter, T.H.; Berisford, D.F.; Boardman, J.W.; Bormann, K.J.; Deems, J.S.; Gehrke, F.; Hedrick, A.; Joyce, M.; Laidlaw, R.; Marks,
D.; et al. The Airborne Snow Observatory: Fusion of scanning lidar, imaging spectrometer, and physically-based modeling for
mapping snow water equivalent and snow albedo. Remote Sens. Environ. 2016, 184, 139 – 152. [CrossRef]
13. Sturm, M.; Holmgren, J.; Liston, G.E. A Seasonal Snow Cover Classification System for Local to Global Applications. J. Clim.
1995, 8, 1261–1283. [CrossRef]
14. Sugg, J.W.; Fuhrmann, C.M.; Perry, L.B.; Hall, D.K.; II, C.E.K. Sub-regional snow cover distribution across the southern
Appalachian Mountains. Phys. Geog. 2017, 38, 105–123. [CrossRef]
15. Formozov, A.N. Snow cover as an integral factor of the environment and its importance in the ecology of mammals and birds.
Mater. Fauna Flora USSR. New Ser. Zool. 1946, 5, 1–152.
16. Roch, A. Report on snow and avalanche conditions in the U.S.A. western ski resorts from January 1st to April 24th 1949. Federal
Inst. Res. Snow Avalanches–Weissfluhjoch-Davos 1949, 98, 1–39.
17. Armstrong, R.L.; Armstrong, B.R. Snow and avalanche climates of the western United States: A comparison of maritime,
intermountain, and continental conditions. Proc. Davos Symp. Avalanche Form. Movement Eff. 1987, 162, 218–294.
18. Jefferson, A.J. Seasonal versus transient snow and the elevation dependence of climate sensitivity in maritime mountainous
regions. Geophys. Res. Lett. 2011, 38. [CrossRef]
19. Nolin, A.W.; Daly, C. Mapping “At Risk” Snow in the Pacific Northwest. J. Hydrometeorol. 2006, 7, 1164–1171. [CrossRef]
20. Leibowitz, S.G.; Comeleo, R.L.; Wigington, P.J., Jr.; Weaver, C.P.; Morefield, P.E.; Sproles, E.A.; Ebersole, J.L. Hydrologic landscape
classification evaluates streamflow vulnerability to climate change in Oregon, USA. Hydrol. Earth Syst. Sci. 2014, 18, 3367–3392.
[CrossRef]
21. Petersky, R.S.; Shoemaker, K.T.; Weisberg, P.J.; Harpold, A.A. The sensitivity of snow ephemerality to warming climate across an
arid to montane vegetation gradient. Ecohydrology 2019, 12, e2060. [CrossRef]
22. Livneh, B.; Badger, A.M. Drought less predictable under declining future snowpack. Nat. Clim. Chang. 2020, 10, 452–458.
[CrossRef]Hydrology 2021, 8, 32 18 of 19
23. Hamlet, A.F.; Lettenmaier, D.P. Effects of 20th century warming and climate variability on flood risk in the western U.S. Water
Resour. Res. 2007, 43. [CrossRef]
24. Hatchett, B.J.; Daudert, B.; Garner, C.B.; Oakley, N.S.; Putnam, A.E.; White, A.B. Winter Snow Level Rise in the Northern Sierra
Nevada from 2008 to 2017. Water 2017, 9, 899. [CrossRef]
25. Lynn, E.; Cuthbertson, A.; He, M.; Vasquez, J.P.; Anderson, M.; Abatzoglou, J.T.; Hatchett, B.J. Technical note: Precipitation-phase
partitioning at landscape scales to regional scales. Hydrobiol. Eartg Stst. Sci. 2020. [CrossRef]
26. Viviroli, D.; Dürr, H.H.; Messerli, B.; Meybeck, M.; Weingartner, R. Mountains of the world, water towers for humanity: Typology,
mapping, and global significance. Water Resour. Res. 2007, 43. [CrossRef]
27. McNamara, J.P.; Chandler, D.; Seyfried, M.; Achet, S. Soil moisture states, lateral flow, and streamflow generation in a semi-arid,
snowmelt-driven catchment. Hydrolog. Process. 2005, 19, 4023–4038. [CrossRef]
28. Westerling, A.L.; Hidalgo, H.G.; Cayan, D.R.; Swetnam, T.W. Warming and Earlier Spring Increase Western U.S. Forest Wildfire
Activity. Science 2006, 313, 940–943. [CrossRef]
29. Harpold, A.A.; Molotch, N.P. Sensitivity of soil water availability to changing snowmelt timing in the western U.S. Geophys. Res.
Lett. 2015, 42, 8011–8020. [CrossRef]
30. Hagenstad, M.; Burakowski, E.; Hill, R. The economic contributions of winter sports in a changing climate. Technical Report
2018. Available online: https://protectourwinters.org/wp-content/uploads/2020/01/strat_doc_v8_EU.pdf (accessed on 16
February 2021).
31. Crowley, N.; Doolittle, C.; King, J.; Mace, R.; Seifer, J. Drought and Outdoor Recreation: Impacts, Adaptation Strategies, and Information
Gaps in the Intermountain West; National Integrated Drought Information System: Boulder, CO, USA, 2019.
32. Hatchett, B.J.; Eisen, H.G. Brief Communication: Early season snowpack loss and implications for oversnow vehicle recreation
travel planning. Cryosphere 2019, 13, 21–28. [CrossRef]
33. Scott, D., Global Environmental Change and Mountain Tourism. In Tourism and Global Environmental Change; Gössling, S., Hall,
C.M., Eds.; Routledge: London, UK, 2006; Chapter 3, pp. 54–75. [CrossRef]
34. Scott, D.; Steiger, R.; Knowles, N.; Fang, Y. Regional ski tourism risk to climate change: An inter-comparison of Eastern Canada
and US Northeast markets. J. Sustain. Tour. 2020, 28, 568–586. [CrossRef]
35. Lund, J.; Medellin-Azuara, J.; Durand, J.; Stone, K. Lessons from California’s 2013–2016 Drought. J. Water Resour. Plann. Manag.
2018, 144, 04018067. [CrossRef]
36. Harr, R.D. Effects of Clearcutting on Rain-on-Snow Runoff in Western Oregon: A New Look at Old Studies. Water Resour. Res.
1986, 22, 1095–1100. [CrossRef]
37. Dozier, J. Mountain hydrology, snow color, and the fourth paradigm. Eos, Trans. Am. Geophys. Union 2011, 92, 373–374. [CrossRef]
38. Bernier, M.; Fortin, J.. The potential of times series of C-Band SAR data to monitor dry and shallow snow cover. IEEE Trans.
Geosci. Remote Sens. 1998, 36, 226–243. [CrossRef]
39. Hall, D.K.; Kelly, R.E.J.; Riggs, G.A.; Chang, A.T.C.; Foster, J.L. Assessment of the relative accuracy of hemispheric-scale
snow-cover maps. Ann. Glaciol. 2002, 34, 24–30. [CrossRef]
40. Kelly, R.E.; Chang, A.T.; Tsang, L.; Foster, J.L. A prototype AMSR-E global snow area and snow depth algorithm. IEEE Trans.
Geosci. Remote Sens. 2003, 41, 230–242. [CrossRef]
41. Margulis, S.A.; Cortés, G.; Girotto, M.; Durand, M. A Landsat-Era Sierra Nevada Snow Reanalysis (1985–2015). J. Hydrometeorology
2016, 17, 1203–1221. [CrossRef]
42. Muhuri, A.; Manickam, S.; Bhattacharya, A.; Snehmani. Snow Cover Mapping Using Polarization Fraction Variation With
Temporal RADARSAT-2 C-Band Full-Polarimetric SAR Data Over the Indian Himalayas. IEEE J. Sel. Top. Appl. Earth Obs. Remote
Sens. 2018, 11, 2192–2209. [CrossRef]
43. Gascoin, S.; Grizonnet, M.; Bouchet, M.; Salgues, G.; Hagolle, O. Theia Snow collection: High-resolution operational snow cover
maps from Sentinel-2 and Landsat-8 data. Earth Syst. Sci. Data 2019, 11, 493–514. [CrossRef]
44. Broxton, P.D.; Dawson, N.; Zeng, X. Linking snowfall and snow accumulation to generate spatial maps of SWE and snow depth.
Earth Space Sci. 2016, 3, 246–256. [CrossRef]
45. Zeng, X.; Broxton, P.; Dawson, N. Snowpack Change From 1982 to 2016 Over Conterminous United States. Geophys. Res. Lett.
2018, 45, 12940–12947. [CrossRef]
46. Livneh, B.; Bohn, T.J.; Pierce, D.W.; Munoz-Arriola, F.; Nijssen, B.; Vose, R.; Cayan, D.R.; Brekke, L. A spatially comprehensive,
hydrometeorological data set for Mexico, the U.S., and Southern Canada 1950–2013. Sci. Data 2015, 2, 150042. [CrossRef]
47. Barrett, A.P. National Operational Hydrologic Remote Sensing Center SNOw Data Assimilation System (SNODAS) Products at
NSIDC. In Special Report of National Snow and Ice Data Center (NSIDC); National Snow and Ice Data Center (NSIDC): Boulder, CO,
USA, 2003; Volume 11.
48. Abatzoglou, J.T.; Dobrowski, S.Z.; Parks, S.A.; Hegewisch, K.C. TerraClimate, a high-resolution global dataset of monthly climate
and climatic water balance from 1958–2015. Sci. Data 2018, 5, 170191. [CrossRef] [PubMed]
49. Wrzesien, M.L.; Pavelsky, T.M.; Durand, M.T.; Dozier, J.; Lundquist, J.D. Characterizing Biases in Mountain Snow Accumulation
From Global Data Sets. Water Resour. Res. 2019, 55, 9873–9891. [CrossRef]
50. Daly, C.; Halbleib, M.; Smith, J.I.; Gibson, W.P.; Doggett, M.K.; Taylor, G.H.; Curtis, J.; Pasteris, P.P. Physiographically sensitive
mapping of climatological temperature and precipitation across the conterminous United States. Int. J. Climatol. 2008, 28, 2031–
2064. [CrossRef]You can also read