Metabolomic Insights into Marine Phytoplankton Diversity - MDPI
←
→
Page content transcription
If your browser does not render page correctly, please read the page content below
marine drugs
Article
Metabolomic Insights into Marine
Phytoplankton Diversity
Rémy Marcellin-Gros 1,2 , Gwenaël Piganeau 2, * and Didier Stien 1, *
 1   Sorbonne Université, CNRS, Laboratoire de Biodiversité et Biotechnologie Microbiennes, LBBM,
     Observatoire Océanologique, 66650 Banyuls-sur-Mer, France; marcellin-gros@obs-banyuls.fr
 2   Sorbonne Université, CNRS, Biologie Intégrative des Organismes Marins, BIOM, Observatoire
     Océanologique, 66650 Banyuls-sur-Mer, France
 *   Correspondence: gwenael.piganeau@obs-banyuls.fr (G.P.); didier.stien@cnrs.fr (D.S.);
     Tel.: +33-468887343 (G.P.); +33-430192476 (D.S.)

 Received: 30 November 2019; Accepted: 22 January 2020; Published: 25 January 2020

 Abstract: The democratization of sequencing technologies fostered a leap in our knowledge of the
 diversity of marine phytoplanktonic microalgae, revealing many previously unknown species and
 lineages. The evolutionary history of the diversification of microalgae can be inferred from the
 analysis of their genome sequences. However, the link between the DNA sequence and the associated
 phenotype is notoriously difficult to assess, all the more so for marine phytoplanktonic microalgae
 for which the lab culture and, thus, biological experimentation is very tedious. Here, we explore the
 potential of a high-throughput untargeted metabolomic approach to explore the phenotypic–genotypic
 gap in 12 marine microalgae encompassing 1.2 billion years of evolution. We identified species-
 and lineage-specific metabolites. We also provide evidence of a very good correlation between the
 molecular divergence, inferred from the DNA sequences, and the metabolomic divergence, inferred
 from the complete metabolomic profiles. These results provide novel insights into the potential
 of chemotaxonomy in marine phytoplankton and support the hypothesis of a metabolomic clock,
 suggesting that DNA and metabolomic profiles co-evolve.

 Keywords: chemotaxonomy; phylogeny; mamiellales; galactolipids; betaine lipids; xanthophylls

1. Introduction
     Phytoplanktonic eukaryotes are phylogenetically highly diverse, as they have many representatives
in most super-groups of the eukaryotic tree of life [1,2]. The Archaeplastida super-group, or green
lineage [3], includes all of the species that have descended from a primary endosymbiosis event,
when an ancestral eukaryotic cell engulfed a photosynthetic prokaryote, that eventually evolved into
an organelle, the chloroplast [4]. Our knowledge on the diversity of phytoplanktonic green microalgae
has greatly increased with the democratization of DNA sequencing and genomics, but it is likely to
stay behind that of their terrestrial relatives, including land plants, whose estimated species number
exceeds 400,000 [5]. This is not surprising since unicellular organisms are generally less studied than
multicellular organisms, and because bona fide species identification relies on tedious sampling and
isolation steps which have yet to be performed for many marine microalgae. Recently, DNA sequencing
of numerous environmental marine water sample extracts collected worldwide during the Ocean
Sampling Day initiative provided evidence that many of the sequences detected belong to species
from the green lineage that have no representative strains in culture [6]. This study also demonstrated
the very broad geographic distribution of species from the class Mamiellophyceae, that dominates
the picoeukaryotic fraction (cell diameter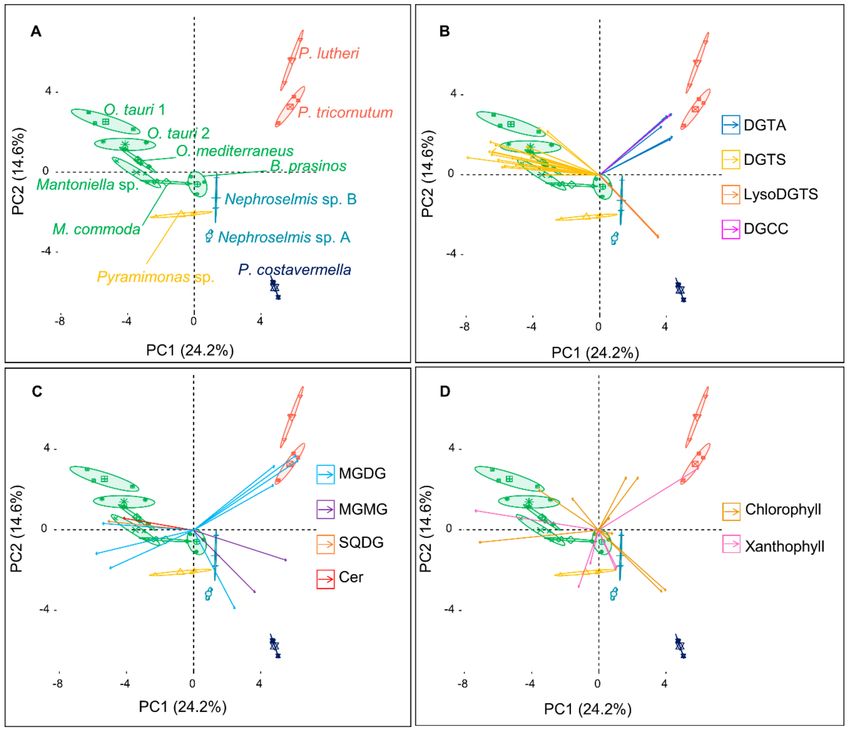
Mar. Drugs 2020, 18, 78                                                                               2 of 15

eukaryotic cells [8] displaying a simple cellular organization (one mitochondrion and one chloroplast)
and high surface–volume ratio, which is likely to confer advantages in nutrient-poor environments [9].
The Mamiellophyceae lineage is ancient, probably over 350 million years old [10], and currently
comprises 22 described species [11]. Species from the three genera Bathycoccus, Micromonas, and
Ostreococcus are particularly prevalent in the marine environment [6].
      Historically, analysis of pigment composition has been used to assist the classification of microalgae.
Indeed, Bathycoccus, Micromonas, and Ostreococcus species were found to contain characteristic pigments
of many marine green microalgae, prasinoxanthin [12], but also specific pigments such as uriolide,
micromonal, and dihydrolutein [13], which were not detected in other species outside the Mamiellales.
      The advent of metabolomics now enables the metabolic signatures of microalgae to be explored at
an unprecedented level of resolution [14]. These novel approaches have led to the discovery of new
metabolites, fostered by the search for natural bioactive compounds with applications in agronomic,
medical, or biofuel research. Indeed, polyunsaturated fatty acids (PUFA) are lipids with high nutritional
value [15] and may have applications in the prevention of several pathologies, such as cancers or
cardiovascular diseases [16,17]. Furthermore, the anti-inflammatory and antiviral properties of polar
lipids have also been highlighted recently [18,19].
      Here, we explored the potential of an untargeted metabolomic approach including pigments, lipids,
and other uncharacterized metabolites to investigate chemotaxonomic markers in 12 marine microalgal
strains from 11 species, including 9 microalgae from the green lineage; the Mamiellales Ostreococcus
tauri [20], O. mediterraneus [21], Bathycoccus prasinos [22], Micromonas commoda [23], and Mantoniella
sp., the Chlorellales Picochlorum costavermella [24], and strains from basal groups Nephroselmis sp. and
Pyramimonas sp. To broaden the phylogenetic diversity of the dataset, two additional marine microalgae
outside the green lineage were included: Phaeodactylum tricornutum (Stramenopile lineage) and Pavlova
lutheri (Haptophyta lineage). We assess whether total metabolomic profiling enables us to delineate
well-defined species, and we characterize the 10 major compounds of each species. Last but not least,
we assess whether distances between metabolomic profiles, integrating both the composition and the
frequency of each compound, reflect phylogenetic distances between species. This leads us to discuss
the hypothesis of a metabolomic corollary of the molecular clock, a central tenet of molecular evolution.

2. Results

2.1. An Untargeted Holistic Analysis of Metabolomic Profiles
     To investigate metabolome diversity in 12 divergent algae, an untargeted holistic approach was
chosen to cover a broad range of metabolites, such as lipids or pigments known as algal biomarkers.
Algal ethyl acetate extracts were analyzed by UHPLC-ESI+ -HRMS2 , and acquired ion chromatograms
were processed through an untargeted metabolomic workflow in Compound Discoverer 2.1 software
(Thermo Scientific) to generate extracted ion chromatograms across samples, detect and quantify
corresponding metabolites, and generate the observations/variables matrix used for further statistical
analyses. As a first observation, 2565 ions were detected across all samples, and 1143 ions were unique
features detected in only one species. Moreover, detected features ranged from 867 ions in O. tauri
sp. 1 to 241 ions in Pyramimonas sp. 1422 ions are shared between at least two species (Figure S1).
These observations suggest high variation in the diversity of produced metabolites. To display this
variation, an initial principal component analysis (PCA) was conducted on the observations/variables
matrix to compare metabolomic profiles between strains at the global metabolome scale (Figure 1).
Principal Components (PCs) 1 and 2 describe 34.8% of the variation, and the first PC separates
Mamiellales from the two microalgae P. lutheri (Haptophyta lineage) and P. tricornutum (Stramenopile
lineage), hereafter considered outlier microalgae as they are not part of the green lineage. The second
PC separates Ostreococcus species from other Chlorophytes (Nephroselmis, Pyramimonas). Interestingly,
intraspecific metabolome diversity seems minimal as compared to within-replicate variation, as the
two O. tauri strains’ PCA confidence ellipses overlap.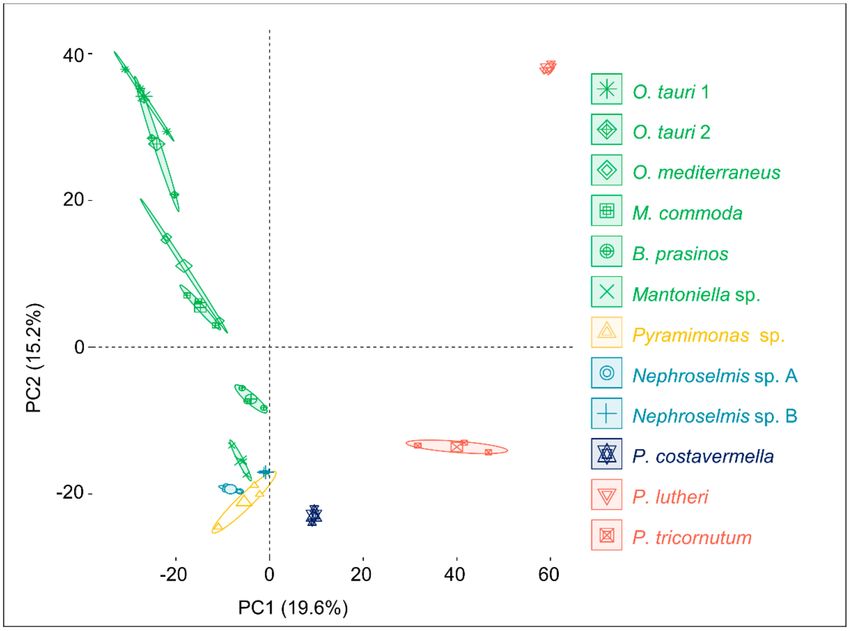
Mar. Drugs 2020, 18, 78                                                                              3 of 15

      Figure 1. Principal Component Analysis of the whole metabolome of 12 marine microalgae. For each
      species and strain, confidence ellipses cover 95% of group position estimation.

2.2. Identification of the Major Metabolites and Detection of Chemotaxonomic Markers
     In order to go further into the comparative metabolic profiling of the 12 strains, the 10 major
metabolites of each strain, defined as the 10 highest peak areas of the extracted ion chromatograms
(XIC), were identified (Figure 2). Identification was carried out by comparing compound raw formulas
(calculated on the basis of high-resolution mass spectrometry) to databases (Dictionary of Marine
Natural Products and SciFinder) to retrieve candidate compounds, then MS2 spectra were submitted
to databases for comparison (Global Natural Products Social Molecular Networking—GNPS [25])
or elucidated to infer putative structures. Compounds were classified into 10 different groups of
polar lipids and pigments. Among the polar galactolipids, eight were monogalactosyl diacylglycerols
(MGDGs) (Figure S2), two were monogalactosyl monoacylglycerols (MGMGs or Lyso-MGDGs),
and one was a sulfoquinovosyl diacylglycerol (SQDG) (Figures S4 and S5).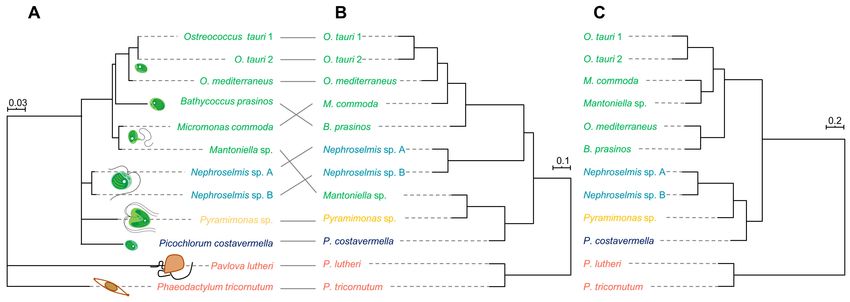
Mar. Drugs 2020, 18, 78 4 of 15
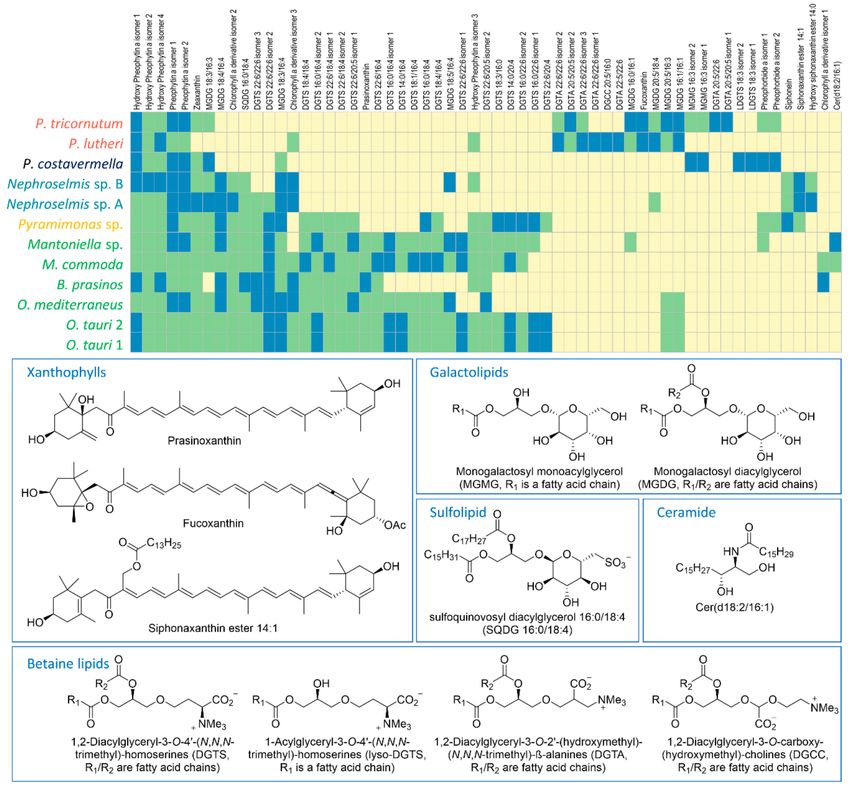
Figure 2. Matrix of the top 10 (blue), detected (green), and not detected (yellow) metabolites, and structure
examples of the 59 most abundant compounds over the 12 microalgal strains. For all compounds,
identifications are based on (1) molecular formulas, (2) automatic assignment via Global Natural Products
Social Molecular Networking (GNPS), (3) interpretation of MS2 spectra and comparison with published
data, and (4) phylogeny.
For MGDGs and SQDGs, the regiochemical assignment (sn-1 and sn-2 positions) of both fatty acid
(FA) chains was done by comparing the MS2 fragmentation patterns. The fragment resulting from sn-1
FA loss ([M+X-R1 CO2 H]+ ) exhibits a higher peak intensity than the one resulting from sn-2 FA loss
([M+X-R2 CO2 H]+ ) for the protonated adduct (X = H) of SQDGs [26] and sodiated adduct (X = Na) of
MGDGs [27]. Besides this, it has been established in the literature that the sugar moiety is a galactose
for glycolipids and a sulfoquinovose for SQDG [28]. The betaine lipids are the most represented
and diversified group with twenty 1,2-diacylglyceryl-3-O-40 -(N,N,N-trimethyl)-homoserines (DGTSs)
(Figures S6 and S7), seven 1,2-diacylglyceryl-3-O-20 -(hydroxymethyl)-(N,N,N-trimethyl)-ß-alanines
(DGTAs), two 1-acylglyceryl-3-O-40 -(N,N,N-trimethyl)-homoserines (lyso-DGTSs), and one
1,2-diacylglyceryl-3-O-carboxy-(hydroxymethyl)-choline (DGCC) (Figure S8). Regiochemical
assignment of FAs was done as for galactolipids on the basis of MS2 spectra. Here, the collision-induced
[M + Na-R2 CO2 H]+ fragment of sodiated adducts produced a higher peak than the [M+Na-R1 CO2 H]+
fragment [29]. Distinction of the isomeric DGTA and DGTS betaine lipids was performed on the
basis of strain phylogeny in case of coelution. The fragmentation pattern commonly described for
these lipids includes the characteristic 59 Da neutral loss corresponding to the loss of trimethyl amine
(NMe3 ) and the 87 Da neutral loss (CH3 -CH- -N+ Me3 ) for DGTSs as a consequence of fragmentationMar. Drugs 2020, 18, 78 5 of 15
after transposition of the carboxyl group [30]. Unfortunately, this fragmentation reaction was not
observed in our analyses. According to the literature, DGTAs are specific to brown algae (P. lutheri
and P. tricornutum) while DGTSs are produced by microalgae from the green lineage [28]. On the
pigment side, 11 chlorophylls (Figures S9–S23) and 6 xanthophylls (Figures S24–S30) appeared to
be largely shared among strains. In the xanthophyll series, one compound was identified as either
prasinoxanthin or its isomer violaxanthin. The uncertainty was eventually disentangled thanks to
the typical dehydration fragmentation pattern of prasinoxanthin (Figure S28), while an 80 Da neutral
loss was observed for the epoxycarotenoid violaxanthin (Figure S29) [31]. Fucoxanthin (Figure S30)
was unambiguously identified from specific fragments at m/z 109.1014, 581.3975, and 641.4207 in
MS2 [32]. Apart from the polar lipids and pigments, a ceramide non-hydroxy fatty acid sphingosine
(Cer) (Figure S31) was also identified.
The most abundant and diversified metabolites identified over the 12 strains were polar lipids
and pigments. These observations are consistent with an increasing number of studies concerning the
analysis of algal lipidomes [28,33] and provide new lipidome information for the strains Mantoniella
sp., Nephroselmis sp., and Pyramimonas sp. recently isolated from environmental samples. Further
phylogenetic signals of metabolites are given and discussed in the following section.
The 10 major metabolites of each microalga shown above were chosen to construct a new matrix
of compound abundance to perform a second PCA (Figure 3A). Remarkably, the variability explained
by the two PCs remained similar (38.8%), and so did the pattern of clustering of the different strains
as compared to the first PCA conducted on the whole metabolome analysis. The first PC again
discriminated the outlier microalgae P. lutheri and P. tricornutum from the Mamiellales, while PC2
separated P. costavermella from the brown algae, and the green microalgae fanned out along this axis.
The contribution of each major metabolite to a strain or group of algae can be inferred from the
biplot projection of the PCA (Figure 3B–D). The first PC separates the green microalgae from the
outlier brown ones, and as expected, this distinction is primarily due to the betaine lipids DGTAs and
DGTSs. The high chemical diversity of DGTSs is due to a greater variability in the acyl chain length
and number of unsaturations, while DGTAs hold only long (C20–C22) and highly unsaturated acyl
chains (Figure 2). MGDGs are represented in every species. MGDGs 18:3/16:4, 18:4/16:4, and 18:5/16:4
are only found in green microalgae. They predominate in the Mamiellales as previously described
by Degraeve-Guilbault et al. [34]. Major galactolipids of the brown algae P. tricornutum contain 16:0,
16:1, 16:3, and 20:5 fatty acid chains, which is also consistent with previous analyses, reinforcing the
reproducibility of these observations [29]. Interestingly, MGMGs are only detected in P. tricornutum
and P. costavermella. Usually, these lipids are not extensively studied in the literature and may be
associated with lipid remodeling or environmental plasticity [35]. Some strains can exhibit metabolites
exclusive to their group. DGCCs are present in P. lutheri but absent in P. tricornutum and may be a
biomarker of haptophytes [28,36]. This is largely described in the literature, but we also show here
that fucoxanthin occurs in the lineage containing P. lutheri and P. tricornutum. On the other hand, C14
esterified siphonaxanthin (Figures S25–S27) and siphonein (Figure S29) are specific to the Chlorophytes
Nephroselmis and Pyramimonas. In fact, these pigments are widely found in green algae, especially in
deep-water or shade species, as they improve the efficiency of light-harvesting complexes [37] or protect
the cells from high light damage. Moreover, prasinoxanthin (Figure S31) is the major xanthophyll that
identifies Mamiellales amongst other green algae [12].Mar. Drugs 2020, 18, 78 6 of 15
Figure 3. (A) Principal component analysis (PCA) constructed from the 59 most abundant metabolites
matrix over the 12 microalgal strains, and the corresponding biplots of the (B) betaine lipids, (C) galacto-,
sulfolipids, and ceramide, and (D) pigments (each arrow corresponds to a metabolite). Confidence
ellipses cover 95% of group position estimation. Arrow coordinates correspond to the contributions of
metabolites to the PC and color to the metabolite class. Arrows point toward the strains where they are
the most represented.
Beyond a simple identification of metabolite classes within microalgal species or lineages,
our results demonstrate that some specific metabolites within classes may serve as phylogenetic
markers, pending analysis of additional species identified in each group. Our analysis confirms that
prasinoxanthin is specific to the Mamiellales, but also that DGTS 22:6/16:4 is specific to microalgae from
this group. The number and diversity of DGTSs we found between Pyramimonas sp. and Mamiellales
is an outstanding observation, since these betaine lipids were not detected in Nephroselmis sp. or even
in B. prasinos or O. mediterraneus. Within the Mamiellales, the Ostreococcus genus differs by the presence
of two MGDGs (20:5/16:3 and 16:1/16:1). The species O. tauri has six DGTSs which are not found in O.
mediterraneus. Interestingly, the presence/absence matrix does not differentiate both O. tauri strains.
More data will be necessary to confirm these observations, but the “major metabolites approach” does
indeed appear to be interesting for differentiating between these microalgae at the species level.
The choice of taxonomic chemical biomarkers is always challenging as the diversity and abundance
of metabolites should reflect species divergence rather than intrinsic variability due to environmental
factors. To get around this, chemical classification of plants has been preferentially achieved by
comparison of secondary metabolites since these are remarkably diverse [38], include numerous classes
of compounds (glycosides, phenolics, or alkaloids) [39], and are relevant for species classification, as
they are restricted to taxonomically related groups of species [40,41]. Comparison of algae has so farMar. Drugs 2020, 18, 78 7 of 15
relied on pigment analysis using 44 pigment types spanning 27 classes of photosynthetic algae [42],
and these pigments are consistent with the endosymbiotic evolutionary history of eukaryotes [43].
More recently, many efforts in algal compound screening have enabled the description of hundreds
of new metabolites each year [44], which provide the opportunity to identify species from a broader
spectrum of compounds. Algal lipids have been extensively described in model species such as
Chlamydomonas reinhardtii, Chlorella sp., Nannochloropsis sp., or P. tricornutum [29,45–47], while complete
lipidome profiles have yet to be acquired for most algae. Nonetheless, lipids, especially FAs [48–50],
sterols [50], alkenones [51], or polar lipids [52,53], are widely used as species tracers. It is important
to keep in mind that lipid profiles may be impacted by environmental, biotic, or abiotic factors [54],
as demonstrated in many studies on nutrient availability, irradiance, and growth stage [29,34,55,56].
However, even though taxonomic signals may be diminished by external factors, it has been shown
that taxonomy accounts for 3 to 4 times more variance in the lipid profiles of phytoplankton than
abiotic factors [49]. Besides this, polar lipids, especially betaine lipids (DGTA/S, DGCC), constitute the
least impacted metabolite class by growth stage as demonstrated by Cañavate and colleagues, and they
are therefore considered reliable lipidic taxonomic markers [57]. The abundancy profiles of “major
metabolites” are consistent across experiments from available studies performed at the molecular
level [29,34,58], suggesting that they are relevant chemotaxonomic marker candidates.
2.3. Phylogenetic Analysis and Metabolome-Based Taxonomy
The phylogeny based on the partial analysis of the 18S rDNA subunit was consistent with previous
findings based on a larger set of sequence data [1,59] retracing the molecular divergence between
species and the different microalgal families (Figure 4A) and was therefore used as a reference for
comparison with the information from the metabolome of each microalga.
Figure 4. (A) Partial 18S ribosomal gene phylogeny based on 429 base pairs; scale indicates substitution
per site. (B) A hierarchical clustering dendrogram based on 3138 metabolites; the scale represents the
Spearman correlation coefficient between strains. (C) A hierarchical clustering dendrogram based on the
59 most abundant metabolites; the scale represents the Spearman correlation coefficient between strains.
First, hierarchical clustering analysis (HCA) was performed to determine the metabolomic
proximity between strains. The HCA dendrogram (Figure 4B) was generated by calculating the
distance matrix between strains based on the Spearman correlation coefficient and aggregated by
“complete linkage”. A clear clustering of Mamiellales species emerged from HCA, except for Mantoniella
sp., which exhibited a metabolomic profile more closely related to Pyramimonas sp. This peculiarity
disappears when the metabolome is reduced to the 10 major metabolites to build the chemotaxonomy
(Figure 4C). This suggests that major compounds tend to be reliable species biomarkers when comparing
divergent as well as closely related organisms. Microalgal cultures are very rarely axenic, since a
bacterial community often co-exists with microalgae [60]. Estimation of the proportion of bacteria by
cytometry revealed that most cultures contained less than 5% bacteria, while it turned out that bothMar. Drugs 2020, 18, 78 8 of 15
Mantoniella sp. and Pyramimonas sp. could not be cleansed of bacterial partners (microalgae/bacteria
~1:1). This may be a consequence of their mixotrophic regime [61,62]. The clustering of these strains
may thus be due to the metabolomic contribution of bacteria, either because of identical metabolites of
bacterial origin or through a similar microalgae–bacteria interaction process that may dramatically
influence the metabolome of the microalgal partner. However, we demonstrate here that algal
metabolites predominate in the total extract, so bacterial participation disappears when considering
the major metabolites only. Besides this, statistical comparison of genetic distances with metabolomic
distances based on whole-metabolome analysis amongst algae confirms a strong correlation between
both approaches (Mantel test: r = 0.77, p-value = 0.001). Thus, there is a good overlap of phylogenetic
and chemotaxonomic signals, as metabolomic distances reflect genetic distances between species.
This correlation is even stronger when estimated from the most abundant metabolites (Mantel test:
r = 0.90, p-value = 0.001), confirming the robustness and potential of the metabolomic approach to
discriminate and retrace the evolutionary history of divergent species.
Establishing the full lipidome profile of algae at the molecular level within and between species is
relevant for several reasons. First, it provides a fundamental description of the species at the metabolite
level and helps to estimate the chemical divergence between strains or species. Secondly, it can lead
to the identification of algal species producing interesting bioactive compounds, such as high-value
carotenoids and lipids, with agronomical and pharmaceutical applications. The present study
highlights the abundance of long-chain polyunsaturated FA, such as octadecapentaenoic acid (18:5n-3),
eicosapentaenoic acid (20:5n-3), or docosahexaenoic acid (22:6n-3), the health benefits of which have
been previously recognized [63], for example, in preventing cardiovascular or mental disorders [64–66].
Moreover, particularly abundant in Mamiellophyceae, polar lipids and especially MGDG 18:3/16:4
and MGDG 18:4/16:4 of Tetraselmis sp. have effective anti-inflammatory properties [67,68]. P. lutheri’s
major galactolipid MGDG 20:5/18:4 has also been shown to have anti-inflammatory activity [69],
inhibiting both human melanoma cell growth [70] and bacterial development [71]. Last but not
least, SQDGs are probably among the most promising compounds in the medical field as lipids
from this class are known to act on HIV infection [72], but also exhibit anti-HSV-1 and anti-HSV-2
activities [73] and anti-inflammatory [74] and antitumor properties [75]. The aforementioned bioactive
molecules are far from exhaustive but highlight the biotechnological potential of algae as producers of
bioactive molecules.
In conclusion, we investigated the metabolomes of 12 microalgal strains from 11 species and
characterized the major carotenoids and lipids. The approach of using major metabolites allows
microalgal species and lineages to be distinguished. Evolutionary divergence between species can be
inferred, in good congruence with the phylogenies obtained from sequence data obtained through
a classical molecular approach. Therefore, these results support the hypothesis of a metabolomics
equivalent to the “molecular clock” based on the analysis of sequence data. The resulting “metabolomics
clock” metaphor is also constrained by the technical challenges raised by the “molecular clock” inferred
from DNA sequence analysis: What are the mode and tempo of metabolome evolution? Are some
metabolites changing faster than others? What is the distribution of fitness effects of metabolite
changes? To answer these questions, statistical developments are needed to develop metabolomic
distances and larger datasets including additional species should be obtained to include a broader
variation in evolutionary distances.
3. Materials and Methods
3.1. Culture Conditions and Growth Measurement
Cultures were grown in modified Keller Artificial Seawater medium [76] (K-ASWO) containing
420 mM NaCl, 10 mM KCl, 20 mM MgCl2 , 10 mM CaCl2 , 25 mM MgSO4 , 2.5 mM NaHCO3 , 0.88 mM
NaNO3 , 5.0 × 10⁻⁵ M NH4 Cl, 1.0 × 10⁻⁵ M β-glycerophosphate, 1.0 × 10⁻⁸ M H2 SeO3 , 1 mL of 1 M
Tris-HCl (pH 7.2) per liter of medium, 3.7 × 10⁻¹⁰ M cyanocobalamin, 2.0 × 10⁻⁹ M biotin, and 3.0 × 10⁻⁷Mar. Drugs 2020, 18, 78 9 of 15
thiamine in addition to Keller trace metal solution [77]. Algal strains were cultured in T75 cell culture
flasks with ventilated caps (Sarstedt, Germany) containing 100 mL of K-ASWO medium. Each flask
was inoculated to a cell density of 1 × 10⁶ cells.mL-1 for O. tauri 1 (RCC 6850) and 2 (RCC 4221),
O. mediterraneus (RCC 2590), B. prasinos (RCC 4222), M. commoda (RCC 827), Mantoniella (RCC 6849),
P. costavermella (RCC 4223), P. tricornutum (RCC 6851), and P. lutheri (RCC 6852); 2.4 × 10⁵ cells.mL−1
for Nephroselmis sp. A (RCC 6846); 3.3 × 10⁵ cells.mL−1 for Nephroselmis sp. B (RCC 6847); and 7.8 × 10⁴
cells.mL−1 for Pyramimonas sp. (RCC 6848). Cultures were maintained at a temperature of 20 ◦ C under
continuous light of 100 µE.m-2 .s-1 and were agitated manually once a day; cell density was measured
every day by flow cytometry.
3.2. Microalgal Culture Axenization
All cultures were treated with antibiotics to lower the bacterial concentration. Quantities of
50 µg.mL−1 ampicillin (A9518, Sigma-Aldrich), 50 µg.mL−1 gentamycin (G1914, Sigma-Aldrich),
20 µg.mL−1 kanamycin (60615, Sigma-Aldrich), and 100 µg.mL−1 neomycin (N6386, Sigma-Aldrich)
were added to K-ASWO, and after two subculturing stages, the bacterial content was low enough
to perform metabolomic analysis in most strains. A single antibiotic treatment reduced the bacterial
contamination in Ostreococcus and P. lutheri cultures but was unable to remove bacteria completely
in others.
3.3. Flow Cytometry
Cells were fixed using glutaraldehyde (0.25% final concentration, G6257, Sigma-Aldrich) with the
addition of Pluronic F-68 (0.1% final concentration, P-7061, Sigma-Aldrich) for 15 min in the dark and
stained with SYBR Green I (LON50512, Ozyme) for another 15 min in the dark. Cell counting was
performed using a Beckman Coulter Cytoflex flow cytometer (laser excitation wavelength 488 nm) by
chlorophyll autofluorescence for microalgae (detection filter >620 nm) and by SYBR Green I fluorescence
for bacteria (detection bandwidth 525–540 nm, corresponding to the FITC (fluorescein isothiocyanate)
channel). Data were analyzed with CytExpert 2.2 software (Beckman Coulter).
3.4. Metabolite Extraction
Microalgal cells were collected three to four days post inoculation (Supplemental Figure S1)
by filtration of 100 mL of culture through a Whatman GF/F filter (Z242519, Sigma-Aldrich) under
reduced pressure (600 mbar). Then, filters were placed in disposable glass culture tubes with 7 mL
of ethyl acetate (16371, Sigma-Aldrich) to solubilize algae cells overnight in a C25 incubator shaker
(New Brunswick Scientific, 100 rpm, 19 ◦ C).
3.5. UHPLC-HRMS Analyses
Microalgal extracts were analyzed on an Ultimate 3000 UHPLC Dionex system coupled to an
Orbitrap MS/MS FT Q-Exactive Focus Thermo Scientific mass spectrometer. Samples were solubilized
in MeOH (1 mg.mL−1 ) and 1 µL was injected onto the column. The column was a Phenomenex Luna
Omega Polar C18 (150 × 2.1 mm, 1.6 µm, 100 Å) conditioned at 42 ◦ C. The mobile phase was a mixture
of water (solvent A) with increasing proportion of acetonitrile (solvent B, 012041, Biosolve), both
solvents modified with 0.1% of formic acid. The gradient was as follows: 50% B from 3 min before
injection to 1 min after; between 1 and 3 min, a linear increase of B up to 85%, followed by 85% B
for 2 min; 89% B from 5.1 to 7 min; 93% B from 7.1 to 10 min; 97% B from 10.1 to 13 min; and finally,
100% B from 13.1 to 18 min. The flow was set to 0.5 mL.min−1 and injected into the mass spectrometer
1 min after injection (diverted before). Mass spectrometry analyses were performed in the positive
electrospray ionization mode in the 133.4–2000 Da range, and mass spectra were recorded in the
centroid mode. The mass spectrometer method was set to FullMS data-dependent MS2 . In fullMS,
the resolution was set to 70,000 and the AGC target to 3 × 10⁶ for a chromatogram peak width (FWHM)
of 6 s. In MS2 , the resolution was 17,500, the AGC target 1 × 10⁵ , the isolation window 0.4 Da, andMar. Drugs 2020, 18, 78 10 of 15
the stepped normalized collision energy 15/30/45 with 10 s of dynamic exclusion. The lock mass was
calibrated on the Cu(CH3 CN)2+ ion at m/z 144.9821 Da.
3.6. LC-MS Data Preprocessing
Total ion chromatograms were processed through the untargeted metabolomic workflow of
Compound Discoverer (CD) 2.1 (Thermo Scientific). A Quality Control mix (QC) composed of the
12 algal extracts was analyzed together with algal extracts and K-ASWO medium used as a blank
to remove nonalgal compounds. The CD workflow performs retention time correction, detection
of unknown compounds, and grouping across samples; fills gaps when features are absent; hides
chemical background (using blank samples); and finally predicts compound elemental composition.
The retention time window was set to 2–18 min. The maximum time shift for compound alignment
was 0.1 min, the maximum mass tolerance for compound grouping and elemental composition
calculation was 3 ppm, and the minimum peak intensity was 2 × 10⁶ . This workflow provided an
observation/variable matrix used for further statistical analysis.
3.7. Confirmation of Algae Identities and Reconstruction of Phylogenies
Algae identification was performed on the basis of partial 18S rDNA sequence analysis. Total DNA
was extracted with hexadecyltrimethylammonium bromide (CTAB) as described by Winnepenninckx
et al. [78]. The 18S rDNA gene region was amplified by PCR using the unique nondegenerate universal
eukaryotic forward primer F-566 (5’ CAG CAG CCG CGG TAA TTC C 3’) and the reverse primer
R-1200 (3’ CCC GTG TTG AGT CAA ATT AAG C 5’) [79] before sequencing by the GATC company.
Then, partial 18S rDNA sequences were aligned using MUSCLE 3.8 [80], and gaps were manually
removed to get 429 base pairs sequences. Best substitution model selection and phylogenetic tree
reconstruction was performed using IQ-TREE 1.6.12. The best selected model was TIM2e+G4
with the Bayesian Inference Criterion, and 1000 bootstraps were used to construct the consensus
phylogenetic tree.
3.8. Figure Plotting and Statistical Analysis
All figures were plotted using R 3.6.1. Principal Component Analysis and corresponding biplots
were calculated and constructed using the FactoMineR v1.42 package and PCA function with the
scaled data option and 95% confidence ellipse lines. The phylogenetic tree was plotted using the
phytool v0.6-99 package, and the patristic matrix was calculated using the ape v5.3 package, while the
metabolite distance correlation matrix was calculated using the R base stats functions. The Mantel test
was performed using the ade4 v1.7-4 package.
Supplementary Materials: The following are available online at http://www.mdpi.com/1660-3397/18/2/78/s1,
Figure S1: Histogram of detected compounds (A) and occurrence in algal strains (B), Figure S2: Microalgal
concentration growth curves over time, Table S1: Algal and bacterial concentration (cells.mL−1 ) at sampling day
for the 12 algae species, Figures S3–S31: Analytical data on microalgal metabolites.
Author Contributions: Conceptualization, G.P. and D.S.; methodology, R.M.-G., G.P., D.S.; data curation,
R.M.-G.; writing—original draft preparation, R.M.-G., G.P., D.S.; writing—review and editing, R.M.-G., G.P., D.S.;
supervision, G.P., D.S.; project administration, G.P., D.S.; funding acquisition, G.P., D.S. All authors have read and
agreed to the published version of the manuscript.
Funding: This project obtained funding from the Interaction in Marine Organisms initiative of the FR3724
(Observatoire Océanologique de Banyuls-sur-Mer).
Acknowledgments: We would like to thank Manon Norest and Adrien Cadoudal for their help with strain
isolation and molecular sequencing, the BIO2MAR platform for help with metabolomic analyses, the BIOPIC
platform for help with cytometry, and the Genophy team members for support and stimulating discussions on this
project. Special thanks to Valérie Domien for help with production of the microalgal graphics and Nigel Grimsley
for English language corrections.
Conflicts of Interest: The authors declare no conflict of interest.Mar. Drugs 2020, 18, 78 11 of 15
References
1. Not, F.; Siano, R.; Kooistra, W.H.C.F.; Simon, N.; Vaulot, D.; Probert, I. Diversity and ecology of eukaryotic
marine phytoplankton. In Advances in Botanical Research; Elsevier: Amsterdam, The Netherlands, 2012;
Volume 64, pp. 1–53. ISBN 978-0-12-391499-6.
2. Burki, F.; Roger, A.J.; Brown, M.W.; Simpson, A.G.B. The new tree of eukaryotes. Trends Ecol. Evol.
2020, 35, 43–55. [CrossRef]
3. Leliaert, F.; Verbruggen, H.; Zechman, F.W. Into the deep: New discoveries at the base of the green plant
phylogeny. BioEssays 2011, 33, 683–692. [CrossRef]
4. Gould, S.B.; Waller, R.F.; McFadden, G.I. Plastid evolution. Annu. Rev. Plant Biol. 2008, 59, 491–517.
[CrossRef] [PubMed]
5. Lughadha, E.N.; Govaerts, R.; Belyaeva, I.; Black, N.; Lindon, H.; Allkin, R.; Magill, R.E.; Nicolson, N.
Counting counts: Revised estimates of numbers of accepted species of flowering plants, seed plants, vascular
plants and land plants with a review of other recent estimates. Phytotaxa 2016, 272, 82. [CrossRef]
6. Tragin, M.; Vaulot, D. Novel diversity within marine Mamiellophyceae (Chlorophyta) unveiled by
metabarcoding. Sci. Rep. 2019, 9, 1–14. [CrossRef] [PubMed]
7. Massana, R. Eukaryotic picoplankton in surface oceans. Annu. Rev. Microbiol. 2011, 65, 91–110. [CrossRef]
8. Courties, C.; Vaquer, A.; Troussellier, M.; Lautier, J.; Chrétiennot-Dinet, M.J.; Neveux, J.; Machado, C.;
Claustre, H. Smallest eukaryotic organism. Nature 1994, 370, 255. [CrossRef]
9. Schaum, E.; Rost, B.; Millar, A.J.; Collins, S. Variation in plastic responses of a globally distributed picoplankton
species to ocean acidification. Nat. Clim. Chang. 2013, 3, 298–302. [CrossRef]
10. Lang, D.; Weiche, B.; Timmerhaus, G.; Richardt, S.; Riaño-Pachón, D.M.; Corrêa, L.G.G.; Reski, R.;
Mueller-Roeber, B.; Rensing, S.A. Genome-wide phylogenetic comparative analysis of plant transcriptional
regulation: A timeline of loss, gain, expansion, and correlation with complexity. Genome Biol. Evol.
2010, 2, 488–503. [CrossRef]
11. Guiry, M.D.; Guiry, G.M.; Morrison, L.; Rindi, F.; Miranda, S.V.; Mathieson, A.C.; Parker, B.C.; Langangen, A.;
John, D.M.; Bárbara, I.; et al. AlgaeBase: An on-line resource for algae. Cryptogam. Algol. 2014, 35, 105–115.
[CrossRef]
12. Foss, P.; Guillard, R.R.L.; Liaaen-Jensen, S. Prasinoxanthin—A chemosystematic marker for algae.
Phytochemistry 1984, 23, 1629–1633. [CrossRef]
13. Latasa, M.; Scharek, R.; Gall, F.L.; Guillou, L. Pigment suites and taxonomic groups in Prasinophyceae.
J. Phycol. 2004, 40, 1149–1155. [CrossRef]
14. Serive, B.; Nicolau, E.; Bérard, J.-B.; Kaas, R.; Pasquet, V.; Picot, L.; Cadoret, J.-P. Community analysis of
pigment patterns from 37 microalgae strains reveals new carotenoids and porphyrins characteristic of distinct
strains and taxonomic groups. PLoS ONE 2017, 12, e0171872. [CrossRef]
15. Conway, M.; Mulhern, M.; McSorley, E.; van Wijngaarden, E.; Strain, J.; Myers, G.; Davidson, P.; Shamlaye, C.;
Yeates, A. Dietary determinants of polyunsaturated fatty acid (PUFA) status in a high fish-eating cohort
during pregnancy. Nutrients 2018, 10, 927. [CrossRef] [PubMed]
16. Abel, S.; Riedel, S.; Gelderblom, W.C.A. Dietary PUFA and cancer. Proc. Nutr. Soc. 2014, 73, 361–367.
[CrossRef] [PubMed]
17. Abdelhamid, A.S.; Martin, N.; Bridges, C.; Brainard, J.S.; Wang, X.; Brown, T.J.; Hanson, S.; Jimoh, O.F.;
Ajabnoor, S.M.; Deane, K.H.; et al. Polyunsaturated fatty acids for the primary and secondary prevention of
cardiovascular disease. Cochrane Database Syst. Rev. 2018. [CrossRef]
18. Bruno, A.; Rossi, C.; Marcolongo, G.; Di Lena, A.; Venzo, A.; Berrie, C.P.; Corda, D. Selective
in vivo anti-inflammatory action of the galactolipid monogalactosyldiacylglycerol. Eur. J. Pharmacol.
2005, 524, 159–168. [CrossRef]
19. Wang, H.; Li, Y.-L.; Shen, W.-Z.; Rui, W.; Ma, X.-J.; Cen, Y.-Z. Antiviral activity of a sulfoquinovosyldiacylglycerol
(SQDG) compound isolated from the green alga Caulerpa racemosa. Bot. Mar. 2007, 50, 185–190. [CrossRef]
20. Blanc-Mathieu, R.; Verhelst, B.; Derelle, E.; Rombauts, S.; Bouget, F.-Y.; Carré, I.; Château, A.; Eyre-Walker, A.;
Grimsley, N.; Moreau, H.; et al. An improved genome of the model marine alga Ostreococcus tauri unfolds by
assessing Illumina de novo assemblies. BMC Genom. 2014, 15, 1103. [CrossRef]Mar. Drugs 2020, 18, 78 12 of 15
21. Yau, S.; Krasovec, M.; Benites, L.F.; Rombauts, S.; Groussin, M.; Vancaester, E.; Aury, J.-M.; Derelle, E.;
Desdevises, Y.; Escande, M.-L.; et al. Virus-host coexistence in phytoplankton through the genomic lens.
Sci. Adv. 2020, in press.
22. Moreau, H.; Verhelst, B.; Couloux, A.; Derelle, E.; Rombauts, S.; Grimsley, N.; Van Bel, M.; Poulain, J.;
Katinka, M.; Hohmann-Marriott, M.F.; et al. Gene functionalities and genome structure in Bathycoccus
prasinos reflect cellular specializations at the base of the green lineage. Genome Biol. 2012, 13, R74. [CrossRef]
[PubMed]
23. Simon, N.; Foulon, E.; Grulois, D.; Six, C.; Desdevises, Y.; Latimier, M.; Le Gall, F.; Tragin, M.; Houdan, A.;
Derelle, E.; et al. Revision of the genus Micromonas Manton et Parke (Chlorophyta, Mamiellophyceae), of the
type species M. pusilla (Butcher) Manton & Parke and of the species M. commoda van Baren, Bachy and
Worden and description of two new species based on the genetic and phenotypic characterization of cultured
isolates. Protist 2017, 168, 612–635. [PubMed]
24. Krasovec, M.; Vancaester, E.; Rombauts, S.; Bucchini, F.; Yau, S.; Hemon, C.; Lebredonchel, H.; Grimsley, N.;
Moreau, H.; Sanchez-Brosseau, S.; et al. Genome analyses of the microalga Picochlorum provide insights into
the evolution of thermotolerance in the green lineage. Genome Biol. Evol. 2018, 10, 2347–2365. [CrossRef]
[PubMed]
25. Wang, M.; Carver, J.J.; Phelan, V.V.; Sanchez, L.M.; Garg, N.; Peng, Y.; Nguyen, D.D.; Watrous, J.; Kapono, C.A.;
Luzzatto-Knaan, T.; et al. Sharing and community curation of mass spectrometry data with Global Natural
Products Social Molecular Networking. Nat. Biotechnol. 2016, 34, 828–837. [CrossRef] [PubMed]
26. Zianni, R.; Bianco, G.; Lelario, F.; Losito, I.; Palmisano, F.; Cataldi, T.R.I. Fatty acid neutral losses observed
in tandem mass spectrometry with collision-induced dissociation allows regiochemical assignment of
sulfoquinovosyl-diacylglycerols: The neutral loss of FAs from SQDGs by tandem MS. J. Mass Spectrom.
2013, 48, 205–215. [CrossRef] [PubMed]
27. Guella, G.; Frassanito, R.; Mancini, I. A new solution for an old problem: The regiochemical distribution of
the acyl chains in galactolipids can be established by electrospray ionization tandem mass spectrometry.
Rapid Commun. Mass Spectrom. 2003, 17, 1982–1994. [CrossRef]
28. Mimouni, V.; Couzinet-Mossion, A.; Ulmann, L.; Wielgosz-Collin, G. Lipids from microalgae. In
Microalgae in Health and Disease Prevention; Elsevier: Amsterdam, The Netherlands, 2018; pp. 109–131.
ISBN 978-0-12-811405-6.
29. Abida, H.; Dolch, L.-J.; Meï, C.; Villanova, V.; Conte, M.; Block, M.A.; Finazzi, G.; Bastien, O.; Tirichine, L.;
Bowler, C.; et al. Membrane glycerolipid remodeling triggered by nitrogen and phosphorus starvation in
Phaeodactylum tricornutum. Plant Physiol. 2015, 167, 118–136. [CrossRef]
30. Roche, S.A.; Leblond, J.D. Betaine lipids in chlorarachniophytes. Phycol. Res. 2010, 58, 298–305. [CrossRef]
31. Rivera, S.M.; Christou, P.; Canela-Garayoa, R. Identification of carotenoids using mass spectrometry.
Mass Spectrom. Rev. 2014, 33, 353–372. [CrossRef]
32. Zhang, Y.; Wu, H.; Wen, H.; Fang, H.; Hong, Z.; Yi, R.; Liu, R. Simultaneous determination of fucoxanthin
and its deacetylated metabolite fucoxanthinol in rat plasma by Liquid Chromatography-Tandem Mass
Spectrometry. Mar. Drugs 2015, 13, 6521–6536. [CrossRef]
33. Harwood, J.L.; Guschina, I.A. The versatility of algae and their lipid metabolism. Biochimie 2009, 91, 679–684.
[CrossRef] [PubMed]
34. Degraeve-Guilbault, C.; Bréhélin, C.; Haslam, R.; Sayanova, O.; Marie-Luce, G.; Jouhet, J.; Corellou, F.
Glycerolipid Characterization and nutrient deprivation-associated changes in the green picoalga Ostreococcus
tauri. Plant Physiol. 2017, 173, 2060–2080. [CrossRef] [PubMed]
35. Da Costa, E.; Domingues, P.; Melo, T.; Coelho, E.; Pereira, R.; Calado, R.; Abreu, M.H.; Domingues, M.R.
Lipidomic signatures reveal seasonal shifts on the relative abundance of high-valued lipids from the brown
algae Fucus vesiculosus. Mar. Drugs 2019, 17, 335. [CrossRef] [PubMed]
36. Kato, M.; Sakai, M.; Adachi, K.; Ikemoto, H.; Sano, H. Distribution of betaine lipids in marine algae.
Phytochemistry 1996, 42, 1341–1345. [CrossRef]
37. Akimoto, S.; Tomo, T.; Naitoh, Y.; Otomo, A.; Murakami, A.; Mimuro, M. Identification of a new excited
state responsible for the in vivo unique absorption band of siphonaxanthin in the green alga Codium fragile.
J. Phys. Chem. B 2007, 111, 9179–9181. [CrossRef]
38. Kessler, A.; Kalske, A. Plant secondary metabolite diversity and species interactions. Annu. Rev. Ecol. Evol.
Syst. 2018, 49, 115–138. [CrossRef]Mar. Drugs 2020, 18, 78 13 of 15
39. Wink, M. Introduction: Biochemistry, physiology and ecological functions of secondary metabolites.
In Biochemistry of Plant Secondary Metabolism; Wink, M., Ed.; Wiley-Blackwell: Oxford, UK, 2010; pp. 1–19.
ISBN 978-1-4443-2050-3.
40. Singh, R. Chemotaxonomy: A tool for plant classification. J. Med. Plants Stud. 2016, 4, 90–93.
41. Wink, M.; Botschen, F.; Gosmann, C.; Schfer, H.; Waterman, P.G. Chemotaxonomy seen from a phylogenetic
perspective and evolution of secondary metabolism. In Biochemistry of Plant Secondary Metabolism; Wink, M.,
Ed.; Wiley-Blackwell: Oxford, UK, 2010; pp. 364–433. ISBN 978-1-4443-2050-3.
42. Mc Gee, D.; Gillespie, E. The bioactivity and chemotaxonomy of microalgal carotenoids. In Biodiversity and
Chemotaxonomy; Ramawat, K.G., Ed.; Springer International Publishing: Cham, Switerland, 2019; Volume 24,
pp. 215–237. ISBN 978-3-030-30745-5.
43. Zimorski, V.; Ku, C.; Martin, W.F.; Gould, S.B. Endosymbiotic theory for organelle origins. Curr. Opin.
Microbiol. 2014, 22, 38–48. [CrossRef]
44. Carroll, A.R.; Copp, B.R.; Davis, R.A.; Keyzers, R.A.; Prinsep, M.R. Marine natural products. Nat. Prod. Rep.
2019, 36, 122–173. [CrossRef]
45. Martin, G.J.O.; Hill, D.R.A.; Olmstead, I.L.D.; Bergamin, A.; Shears, M.J.; Dias, D.A.; Kentish, S.E.; Scales, P.J.;
Botté, C.Y.; Callahan, D.L. Lipid profile remodeling in response to nitrogen deprivation in the microalgae
Chlorella sp. (Trebouxiophyceae) and Nannochloropsis sp. (Eustigmatophyceae). PLoS ONE 2014, 9, e103389.
[CrossRef]
46. Siaut, M.; Cuiné, S.; Cagnon, C.; Fessler, B.; Nguyen, M.; Carrier, P.; Beyly, A.; Beisson, F.; Triantaphylidès, C.;
Li-Beisson, Y.; et al. Oil accumulation in the model green alga Chlamydomonas reinhardtii: Characterization,
variability between common laboratory strains and relationship with starch reserves. BMC Biotechnol.
2011, 11, 7. [CrossRef]
47. Vieler, A.; Brubaker, S.B.; Vick, B.; Benning, C.A. Lipid droplet protein of Nannochloropsis with functions
partially analogous to plant oleosins. Plant Physiol. 2012, 158, 1562–1569. [CrossRef]
48. Lang, I.; Hodac, L.; Friedl, T.; Feussner, I. Fatty acid profiles and their distribution patterns in microalgae:
A comprehensive analysis of more than 2000 strains from the SAG culture collection. BMC Plant Biol.
2011, 11, 124. [CrossRef]
49. Galloway, A.W.E.; Winder, M. Partitioning the relative importance of phylogeny and environmental conditions
on phytoplankton fatty acids. PLoS ONE 2015, 10, e0130053. [CrossRef]
50. Taipale, S.J.; Hiltunen, M.; Vuorio, K.; Peltomaa, E. Suitability of phytosterols alongside fatty acids as
chemotaxonomic biomarkers for phytoplankton. Front. Plant Sci. 2016, 7, 212. [CrossRef]
51. Wolhowe, M.D.; Prahl, F.G.; White, A.E.; Popp, B.N.; Rosas-Navarro, A. A biomarker perspective on
coccolithophorid growth and export in a stratified sea. Prog. Oceanogr. 2014, 122, 65–76. [CrossRef]
52. Van Mooy, B.A.S.; Fredricks, H.F. Bacterial and eukaryotic intact polar lipids in the eastern subtropical South
Pacific: Water-column distribution, planktonic sources, and fatty acid composition. Geochim. Cosmochim.
Acta 2010, 74, 6499–6516. [CrossRef]
53. Cañavate, J.P.; Armada, I.; Ríos, J.L.; Hachero-Cruzado, I. Exploring occurrence and molecular diversity of
betaine lipids across taxonomy of marine microalgae. Phytochemistry 2016, 124, 68–78. [CrossRef]
54. Guschina, I.A.; Harwood, J.L. Algal lipids and effect of the environment on their biochemistry. In Lipids in
Aquatic Ecosystems; Kainz, M., Brett, M.T., Arts, M.T., Eds.; Springer: New York, NY, USA, 2009; pp. 1–24.
ISBN 978-0-387-88607-7.
55. Alonso, D.L.; Belarbi, E.-H.; Fernández-Sevilla, J.M.; Rodríguez-Ruiz, J.; Grima, E.M. Acyl lipid composition
variation related to culture age and nitrogen concentration in continuous culture of the microalga
Phaeodactylum tricornutum. Phytochemistry 2000, 54, 461–471. [CrossRef]
56. Abo-State, M.A.M.; Shanab, S.M.M.; Ali, H.E.A. Effect of nutrients and gamma radiation on growth and
lipid accumulation of Chlorella vulgaris for biodiesel production. J. Radiat. Res. Appl. Sci. 2019, 12, 332–342.
[CrossRef]
57. Cañavate, J.P.; Armada, I.; Hachero-Cruzado, I. Polar lipids analysis of cultured phytoplankton reveals
significant inter-taxa changes, low influence of growth stage, and usefulness in chemotaxonomy. Microb. Ecol.
2017, 73, 755–774. [CrossRef] [PubMed]
58. Tsugawa, H.; Satoh, A.; Uchino, H.; Cajka, T.; Arita, M.; Arita, M. Mass spectrometry data repository enhances
novel metabolite discoveries with advances in computational metabolomics. Metabolites 2019, 9, 119.
[CrossRef]Mar. Drugs 2020, 18, 78 14 of 15
59. Marin, B.; Melkonian, M. Molecular phylogeny and classification of the Mamiellophyceae class. nov.
(Chlorophyta) based on sequence comparisons of the nuclear- and plastid-encoded rRNA operons. Protist
2010, 161, 304–336. [CrossRef]
60. Abby, S.S.; Touchon, M.; De Jode, A.; Grimsley, N.; Piganeau, G. Bacteria in Ostreococcus tauri cultures—friends,
foes or hitchhikers? Front. Microbiol. 2014, 5, 505. [CrossRef]
61. Gast, R.J.; McKie-Krisberg, Z.M.; Fay, S.A.; Rose, J.M.; Sanders, R.W. Antarctic mixotrophic protist abundances
by microscopy and molecular methods. FEMS Microbiol. Ecol. 2014, 89, 388–401. [CrossRef] [PubMed]
62. Anderson, R.; Jürgens, K.; Hansen, P.J. Mixotrophic Phytoflagellate Bacterivory Field measurements strongly
biased by standard approaches: A case study. Front. Microbiol. 2017, 8. [CrossRef] [PubMed]
63. Burri, L.; Hoem, N.; Banni, S.; Berge, K. Marine omega-3 phospholipids: Metabolism and biological activities.
Int. J. Mol. Sci. 2012, 13, 15401–15419. [CrossRef] [PubMed]
64. Simopoulos, A.P. The importance of the ratio of omega-6/omega-3 essential fatty acids. Biomed. Pharmacother.
2002, 56, 365–379. [CrossRef]
65. Cardozo, K.H.M.; Guaratini, T.; Barros, M.P.; Falcão, V.R.; Tonon, A.P.; Lopes, N.P.; Campos, S.; Torres, M.A.;
Souza, A.O.; Colepicolo, P.; et al. Metabolites from algae with economical impact. Comp. Biochem. Physiol.
Part C Toxicol. Pharmacol. 2007, 146, 60–78. [CrossRef]
66. Bowen, K.J.; Harris, W.S.; Kris-Etherton, P.M. Omega-3 fatty acids and cardiovascular disease: Are there
benefits? Curr. Treat. Options Cardiovasc. Med. 2016, 18, 69. [CrossRef]
67. Banskota, A.H.; Stefanova, R.; Gallant, P.; McGinn, P.J. Mono- and digalactosyldiacylglycerols: Potent nitric
oxide inhibitors from the marine microalga Nannochloropsis granulata. J. Appl. Phycol. 2013, 25, 349–357.
[CrossRef]
68. Banskota, A.H.; Stefanova, R.; Sperker, S.; Lall, S.; Craigie, J.S.; Hafting, J.T. Lipids isolated from the cultivated
red alga Chondrus crispus inhibit nitric oxide production. J. Appl. Phycol. 2014, 26, 1565–1571. [CrossRef]
69. Lopes, G.; Daletos, G.; Proksch, P.; Andrade, P.; Valentão, P. Anti-inflammatory potential of monogalactosyl
diacylglycerols and a monoacylglycerol from the edible brown seaweed Fucus spiralis Linnaeus. Mar. Drugs
2014, 12, 1406–1418. [CrossRef] [PubMed]
70. Plouguerné, E.; da Gama, B.A.P.; Pereira, R.C.; Barreto-Bergter, E. Glycolipids from seaweeds and their
potential biotechnological applications. Front. Cell. Infect. Microbiol. 2014, 4, 174. [CrossRef]
71. Kim, Y.H.; Kim, E.-H.; Lee, C.; Kim, M.-H.; Rho, J.-R. Two new monogalactosyl diacylglycerols from brown
alga Sargassum thunbergii. Lipids 2007, 42, 395–399. [CrossRef] [PubMed]
72. Gustafson, K.R.; Cardellina, J.H.; Fuller, R.W.; Weislow, O.S.; Kiser, R.F.; Snader, K.M.; Patterson, G.M.L.;
Boyd, M.R. AIDS-antiviral sulfolipids from cyanobacteria (blue-green algae). JNCI J. Natl. Cancer Inst.
1989, 81, 1254–1258. [CrossRef]
73. De Souza, L.M.; Sassaki, G.L.; Romanos, M.T.V.; Barreto-Bergter, E. Structural characterization and anti-HSV-1
and HSV-2 activity of glycolipids from the marine algae Osmundaria obtusiloba isolated from southeastern
Brazilian coast. Mar. Drugs 2012, 10, 918–931. [CrossRef]
74. Morimoto, T.; Murakami, N.; Nagatsu, A.; Sakakibara, J. Studies on glycolipids. VII. Isolation of two new
sulfoquinovosyl diacylglycerols from the green alga Chlorella vulgaris. Chem. Pharm. Bull. 1993, 41, 1545–1548.
[CrossRef]
75. Murakami, C.; Kumagai, T.; Hada, T.; Kanekazu, U.; Nakazawa, S.; Kamisuki, S.; Maeda, N.; Xu, X.;
Yoshida, H.; Sugawara, F.; et al. Effects of glycolipids from spinach on mammalian DNA polymerases.
Biochem. Pharmacol. 2003, 65, 259–267. [CrossRef]
76. Djouani-Tahri, E.B.; Sanchez, F.; Lozano, J.-C.; Bouget, F.-Y. A phosphate-regulated promoter for fine-tuned
and reversible overexpression in Ostreococcus: Application to circadian clock functional analysis. PLoS ONE
2011, 6, e28471. [CrossRef]
77. Keller, M.D.; Selvin, R.C.; Claus, W.; Guillard, R.R.L. Media for the culture of oceanic ultraphytoplankton.
J. Phycol. 2007, 23, 633–638. [CrossRef]
78. Winnepenninckx, B. Extraction of high molecular weight DNA from molluscs. Trends Genet. 1993, 9, 407.
[PubMed]Mar. Drugs 2020, 18, 78 15 of 15
79. Hadziavdic, K.; Lekang, K.; Lanzen, A.; Jonassen, I.; Thompson, E.M.; Troedsson, C. Characterization of the
18S rRNA gene for designing universal eukaryote specific primers. PLoS ONE 2014, 9, e87624. [CrossRef]
[PubMed]
80. Madeira, F.; Park, Y.M.; Lee, J.; Buso, N.; Gur, T.; Madhusoodanan, N.; Basutkar, P.; Tivey, A.R.N.; Potter, S.C.;
Finn, R.D.; et al. The EMBL-EBI search and sequence analysis tools APIs in 2019. Nucleic Acids Res.
2019, 47, W636–W641. [CrossRef]
© 2020 by the authors. Licensee MDPI, Basel, Switzerland. This article is an open access
article distributed under the terms and conditions of the Creative Commons Attribution
(CC BY) license (http://creativecommons.org/licenses/by/4.0/).You can also read