Comparative Analysis of Milk Fat Globular Membrane (MFGM) Proteome between Saudi Arabia Camelus dromedary Safra and Wadha Breeds - MDPI
←
→
Page content transcription
If your browser does not render page correctly, please read the page content below
molecules
Article
Comparative Analysis of Milk Fat Globular
Membrane (MFGM) Proteome between Saudi Arabia
Camelus dromedary Safra and Wadha Breeds
Bassam H. Sabha 1 , Afshan Masood 2 , Ibrahim O. Alanazi 3 , Assim A. Alfadda 2 ,
Hussein A. Almehdar 1 , Hicham Benabdelkamel 2, * and Elrashdy M. Redwan 1, *
 1   Department of Biological Science, Faculty of Science, King Abdulaziz University, Jeddah, P.O. Box 80203,
     Jeddah 21589, Saudi Arabia; bassam_alsobahy@hotmail.com (B.H.S.); dralmehdar@hotmail.com (H.A.A.)
 2   Proteomics Unit, Obesity Research Center, College of Medicine, King Saud University, P.O. Box 2925 (98),
     Riyadh 11461, Saudi Arabia; afsmasood@ksu.edu.sa (A.M.); aalfadda@ksu.edu.sa (A.A.A.)
 3   The National Center for Genomic Technology (NCGT), Life Science and Environment Research Institute,
     King Abdulaziz City for Science and Technology (KACST), PO Box 6086, Riyadh 11461, Saudi Arabia;
     ialenazi@kacst.edu.sa
 *   Correspondence: hbenabdelkamel@ksu.edu.sa (H.B.); lradwan@kau.edu.sa (E.M.R.);
     Tel.: +966-11-467-1315 (H.B.)

 Academic Editor: Pierluigi Plastina

 Received: 28 March 2020; Accepted: 1 May 2020; Published: 4 May 2020

 Abstract: Camel milk is traditionally known to have medicinal properties and many potential
 health benefits. Natural milk contains many soluble proteins and nanoparticles, such as a milk
 fat globule membrane (MFGM), a three-layered membrane covering of milk fat globule mainly
 composed of proteins and lipids, which plays an important role in human health. MFGM proteins
 account for 1%–4% of total milk proteins, and their nutritive value and distribution depends on the
 different breeds. The differential composition of these membrane proteins among different camel
 breeds has not been explored. The current study, therefore, aimed to quantitatively analyze and
 compare the MFGM proteome between the milk produced by the two most common Saudi camel
 breeds, Camelus dromedarius: Safra and Wadha. Two-dimensional difference in gel electrophoresis
 (2D-DIGE) and mass spectrometry analysis revealed a total of 44 MFGM proteins that were
 identified with a significant difference in abundance (p ≤ 0.05; fold change ≥ 1.5) between the
 two breeds. Thirty-one proteins were up-regulated and 13 proteins were down-regulated in the
 Safra breed compared to the Wadha breed. The proteins identified with an increased abundance
 included α-lactalbumin, lactadherin, and annexin a8, whereas the down-regulated proteins included
 butyrophilin subfamily 1 member a1, lactotransferrin, and vinculin. The differentially abundant
 proteins were analyzed by the UNIPROT system and gene ontology (GO) to reveal their associations
 with known biological functions and pathways. Enzyme-linked immunosorbent assay (ELISA)
 confirmed the 2D-DIGE findings of butyrophilin (BTN) and α-lactalbumin (α-LA) levels obtained
 from Safra and Wadha breeds.

 Keywords: Safra breed; Wadha breed; camel milk; proteomics; 2D-DIGE; MFGM

1. Introduction
     Camel milk has been consumed for thousands of years because of its immense nutritional
value and health benefits. Several studies have revealed that camel milk has a high concentration
of immunoglobulins, serum albumin, lactoferrin, the hormone insulin, and other important
ingredients [1–3]. Recently, camel milk has been utilized as medication for treating many diseases
including gastrointestinal disorders, diabetes mellitus, food allergy, cancer, and hepatitis C and B [1,4–7].

Molecules 2020, 25, 2146; doi:10.3390/molecules25092146                        www.mdpi.com/journal/molecules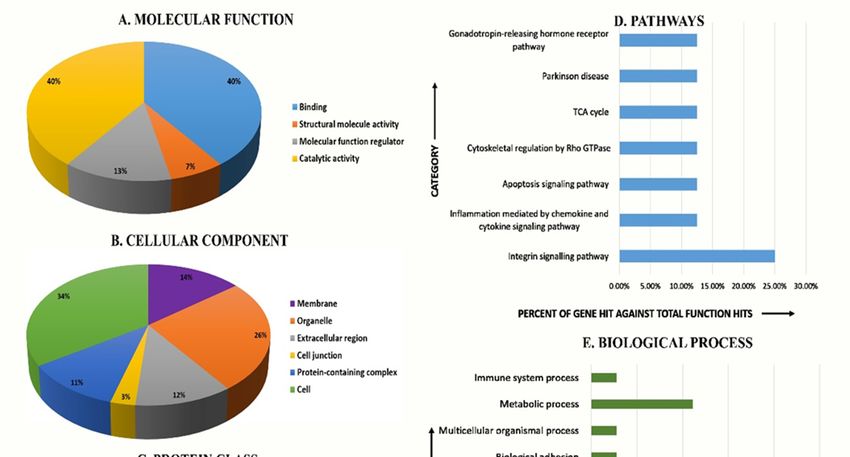
Molecules 2020, 25, 2146                                                                             2 of 17

Moreover, camel milk has differential in vitro antimicrobial activities against many pathogens [6,7],
based on its bioactive proteins and/or peptides [1,8–12].
      The characteristics and composition of camel milk are known to differ due to various factors,
including the breed of the camel, conditions of feeding, the health of the animal, calving number,
stage of lactation, geographical location, and with seasons [13,14]. Milk fat globule membrane (MFGM)
is one of the key components of not only camel milk but in the milk of other primates as well.
It is a three-layered membrane covering the milk fat globule membrane, accounting for 1%–4% of
total milk proteins [15]. The origin of MFGM has been studied to be from different parts of cells
including the endoplasmic reticulum membrane, the apical plasma membrane of secretory cells in
the mammary gland and cytoplasm [16]. It encloses the lipid molecules in the milk, which mainly
comprises triacylglycerides, phospholipids, cholesterol, and various other integral, peripheral proteins,
and other compositions derived from the original mammary cell [17]. MFGM derived proteins have
been involved in beneficial bioactivities, such as antibacterial, antiviral [18], anticancer effects [19],
and anti-inflammation [20].
      Today, the benefits of MFGM have transferred it from the bedside into the market [21–30].
As MFGM is a reservoir of membrane proteins, these proteins were analyzed by research groups using
proteomic techniques to identify potential signaling and secretory pathways utilized by the mammary
gland [31]. One of the most abundant proteins studied among the MFGM proteins is butyrophilin.
This protein has been studied and shown to be involved in modulating the encephalitogenic T-cell
response to myelin oligodendrocyte glycoprotein related to human multiple sclerosis [32]. There have
been several studies that have utilized the proteomics platform to study and identify MFGM proteins
in different milk species including bovine and yak milk [33], cattle [34], goat [35], and horse [36], or to
compare protein composition of milk among different breeds in cattle [37] and goat [38].
      To the best of our knowledge, we found only one study that has been conducted to characterize
the MFGM proteome in camel milk [39]. As it is known that MFGM composition could differ among
various breeds of the same animal, the present study targeted to analyze the differential protein
composition of MFGM in camel milk produced by two of the Saudi camel breeds, Camelus dromedaries
(C. dromedarius) Safra and Wadha, in order to find the differences in nutritional value depending on the
differences in the level of the proteins between them.

2. Results

2.1. CyDye Fluorescence Labeling and Two-Dimensional Difference in Gel Electrophoresis (2D-DIGE)
     Two-dimensional (2D)-DIGE was used to assess the differences in the pattern of protein
level changes in the MFGM: five Biological Replicates for each breed (Safra and Wadha).
Representative fluorescent protein profiles of a 2D-DIGE containing MFGM-Safra sample labeled with
Cy3 are shown in Figure 1A; MFGM-Wadha sample labeled with Cy5 (Figure 1B), and a pooled internal
control labeled with Cy2 (Figure 1C). Manual validation was performed to exclude false spots. A total
of 820 spots were mapped on the gels, of which 60 were significantly different (ANOVA p ≤ 0.05 and
fold change ≥ 1.5) between the MFGM samples from Safra and Wadha breeds (Figure 2). The gel images
show the degree of differential expression of proteins in the merged image, between MFGM-Safra
labeled with Cy3 (green) and MFGM-Wadha labeled with Cy5 (red), that are represented as yellow
spots. The yellow fluorescent spots represent proteins with the same isoelectric point, molecular
weight, and nearly equal fluorescent intensity. The spot patterns were reproducible across all five gels,
leading to alignment and further analysis. Cy2-labeling (the internal standard) was included to permit
normalization across the complete set of gels and quantitative differential analysis of the protein levels.
A total of 60 spots showing a statistical significance between the groups were then manually excised
from the preparative gel for protein identification by mass spectrometry.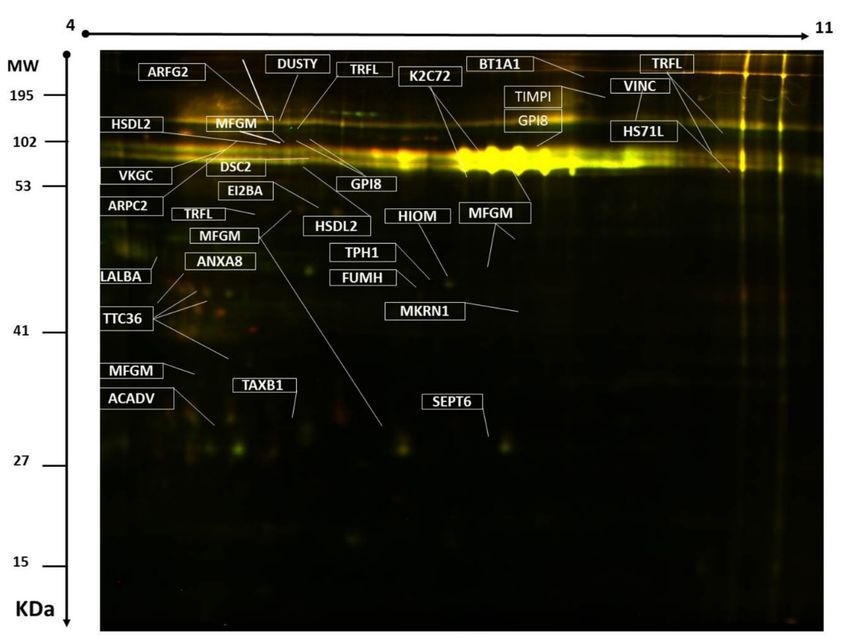
Molecules 2020, 25, 2146                                                                                                  3 of 17
      Molecules
      Molecules 2020,
                2020, 25,
                      25, xx FOR
                             FOR PEER
                                 PEER REVIEW
                                      REVIEW                                                                        33 of
                                                                                                                       of 18
                                                                                                                          18

      FigureFigure
            Figure  1.
                    1. Representative
               1. Representative       fluorescent
                       Representativefluorescent    protein
                                                    protein profiles
                                       fluorescent protein     profiles of
                                                               profiles ofofaaatwo-dimensional
                                                                                 two-dimensional
                                                                               two-dimensional     difference   in
                                                                                                       difference
                                                                                                   difference    in gel
                                                                                                                     in gel
                                                                                                                    gel
            electrophoresis
            electrophoresis (2D-DIGE)
                            (2D-DIGE)   containing: milk
                                        containing:milk    fat
                                                     milk fat   globule
                                                           fat globule   membrane
                                                                globule membrane      (MFGM)-Safra      milk  samples
      electrophoresis   (2D-DIGE)    containing:                          membrane(MFGM)-Safra
                                                                                         (MFGM)-Safra   milk  samples
                                                                                                            milk   samples
            labeled
            labeled with Cy3 (A), MFGM-Wadha     milk samples    labeled
                                                                  labeled with  Cy5 (B),  and pooled  internal control
      labeled  with with
                    Cy3 Cy3
                         (A), (A), MFGM-Wadha
                               MFGM-Wadha        milk
                                               milk    sampleslabeled
                                                     samples              with
                                                                          withCy5Cy5(B),
                                                                                      (B),and pooled
                                                                                            and pooledinternal control
                                                                                                          internal  control
            labeled
            labeled with
                    with Cy2
                         Cy2 (C).
                              (C).
      labeled with Cy2 (C).

      Figure 2. Representative image of the protein spots from milk samples showing the statistically
      significant differentially expressed spots (ANOVA p ≤ 0.05 and fold change ≥1.5, 44 proteins) successfully
      identified with MALDI-TOF/TOF and labeled with MASCOT IDs.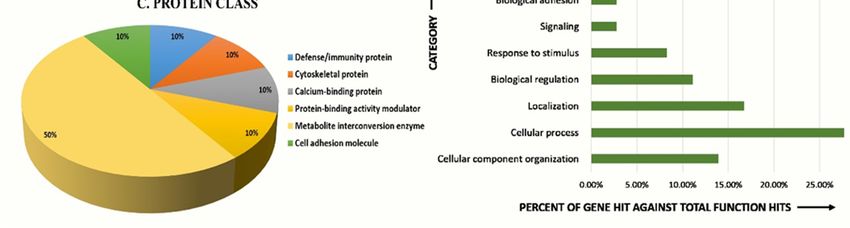
Molecules 2020, 25, 2146                                                                                      4 of 17

2.2. Mass Spectrometry and Identification of Proteins
     Peptide mass fingerprint (PMF) successfully identified 44 out of the 60 protein spots excised
from the preparative gel. MALDI-TOF mass spectrometry found 25 spots to be unique protein
sequences that were matched to entries in the SWISS-PROT database by Mascot with high confidence
scores (Table 1, Table S1, Supplementary materials). The sequence coverage of the identified proteins
by PMF ranged from 4% to 85%. In a few cases, variants of the same protein were found at
several locations on the gel (Table 1, Figure 2). Among the 44 proteins identified, 31 protein
spots were up-regulated and 13 down-regulated in MFGM from Safra compared to Wadha breeds
(Table 1, Figure 3). The significantly up-regulated proteins included α-lactalbumin lactadherin,
annexin a8 hydroxysteroid dehydrogenase-like protein 2 (up 1.6-fold), and GPI-anchor transamidase.
The significantly down-regulated proteins included lactotransferrin, vinculin dual serine/threonine
and tyrosine protein kinase butyrophilin subfamily 1 member a1 heat shock 70 kDa protein 1-like,
acetyl serotonin O-methyl transferase, and ADP-ribosylation factor GTPase-activating protein 2
(a complete list of up-and down-regulated protein has been provided in Table 1, Table S1, Supplementary
Materials). Among the identified proteins, lactotransferrin, vinculin, tetratricopeptide repeat protein
36, lactadherin, hydroxysteroid dehydrogenase-like protein 2, GPI-anchor transamidase, keratin,
and type II cytoskeletal 72 were found in more than one spot on the gels, which could be explained
by post-translational modifications, cleavage by enzymes, or the presence of different protein species.
Not all spots of interest could be identified because some proteins were low in abundance and did not
yield a sufficiently intense mass of fingerprints; other spots were mixtures of multiple proteins.

      Table 1. Identified proteins with changes in abundance between MFGM-Safra and Wadha breed samples.
      The average ratio values along with their corresponding levels of fold changes and one-way ANOVA
      (p < 0.05) using 2D-DIGE. (Analysis type: MALDI-TOF; database: SwissProt; taxonomy: Other Mammalian).

                           Accession                                                                Fold Change
    Spot Number                          Mascot ID          Protein Name             Function
                           Number                                                                       S/W
         1346               P00710     LALBA_CAMDR        A-lactalbumin                  -              2.8
                                                     Tetratricopeptide repeat
         1583              Q3SZV0      TTC36_BOVIN                                       -              2.6
                                                            protein 36
                                                      Tax1-binding protein 1
         1662               Q2KJE0     TAXB1_BOVIN                                Binding Protein       2.5
                                                             homolog
         1613               P79385      MFGE8_PIG          Lactadherin            Cell adhesion         2.3
                                                         Hydroxysteroid
         1004              A4FUZ6      HSDL2_BOVIN                                   Enzyme              2
                                                   dehydrogenase-like protein 2
         1001               Q95114     MFGE8_BOVIN         Lactadherin            Cell adhesion          2
                                                     Very long-chain specific
         1648               P48818     ACADV_BOVIN  acyl-CoA dehydrogenase,          Enzyme             1.6
                                                          mitochondrial
         1407               Q95L54     ANXA8_BOVIN         Annexin A8             Cell membrane         1.6
                                                         Hydroxysteroid
         1155              A4FUZ6      HSDL2_BOVIN                                   Enzyme             1.6
                                                   dehydrogenase-like protein 2
         1078              P79385       MFGE8_PIG          Lactadherin             Cell adhesion        1.6
         1676              Q3SZN0      SEPT6_BOVIN            Septin-6            Cell membrane         1.5
                                                    E3 ubiquitin-protein ligase
         1460               Q9TT91     MKRN1_MACEU                                   Enzyme             1.5
                                                            makorin-1
                                                       Fumarate hydratase,
         1429               P10173       FUMH_PIG                                    Enzyme             1.5
                                                          mitochondrial
                                                     Tetratricopeptide repeat
         1416              Q3SZV0      TTC36_BOVIN                                       -              1.5
                                                            protein 36
         1384               P79385       MFGM_PIG          Lactadherin             Cell adhesion        1.5
         1373               P17290      TPH1_RABIT Tryptophan 5-hydroxylase 1        Enzyme             1.5
         1235               P79385      MFGE8_PIG          Lactadherin             Cell adhesion        1.5
         1181               P79385      MFGE8_PIG          Lactadherin             Cell adhesion        1.5
         1072               P33545      DSC2_BOVIN        Desmocollin-2           Cell membrane         1.5
         1066              Q3MHZ7       GPI8_BOVIN  GPI-anchor transamidase          Enzyme             1.5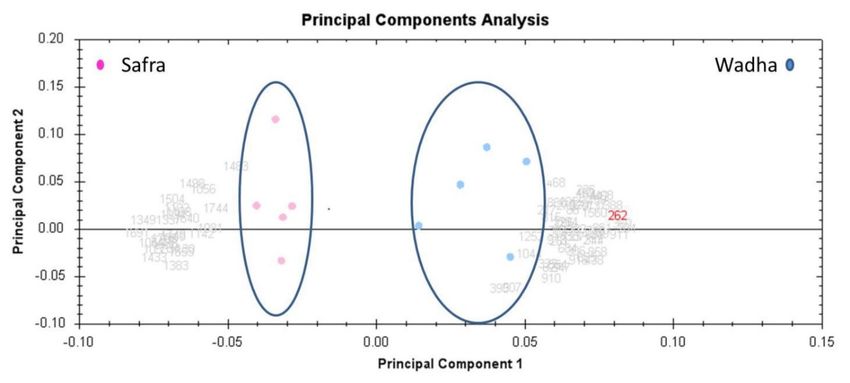
Molecules 2020, 25, 2146                                                                                               5 of 17

                                                      Table 1. Cont.

                           Accession                                                                         Fold Change
    Spot Number                          Mascot ID              Protein Name                  Function
                           Number                                                                                S/W
         1063              P79385       MFGE8_PIG                 Lactadherin              Cell membrane         1.5
         1056              Q148H8      K2C72_BOVIN      Keratin, type II cytoskeletal 72   Cell membrane         1.5
         1054              P26234       VINC_PIG                    Vinculin               Cell membrane         1.5
                                                          Actin-related protein 2/3
         1040              Q3MHR7      ARPC2_BOVIN                                         Cell membrane         1.5
                                                              complex subunit 2
                                                            Vitamin K-dependent
         1039              Q9MYY3      VKGC_DELLE                                             Enzyme             1.5
                                                             gamma-carboxylase
         1026              Q148H8      K2C72_BOVIN      Keratin, type II cytoskeletal 72   Cell membrane         1.5
         1011              Q3MHZ7       GPI8_BOVIN        GPI-anchor transamidase             Enzyme            1.5
         1009              Q3MHZ7       GPI8_BOVIN        GPI-anchor transamidase             Enzyme            1.5
         1005               P79385      MFGE8_PIG                 Lactadherin               Cell adhesion        1.5
          396               P79385      MFGE8_PIG                 Lactadherin               Cell adhesion        1.5
         1639               P79385      MFGE8_PIG                 Lactadherin               Cell adhesion        1.4
          898               P20414     TIMPI_BOVIN      Metalloproteinase inhibitor 1         Enzyme            −1.4
                                                          Tetratricopeptide repeat
         1423              Q3SZV0      TTC36_BOVIN                                         Binding Protein      −1.5
                                                                   protein 36
                                                         Translation initiation factor
         1210               Q0IIF2     EI2BA_BOVIN                                         Binding Protein      −1.5
                                                            eIF-2B subunit alpha
         1225              Q9TUM0      TRFL_CAMDR              Lactotransferrin               Enzyme            −1.6
                                                           ADP-ribosylation factor
          699               A1L520     ARFG2_BOVIN                                         Binding Protein      −1.9
                                                         GTPase-activating protein 2
          358              Q9TUM0      TRFL_CAMDR              Lactotransferrin               Enzyme            −1.9
                                                         Acetyls erotonin O-methyl
          858               P10950     HIOM_BOVIN                                             Enzyme            −2.2
                                                                  transferase
                                                         Heat shock 70 kDa protein            Immune
         1103               P0CB32     HS71L_BOVIN                                                              −2.4
                                                                     1-like                    system
                                                          Butyrophilin subfamily 1
          871               P18892     BT1A1_BOVIN                                            Enzyme            −2.5
                                                                  member A1
                                                         Dual serine/threonine and
          821              Q4TVR5      DUSTY_BOVIN                                            Enzyme            −2.5
                                                           tyrosine protein kinase
          916             P26234      VINC_PIG                      Vinculin               Cell membrane        −4.8
          917            Q9TUM0     TRFL_CAMDR                 Lactotransferrin               Enzyme            −5.8
          2020, 25, x FORQ9TUM0
Molecules 864                       TRFL_CAMDR
                          PEER REVIEW                          Lactotransferrin               Enzyme            −15.8 6 of 18

      Figure
      Figure 3.  PCA plot
              3. PCA   plot of
                             of the
                                the two
                                    two first
                                         first principal
                                               principal components.    Both together
                                                          components. Both      together explained
                                                                                          explained 75.15%
                                                                                                     75.15% ofof the
                                                                                                                  the
      selected spot’s variability. Colored  dots (n = 10) and numbers   indicate   the representation of
      selected spot’s variability. Colored dots (n = 10) and numbers indicate the representation of gels gels     = 5=
                                                                                                              (n (n
      of Wadha
      5 of Wadha and
                   andn=
                       n 5= of Safra)
                            5 of      and
                                 Safra)   spot
                                        and spotproteins
                                                  proteinsnumber
                                                           number   = =60),
                                                                 (n(n    60),respectively.
                                                                               respectively.
2.3. PCA and Cluster Analysis
2.4. Classification of Proteins based on Function, Cellular Component, Pathway, and Biological Process
     The unsupervised principal component analysis (PCA) bi-plot of gels and spots (Figure 3) showed
      To gain a better understanding of the functional role of the different proteins identified in the
distinct gel grouping that agreed with the experimental groups. The PCA was performed using
data set, and to assess their degree of involvement in the Safra and Wadha MFGM samples, the
Progenesis SameSpots software to determine and visualize the samples coming from the Safra and the
PANTHER (protein analysis through evolutionary relationships) classification system
Wadha camel breeds. The PCA was performed on all 60 spot features which exhibited statistically
(http://www.pantherdb.org) was used to classify these proteins based on their known molecular
function (Figure 5A), cellular component (Figure 5B), protein class (Figure 5C), pathways (Figure 5D),
and biological process (Figure 5E). The proteins identified were found to be involved in catalytic
activity (40%) and binding (40%) concerning molecular function, metabolite interconversion enzyme
(50%) for protein class, integrin signaling pathway (25%) with respect to pathways associated, and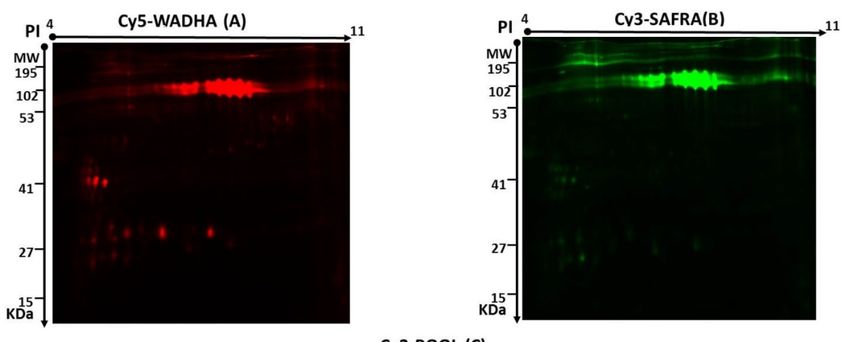
Molecules 2020, 25, 2146 6 of 17
significant (ANOVA p < 0.05) changes in abundance, identified by MS. The analyses revealed that
the two groups clustered distinctly from one another based on different proteins with a 75.15% score
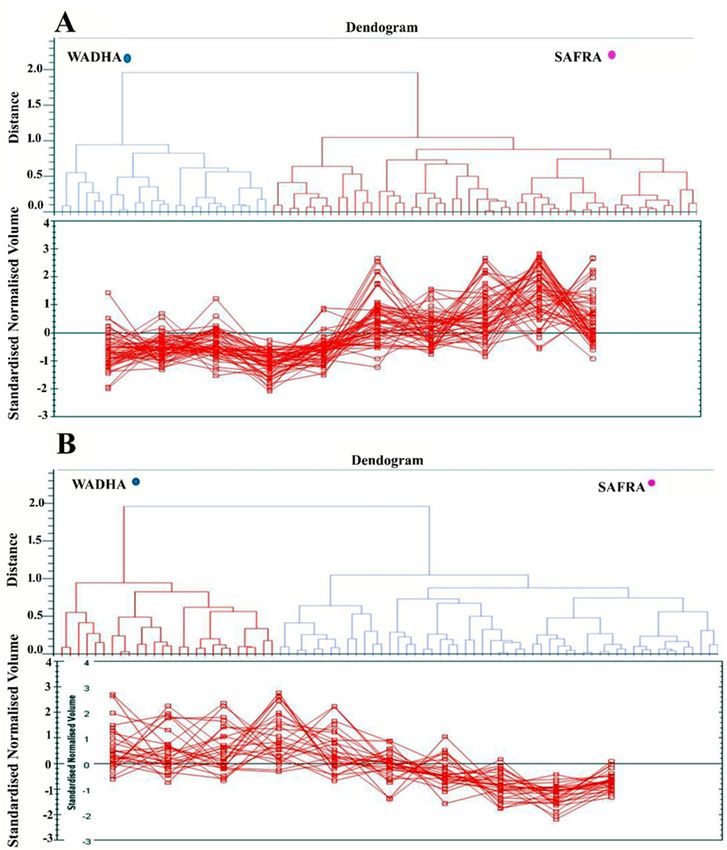
(Figure 3). The differentially abundant spots showed expression pattern clusters according to their
abundance patterns based on the hierarchical clustering analysis (Figure 4A,B). The clustering pattern
showed the change in the protein intensities for the selected spots between Safra and Wadha MFGM
samples were25,significantly
Molecules 2020, different.
x FOR PEER REVIEW 7 of 18
Figure 4.
Figure 4. Expression
Expression profiles,
profiles, separated
separated into
into clusters
clusters of
of expression
expression patterns,
patterns, indicating
indicating the
the number
number ofof
spots for
spots for each
each cluster.
cluster. Each
Each line
line represents
represents the
the standardized
standardized abundance
abundance of of aa spot
spot across
across all
all gels
gels and
and
belongs to
belongs to one
one of
of the
the clusters
clusters generated
generatedby byhierarchical
hierarchicalcluster
clusteranalysis.
analysis. (A)
(A) The
The spots
spots with
with increased
increased
abundance indicate the 31 proteins up (B). The spots with decreased abundance indicate
abundance indicate the 31 proteins up (B). The spots with decreased abundance indicate the 13 proteins the 13
proteins
down down infrom
in MFGM MFGM from
Safra Safra
breeds breeds compared
compared to Wadhato Wadha
breeds breeds (Progenesis
(Progenesis SameSpots).SameSpots).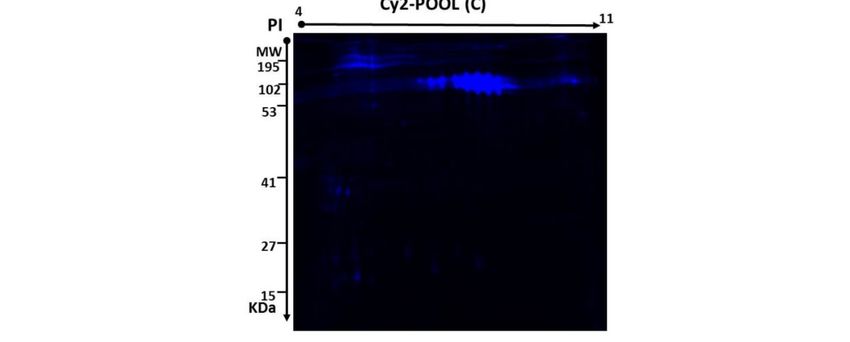
Molecules 2020, 25, 2146                                                                                             7 of 17

 2.4. Classification of Proteins Based on Function, Cellular Component, Pathway, and Biological Process
       To gain a better understanding of the functional role of the different proteins identified in
 the data set, and to assess their degree of involvement in the Safra and Wadha MFGM samples,
 the PANTHER (protein analysis through evolutionary relationships) classification system (http://www.
 pantherdb.org) was used to classify these proteins based on their known molecular function (Figure 5A),
 cellular component (Figure 5B), protein class (Figure 5C), pathways (Figure 5D), and biological process
 (Figure 5E). The proteins identified were found to be involved in catalytic activity (40%) and binding
 (40%) concerning molecular function, metabolite interconversion enzyme (50%) for protein class,
 integrin signaling pathway (25%) with respect to pathways associated, and cellular process (27.7%)
 concerning
Molecules       thex biological
          2020, 25,             process. The majority were localized within the cellular component 8(34%).
                     FOR PEER REVIEW                                                                  of 18

                   A comparative
       Figure5.5.A comparative
     Figure                          depiction
                                  depiction  (%)(%)   of identified
                                                 of identified       proteins
                                                                proteins      in MFGM
                                                                         in MFGM          fraction
                                                                                    fraction        of camel
                                                                                              of camel  milk inmilk
                                                                                                                Safrain
       Safra in comparison   to  the Wadha    categorized   into groups  according  to their  molecular
     in comparison to the Wadha categorized into groups according to their molecular function (A),       function  (A),
       cellular component   (B), protein  class (C), pathways   (D), and biological process  (E) using
     cellular component (B), protein class (C), pathways (D), and biological process (E) using the     the PANTHER
       (protein analysis through evolutionary relationships) classification system (http://www.pantherdb.org).
     PANTHER         (protein analysis through evolutionary relationships) classification system
     ( http://www.pantherdb.org
 2.5. Validation by ELISA Immunoassay  ).

       The ELISA test was used to validate the proteins in the 15 samples obtained from the Safra and
 Wadha MFGM samples. Two of the proteins identified in the 2D-DIGE experiments were validated by
 their respective antibodies (Btn and α-LA). All data were represented as mean ± standard deviation
 (SD) and p < 0.05 and fold change. The statistical results showed a significant difference in the levels of
 Btn proteins between Safra and Wadha breeds (0.6 ± 0.03 vs. 0.10 ± 0.22, p < 0.01) with a fold change of
 2.1, up in Safra breed similar to the DIGE results. This was also seen in the levels of α-LA in Safra
 and Wadha (0.73 ± 0.01 vs. 0.61 ± 0.06, p ≤ 0.01) breeds with a fold change of 1.2, up in Safra breed,
 which was quite similar to the DIGE result (Figure 6).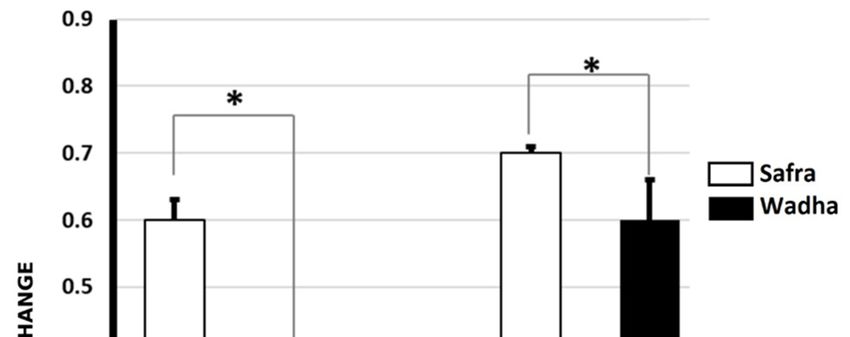
Molecules 2020, 25, 2146 8 of 17
Molecules 2020, 25, x FOR PEER REVIEW 9 of 18
Figure 6. ELISA immunoassay results showed significant differences in the levels of Btn proteins
Figure 6. ELISA immunoassay results showed significant differences in the levels of Btn proteins
between Safra and Wadha breeds (0.6 ± 0.03 vs. 0.10 ± 0.22, p ≤ 0.01) with a fold change of 2.1, up in
between Safra and Wadha breeds (0.6 ± 0.03 vs. 0.10 ± 0.22, P ≤ 0.01) with a fold change of 2.1, up in
Safra similar to the DIGE results. This was also seen in the levels of α-LA in Safra and Wadha (0.73 ±
Safra similar to the DIGE results. This was also seen in the levels of α-LA in Safra and Wadha (0.73 ±
0.01 vs. 0.61 ± 0.06, p < 0.01) breeds with a fold change of 1.2 up in Safra breed which was quite similar
0.01 vs. 0.61 ± 0.06, p < 0.01) breeds with a fold change of 1.2 up in Safra breed which was quite similar
to the DIGE result. * p ≤ 0.01.
to the DIGE result.
3. Discussion and Conclusions
3. Discussion and Conclusions
The MFGM is a complex membrane derived from the mammary epithelial cell which surrounds
The
the fat MFGM is
droplets, a complex
mainly membrane
triglycerides, inderived
the milk. fromThethemembrane
mammaryisepithelial
enrichedcellwithwhich surrounds
sphingolipids,
the fat droplets, mainly triglycerides, in the milk. The membrane is enriched
cholesterol, glycerophospholipids, and proteins. Some of these proteins are glycosylated which play with sphingolipids,
cholesterol,
an importantglycerophospholipids, andduring
role in biological function proteins.
the Some
lactationof these
periodproteins areand
[13,25,26] glycosylated
are diversewhich play
in different
an important
species. Severalrole in biological
reports suggestedfunction
that theduring
structurethe lactation period
and bioactive [13,25,26] and
components are
of the MFGMdiverse in
play
different species. Several reports suggested that the structure and bioactive components
a crucial role in infant gut maturation, neurological development, modulating cholesterol and lipid of the MFGM
play a crucial
uptake, immunity role[40],
in infant gut maturation,
and metabolism neurological
[41]. Moreover, thedevelopment,
MFGM proteins modulating
may have an cholesterol
essential androle
lipid uptake, immunity [40], and metabolism [41]. Moreover, the MFGM
in shaping gut microbial populations, which in turn may provide various health benefits including proteins may have an
essential role in shaping gut microbial populations, which in turn may
immune defense [42] and inflammatory diseases early in life [43,44]. Furthermore, MFGM is known to provide various health
benefits anti-carcinogenic
possess including immunepotential.
defense [42]
For and inflammatory
instance, MFGM isdiseases
capableearly in life [43,44].
of inducing apoptosisFurthermore,
in human
MFGM
colon cancer cells (HT-29) via the reduction of cell proliferation and increasing the caspase-3inducing
is known to possess anti-carcinogenic potential. For instance, MFGM is capable of activity,
apoptosis
which known in human
as one colon
of the cancer cells (HT-29)
programmed via marker,
cell death the reduction of cell
cell cycle proliferation
arrest in S phase,and increasing
increasing the
the caspase-3
apoptotic activity,
protein which known asthe
Bax, downregulating oneanti-apoptotic
of the programmed proteincell death
Bcl-2, andmarker,
decreasingcell mitochondrial
cycle arrest in
S phase, increasing
membrane potential.the apoptotic
The protein that
data suggested Bax,some
downregulating
of the MFGMs the could
anti-apoptotic
be used as protein
potentialBcl-2, and
agents
decreasing mitochondrial membrane
for human colon cancer prevention [45,46]. potential. The data suggested that some of the MFGMs could
be used
Theascurrent
potential agents
study for human
identified colon cancer
44 proteins of MFGM prevention [45,46].expressed in Safra and Wadha.
differentially
The current study identified 44 proteins of MFGM
Of these proteins, 31 were up-regulated and 13 down-regulated between differentially expressed
SafrainandSafra and Wadha.
Wadha breeds.
Of these proteins, 31 were up-regulated and 13 down-regulated between
Among these proteins, two proteins, butyrophilin subfamily 1 member A1 (BTN) and α-lactalbumin Safra and Wadha breeds.
Among these
(alpha-LA), proteins,
were two by
validated proteins,
ELISA.butyrophilin subfamily 1 member A1 (BTN) and α-lactalbumin
(alpha-LA), were validated by
Butyrophilin is one of the most ELISA.
abundant MFGM proteins expressed in lactating mammary glands
and isButyrophilin is one ofof
a major component the most abundant
MFGM [47]. BTN MFGM proteins
is a member expressed
of the B7-like in lactating
proteins mammary
family and is
glands and is a major component of MFGM [47]. BTN is a member of the B7-like
encoded by a single gene located telomeric to the HLA complex [48] consisting of two extracellular proteins family and
is encoded by a single gene located telomeric to the HLA complex [48] consisting of two extracellular
immunoglobulin domains constant IgC, and variable IgV and a transmembrane region [47]. It isMolecules 2020, 25, 2146 9 of 17
immunoglobulin domains constant IgC, and variable IgV and a transmembrane region [47]. It is
considered as immune system regulator due to is present in immune cells such as lymphocytes,
macrophages, monocytes and others [49] and is expressed by thymic stromal cells and inhibits
proliferation and cytokine production of stimulated CD4+ and CD8+ T cells [32]. Several studies
indicate that BTN influences the clinical outcome of autoimmune responses to myelin oligodendrocyte
glycoprotein, an important antigenic target in experimental autoimmune encephalomyelitis and in the
etiology of multiple sclerosis [50,51].
We identified numerous spots relating to the protein α-lactalbumin. It is known to form peptides,
some of which have biological activities during digestion. This protein has a specific binding site for
calcium and other for essential trace elements including iron and zinc [52]. Peptides from α-lactalbumin
can facilitate the uptake of essential micronutrients by the intestinal mucosal cell [53]. Several studies
indicate that humans, as well as α-lactalbumin from many primate milks, are lethal to tumor cells, as
they result in death to the cancer cells through apoptosis without affecting the healthy cells [54–58].
In humans, α-lactalbumin can reduce the occurrence of cancer in breastfeeding children by removing
tumor cells from the gut of the neonate by inducing apoptosis in tumor cells but spares healthy
cells [55,56]. Meanwhile, camel α-lactalbumin was shown to be more disordered and possessed
stronger aggregation propensities [52,59]. The structural differences between the camel and bovine
α-lactalbumin were preserved and in some cases increased in their oleic acid complexes, which mainly
increased in its lethality against tumor cells [52]. Our data shows that α-lactalbumin is overexpressed
in the Safra breed with a 2.8-fold change in contrast to the Wadha breed.
Other proteins identified in our study include tetratricopeptide repeat protein 36 (TTC36
also named HBP21) which is capable of inducing apoptosis via the translocation of Bax from
cytoplasm-to-mitochondria which leads to increase the cleaved of caspase-3, caspase-9, and poly (ADP
ribose) polymerase tumor cells including hepatocellular carcinoma [60]. Moreover, HBP21 might be
involved in the inhibition of progression and metastasis of breast cancer cells [61].
MFGM in camel milk not only has nutrient value but also involves cancer cell elimination
properties. The milk obtained from the Wadha breeds showed increased spots relating to lactoferrin,
vinculin, dual serine/threonine and tyrosine protein kinase (DUSTY_BOVIN), heat shock 70-kDa
protein-1-like (HSPA1L), and Tax1 (human T-cell leukemia virus type I)-binding protein 1 (TAX1BP1).
Lactoferrin (Lf, also known as lactotransferrin) is an iron-binding glycoprotein that belongs to the
transferrin protein family [62] and has several biological functions including anti-bacterial, anti-viral,
anti-inflammatory, and anti-tumor [8,10]. This protein is highly expressed in Wadha breeds compared
to Safra breeds.
The protein vinculin has also been shown to be protective against different cancers and loss
of vinculin has been shown to be involved in the development of various cancers including breast
cancer [63], squamous carcinoma [64], and colorectal cancer (CRC) [65]. This implies that vinculin may
have anti-tumor effects. Our data showed that vinculin is overexpressed in Wadha breeds in contrast to
Safra breeds. DUSTY_BOVIN is known as RIP5 involves inactivation of p38, JNK, NF-κB, and induces
both caspase-dependent apoptosis and caspase-independent cell death [66]. The current results reveal
that RIP5 is overexpressed with a 2.5-fold change in Wadha compared to Safra milk. HSPA1L acts
as a cellular prion protein stabilizer in CRC progression tumorigenicity in vivo. HSPA1L expression
stabilized hypoxia-inducible factor-1α (HIF-1α) protein and promoted the cellular prion protein
(PrPC) accumulation through the HSPA1L/HIF-1α/GP78 axis [67]. The presented results showed
that the HSPA1L is expressed with a 2.4-fold change in Wadha contrast to Safra milk. Heat shock
binding protein 21 (HBP21), also known as Tetratricopeptide Repeat Domain 36 (TTC36), is known
to inhibit tumor cell growth rate and tumor formation in nude mice when it was transfected into
hepatocellular carcinoma. HBP21 can inhibit the interaction of HSP70 and Bax. As a result, Bax will be
translocated cytoplasm-to-mitochondria and then induce apoptosis through the releasing cytochrome c
and activating caspase-3 and caspase-9 [60]. Another study in breast cancer showed that the interaction
of Hsp70 and HBP21 is might capable of the inhibition of progression and metastasis of this cancer [61].Molecules 2020, 25, 2146 10 of 17
In our data, the expression of HBP21 was overexpressed in Safra with a 2.6-fold change compared to
Wadha milk.
Not only a complex of human α-lactalbumin and oleic acid (HAMLET), but bovine (BAMLET)
and camel (CAMLET) acts as a potent and differential anticancer agent [57]. BAMLET and
CAMELT are capable of activation of the caspase-independent lysosomal cell death pathway in
highly apoptosis-resistant tumor cells [57,58,68]. Furthermore, HAMLET can trigger apoptosis of
bladder cancer cells in vivo bladder [69], human glioblastoma [70], and not affecting health cells even
when high concentrations of HAMLET is used. Besides, Li X. et al. demonstrated that α-lactalbumin
promoters might be able to regulate the replication of adenovirus to target hormone-independent breast
cancers. As a result, the α-lactalbumin promoter might be used to create a novel therapeutic target
for hormone-independent breast cancer [71]. Our data indicated that α-lactalbumin is overexpressed
with a 2.8-fold change in Safra in contrast with Wadha milk. Tax1 (human T-cell leukemia virus
type I)-binding protein 1 (TAX1BP1) is collaborating with A20 binding inhibitor of NF-κB 1 (ABIN1).
This leads to the negative regulator of antiviral signaling [72]. Additionally, TAX1BP1 plays a crucial
role in protecting cells from virus-induced apoptosis [73]. Our data revealed that the expression
of TAX1BP1 is 2.5-fold in Safra higher compared to Wadha milk. This may indicate that drinking
Wadha milk might provide more immunity and protection against infections than drinking Safra milk.
Identification of all of these proteins indicates that drinking Wadha milk may have more anti-tumor
activity compared to Safra milk.
4. Materials and Methods
4.1. Camel Milk Samples Collection
Camel milk (250 mL) was collected from 10–15 healthy camels of the two breeds (Wadha and Safra)
reared in the same area with similar conditions of nutrition and stage of lactation. Characteristics of the
two Saudi Arabian camel breeds Safra and Wadha and the respective milk samples obtained from them
are shown in Table S2. All samples were taken from the farms in the Jeddah city area, Saudi Arabia.
The samples were collected in clean sterilized 0.5 L bottles and transferred immediately to the lab in
the temperature-controlled icebox. On arrival to the lab, 0.1% sodium azide was added to each sample
and gently mixed together to prevent microbial growth and contamination of samples. The samples
were then aliquoted in 50 mL labeled falcon tubes and stored in −20 ◦ C freezer until further analysis
4.2. Preparation of MFGM Samples
Five samples (50 mL) of camel milk from the two breeds (Safra and Wadha) were taken.
The temperature of samples was controlled at 2–8 ◦ C during the procedures according to Saadaoui
et al. (2013) and Pisanu et al. (2012) [39,74] with minor modifications. Briefly, the samples were
centrifuged at 4000 rpm for 35 min to separate the creamy layer which was transferred to a new 50 mL
falcon. The milk fat quantity was measured to maintain and 1M PBS (4.3 mM Na2 HPO4 , 2.7 mM
KCl, 1.8 mM KH2 PO4 , 137 mM NaCl and pH adjusted to 7.4) was added 5 times and kept in a 37 ◦ C
PBS water bath for 20 min with regular shaking to melt the milk fat and separate cluster of sample.
The sample was further centrifuged at 4000× g rpm for 35 min twice with PBS and one time with MilliQ
water to remove residual casein and whey proteins. After each washing step, the milk fat sample was
transferred into a new falcon tube. At the end of the washing process, the sample was kept at 2–8 ◦ C
overnight. The next day the samples were mixed with sterile plastic beads using a vortex mixer at
60 hertz (Hz) for 3 min for homogenization. The samples were warmed up to 37 ◦ C using a water
bath for 10 min and centrifuged at 4000× g rpm for 30 min to separate the MFGM from the top oily
yellow fat layer which was further discarded. The white pellets remaining in the tube were the MFGM
component, they were weighed and stored at −20 ◦ C freezer until further analysis [39,74].Molecules 2020, 25, 2146 11 of 17
4.3. Extraction of MFGM Proteins
The extraction of MFGM was done as described previously [75,76] with some modifications.
Briefly, the MFGM pellets were incubated with lysis buffer (pH 8.8, 30 Mm Tris buffer containing 7 M
urea, 2 M thiourea, 2% Chaps, 1× protease inhibitor mix), for 1 h with periodic vortexing. Samples were
then incubated in a water bath for 5 min at 95 ◦ C and centrifuged at 12,000× g for 15 min. Then,
50 Mm dithiothreitol (DTT) was next added and the lysates were centrifuged again (20,000× g, 40 min,
4 ◦ C) to obtain the solubilized proteins. The solubilized proteins in the supernatant were collected
and precipitated using a 2D clean-up kit according to the manufacturer’s protocol (GE Healthcare,
USA) and the pH of the samples was adjusted to 8.5 using NaOH (100 mM) before 2D-DIGE analysis.
The protein concentration of each sample was then determined in triplicate using the 2D-Quant Kit
(GE Healthcare, Chicago, IL, USA).
4.4. D-DIGE and MALDI-TOF Analysis
4.4.1. Sample Labeling with Cyanine Dyes
Proteins were labeled according to the manufacturer (GE Healthcare, Chicago, IL, USA). Briefly,
50 µg of milk MFGM-Wadha (n = 5) and milk MFGM-safra (n = 5) protein extract samples were
minimally labeled with CyDye™ DIGE Samples and incubated on ice for 30 min in the dark. The labeling
reaction was terminated by adding 1 µL of 10 mM lysine. Each MFGM samples from Safra and Wadha
were covalently labeled with a fluorophore, either Cy3 or Cy5. A mixture of an equal amount of all
samples was pooled, labeled with Cy2, and used as an internal standard. A dye switching strategy
was applied during labeling to avoid dye-specific bias (Table S3, Supplementary materials).
4.4.2. One- and Two-Dimensional Difference Electrophoresis (2D-DIGE)
One-dimensional analytical gel electrophoresis was performed using Immobiline Dry Strips (24 cm,
pH 3-11; GE Healthcare, Sweden) and then the IPG strips were equilibrated, first with dithiothreitol
(DTT) (15 min, RT, gentle stirring, 5 mM Tris–HCl, pH 8.8, 6M urea, 30% glycerol, 2% SDS 65 mM).
Strips were then equilibrated for 15 min in the same solution containing 250 mM iodoacetamide (IAA).
followed by second-dimension sodium dodecyl sulfate polyacrylamide gel electrophoresis (SDS-PAGE)
performed on 12.5% fixed gels using an Ettan Dalt Six device (GE Healthcare, Sweden) were carried out
as previously described by Alfadda et al. [77]. Further, the 2D-DIGE gels were scanned on the Typhoon
9410 scanner using excitation/emission wavelengths specific for Cy2 (488/520 nm), Cy3 (532/580 nm),
and Cy5 (633/670 nm).
4.4.3. Statistical Analysis
The 2D-DIGE gel images were uploaded into Progenesis “SameSpots” software (Nonlinear
Dynamics UK) and were analyzed applying an automated spot detection method. The analysis
compared the Safra and Wadha MFGM samples. Although the automatic analysis was performed to
detect all the spots across all the 5 gels, each selected spot was verified and manually edited wherever
necessary. Normalized volumes were used to identify spots that were differentially expressed. A cut-off
ratio ≥ of 1.5-fold was considered. ANOVA was used to calculate statistically significant differences
between groups. p < 0.05 was considered statistically significant.
4.4.4. Protein Identification by MALDI-TOF MS
Coomassie-stained gel spots from the preparatory gel were washed and digested according to
previously described methods [76–78]. The mixture of tryptic peptides (1 µL) derived from each protein
was spotted onto a MALDI target (384 Anchorchip MTP 800 µm Anchorchip; Bruker Daltonik, Bremen,
Germany). MALDI-MS(/MS) spectra were obtained using an ultrafleXtreme time-of-flight (TOF) mass
spectrometer equipped with a LIFT-MS/MS device (Bruker Daltonics) instrument as described [75,79]Molecules 2020, 25, 2146 12 of 17
at a reflector voltage of 21 kV and the detector voltage of 17 kV. Peptide mass fingerprints (PMF)
were calibrated against a standard (peptide calibration standard II, Bruker Daltonics). The PMFs
were assessed using Flex Analysis software (version 2.4, Bruker Daltonics). MS data were interpreted
by using BioTools version 3.2 (Bruker Daltonics). The peptide masses were searched against the
Mascot search algorithm (version 2.0.04 updated 09/05/2019; Matrix Science Ltd., London, UK).
Identified proteins were screened for a Mascot score of higher than 56 and p < 0.05.
4.5. Gene Ontology Enrichment Analysis
The accession ID obtained from the UniProt gene ontology system for annotation was further
uploaded in PANTHER (protein analysis through evolutionary relationships) classification system
(http://www.pantherdb.org) to classify the identified proteins into different functional categories.
The results for molecular function, cellular components, protein class, biological process, and pathways
were exported and pie charts and bar graphs were designed using Microsoft Excel. The graphs
generated depict different categories compared to percent of gene hit against total function hits (from
data obtained from PANTHER).
4.6. ELISA Immunoassay Validation for Selected MFGM Proteins
The sandwich ELISA was carried out using the previously described method by El-Fakharany et
al. (2017) with modification [1]. Briefly, high binding ELISA microplates were coated with 50 µL of
coating solution in duplicate manner (coating buffer; 3.03 g of Na2 CO3 mixed with 6.0 g of NaHCO3 to
make 1 L, pH 9.6) and MFGM protein samples from Safra and Wadha were added at a concentration of
2.2 µg/mL. The plates were sealed and incubated for a period of 3 h at 37 ◦ C in a controlled incubator
followed by washing steps (3 times with 10 mMTris pH 8.8, 0.01% Tween 20 and 0.5% gelatin, using
automated microplate washer (BIO-TEK, ELx50)). The plates were inverted and blotted on clean
adsorbing paper to remove any residual washing solution. Afterwards, 50 µL blocking buffer (2%
gelatin and 0.1% Tween 20 in 10 mMTris) was added to each well in the ELISA microplates, followed by
second incubation for 1 h at 37 ◦ C. The 2 primary monoclonal antibodies (Btn, and α-LA) obtained
from DSHB (created by the Eunice Kennedy Shriver National Institute of Child Health and Human
Development of the National Institutes of Health (NIH) and maintained at The University of Iowa,
Department of Biology, Iowa City, IA 52242, USA) were used. Then, 50 µL of these monoclonal
antibodies were added in duplicate manner to each sample in the ELISA microplates at a concentration
of 0.5 µg/mL, and incubated at 37 ◦ C for 2 h. The plates were washed 3 times and 50 µL of secondary
antibodies (goat anti-mouse IgG H&L (HRP) ab97023, Abcam and goat anti-rabbit IgG H&L (HRP)
31460, Thermo Fisher Scientific, United States) were added at a concentration of 1:50,000 after diluting
with wash buffer. The plates were incubated for 1 h at 37 ◦ C and 50 µL of TMB substrate was added
and incubated in dark ambient temperature for 20 min. Lastly, 50 µL of stop solution (1M H2 SO4 )
was added and the plates were read within 5 min by a microplate reader (BioTek, ELx800) at 450 nm
wavelength [1]. All data were calculated and represented as mean ± standard deviation (SD).
4.7. Hierarchical Clustering and Statistical Analysis
Proteins were grouped by their expression patterns using hierarchical clustering by a commercial
Progenesis “SameSpots” software (Nonlinear Dynamics, UK). This unsupervised, multivariate analysis
provides a true snapshot of protein activity across an experiment and shows the expression profiles for
all the significant proteins, increased or decreased in abundance, across all the samples. The results
are shown in an interactive dendrogram tree where similar expression profiles cluster together.
Data can be explored at group level on the dendrogram, and the corresponding expression profiles
(http://www.nonlinear.com/products/progenesis/stats/overview/).
Statistical analysis of experimental data was performed using SPSS (IBM Corp. Released 2012.
IBM SPSS Statistics for Windows, Version 21.0. Armonk, NY: IBM Corp., Armonk, NY, USA).Molecules 2020, 25, 2146 13 of 17
Supplementary Materials: The following are available online, Table S1: Mass spectrometry list of significant
differentially abundant proteins, Table S2: Experimental design.
Author Contributions: E.M.R. conceived the idea, H.B., A.M., I.O.A. and A.A.A. designed the study. B.H.S. and
H.A.A. were involved in camel milk sampling. H.B., A.M., I.O.A. and B.H.S. performed the proteomics lab work.
H.B., A.M., I.O.A., B.H.S., E.M.R. and A.A.A. did data analysis and wrote the manuscript. All authors have read
and agreed to the published version of the manuscript.
Funding: The authors would like to extend their sincere appreciation to the Deanship of Scientific Research at
King Saud University for funding this research through the Research Group Project No. RGP-334.
Acknowledgments: The authors would like to extend their sincere appreciation to the Deanship of Scientific
Research at King Saud University.
Conflicts of Interest: The authors declare no conflicts of interest.
References
1. El-Fakharany, E.M.; El-Baky, N.A.; Linjawi, M.H.; Aljaddawi, A.A.; Saleem, T.H.; Nassar, A.Y.; Osman, A.;
Redwan, E.M. Influence of camel milk on the hepatitis C virus burden of infected patients. Exp. Ther. Med.
2017, 13, 1313–1320. [CrossRef] [PubMed]
2. Cissé, H.; Muandze-Nzambe, J.U.; Somda, N.S.; Sawadogo, A.; Drabo, S.M.; Tapsoba, F.; Zongo, C.; Traoré, Y.;
Savadogo, A. Assessment of safety and quality of fermented milk of camels, cows, and goats sold and
consumed in five localities of Burkina Faso. Vet. World 2019, 12, 295. [CrossRef] [PubMed]
3. Cardoso, R.R.; Santos, R.; Cardoso, C.; Carvalho, M. Consumption of camel’s milk by patients intolerant to
lactose. A preliminary study. Revista Alergia de Mexico 2010, 57, 26–32.
4. El-Fakharany, E.M.; Tabll, A.; El-Wahab, A.A.; Haroun, B.M.; Redwan, E.R.M. Potential activity of camel
milk-amylase and lactoferrin against hepatitis C virus infectivity in HepG2 and lymphocytes. Hepat. Mon.
2008, 8, 101–109.
5. Faris, M.; Ghazzawi, H. Health-Improving and Disease-Preventing Potential of Camel Milk against Chronic Diseases
and Autism: Camel Milk and Chronic Diseases; IGI Global: Hershey, PA, USA, 2020; pp. 155–184.
6. Mirmiran, P.; Ejtahed, H.S.; Angoorani, P.; Eslami, F.; Azizi, F. Camel Milk Has Beneficial Effects on Diabetes
Mellitus: A Systematic Review. Int. J. Endocrinol. Metab. 2017, 15, e42150. [CrossRef]
7. Mihic, T.; Rainkie, D.; Wilby, K.J.; Pawluk, S.A. The Therapeutic Effects of Camel Milk: A Systematic Review
of Animal and Human Trials. J. Evid.-Based Complement. Altern. Med. 2016, 21, Np110–Np126. [CrossRef]
8. Albar, A.H.; Almehdar, H.A.; Uversky, V.N.; Redwan, E.M. Structural heterogeneity and multifunctionality
of lactoferrin. Curr. Protein Pept. Sci. 2014, 15, 778–797. [CrossRef]
9. Almehdar, H.A.; El-Baky, N.A.; Alhaider, A.A.; Almuhaideb, S.A.; Alhaider, A.A.; Albiheyri, R.S.;
Uversky, V.N.; Redwan, E.M. Bacteriostatic and Bactericidal Activities of Camel Lactoferrins Against
Salmonella enterica Serovar Typhi. Probiotics Antimicrob. Proteins 2019, 12, 18–31. [CrossRef]
10. El-Fakharany, E.M.; Uversky, V.N.; Redwan, E.M. Comparative Analysis of the Antiviral Activity of Camel,
Bovine, and Human Lactoperoxidases against Herpes Simplex Virus Type 1. Appl. Biochem. Biotechnol. 2017,
182, 294–310. [CrossRef]
11. Redwan, E.M.; Uversky, V.N.; El-Fakharany, E.M.; Al-Mehdar, H. Potential lactoferrin activity against
pathogenic viruses. Comptes Rendus Biol. 2014, 337, 581–595. [CrossRef]
12. Redwan, E.M.; El-Baky, N.A.; Al-Hejin, A.M.; Baeshen, M.N.; Almehdar, H.A.; Elsaway, A.; Gomaa, A.B.;
Al-Masaudi, S.B.; Al-Fassi, F.A.; AbuZeid, I.E.; et al. Significant antibacterial activity and synergistic effects of
camel lactoferrin with antibiotics against methicillin-resistant Staphylococcus aureus (MRSA). Res. Microbiol.
2016, 167, 480–491. [CrossRef] [PubMed]
13. Lee, H.; Padhi, E.; Hasegawa, Y.; Larke, J.; Parenti, M.; Wang, A.; Hernell, O.; Lönnerdal, B.; Slupsky, C.
Compositional dynamics of the milk fat globule and its role in infant development. Front. Pediatr. 2018, 6,
313. [CrossRef] [PubMed]
14. Redwan, E.M.; Alkarim, S.A.; El-Hanafy, A.A.; Saad, Y.M.; Almehdar, H.A.; Uversky, V.N. Variability of
Some Milk-Associated Genes and Proteins in Several Breeds of Saudi Arabian Camels. Protein J. 2018, 37,
333–352. [CrossRef] [PubMed]
15. Reinhardt, T.A.; Lippolis, J.D. Bovine milk fat globule membrane proteome. J. Dairy Res. 2006, 73, 406–416.
[CrossRef]Molecules 2020, 25, 2146 14 of 17
16. McManaman, J.L.; Neville, M.C. Mammary physiology and milk secretion. Adv. Drug Deliv. Rev. 2003, 55,
629–641. [CrossRef]
17. Keenan, T.W.; Patton, S. The structure of milk: Implications for sampling and storage: A. The milk lipid
globule membrane. In Handbook of Milk Composition; Elsevier: Amsterdam, The Netherlands, 1995; pp. 5–50.
18. Peterson, J.A.; Patton, S.; Hamosh, M. Glycoproteins of the human milk fat globule in the protection of the
breast-fed infant against infections. Neonatology 1998, 74, 143–162. [CrossRef]
19. Imam, A.; Drushella, M.M.; Taylor, C.R.; Tökés, Z.A. Preferential expression of a Mr 155,000 milk-fat-globule
membrane glycoprotein on luminal epithelium of lobules in human breast. Cancer Res. 1986, 46 (12 Part 1),
6374–6379.
20. Snow, D.R.; Jimenez-Flores, R.; Ward, R.E.; Cambell, J.; Young, M.J.; Nemere, I.; Hintze, K.J. Dietary milk fat
globule membrane reduces the incidence of aberrant crypt foci in Fischer-344 rats. J. Agric. Food Chem. 2010,
58, 2157–2163. [CrossRef]
21. Brink, L.R.; Herren, A.W.; McMillen, S.; Fraser, K.; Agnew, M.; Roy, N.; Lonnerdal, B. Omics analysis reveals
variations among commercial sources of bovine milk fat globule membrane. J. Dairy Sci. 2020, 103, 3002–3016.
[CrossRef]
22. De Almagro Garcia, M.C.; Moreno Munoz, J.A.; Jimenez Lopez, J.; Rodriguez-Palmero Seuma, M.
New ingredients in infant formula. Health Funct. Benefits Nutr. Hosp. 2017, 34 (Suppl. 4), 8–12.
23. Demmelmair, H.; Prell, C.; Timby, N.; Lonnerdal, B. Benefits of Lactoferrin, Osteopontin and Milk Fat Globule
Membranes for Infants. Nutrients 2017, 9, 817. [CrossRef] [PubMed]
24. Fil, J.E.; Fleming, S.A.; Chichlowski, M.; Gross, G.; Berg, B.M.; Dilger, R.N. Evaluation of Dietary
Bovine Milk Fat Globule Membrane Supplementation on Growth, Serum Cholesterol and Lipoproteins,
and Neurodevelopment in the Young Pig. Front. Pediatr. 2019, 7, 417. [CrossRef] [PubMed]
25. Hernell, O.; Timby, N.; Domellof, M.; Lonnerdal, B. Clinical Benefits of Milk Fat Globule Membranes for
Infants and Children. J. Pediatr. 2016, 173, S60–S65. [CrossRef] [PubMed]
26. Hernell, O.; Domellof, M.; Grip, T.; Lonnerdal, B.; Timby, N. Physiological Effects of Feeding Infants and Young
Children Formula Supplemented with Milk Fat Globule Membranes. In Human Milk: Composition, Clinical
Benefits and Future Opportunities; Nestle Nutrition Institute workshop series; Karger: Basel, Switzerland, 2019;
Volume 90, pp. 35–42.
27. Huang, S.; Wu, Z.; Liu, C.; Han, D.; Feng, C.; Wang, S.; Wang, J. Milk Fat Globule Membrane
Supplementation Promotes Neonatal Growth and Alleviates Inflammation in Low-Birth-Weight Mice
Treated with Lipopolysaccharide. Biomed Res. Int. 2019, 2019, 4876078. [CrossRef]
28. Juvarajah, T.; Wan-Ibrahim, W.I.; Ashrafzadeh, A.; Othman, S.; Hashim, O.H.; Fung, S.Y.; Abdul-Rahman, P.S.
Human Milk Fat Globule Membrane Contains Hundreds of Abundantly Expressed and Nutritionally
Beneficial Proteins That Are Generally Lacking in Caprine Milk. Breastfeed. Med. 2018, 13, 631–637.
[CrossRef]
29. Lucey, J.A.; Otter, D.; Horne, D.S. A 100-Year Review: Progress on the chemistry of milk and its components.
J. Dairy Sci. 2017, 100, 9916–9932. [CrossRef]
30. Norris, T.; Souza, R.; Xia, Y.; Zhang, T.; Rowan, A.; Gallier, S.; Zhang, H.; Qi, H.; Baker, P. Effect of
supplementation of complex milk lipids in pregnancy on fetal growth: Results from the Complex Lipids
in Mothers and Babies (CLIMB) randomized controlled trial. J. Matern.-Fetal Neonatal Med. 2019, 1–10.
[CrossRef]
31. Davies, C.R.; Morris, J.S.; Griffiths, M.R.; Page, M.J.; Pitt, A.; Stein, T.; Gusterson, B.A. Proteomic analysis of
the mouse mammary gland is a powerful tool to identify novel proteins that are differentially expressed
during mammary development. Proteomics 2006, 6, 5694–5704. [CrossRef]
32. Yamazaki, T.; Goya, I.; Graf, D.; Craig, S.; Martin-Orozco, N.; Dong, C. A butyrophilin family member
critically inhibits T cell activation. J. Immunol. 2010, 185, 5907–5914. [CrossRef]
33. Ji, X.; Li, X.; Ma, Y.; Li, D. Differences in proteomic profiles of milk fat globule membrane in yak and cow
milk. Food Chem. 2017, 221, 1822–1827. [CrossRef]
34. Sui, S.; Zhao, J.; Wang, J.; Zhang, R.; Guo, C.; Yu, T.; Li, N. Comparative proteomics of milk fat globule
membrane proteins from transgenic cloned cattle. PLoS ONE 2014, 9, e105378. [CrossRef] [PubMed]
35. Cebo, C.; Caillat, H.; Bouvier, F.; Martin, P. Major proteins of the goat milk fat globule membrane. J. Dairy Sci.
2010, 93, 868–876. [CrossRef] [PubMed]Molecules 2020, 25, 2146 15 of 17
36. Cebo, C.; Rebours, E.; Henry, C.; Makhzami, S.; Cosette, P.; Martin, P. Identification of major milk fat globule
membrane proteins from pony mare milk highlights the molecular diversity of lactadherin across species.
J. Dairy Sci. 2012, 95, 1085–1098. [CrossRef] [PubMed]
37. Murgiano, L.; Timperio, A.M.; Zolla, L.; Bongiorni, S.; Valentini, A.; Pariset, L. Comparison of milk fat
globule membrane (MFGM) proteins of Chianina and Holstein cattle breed milk samples through proteomics
methods. Nutrients 2009, 1, 302–315. [CrossRef] [PubMed]
38. da Costa, W.K.A.; de Souza, E.L.; Beltrao-Filho, E.M.; Vasconcelos, G.K.V.; Santi-Gadelha, T.; de Almeida
Gadelha, C.A.; Franco, O.L.; do Egypto, R.d.C.R.; Magnani, M. Comparative protein composition analysis
of goat milk produced by the Alpine and Saanen breeds in northeastern Brazil and related antibacterial
activities. PLoS ONE 2014, 9, e93361. [CrossRef] [PubMed]
39. Saadaoui, B.; Henry, C.; Khorchani, T.; Mars, M.; Martin, P.; Cebo, C. Proteomics of the milk fat globule
membrane from C amelus dromedarius. Proteomics 2013, 13, 1180–1184. [CrossRef]
40. Nilsson, Å. Role of sphingolipids in infant gut health and immunity. J. Pediatr. 2016, 173, S53–S59. [CrossRef]
41. Lee, H.; Zavaleta, N.; Chen, S.-Y.; Lönnerdal, B.; Slupsky, C. Effect of bovine milk fat globule membranes as
a complementary food on the serum metabolome and immune markers of 6-11-month-old Peruvian infants.
NPJ Sci. Food 2018, 2, 1–9. [CrossRef]
42. Liao, Y.; Alvarado, R.; Phinney, B.; Lönnerdal, B. Proteomic characterization of human milk fat globule
membrane proteins during a 12 month lactation period. J. Proteome Res. 2011, 10, 3530–3541. [CrossRef]
43. Pacheco, A.R.; Barile, D.; Underwood, M.A.; Mills, D.A. The impact of the milk glycobiome on the neonate
gut microbiota. Annu. Rev. Anim. Biosci. 2015, 3, 419–445. [CrossRef]
44. Georgi, G.; Bartke, N.; Wiens, F.; Stahl, B. Functional glycans and glycoconjugates in human milk. Am. J.
Clin. Nutr. 2013, 98, 578S–585S. [CrossRef] [PubMed]
45. Ji, X.; Xu, W.; Cui, J.; Ma, Y.; Zhou, S. Goat and buffalo milk fat globule membranes exhibit better effects at
inducing apoptosis and reduction the viability of HT-29 cells. Sci. Rep. 2019, 9, 1–14. [CrossRef] [PubMed]
46. Zanabria, R.; Tellez, A.M.; Griffiths, M.; Corredig, M. Milk fat globule membrane isolate induces apoptosis in
HT-29 human colon cancer cells. Food Funct. 2013, 4, 222–230. [CrossRef] [PubMed]
47. Redwan, E.M.; Al-Hejin, A.M.; Almehdar, H.A.; Elsaway, A.M.; Uversky, V.N. Prediction of Disordered
Regions and Their Roles in the Anti-Pathogenic and Immunomodulatory Functions of Butyrophilins.
Molecules 2018, 23, 328. [CrossRef]
48. Guggenmos, J.; Schubart, A.S.; Ogg, S.; Andersson, M.; Olsson, T.; Mather, I.H.; Linington, C.
Antibody Cross-Reactivity between Myelin Oligodendrocyte Glycoprotein and the Milk Protein Butyrophilin
in Multiple Sclerosis. J. Immunol. 2004, 172, 661–668. [CrossRef]
49. Malinowska, M.; Tokarz-Deptuła, B.; Deptuła, W. Butyrophilins: An important new element of resistance.
Cent.-Eur. J. Immunol. 2017, 42, 399. [CrossRef]
50. Stefferl, A.; Schubart, A.; Storch, M.; Amini, A.; Mather, I.; Lassmann, H.; Linington, C. Butyrophilin,
a milk protein, modulates the encephalitogenic T cell response to myelin oligodendrocyte glycoprotein in
experimental autoimmune encephalomyelitis. J. Immunol. 2000, 165, 2859–2865. [CrossRef]
51. Lu, J.; Wang, X.; Zhang, W.; Liu, L.; Pang, X.; Zhang, S.; Lv, J. Comparative proteomics of milk fat globule
membrane in different species reveals variations in lactation and nutrition. Food Chem. 2016, 196, 665–672.
[CrossRef]
52. Redington, J.M.; Breydo, L.; Almehdar, H.A.; Redwan, E.M.; Uversky, V.N. α-lactalbumin: Of Camels and
Cows. Protein Pept. Lett. 2016, 23, 1072–1080. [CrossRef]
53. Lönnerdal, B. Bioactive proteins in human milk: Health, nutrition, and implications for infant formulas.
J. Pediatr. 2016, 173, S4–S9. [CrossRef]
54. Håkansson, A.; Zhivotovsky, B.; Orrenius, S.; Sabharwal, H.; Svanborg, C. Apoptosis induced by a human
milk protein. Proc. Natl. Acad. Sci. USA 1995, 92, 8064–8068. [CrossRef] [PubMed]
55. Svensson, M.; Düringer, C.; Hallgren, O.; Mossberg, A.-K.; Håkansson, A.; Linse, S.; Svanborg, C. Hamlet—A
complex from human milk that induces apoptosis in tumor cells but spares healthy cells. In Integrating
Population Outcomes, Biological Mechanisms and Research Methods in the Study of Human Milk and Lactation;
Springer: Berlin/Heidelberg, Germany, 2002; pp. 125–132.
56. Svensson, M.; Håkansson, A.; Mossberg, A.-K.; Linse, S.; Svanborg, C. Conversion of α-lactalbumin to
a protein inducing apoptosis. Proc. Natl. Acad. Sci. USA 2000, 97, 4221–4226. [CrossRef] [PubMed]You can also read


