The Public Servants' Response When Facing Pandemic: The Role of Public Service Motivation, Accountability Pressure, and Emergency Response ...
←
→
Page content transcription
If your browser does not render page correctly, please read the page content below
healthcare
Article
The Public Servants’ Response When Facing Pandemic: The
Role of Public Service Motivation, Accountability Pressure,
and Emergency Response Capacity
Yong Ye 1,2 , Yang Liu 1,2 and Xiaojun Zhang 1,3, *

                                          1   School of Economics and Management, Fuzhou University, Fuzhou 350108, China;
                                              yeyong920@fzu.edu.cn (Y.Y.); t19106@fzu.edu.cn (Y.L.)
                                          2   Integrity and Governance Research Center, Fuzhou University, Fuzhou 350108, China
                                          3   Fujian Emergency Management Research Center, Fuzhou University, Fuzhou 350108, China
                                          *   Correspondence: xiaojun@fzu.edu.cn

                                          Abstract: (1) Background: Public servants are regarded as guardians of the public interest, and
                                          their pandemic response played a vital role in controlling the spread of the epidemic. However,
                                          there is limited knowledge of the factors that influence public servants’ response (PSR) when facing
                                          pandemic prevention and control tasks. (2) Methods: Based on the theory of planned behavior (TPB),
                                          models were constructed and a regression method was employed with Chinese civil servant data
                                          to investigate how PSR is influenced by public service motivation (PSM), accountability pressure
                                          (AP), and emergency response capacity (ERC). (3) Results and discussion: PSM, AP, and ERC all
                                          have a positive effect on PSR, with AP having the greatest influence, followed by PSM and ERC. The
                                effects of PSM, AP, and ERC on PSR have group heterogeneity, which had little effect on civil servants

                                          with very low levels of PSR and the greatest impact on civil servants with medium-level PSR. Job
Citation: Ye, Y.; Liu, Y.; Zhang, X.
                                          categories of civil servants also are a factor related to PSR; PSM and AP have the strongest effects on
The Public Servants’ Response When
                                          civil servants in professional technology, and ERC has the greatest influence on administrative law
Facing Pandemic: The Role of Public
                                          enforcement. Moreover, gender, administrative level, and leadership positions also have an impact
Service Motivation, Accountability
Pressure, and Emergency Response
                                          on PSR. (4) Conclusions: Based on the factors of PSR, we found at least three important aspects that
Capacity. Healthcare 2021, 9, 529.        governments need to consider in encouraging PSR when facing a pandemic.
https://doi.org/10.3390/healthcare
9050529                                   Keywords: public servant; public service motivation; accountability pressure; emergency response
                                          capacity; COVID-19
Academic Editor: Pedram Sendi

Received: 1 March 2021
Accepted: 28 April 2021                   1. Introduction
Published: 1 May 2021
                                                Public servants have an obligation to help citizens realize their own interests and rights
                                          and to achieve the goals of the public, society, state, and nation [1]. The effectiveness of
Publisher’s Note: MDPI stays neutral
                                          epidemic prevention and control of COVID-19 crucially depends on the effort and capacity
with regard to jurisdictional claims in
                                          of the millions of public sector workers from the front line to central administration [2].
published maps and institutional affil-
                                          Public servants adopt many measures to prevent and control the pandemic, including
iations.
                                          assisting health administrative departments and other relevant departments in collecting
                                          information, distributing and segregating personnel, and providing infectious disease
                                          prevention and control information to citizens [3]. The behaviors of public servants are
                                          critical in an epidemic. For the state, their behaviors are related to the (in)ability to deliver
Copyright: © 2021 by the authors.
                                          policies, achieve goals [4], and improve efficiency [5], as well as the public trust in the
Licensee MDPI, Basel, Switzerland.
                                          government [6]. Trust in the government was correlated with decisions to abide by public
This article is an open access article
                                          health policies, restrictions, and guidelines [7]. For instance, in Nigeria, the loss of public
distributed under the terms and
                                          confidence and vaccination boycott led to a resurgence of polio cases in 2004, which spread
conditions of the Creative Commons
                                          to more than 12 neighboring countries [8]. In 2015, the outbreak of measles in Orange
Attribution (CC BY) license (https://
creativecommons.org/licenses/by/
                                          County, California, was associated with similar concerns, which were exacerbated by
4.0/).
                                          parents’ distrust of US public health agencies [9]. A lack of trust in public health officials

Healthcare 2021, 9, 529. https://doi.org/10.3390/healthcare9050529                                     https://www.mdpi.com/journal/healthcare
Healthcare 2021, 9, 529 2 of 17
may lead to negative effects on the utilization of health services [10]. For society, the
behaviors of public servants have relevance to the public service quality [11] and the
creation and promotion of public value [12].
However, there is a dilemma between self-protection and service provision when
public servants face pandemic risk [13]. The pandemic has fundamentally changed the
workplace, work tasks, and the demands of public servants, which may create a significant
strain on public sector workers [14], risking burnout [15], sick leave [16], demotivation [17],
and lower performance [2]. Meanwhile, demands outside the workplace have also changed.
With nursery and school being closed, public servants need to balance work and duties even
during working hours. Moreover, the crisis has created higher ambiguities [4]; influenced
the discretions of public servants [18]; and reduced public servants’ compound knowledge
of task-specific intelligence, scientific knowledge, and policy rules, which made them
doubt about how to make the best professional judgments in encounters with families and
citizens [13]. In the light of job demands–resources theory (JD-R theory), job demands
are positively associated with burnout, whereas job resources are positively related to
engagement [19]. During the pandemic, job demands of public servants have increased,
while job resources, such as equipment and support from colleagues, have suffered. Thus,
public servants may exhibit lower work engagement [20]. Surveys of public servants are
considered to be a useful management diagnostic that can aid governments in improving
staff management (see, e.g., (Office of Personnel Management (OPM), 2019) U.K. Cabinet
Office. 2018). The Bureaucracy Lab of the World Bank and its Global Survey of Public
Servants Consortium carried out a COVID-19 Survey of Public Servants to identify the
challenges and problems posed to public servants by COVID-19, as well as their response.
However, the survey failed to analyze in depth the public servants’ responses during the
pandemic. The theoretical research about epidemic prevention behaviors of public servants
lags behind the practice.
In summary, the preventative behaviors of public servants are significant for the
victory of epidemic fighting. Moreover, scholars have explored many dimensions related
to epidemic prevention and control, such as measures that lead citizens to reduce their
frequency of going outside and wear masks during outings [21,22] and ways in which
the governments can increase the credibility of information [23]. However, studies to date
have not considered the role played by public servants in the prevention and control
of the epidemic situation. Considering the scarcity of literature about the behaviors of
public servants during the pandemic, this study aims at addressing this knowledge gap by
assessing what factors have affected the pandemic prevention behaviors of public servants
during the epidemic period. Studying public servants’ responses during a pandemic is
helpful to know what measures might encourage public servants to implement behaviors
to prevent the spread of an epidemic.
The paper is structured as follows: Section 2 introduces the study’s conceptual model.
Section 3 introduces the data collection and processing methods. Sections 4 and 5 de-
scribe the data used and the empirical results, respectively. Finally, Section 6 presents the
study’s conclusions.
2. Conceptual Model and Hypotheses
The theory of planned behavior (TPB) is frequently used to explain different kinds
of behavior in different areas of social sciences [24]. It is an extension of the theory of
reasoned action (TRA) [25]. The theory holds that an individual’s behavior largely de-
pends on the intention to perform the behavior; the stronger the intention to engage in a
behavior is, the more likely it is to be performed [26]. The intention, in turn, is influenced
by three factors: attitudes toward the behavior (ATT), subjective norms with respect to
the behavior (SN), and perceived behavioral control (PBC) [27]. At the beginning of its
theoretical development, studies on TPB mainly concentrated on health-related behaviors,
such as healthy eating behaviors [28], safe sexual behaviors [29], and pro-environmental
behaviors [30,31]. TPB has been widely applied in social and behavioral studies to addressHealthcare 2021, 9, 529 3 of 17
counterproductive work behaviors [32], higher education learning [33], and customer
purchase behaviors [34,35]. Past studies have positioned TPB as a cognitive theory that
provides a useful framework for predicting and identifying behaviors, with a high degree
of accuracy in predicting behavioral intentions. Based on existing research, we applied TPB
to analyze the factors impacting pandemic preventative behavior of public servants during
the COVID-19 outbreak. This study used public service motivation (PSM), accountability
pressure (AP), and emergency response capability (ERC) as independent variables. We
hypothesized that all three variables serve as distinctive and significant predictors of public
servants’ behaviors in responding to the pandemic (Figure 1).
Figure 1. Conceptual model.
2.1. Public Service Motivation
Public service motivation (PSM) is a multidimensional concept used to describe the
motivators encouraging pro-social behavior [36]. Perry described PSM as a predisposition
of individuals to serve the public interest [37] and as a deeply embedded personality trait
of individuals who are willing to engage in sacrificial behavior for the good of citizens
without reciprocal benefits for themselves [38]. This motive has rational, normative, and
affective bases [39]. Past research has indicated that the public servants have a high PSM,
as public organizations are more likely to provide opportunities to participate in public
service and provide due diligence for individuals [40].
According to the TPB, an individual’s attitude towards behavior refers to the degree
to which a person has a favorable or unfavorable evaluation or appraisal of the behavior
in question [26]. The evaluation mainly depends on whether the behavior will lead to
particular outcomes and whether these outcomes are desirable. Thus, PSM can be regarded
as a civil servant’s ATT towards the adoption of public servants’ response to protect the
public interest. Scholars have concluded that public servants with higher levels of PSM
perform better compared to those with low levels of PSM. This may be because they find
their work important and meaningful and are more likely to invest their resources in
public service work, keeping them engaged [38,41]. In view of these PSM-related traits, we
hypothesized the following:
Hypothesis 1. PSM is positively related to public servants’ pandemic response.
2.2. Accountability Pressure
Accountability is a relationship between an actor and a forum: the actor has an
obligation to explain and to justify his or her conduct; the forum can pose questions and
pass judgment, and the actor may face consequences [42]. The actor can be an individual,Healthcare 2021, 9, 529 4 of 17
such as an official or civil servant, or an organization, such as a public institution or an
agency. The accountability forum can be a specific person, such as a superior, minister,
or journalist, or it can be an institution, such as parliament, court, or audit office [43].
Accountability is widely seen as a tool used by citizens to compel those vested with public
power to speak the truth [42,43]. In addition, scholars have conducted detailed research
on how to use accountability pressure to improve employee productivity and made many
recommendations [44,45].
SN relates to perceived social pressure from family, friends, colleagues at work, and
other agents; this pressure causes people to perform or not perform a behavior [26]. During
the epidemic, the social pressure faced by public servants was mainly from accountability
pressure due to the perception of the epidemic response as inadequate. This study used
accountability pressure (AP) to express the perceived SN of public servants. Based on this,
we hypothesized the following:
Hypothesis 2. AP is positively related to public servants’ pandemic response.
2.3. Emergency Response Capability
Emergency response capability (ERC) reflects a comprehensive capability to address
such events as natural disasters, sudden public health or safety incidents, or military
conflict [46]. ERC is a major indicator assessing the degree of difficulty faced by public
servants when preventing epidemics. Scholars have found that the corresponding training
for ERC can significantly improve emergency response abilities in an emergency [47,48].
PBC also plays a significant part in the theory of planned behavior. It refers to the
perceived ease or difficulty of performing a behavior, and it is assumed to reflect past expe-
rience and anticipated impediments and obstacles [26]. PBC influences behavior indirectly
by influencing behavior intention, and it directly affects behavior achievement [26,49]. This
study used ERC to indicate PBC. The framework for ERC generally consists of three levels:
systems, organizational, and individual [50]. This study evaluated ERC at the individual
level, focusing on the civil servant. Based on this, we hypothesized the following:
Hypothesis 3. ERC is positively related to public servants’ pandemic response.
The theory of planned behavior holds that when a behavior is evaluated more favor-
ably (PSM) and a person feels greater social pressure (AP), in conjunction with a sense of
PBC, the behavioral intention is expected to be stronger [51].
2.4. Control Variables
Other factors may affect the pandemic preventative behavior of public servants. For
example, gender may be one factor leading to differences in behavior of public servants
when facing a public emergency. Many scholars have conducted related research. For ex-
ample, Perry found that men scored higher on the structure of public interest than women
in 1997 [52]; in contrast, some scholars have proposed a dimension of compassion for
the PSM, in which women consistently score higher than men [37]. As such, the effect of
gender may be positive or negative. As people grow older, they generally become more
concerned with positively contributing to society, suggesting that age may also impact
pandemic preventative behavior [53]. Previous studies found that information diffusion
significantly influences the epidemic spread [54]; people with higher levels of education
may receive more information about an epidemic than less educated people [55]. Mean-
while, individuals with higher education will thus express higher levels of PSM, because
they have internalized the values and norms of public service, such as the importance of
contributing, by means of socialization, social identification, and social learning [56]. As a
result, they are more likely to take actions that support epidemic prevention and control.
Political countenance (or affiliation) (Poc) is also a factor that may cause differences
in the behavior of public servants when facing a pandemic risk. In China, for example,
Communist Party members must implement their original intent and oath to “be readyHealthcare 2021, 9, 529 5 of 17
to sacrifice everything for the party and the people” with their actions, especially during
the epidemic. The higher the administrative level (Adlevel) of public servants, the more
responsibility they bear. As a result, they may face greater stress, driving them to take
epidemic prevention more actively and seriously. Meanwhile, some scholars believe
that job stress that can be classified as hindrance stress, such as role ambiguity and role
conflict, negatively affects job performance, while challenge stress such as workload and job
responsibility inversely affects job performance and work engagement [57]. Thus, whether
the impact of Adlevel is positive or negative is uncertain. Leaders, as formal authority
figures, play an important role in the organization. Studies have shown that obviously
displaying pro-social and selfless behavior can prompt observers to also act with kindness
and generosity [58]. In this way, leaders can function as models and motivate people to
put their values into action [59]. This means public servants in leading positions are more
likely to actively participate in epidemic prevention. The length of service (Length) may
also impact the selection of public servants for epidemic prevention, as previous studies
have demonstrated that as the length of service increases, people feel more exhausted [60]
and the tendency to engage in pro-social behaviors declines significantly [61].
3. Methods
3.1. Ethical Consideration
The study was approved by the School of Economics and Management, Fuzhou
University (ED-FZU-SEM-2020010). All the participants submitted informed consent before
completing the questionnaire.
3.2. Data Collection
All data for this study were collected using an online questionnaire, administered from
5 to 10 February 2020. The survey included the following steps. First, based on the COVID-
19 situation, the online questionnaire was designed to explored epidemic awareness and
prevention behaviors taken by Chinese public servants. Second, the online questionnaire
was then sent by Credamo (a platform for conducting questionnaire surveys) to Master of
Public Administration (MPA) students in universities of China. These students, who are
working in the government, are participating in the MPA program to be equipped with
proper political and ideological qualities and professional ethics and master systematic
public management theories, knowledge, and methods. The MPA students were asked to
send the online questionnaire to their colleagues, who were also asked to send it to their
colleagues. In this way, sufficient sample data could be obtained from the MPA students’
relational networks. Each participant submitted informed consent before completing the
questionnaire. Third, a total of 1371 valid questionnaires were retrieved. To ensure data
reliability, the data were further cleansed, and some responses were excluded due to a lack
of value. The final number of analyzed responses was 1293 respondents, which was a net
response rate of 94.31%.
3.3. Definition and Measurement of Explanatory Variables
All variables were measured using the online questionnaire; the variables and items are
listed in Table 1, and all the items came from the international authoritative measurement
scale. For instance, the question of PSM overlapped with a part of Perry’s measurement
scale of public service motivation. Most of the variables were quantitative variables. For
example, we divided age into different stages, and there was continuity between each
stage. The number “1” represents 1–5 years old, and “2” represents 6–10 years old; i.e., the
larger the number is, the older the participant is. In addition to the control variables, the
variables PSR, PSM, AP, and ERC were described using three questions, and each variable
was obtained by means of the aggregation of each of its indicators; each item was answered
using a five-point system, ranging from 1 = “strongly disagree” to 5 = “strongly agree”.
For example, AP was divided into three kinds of pressure: pressure from superior leaders,Healthcare 2021, 9, 529 6 of 17
pressure from laws and regulations, and pressure from public opinion and social media.
The Cronbach’s alpha was 0.7690.
Table 1. Variable description.
Variable Indicator Variable Description
“As long as the superior issues a prevention and control
task, I can deploy and implement the prevention and
control work vigorously”
“My execution ability is very strong, and I can (1) Strongly disagree, (2) Disagree, (3) It does not
PSR effectively implement and execute superior prevention matter, (4) Agree, (5) Strongly agree
and control instructions”
“Without the urging of the superior, I can still actively
complete the prevention and control tasks assigned by
the superior”
“I think participation in public service is the duty of
every citizen”
“It’s important for me to serve the public” (1) Strongly disagree, (2) Disagree, (3) It does not
PSM
matter, (4) Agree, (5) Strongly agree
“I am willing to make great sacrifices for the overall
interests of society”
“I strictly abide by laws, rules, and procedures to carry
out my work”
“I strictly implement the principles and methods of (1) Strongly disagree, (2) Disagree, (3) It does not
AP higher authorities’ instructions” matter, (4) Agree, (5) Strongly agree
“In response to this epidemic, we attach great
importance to publicity work for the media and society”
“No matter how much disaster information I receive, I
can grasp the key information points”
“Even if I haven’t got enough information, I can make
(1) Strongly disagree, (2) Disagree, (3) It does not
ERC quick response decisions”
matter, (4) Agree, (5) Strongly agree
“When I receive the arrangements for epidemic
prevention and control, I can quickly put aside my work
or life arrangements to respond”
Gender “What is your gender?” (1) Male, (2) Female
Age “How old are you?” (1) 20–30, (2) 31–40, (3) 41–50,(4) Older than 50
“What is your highest education level (including your (1) High school, (2) College, (3) Undergraduate,
Education
current level of study)?” (4) Graduate and above
Poc “Are you a party member?” (1) Yes, (2) No
(1) Administrative level, (2) County level,
Adlevel “What is your administrative level?”
(3) Township level, (4) Staff member, (5) Clerk
Leader “Are you in a leading position?” (1) Yes, (2) No
(1) 1–5, (2) 6–10, (3) 11–15, (4) 16–20,
Length “How long have you worked?”
(5) More than 20 years
(1) Integrated management, (2) Administrative law
Job category “What is your job category?”
enforcement, (3) Professional technology, (4) Other
3.4. Data Analysis
All data were analyzed using the statistical software Stata/MP, version 14.0 (Stata-
Corp LP., Texas City, USA). The main analysis steps were as follows: First, we generated
descriptive statistics of the variables. Second, a correlation matrix was developed to ex-
amine the relationships between 10 quantitative variables. Third, we adopted multiple
linear regression models to explore the effects of PSM, AP, and ERC on public servants’Healthcare 2021, 9, 529 7 of 17
response. Finally, a quantile regression was used to assess whether the effects of PSM, AP,
and ERC on public servants’ response exhibited group heterogeneity. This study selected
the most common threshold of P, i.e., p < 0.05, and all of our regression models passed the
significance test.
4. Results
4.1. Descriptive Information
The descriptive statistics of the dependent and independent variables are shown
in Table 2. There were 1293 participants in the study. Most participants had a college
education or above (63.0%), and there were more males (50.27%) than females (49.73%).
With respect to age, 45.86% of respondents were between 20 and 30 years old, and 11.52%
were 40–50 years old. In terms of political party, 76.95% of the participants were members
of the Communist Party of China; the remaining 23.05% were non-party members and
were associated with the Democratic Party, the Communist Youth League, and others.
With respect to administrative level, 50.04% of participants were staff members; the lowest
number of subjects were at the bureau level, accounting for only 0.77% of the total. Of all
the participants, only 21.27% reported holding leadership positions. Finally, 69.37% of the
participants reported serving as public servants for less than 10 years.
Table 2. Descriptive statistics of the variables (n = 1293).
Variable Categories Mean ± SD/Total No. Range/Percent
Males 650 50.27%
Gender
Females 643 49.73%
20–30 593 45.86%
31–40 511 39.52%
Age
41–50 149 11.52%
Older than 50 40 3.09%
High school 1 0.08%
College 22 1.70%
Education
Undergraduate 455 35.19%
Graduate and above 815 63.03%
Party member 995 76.95%
Poc
Non-party member 298 23.05%
Administrative level 10 0.77%
County level 144 11.14%
Adlevel Township level 357 27.61%
Staff member 647 50.04%
Clerk 135 10.44%
Leader 275 21.27%
Leader
Non-leader 1018 78.73%
1–5 428 33.10%
6–10 469 36.27%
Length 11–15 182 14.08%
16–20 75 5.80%
More than 20 years 139 10.75%
Integrated management 851 65.82%
Administrative law enforcement 214 16.55%
Job category
professional technology 208 16.08%
Other 20 1.55%
PSR - 10.60 ± 3.214 [3,15]
PSM - 13.56 ± 1.469 [3,15]
AP - 13.42 ± 1.509 [3,15]
ERC - 12.14 ± 1.871 [3,15]Healthcare 2021, 9, 529 8 of 17
Before conducting the formal linear regression, a correlation matrix was established to
test the correlation between variables. A significant association was observed for 8 of the
10 indicators related to public servants’ response. Table 3 shows the results. Among them,
Poc, Leader, and Adlevel were significantly negatively correlated with public servants’
response. Meanwhile, PSM, AP, ERC, and Length were significantly positively related
to public servants’ response. Most of the correlation results are consistent with our hy-
pothesis. It is surprising that the dimensions of education and gender did not pass the
significance test.
Table 3. Correlation matrix of the studied variables.
Variables PSR PSM AP ERC Gender Age Education Poc Adlevel Leader Length
PSR 1
PSM 0.193 *** 1
AP 0.203 *** 0.425 *** 1
ERC 0.176 *** 0.411 *** 0.382 *** 1
Gender −0.023 −0.097 *** −0.048 * −0.135 *** 1
Age 0.057 ** 0.139 *** 0.083 *** 0.240 *** −0.212 *** 1
Education −0.037 −0.061 ** −0.018 −0.103 *** 0.002 −0.094 *** 1
Poc −0.062 ** −0.067 ** −0.035 −0.053 * 0.120 *** −0.180 *** −0.155 *** 1
Adlevel −0.092 *** −0.105 *** −0.046 * −0.179 *** 0.247 *** −0.468 *** −0.041 0.228 *** 1
Leader −0.086 *** −0.046 * −0.028 −0.115 *** 0.192 *** −0.417 *** −0.053 * 0.208 *** 0.559 *** 1
Length 0.073 *** −0.184 *** 0.122 *** 0.231 *** −0.231 *** 0.828 *** −0.082 *** −0.230 *** −0.510 *** −0.470 *** 1
Standard errors in parentheses; * p < 0.05, ** p < 0.01, *** p < 0.001.
4.2. Overall Effect and Stratification Difference
To assess the overall effect, this study employed Model 1 with public servants’ pan-
demic response (PSR) as the dependent variable and demographic variables as control
variables. Next, PSM was added in Model 2. Last, AP and ERC were added to Model 3
and Model 4, respectively.
The results indicate that PSM, AP, and ERC were the key factors influencing public
servants’ response (significant at p < 0.001) and had different effects. Table 4 shows that AP
had the most significant impact on public servants’ response; when AP increased by 1%,
the reported willingness of civil servants to actively take actions to prevent the epidemic
increased by 0.273%. Hypothesis 2 was supported, as AP was significantly and positively
related to public servants’ response. The participants were asked where their accountability
pressure mainly comes from when dealing with public emergencies. Of the total subjects,
66.36% said accountability pressure came mainly from superior departments and leaders,
and 17.79% reported it coming from public opinion. PSM had the second largest effect
on public servants’ response; when PSM increased by 1%, the reported willingness to
engage in public servants’ response increased by 0.230%. This supported Hypothesis 1.
Finally, when ERC increased by 1%, the reported willingness of public servants to engage
in pandemic preparation increased by 0.135%, verifying Hypothesis 3.
For the control variables in Models 1 and 4, while the significance levels differed, it
can be seen that the coefficients of gender on public servants’ response were significant
and positive. This indicates that after the outbreak, female public servants were more
likely to adopt positive preventive actions than males. The administrative level had a
significant negative effect on public servants’ response in Models 1 and 3. This indicates
that the higher a civil servant’s position was, the more they reported engaging in relevant
preventive work. This may explain some differences in the evaluation of “public interest
commitment” and “policymaking attractiveness” between street-level bureaucrats (street-
level bureaucrats are public employees who interact directly with individual citizens and
have substantial discretion in allocating facilities or imposing sanctions) and upper-level
management (upper-level managers are individuals who are responsible for making the
primary decisions) [62]. Leadership positions also had a negative impact on public servants’
response in Models 2–4, indicating public servants in leadership positions are more likely
to participate in epidemic prevention and control. This result is consistent with the impact
of administrative level on public servants’ response.Healthcare 2021, 9, 529 9 of 17
Table 4. The multiple linear regression models (n = 1293).
Model 1 Model 2 Model 3 Model 4
Variables
PSR PSR PSR PSR
Gender 0.364 * 0.434 ** 0.435 ** 0.462 **
1.930 2.330 2.360 2.510
Age −0.094 −0.055 −0.035 −0.086
−0.440 −0.250 −0.160 −0.380
Education −0.296 * −0.237 −0.249 −0.214
−1.720 −1.390 −1.450 −1.260
Poc −0.363 −0.315 −0.318 −0.322
−1.610 −1.440 −1.470 −1.490
Adlevel −0.239 * −0.211 −0.224 * −0.202
−1.760 −1.570 −1.700 −1.520
Leader −0.366 −0.470 * −0.477 * −0.477 *
−1.330 −1.730 −1.760 −1.770
Length 0.093 −0.009 −0.042 −0.035
0.680 −0.060 −0.290 −0.240
PSM 0.412 *** 0.277 *** 0.230 ***
6.830 4.320 3.310
AP 0.315 *** 0.273 ***
4.700 3.870
ERC 0.135 **
2.160
Constant 13.034 *** 7.322 *** 5.066 *** 4.454 ***
12.320 5.560 3.460 3.050
Observations 1293 1293 1293 1293
R-squared 0.017 0.051 0.069 0.074
adj_R2 0.066 0.066 0.066 0.066
F 9.129 9.129 9.129 9.129
Standard errors in parentheses; * p < 0.05, ** p < 0.01, *** p < 0.001.
Not all public servants possess the same level of PSR. To ensure the robustness of
our results, based on the quantile regression of the data on the 1293 study subjects, this
study further verified whether there were differences in the impacts of PSM, AP, and
ERC on different quantiles of public servants’ response. A greater number of quantiles
is associated with a greater clarity in conditional distributions. This study selected five
representative quantiles for analysis: low behavior level group (IVQR_10), medium and
low behavior level group (IVQR_25), medium behavior level group (IVQR_50), medium
and high behavior level group (IVQR_75), and high behavior level group (IVQR_90).
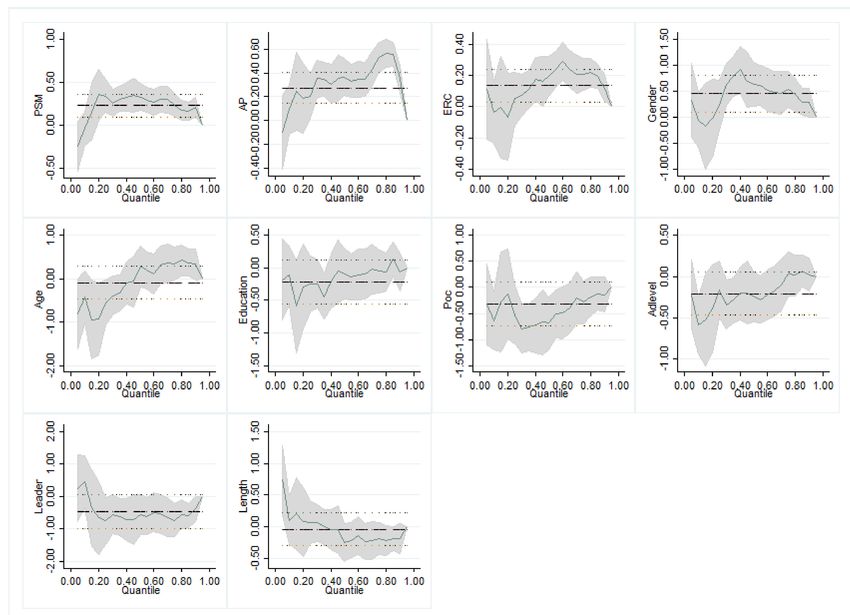
The results of the quantile regression are shown in Table 5 and Figure 2. The table
shows that PSM, AP, and ERC had significant heterogeneity effects on public servants’
response. First, with the exception of IVQR_10, the coefficients of PSM of the remaining
four quantiles were all significantly positive, with elastic coefficients as high as 0.341,
0.330, 0.236, and 0.208 for IVQR_25, IVQR_50, IVQR_75, and IVQR_90, respectively. This
indicates that PSM was reported to significantly improve public servants’ response for
most public servants but was not significant for the public servants reporting low levels of
these behaviors.
Second, with respect to AP and ERC, the coefficients of IVQR_50, IVQR_75, and
IVQR_90 were all significantly positive. AP was more elastic to public servants’ response
than ERC. In addition, the improvements in AP and ERC were associated with higher
public servants’ response for the IVQR_50 group. The regression coefficient exhibited
an inverted U shape as the quantile number increased (see Figure 2). This illustrates
that improvements in the public servants’ response first increased and then decreased in
response to AP and ERC.Healthcare 2021, 9, 529 10 of 17
Table 5. The quantile regression model (n = 1293).
Model 1 Model 2 Model 3 Model 4 Model 5
Variables
IVQR_10 IVQR_25 IVQR_50 IVQR_75 IVQR_90
PSM −0.040 0.341 * 0.330 *** 0.236 *** 0.208 *
−0.280 2.560 3.970 3.510 2.230
AP 0.093 0.208 0.366 *** 0.533 *** 0.351 ***
0.690 1.630 4.620 8.280 3.920
ERC −0.356 0.052 0.194 ** 0.206 *** 0.119 *
−0.320 0.500 2.980 3.900 1.620
Gender −0.049 0.243 0.634 ** 0.548 ** 0.286
−0.130 0.690 2.900 3.090 1.160
Age −0.409 −0.549 0.285 0.347 0.333
−1.00 −1.420 1.180 1.780 1.230
Education −0.111 −0.243 −0.087 −0.050 −0.066
−0.320 −0.740 −0.430 −0.300 −0.280
Poc −0.640 −0.520 −0.690 ** −0.286 −0.137
−1.430 −1.240 −2.630 −1.350 −0.460
Adlevel −0.587 * −0.156 −0.234 0.035 0.024
−2.140 −0.600 −1.430 0.270 0.130
Leader 0.458 −0.751 −0.558 −0.729 ** −0.387
0.840 −1.460 −1.740 −2.800 −1.070
Length 0.098 * 0.069 −0.242 −0.181 −0.185
0.370 0.280 −1.550 −1.430 −1.050
_cons 8.618 ** 4.665 1.507 0.789 5.649 **
2.940 1.690 0.880 0.570 2.920
Standard errors in parentheses; * p < 0.05, ** p < 0.01, *** p < 0.001.
Figure 2. Quantile regression coefficient trends of explanatory variables.Healthcare 2021, 9, 529 11 of 17
Third, from the low quantile to the high quantile, while the elasticity fluctuated
slightly, there was an overall upward trend, with the PSM, AP, and ERC coefficients
generally increasing. This indicates that these three variables were generally reported to
improve the pandemic prevention performance of public servants. However, the increase
in these behaviors was more reflected in IVQR_50, IVQR_75, and IVQR_90. This indicates
there were limitations in the degree of the positive impact that PSM, AP, and ERC had on
the public servants’ response.
Finally, compared to the overall effect of Model 4 in Table 4, the coefficients of PSM,
AP, and ERC in IVQR_50 and IVQR_75 in Table 5 were generally higher. For example, the
coefficients of AP in IVQR_50 and IVQR_75 were 0.366 and 0.533, respectively, which were
higher than the coefficient of 0.273 in Table 4.
4.3. Factors Influencing Pandemic Prevention Performance in Different Job Categories
The differences in job categories determine the different work responsibilities of public
servants, which may affect their willingness to engage in pandemic prevention measures
when facing the pandemic. Thus, we performed regression on pandemic prevention perfor-
mance in different job categories.
The coefficients and the significance levels of PSM, AP, and ERC in Table 6 are different
in every model, which illustrates that there are indeed some status differences. The vari-
ables (including AP, ERC, gender, and leader) have an important influence on the pandemic
prevention performance of public servants in integrated management. As for administra-
tive law enforcement, also known as “street-level bureaucrats”, AP, ERC, education, and
political countenance have significant effects on pandemic prevention performance. How-
ever, for public servants in professional technology, only PSM and AP have a significant
influence on pandemic prevention performance.
Table 6. Regression on pandemic prevention performance in the different job categories.
Integrated Administrative Law Professional
Variables Other
Management Enforcement Technology
PSM 0.108 0.172 0.627 *** −1.184
1.240 1.100 3.880 −1.090
AP 0.203 * 0.315 * 0.434 ** 0.511
2.400 2.110 2.820 0.740
ERC 0.193 ** 0.299 * −0.007 0.836
2.760 2.310 −0.060 1.070
Gender 0.799 *** −0.620 −0.333 −0210
3.500 −0.140 −0.770 −0.110
Age 0.196 −0.102 −0.623 −2.303
0.780 −0.210 −1.430 −0.820
Education −0.060 −0.858 * −0.229 −1.824
−0.280 −2.210 −0.530 −0.850
Poc 0.101 −1.025 * −0.102 −1.334
0.360 −1.980 −0.220 0.420
Adlevel −0.106 0.031 −0.301 −0.951
−0.590 0.100 −1.120 −0.630
Leader −0.948 ** 0.843 1.034 −1.807
−2.970 1.330 1.410 −0.400
Length −0.112 0.328 0.053 1.081
−0.680 1.010 0.190 0.620
Constant 5.706 ** 2.808 5.066 *** 26.753
2.800 0.850 3.460 1.620
Observations 851 214 208 20
R-squared 0.065 0.166 0.214 0.417
adj_R2 0.054 0.124 0.174 −0.232
F 5.880 4.030 5.360 0.640
Standard errors in parentheses; * p < 0.05, ** p < 0.01, *** p < 0.001.Healthcare 2021, 9, 529 12 of 17
The coefficients of PSM, AP, and ERC in Table 6 were different from the overall effect
in Table 4. Specifically, for professional and technical public servants, when PSM increased
by 1%, the reported willingness to engage in public servants’ response increased by 0.627%,
which was much higher than 0.230% in Table 4; when AP increased by 1%, the reported
willingness of civil servant to actively take actions to prevent the epidemic increased by
0.434%, also higher than the overall effect of 0.273%. As for administrative law enforcement,
the coefficient of ERC was 0.299, higher than 0.135 in Table 4.
5. Discussion
The goal of this paper was to analyze the effects of PSM, AP, and ERC on public
servants’ response when public servants face a pandemic emergency. To accomplish this
goal, we established the measurement scale, built a theoretical model based on TPB theory,
and applied regression methods to analyze the data collected from Chinese study subjects.
5.1. The Factors Contributing to Public Servants’ Response
We ran multiple linear regression models to test the efficiency of the conceptual model
that we built based on the TPB. The results confirm that AP, PSM, and ERC all passed the
significance test, indicating they were all reported to play a positive role in improving
public servants’ response. Among the three independent variables, AP had the greatest
impact on public servants’ response, followed by PSM and then ERC. This differed from the
previous studies, which concluded that subjective norms were weaker in forming intention
than the attitudes toward the behavior [63].
The possible explanations for the positive role that AP can play in increasing public
servants’ response are as follows: Accountability for performance has replaced more
traditional notions of bureaucratic accountability for both fairness and financial reasons
and has become a familiar type of accountability [64]. This shift has provided new criteria
for administrative success and what it means to be accountable as a civil servant. As a
result, following proper “procedure” is no longer considered a sufficient action by public
servants if the result is an inadequate policy solution [65]. Since the 18th CPC National
Congress, China has stressed the need to accelerate the transformation of government
functions and innovation management methods. Therefore, increased attention has been
paid to evaluating government performance, especially the performance of public servants.
This performance is closely related to rewards or penalties. Thus, when facing a high degree
of accountability pressure (AP), public servants will be more active in epidemic prevention
and control to avoid any penalties.
Previous studies have confirmed a strong link between individual PSM and perfor-
mance in public sector organizations [66–68]. Furthermore, the positive effect of PSM on
public servants’ response is largely due to the deep personality trait held by individuals
who are willing to engage in self-sacrificing behavior for the benefit of their citizens, rather
than seeking mutual benefit for themselves [38]. Therefore, public servants with a high
degree of PSM are more likely to actively carry out the tasks of epidemic prevention and
control to preserve the safety of other people’s lives and property.
ERC had a positive impact on the behaviors of public servants during the epidemic.
ERC is the ability to effectively address emergencies, which depends on individual per-
ception of the environment, skills, time, and cost. Public servants having a strong ERC
reported believing that the epidemic is highly controllable and expressed more confidence
in addressing emergencies. This makes them more inclined to exhibit positive epidemic
prevention behaviors.
Moreover, the results of quantile regression show that the effects of PSM, AP, and ERC
on public servants’ response were heterogeneous between groups, which means PSM, AP,
and ERC failed to positively impact the behavior of all public servants. More specifically,
they had little effect on public servants that reported exhibiting low levels of public servants’
response. Instead, the three factors had the greatest impact on public servants reporting
medium levels of the desired behaviors. This may because public servants reporting lowHealthcare 2021, 9, 529 13 of 17
levels of the public servants’ response may have been ensuring their own safety or taking
better care of their families and considered these more important than the public interest.
Even though they face greater accountability pressure (AP) or have stronger emergency
response capabilities (ERC), not all respondents reported actively participating in epidemic
prevention and control during the outbreak.
In addition, we found that the job categories of public servants might also be a factor
related to pandemic prevention performance. Among them, PSM and AP have the strongest
effects on public servants in professional technology, and ERC has the greatest influence on
administrative law enforcement. One possible explanation is the different job types have
different effects on performance perceptions and expectations [69], risk perception [70], and
job satisfaction [71]. Thus, if we want to improve the specific behaviors of public servants,
we cannot make sweeping generalizations, but rather, we need to take targeted incentive
measures according to their actual situation.
5.2. Policy Recommendations for the Government
When the epidemic broke out, public servants may have faced a conflict between
positively preventing the epidemic to safeguard public health and safety and passively
avoiding responsibility to protect their own interests. Public servants’ response was es-
sential for controlling the epidemic situation. The theory of planned behaviors provides
a new perspective and method for studying behavior in the field of public management,
which helps us to better understand the factors contributing to public servants’ behav-
iors. The more we know about any particular behavior, the more we can influence and
change it. Therefore, after considering the roles of the factors influencing public servants’
participation in epidemic prevention and control, the following policy implications can
be proposed:
For public servants reporting below a medium level of public servants’ response,
measures need to be taken to maximize the factors that maintain or enhance PSM and miti-
gate the factors that reduce it [41]. This would help public servants actively participate in
epidemic prevention and control. Examples would include building trust in the workplace,
as creating a strong tie between workplace trust and PSM acts as a catalyst that enables
public managers to transform their service propensity into real actions [72]. In addition,
transformational leaders who provide a vision, set a positive example, encourage innova-
tion, and cultivate organizational pride can also promote public service motivation [73].
Reducing red tape, implementing reforms, clarifying goals, and empowering employees
can also positively impact the PSM of public servants [74].
For public servants reporting medium or higher level of public servants’ response,
appropriate material incentives and welfare guarantees may enable public servants to
worry less when engaging in relevant epidemic prevention work. In addition to a basic
salary, increasing the proportion of incentive and special post allowances can help optimize
the salary structure. Further, enhancing employee prospects for career growth [75], with
a scientific and feasible promotion mechanism, may help public servants improve their
enthusiasm for work. This may make them more proactive in performing related epidemic
prevention tasks.
It is important to establish an effective performance evaluation mechanism and ac-
countability system and increase the role of accountability pressure (AP) in promoting
the legitimacy of civil servant behavior. Previous studies have shown that performance
appraisals influence the expectations made of public servants, influencing their work mo-
tivation [76]. In this study, AP was reported to mainly come from superior departments
and leaders, and it had the greatest effect on the public servants’ response. Motivating
public servants to perform their duties actively through a strict accountability system and
mechanism, with some error tolerance, can help distinguish the types of decision-making
errors that are tolerated or penalized. This can encourage public servants to take proactive
actions in the threat of an incoming public health crisis [77].Healthcare 2021, 9, 529 14 of 17
It is critical to establish an emergency training system to improve the emergency
response capacity (ERC) of public servants. This should strengthen the study of related
theories. For example, the government could leverage administrative schools in different
universities to regularly conduct theoretical training courses for public servants, including
methods for interpreting different types of frequent emergencies. This would also enhance
ERC from a practical level. Theory-based training should be followed with different simula-
tion exercises for different types of public emergencies, to increase civil servant familiarity
with emergency plans and to improve the efficient use of emergency plans in times of crisis.
Furthermore, in order to better improve the enthusiasm of public servants for epidemic
prevention, targeted measures can be taken for public servants of different job categories.
For public servants in professional technology, measures should be taken to improve
their PSM and AP from internal and external aspects, respectively. As for comprehensive
management, increasing the pressure of accountability can effectively improve the public
servants’ response. With respect to public servants in administrative law enforcement, the
key is to improve their ERC through theoretical teaching and practical training.
5.3. Limitations
First, due to limited time and cost, the sample size for the questionnaire was small.
This may lead to a slight deviation between the actual situation and the calculation re-
sults. Second, the sample data were optimized and screened; however, because the study
data were mainly obtained through participants’ self-evaluation, participants may have
concealed the actual situation. In the future, the data should be optimized in a variety
of ways.
6. Conclusions
Based on questionnaire data collected from 1293 public servants in China, our research
found that PSM, AP, and ERC significantly impacted the epidemic prevention behaviors
of public servants exhibiting a medium level of the behavior or higher. AP was found
to play the most important role, providing useful information about how to mobilize
the enthusiasm of public servants in the face of public security emergencies. The level of
epidemic prevention behaviors reported by public servants was also related to job category,
gender, education, and administrative level. The main innovation of this research is that
it is the first known study to focus on the epidemic prevention and control behaviors of
public servants and to discuss the main factors influencing these behaviors. Moreover, this
study is one of the first to apply TPB to understand the behavior of public servants in public
management settings. This broadens the application scope of TPB theory and provides a
new perspective and method for behavioral studies in the field of public management.
Author Contributions: Conceptualization, Y.L. and X.Z.; methodology, Y.Y.; software, Y.L.; vali-
dation, X.Z.; formal analysis, Y.L.; investigation, Y.Y. and X.Z.; resources, Y.Y.; data curation, Y.L.;
writing—original draft preparation, Y.L.; writing—review and editing, Y.L. and X.Z.; visualization,
X.Z.; supervision, Y.Y.; project administration, X.Z.; funding acquisition, Y.Y. All authors have read
and agreed to the published version of the manuscript.
Funding: This work was supported by the General Projects of the National Social Science Fund (No.
15BZZ071), and Financial Support from the Scientific Research Fund at the Fuzhou University (GXRC202001).
Institutional Review Board Statement: The study was conducted according to the guidelines of the
Declaration of Helsinki, and approved by the Institutional Review Board of School of Economics and
Management, Fuzhou University.
Informed Consent Statement: Informed consent was obtained from all subjects involved in the study.
Data Availability Statement: The data presented in this study are available on request from the
corresponding author. The data are not publicly available due to the data also forms part of an
ongoing study.
Conflicts of Interest: The authors declare no conflict of interest.Healthcare 2021, 9, 529 15 of 17
References
1. Ma, T. Pros and Cons of Chinese Public Servant Career Temptation—Consideration on the Hot Phenomenon of Civil Service
Examinations. Can. Soc. Sci. 2012, 8, 117–120. [CrossRef]
2. Schuster, C.; Weitzman, L.; Sass Mikkelsen, K.; Meyer-Sahling, J.; Bersch, K.; Fukuyama, F.; Paskov, P.; Rogger, D.; Mistree, D.;
Kay, K. Responding to COVID-19 through Surveys of Public Servants. Public Adm. Rev. 2020, 80, 792–796. [CrossRef]
3. Zhang, X.Y.; Xiang, C. Turning Rural Villages into the Home Front for Social Stability—Examination of Coronavirus Disease 2019
Control Experiences in Rural Areas in China. Int. J. Health Plann. Mgmt. 2020, 35, 1250–1256. [CrossRef]
4. Lima-Silva, F.; Sandim, T.L.; Magri, G.M.; Lotta, G. Street-Level Bureaucracy in the Pandemic: The Perception of Frontline Social
Workers on Policy Implementation. Rev. Adm. Publica 2020, 54, 1458–1471. [CrossRef]
5. Miao, Q.; Newman, A.; Schwarz, G.; Cooper, B. How Leadership and Public Service Motivation Enhance Innovative Behavior.
Public Adm. Rev. 2018, 78, 71–81. [CrossRef]
6. Van Bavel, J.J.; Baicker, K.; Boggio, P.S.; Capraro, V.; Cichocka, A.; Cikara, M.; Crockett, M.J.; Crum, A.J.; Douglas, K.M.;
Druckman, J.N.; et al. Using Social and Behavioural Science to Support COVID-19 Pandemic Response. Nat. Hum. Behav. 2020, 4,
460–471. [CrossRef]
7. Blair, R.A.; Morse, B.S.; Tsai, L.L. Public Health and Public Trust: Survey Evidence from the Ebola Virus Disease Epidemic in
Liberia. Soc. Sci. Med. 2017, 172, 89–97. [CrossRef] [PubMed]
8. Heymann, D.L.; Aylward, R.B. Eradicating Polio. N. Engl. J. Med. 2004, 351, 1275–1277. [CrossRef] [PubMed]
9. Salmon, D.A.; Dudley, M.Z.; Glanz, J.M.; Omer, S.B. Vaccine Hesitancy Causes, Consequences, and a Call to Action. Vaccine 2015,
33, D66–D71. [CrossRef] [PubMed]
10. Alsan, M.; Wanamaker, M. Tuskegee and the Health of Black Men. Q. J. Econ. 2018, 133, 407–455. [CrossRef] [PubMed]
11. Salge, T.O.; Vera, A. Benefiting from Public Sector Innovation: The Moderating Role of Customer and Learning Orientation.
Public Adm. Rev. 2012, 72. [CrossRef]
12. Vigoda-Gadot, E.; Shoham, A.; Schwabsky, N.; Ruvio, A. Public Sector Innovation for Europe: A Multinational Eight-Country
Exploration of Citizens’ Perspectives. Public Adm. 2008, 86, 307–329. [CrossRef]
13. Moller, M.O. The Dilemma between Self-Protection and Service Provision under Danish COVID-19 Guidelines: A Comparison of
Public Servants’ Experiences in the Pandemic Frontline. J. Comp. Policy Anal. 2020. [CrossRef]
14. Ghanayem, M.; Srulovici, E.; Zlotnick, C. Occupational Strain and Job Satisfaction: The Job Demand-Resource Moderation-
Mediation Model in Haemodialysis Units. J. Nurs. Manag. 2020, 28, 664–672. [CrossRef] [PubMed]
15. Bakker, A.B.; Demerouti, E. Job Demands-Resources Theory: Taking Stock and Looking Forward. J. Occup. Health Psychol. 2017,
22, 273–285. [CrossRef] [PubMed]
16. Petersen, J.; Kirkeskov, L.; Hansen, B.B.; Begtrup, L.M.; Flachs, E.M.; Boesen, M.; Hansen, P.; Bliddal, H.; Kryger, A.I. Physical
Demand at Work and Sick Leave Due to Low Back Pain: A Cross-Sectional Study. BMJ Open 2019, 9, e026917. [CrossRef]
17. Parker, S.L.; Jimmieson, N.L.; Amiot, C.E. The Motivational Mechanisms Underlying Active and High-Strain Work: Consequences
for Mastery and Performance. Work Stress 2017, 31, 233–255. [CrossRef]
18. Alcadipani, R.; Cabral, S.; Fernandes, A.; Lotta, G. Street-Level Bureaucrats under COVID-19: Police Officers’ Responses in
Constrained Settings. Adm. Theory Prax. 2020, 42, 394–403. [CrossRef]
19. Demerouti, E.; Bakker, A.B.; Nachreiner, F.; Schaufeli, W.B. The Job Demands-Resources Model of Burnout. J. Appl. Psychol. 2001,
86, 499–512. [CrossRef] [PubMed]
20. Bakker, A.B.; Demerouti, E.; Isabel Sanz-Vergel, A. Burnout and Work Engagement: The JD-R Approach. Annu. Rev. Organ.
Psychol. Organ. Behav 2014, 1, 389–411. [CrossRef]
21. Zhang, X.J.; Wang, F.; Zhu, C.W.; Wang, Z.Q. Willingness to Self-Isolate When Facing a Pandemic Risk: Model, Empirical Test,
and Policy Recommendations. Int. J. Environ. Res. Public Health 2019, 17, 197. [CrossRef] [PubMed]
22. Zhang, Q.; Wang, D. Assessing the Role of Voluntary Self-Isolation in the Control of Pandemic Influenza Using a Household
Epidemic Model. Int. J. Environ. Res. Public Health 2015, 12, 9750. [CrossRef]
23. Tsai, L.L.; Morse, B.S.; Blair, R.A. Building Credibility and Cooperation in Low-Trust Settings: Persuasion and Source Account-
ability in Liberia During the 2014-2015 Ebola Crisis. Comp. Polit. Stud. 2020, 53, 1582–1618. [CrossRef]
24. Armitage, C.J.; Conner, M. Efficacy of the Theory of Planned Behaviour: A Meta-Analytic Review. Br. J. Soc. Psychol. 2001, 40,
471–499. [CrossRef] [PubMed]
25. Ajzen, I.; Fishbein, M. Uncerstanding Attitudes and Predicting Social Behavior; Prentice-Hall: Hoboken, NJ, USA, 1980; Volume 278.
26. Ajzen, I. The Theory of Planned Behavior. Organ. Behav. Hum. Decis. Process. 1991, 50, 179–211. [CrossRef]
27. Rowling, L. Theoretical Foundations of Health Education and Health Promotion. Aust. N. Z. Publ. Health 2010, 34, 98. [CrossRef]
28. Conner, M.; Norman, P.; Bell, R. The Theory of Planned Behavior and Healthy Eating. Health Psychol. 2002, 21, 194–201. [CrossRef]
29. Khani Jeihooni, A.; Kouhpayeh, A.; Najafi, S.; Bazrafshan, M.-R. Application Theory of Planned Behavior on Promotion of Safe
Sexual Behaviors among Drug Users. J. Subst. Use 2019, 24, 293–299. [CrossRef]
30. Han, H. Travelers’ pro-Environmental Behavior in a Green Lodging Context: Converging Value-Belief-Norm Theory and the
Theory of Planned Behavior. Tour. Manag. 2015, 47, 164–177. [CrossRef]
31. Han, H.; Hsu, L.-T.; Sheu, C. Application of the Theory of Planned Behavior to Green Hotel Choice: Testing the Effect of
Environmental Friendly Activities. Tour. Manag. 2010, 31, 325–334. [CrossRef]Healthcare 2021, 9, 529 16 of 17
32. Ju, D.; Xu, M.; Qin, X.; Spector, P. A Multilevel Study of Abusive Supervision, Norms, and Personal Control on Counterproductive
Work Behavior: A Theory of Planned Behavior Approach. J. Leadersh. Organ. Stud. 2019, 26, 163–178. [CrossRef]
33. Cheon, J.; Lee, S.; Crooks, S.M.; Song, J. An Investigation of Mobile Learning Readiness in Higher Education Based on the Theory
of Planned Behavior. Comput. Educ. 2012, 59, 1054–1064. [CrossRef]
34. Paul, J.; Modi, A.; Patel, J. Predicting Green Product Consumption Using Theory of Planned Behavior and Reasoned Action.
J. Retail. Consum. Serv. 2016, 29, 123–134. [CrossRef]
35. Yadav, R.; Pathak, G.S. Young Consumers’ Intention towards Buying Green Products in a Developing Nation: Extending the
Theory of Planned Behavior. J. Clean. Prod. 2016, 135, 732–739. [CrossRef]
36. Houston, D.J. “Walking the Walk” of Public Service Motivation: Public Employees and Charitable Gifts of Time, Blood, and
Money. J. Public Adm. Res. Theory 2006, 16, 67–86. [CrossRef]
37. Waterhouse, J. Motivation in Public Management: The Call of Public Service. Aust. J. Public Adm. 2008, 67, 505–507.
38. Perry, J.L.; Vandenabeele, W. Public Service Motivation Research: Achievements, Challenges, and Future Directions. Public Admin.
Rev. 2015, 75, 692–699. [CrossRef]
39. Perry, J.L.; Wise, L. The Motivational Bases of Public-Service. Public Adm. Rev. 1990, 50, 367–373. [CrossRef]
40. Azhar, A.; Yang, K. Workplace and Non-Workplace Pro-Environmental Behaviors: Empirical Evidence from Florida City
Governments. Public Adm. Rev. 2019, 79, 399–410. [CrossRef]
41. Bakker, A.B. A Job Demands-Resources Approach to Public Service Motivation. Public Admin Rev 2015, 75, 723–732. [CrossRef]
42. Bovens, M.; Schillemans, T.; Hart, P.T. Does Public Accountability Work? An Assessment Tool. Public Adm. 2008, 86, 225–242.
[CrossRef]
43. Bovens, M. Analysing and Assessing Accountability: A Conceptual Framework. Eur. Law J. 2007, 13, 447–468. [CrossRef]
44. Page, S. Measuring Accountability for Results in Interagency Collaboratives. Public Adm. Rev. 2004, 64, 591–606. [CrossRef]
45. Wang, X.H. Assessing Administrative Accountability—Results from a National Survey. Am. Rev. Public Adm. 2002, 32, 350–370.
[CrossRef]
46. Ju, Y.B.; Wang, A.H.; Liu, X.Y. Evaluating Emergency Response Capacity by Fuzzy AHP and 2-Tuple Fuzzy Linguistic Approach.
Expert Syst. Appl. 2012, 39, 6972–6981. [CrossRef]
47. Tofil, N.M.; White, M.L.; Grant, M.; Zinkan, J.L.; Patel, B.; Jenkins, L.; Youngblood, A.Q.; Royal, S.A. Severe Contrast Reaction
Emergencies: High-Fidelity Simulation Training for Radiology Residents and Technologists in a Children’s Hospital. Acad. Radiol.
2010, 17, 934–940. [CrossRef] [PubMed]
48. Hammad, K.S.; Arbon, P.; Gebbie, K.M. Emergency Nurses and Disaster Response: An Exploration of South Australian Emergency
Nurses’ Knowledge and Perceptions of Their Roles in Disaster Response. Australas. Emerg. Nurs. J. 2011, 14, 87–94. [CrossRef]
49. Terry, D.J.; Oleary, J. The Theory of Planned Behavior—the Effects of Perceived Behavioral-Control and Self-Efficacy. Br. J. Soc.
Psychol. 1995, 34, 199–220. [CrossRef] [PubMed]
50. Hu, G.; Rao, K.; Sun, Z. A Preliminary Framework to Measure Public Health Emergency Response Capacity. J. Public Health 2006,
14, 43–47. [CrossRef]
51. Chan, L.; Bishop, B. A Moral Basis for Recycling: Extending the Theory of Planned Behaviour. J. Environ. Psychol. 2013, 36, 96–102.
[CrossRef]
52. Perry, J.L. Antecedents of Public Service Motivation. J. Public Adm. Res. Theory J.-Part 1997, 7, 181–197. [CrossRef]
53. Jeannot, G. Motivation in Public Management. Int. Rev. Adm. Sci. 2009, 75, 367–371. [CrossRef]
54. Huang, H.; Chen, Y.; Ma, Y. Modeling the Competitive Diffusions of Rumor and Knowledge and the Impacts on Epidemic
Spreading. Appl. Math. Comput. 2021, 388, 125536. [CrossRef] [PubMed]
55. Wong, L.P.; Sam, I.-C. Public Sources of Information and Information Needs for Pandemic Influenza A(H1N1). J. Community
Health 2010, 35, 676–682. [CrossRef]
56. Kim, S. Education and Public Service Motivation: A Longitudinal Study of High School Graduates. Public Adm. Rev. 2020.
[CrossRef]
57. Cavanaugh, M.A.; Boswell, W.R.; Roehling, M.V.; Boudreau, J.W. An Empirical Examination of Self-Reported Work Stress among
U.S. Managers. J. Appl. Psychol. 2000, 85, 65–74. [CrossRef] [PubMed]
58. Schnall, S.; Roper, J.; Fessler, D.M.T. Elevation Leads to Altruistic Behavior. Psychol. Sci. 2010, 21, 315–320. [CrossRef]
59. Schnall, S.; Roper, J. Elevation Puts Moral Values Into Action. Soc. Psychol. Personal. Sci. 2012, 3, 373–378. [CrossRef]
60. Gamsjager, E.; Sauer, J. Burnout among teachers: An empirical research with teachers of secondary schools in Austria. Psychol.
Erzieh. Unterr. 1996, 43, 40–56.
61. Cavanagh, J.; Fisher, R.; Francis, M.; Gapp, R. Linking Nurses’ Attitudes and Behaviors to Organizational Values: Implications for
Human Resource Management. J. Manag. Organ. 2012, 18, 673–684. [CrossRef]
62. Leisink, P.; Steijn, B. Public Service Motivation and Job Performance of Public Sector Employees in the Netherlands. Int. Rev.
Adm. Sci. 2009, 75, 35–52. [CrossRef]
63. Zhou, P.-P.; Yu, G.; Kuang, Y.-Q.; Huang, X.-H.; Li, Y.; Fu, X.; Lin, P.; Yan, J.; He, X. Rapid and Complicated HIV Genotype
Expansion among High-Risk Groups in Guangdong Province, China. BMC Infect. Dis. 2019, 19, 185. [CrossRef]
64. Behn, R.D. Rethinking Democratic Accountability; Brookings Institution Press: Washington, DC, USA, 2001.
65. Poulsen, B. Competing Traditions of Governance and Dilemmas of Administrative Accountability: The Case of Denmark. Public
Adm. 2009, 87, 117–131. [CrossRef]You can also read