The Intention to Use Fitness and Physical Activity Apps: A Systematic Review - MDPI
←
→
Page content transcription
If your browser does not render page correctly, please read the page content below
sustainability

Review
The Intention to Use Fitness and Physical Activity
Apps: A Systematic Review
Salvador Angosto 1 , Jerónimo García-Fernández 2, * , Irena Valantine 3                and
Moisés Grimaldi-Puyana 2
 1    Department of Physical Education and Sports, Faculty of Sports Sciences San Javier, University of Murcia,
      30720 Santiago de la Ribera (Murcia), Spain; salvador.a.s@um.es
 2    Department of Physical Education and Sports, Faculty of Educational Sciences, Universidad de Sevilla,
      41013 Seville, Spain; mgrimaldi@us.es
 3    Department of Sport and Tourism Management, Lithuanian Sports University, 44221 Kaunas, Lithuanian;
      irena.valantine@lsu.lt
 *    Correspondence: jeronimo@us.es; Tel.: +34-696-584-788

 Received: 16 July 2020; Accepted: 15 August 2020; Published: 17 August 2020

 Abstract: Recently the development of new technologies has produced an increase in the number of
 studies that try to evaluate consumer behavior towards the use of sports applications. The aim of this
 study is to perform a systematic review of the literature on the intention to use mobile applications
 (Apps) related to fitness and physical activity by consumers. This systematic review is a critical
 evaluation of the evidence from quantitative studies in the field of assessment of consumer behavior
 towards sport applications. A total of 13 studies are analyzed that propose models for evaluating the
 intentions to use fitness applications by sport consumers. The results revealed several key conclusions:
 (a) Technology Acceptance Model is the most widely used model; (b) the relationship between
 perceived utility and future intentions is the most analyzed; and (c) the most evaluated applications
 are diet/fitness. These findings could help technology managers to know the most important key
 elements to take into account in the development of future applications in sport organizations.

 Keywords: physical activity; sport application; marketing consumption; technology acceptance
 model; smartphone app

1. Introduction
      The constant technological evolution and the development of new mobile devices such as
Smartphones or tablets offer a higher level of comfort and practical use, thus making this type of device
the center of life for current consumers [1]. Globally, it is estimated that in 2019, there were 6.8 billion
users worldwide and it is expected that in 2023 the number of users will increase to 7.33 billion [2].
In particular, 90% of the time dedicated to the Smartphone is for the use of mobile applications
(Apps) [3].
      Sustainability takes equal account of economic, environmental and social factors in any effort
to improve quality of life [4]. The dissemination and integration of information and communication
technologies (ICT) and data management functionalities have been widely leveraged through the
adoption of mobile devices, which allow people to participate in a larger way in society [5,6]. European
Union (EU) policies emphasize the synergy between smart technologies and sustainable urban
development because of the need for accurate, consistent and timely data for new policy formulation
and the use of ICTs to facilitate service improvement [7,8].
      The role of ICTs in sustainable development is clearly reflected in Goal 11 “make cities and human
settlements inclusive, safe, resilient and sustainable” of the Sustainable Development Goals of the

Sustainability 2020, 12, 6641; doi:10.3390/su12166641                         www.mdpi.com/journal/sustainability
Sustainability 2020, 12, 6641 2 of 24
United Nations Agenda 2030 [9], which considers ICTs as a means to advance human progress and
knowledge in societies, to increase resource efficiency, to promote economic development and protect
the environment or to modernize industries on the basis of sustainable design [9,10]. Online tools and
platforms contribute significantly to the repression of energy demands or pollution, promoting cities
to a more environmentally sustainable economy [11]. Angleidou et al. [7] show that ICTs and the use
of Apps help reduce the need for physical travel and the existence of physical workplaces.
An App is defined as “software applications usually designed to run on a Smartphone or tablet
device and provide a convenient means for the user to perform certain tasks” [12] (p. 211). The increase
is such that Blair [13] reported that the trade of Apps generates 189 billion dollars a year being used at
least 11 times by 49% of users while 21% of the millennials open them at least 50 times a day.
Among them, health, fitness and physical activity Apps represent 5.18% of the total market [14],
being used daily by 35% of people and several times a week by 40% [15]. In recent years, McKay,
Wright, Shill, Stephens, and Uccellini [16] report a proliferation of Apps to improve health, including
Apps to count the steps or promote physical activity in fitness centers, Apps to control diet and caloric
intake or reduce poor habits such as smoking or alcohol consumption and improve mental health.
This increase in interest and number of Apps associated with physical activity could also
have benefits for society. Therefore, the current situation of confinement caused by Covid-19 and
consequently the reduction of physical activity, has encouraged different organizations such as the
World Health Organization [17] to promote the need for physical activity at home. In fact, authors
such as Banskota, Healy, and Goldberg [18] proposed different Apps as tools to maintain and improve
physical and mental fitness in the Covid-19 pandemic. These Apps are linked to the fitness sector,
revolutionizing the ways of doing physical activity and the relationships between fitness providers
and consumers [19].
These new communication and prescription tools in sport could therefore have an impact on how
organizations interact with consumers, with the appearance in recent years of studies that evaluate
consumers’ motivations for using devices, the usefulness of Apps or consumers’ intentions to adopt
them in different areas [20,21]. Particularly, researchers have begun to identify the factors that lead to
the intention to use technologies, Smartphones and Apps in different sectors [22,23], but it is limited in
the sports context.
Among the theories related to the intention to use of technologies, in the context of marketing we
find the “Theory Acceptance Model” (TAM). This is the most used model by researchers to evaluate the
intention to use of new technologies proposed by Davis [24]. TAM is an adaptation of the psychological
theory, the “Theory of Reasoned Action” (TRA), which states that a person’s real behavior is determined
by his or her intention to perform that behavior [25]. For instance, the TAM tries to explain how
consumers use and accept new technologies based on two key beliefs, namely the usefulness of use
and the ease of use that are predictive of consumers’ attitude towards future intention to use the new
technologies [24]. Research based on TAM is one of the most widely used in professional settings
because it focuses on the utilitarian aspect of the technology [26], with the intention of understanding
the consumer’s intention to use it [22]. In particular, TAM has been used in different contexts such as
finance, instant messaging, healthcare, gaming and tourism [27].
Although TAM has great robustness and applicability in terms of intention to use, attitude and
perceived utility [27], different authors have developed new theories based on TAM such as the
“Innovation and Diffusion Theory” (IDT) [28] which considers that the user’s behavioral potential is
driven by the user’s beliefs about innovation. Later, there is the “Unified Theory of Acceptance and
Use of Technology Model (UTAUT)” [29] that proposes four constructs to develop TAM: performance
expectation, social influence, effort expectation and facilitation conditions. A second version of this
model (UTAUT2) adds the constructs of hedonic motivation, price and habit, being adapted by Yuan,
Ma, Kanthawala, and Peng [30] to measure the intention to use of health and fitness Apps. In addition,
in sport, the “Sport Website Acceptance Model” (SWAM) is proposed by Hur, Ko, and Claussen [31]
and is based on a framework of understanding how sport fans perceive and accept the websites ofSustainability 2020, 12, 6641 3 of 24
their sport teams, how their level of participation and commitment to the sport team influences the
intention to use the website and the actual consumption behavior they ultimately perform. Based
on these models and theories, in recent years researchers have paid attention to the intention to
use new technologies in different contexts such as e-payment, e-government, e-banking, retail or
education [32–36]. Similarly, in academic sports literature there is also an increasing attention to
the behavior of fans and consumers, with studies with different approaches such as motivation
on sports websites [31], loyalty [37], participation, commitment and attributes [38,39], marketing
opportunities [40], intention to use sports wearable [41], consumption of Smartphones and sports
Apps [42], sports team Apps [1], fitness Apps [43,44] and sports products [45,46].
However, existing research does not provide clear results on what factors drive sports fans or
consumers to use Smartphones or Apps and to benefit from new forms of experiences in sport [42].
In fact, the factors influencing the intention to use Smartphones and Apps differ depending on the
types of products consumed and the marketing implications [47]. Therefore, while studies have been
conducted on the intentions of use of technology, Smartphones and fitness Apps, there is not a review
that captures the main findings of these studies. For this reason, the aim of this study is to conduct a
systematic review of the literature on consumers’ intention to use Apps related to fitness and physical
activity by consumers.
2. Materials and Methods
2.1. Search Strategy
The search terms for Smartphone use, Fitness and Sport Apps represented the concepts of App,
Physical Activity and Use, with the search strategy for the different databases presented in Table 1.
Different databases were selected to include a wide range of areas related to this interdisciplinary
study, including sports science, marketing, health and psychology. The databases used were Web
of Science, Scopus, SPORTDiscus (EBSCO), PsycINFO (Ovid), ABI/Inform (Ovied) and MEDLINE
(Pubmed). The search was conducted between 18 March 2019 and 4 August 2020. The search covered
all years and no limitations were placed on document type and language.
Table 1. Database search strategy.
Category Search Terms
(“Smart phone *” or Smartphone * or smart-phone * or “cell * phone” or “cell-phone *” or
App “mobile phone *” or “mobile-phone” or “mobile device” or “mobile telephone” or * phone or
Android * or iOS or app or apps or “mobile application *” or application)
(“physical activit *” or exercise * or “active living” or walk * or “active transport” or “leisure
Physical
activit *” or fitness or sport or “sport *” or “weight maintenance” or “maintaining weight” or
Activity
“weight management”)
(“intention to use” or “app * usage” or “intent * to use” or usage or “behavioral intention *” or
Use “behavior * change” or usability or “attitude toward” or consumption or Technology
Acceptance Model)
Combination 1 and 2 and 3
* Truncation operator: word-based search.
2.2. Inclusion and Exclusion Criteria
For the purposes of this review, we included empirical papers in peer-reviewed journals, excluding
dissertations and abstracts. Grey literature was not included, ruling out evaluation reports, annual
reports, articles in nonpeer reviewed journals and other means of publication. The inclusion criteria
for the articles in the search were: (i) journal articles; (ii) publications in English; (iii) use of any type
of mobile application in the sports and fitness context; and (iv) measurement of the intention to use
the App through a questionnaire. As exclusion criteria have been used: (i) Congress proceedings,
book chapters, books or other types of publications; (ii) no mobile Apps were used in the sports context,Sustainability 2020, 12, x FOR PEER REVIEW 4 of 25
any type of mobile application in the sports and fitness context; and (iv) measurement of the intention
to use the2020,
Sustainability App through
12, 6641 a questionnaire. As exclusion criteria have been used: (i) Congress 4 of 24
proceedings, book chapters, books or other types of publications; (ii) no mobile Apps were used in
the sports context, (iii) theoretical studies, qualitative approach or reviews; (iv) articles in a language
(iii)
other theoretical studies,
than English; andqualitative approach
(v) duplicate articles.or reviews; (iv) articles in a language other than English;
and (v) duplicate articles.
2.3. Assessment of Methodological Quality
2.3. Assessment of Methodological Quality
The risk of bias was assessed using a 20-item tool adapted by the authors to the context of sports
The risk of bias was assessed using a 20-item tool adapted by the authors to the context of
marketing study typology in which there are no intervention processes on the subjects of the
sports marketing study typology in which there are no intervention processes on the subjects of the
Consolidated Standards of Reporting Trials (CONSORT) checklist [48]. Each study was
Consolidated Standards of Reporting Trials (CONSORT) checklist [48]. Each study was independently
independently scored by two reviewers evaluating the different sections that make up the studies
scored by two reviewers evaluating the different sections that make up the studies and scoring each
and scoring each item with 1 if the study satisfactorily met the criterion, and with 0 if the study did
item with 1 if the study satisfactorily met the criterion, and with 0 if the study did not satisfactorily
not satisfactorily meet the criterion or if the item was not applicable to the study. Disagreements
meet the criterion or if the item was not applicable to the study. Disagreements between the reviewers
between the reviewers were resolved by checking and discussing the original study until consensus
were resolved by checking and discussing the original study until consensus was reached. Reviewer A
was reached. Reviewer A is a researcher with extensive experience specializing in the field of sports
is a researcher with extensive experience specializing in the field of sports management, fitness centers
management, fitness centers and development of new technologies. Reviewer B is a predoctoral
and development of new technologies. Reviewer B is a predoctoral fellow in sports management with
fellow in sports management with focus research on methodological and statistical aspects. The
focus research on methodological and statistical aspects. The results of assessment of methodological
results of assessment of methodological quality were shown in Appendix A.
quality were shown in Appendix A.
2.4. Data
2.4. Data Extraction
Extraction and
and Synthesis
Synthesis
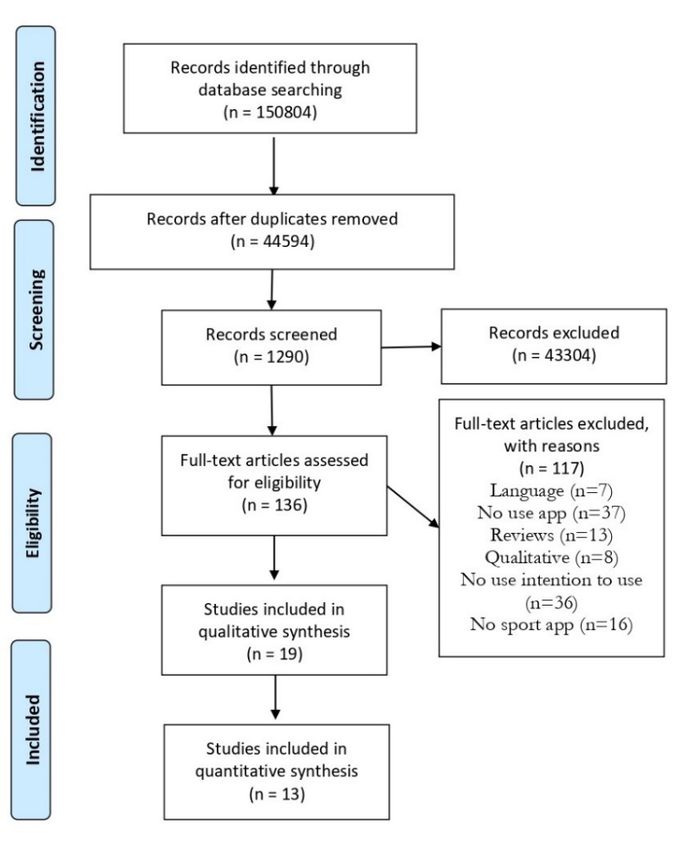
Figure 11 shows
Figure shows thethe Flow
Flow Diagram
Diagram proposed
proposed by by Moher,
Moher, Liberati,
Liberati, Tetzlaff,
Tetzlaff, and
and Altman
Altman [49]
[49]
followingthe
following thePRISMA
PRISMAmethodology
methodology in in
allall points
points thatthat could
could be common
be common to a systematic
to a systematic review review
of theseof
these characteristics. The initial database search returned 113,537 results, reduced
characteristics. The initial database search returned 113,537 results, reduced to 36,105 once duplicates to 36,105 once
duplicates
were were eliminated.
eliminated. One reviewer One revieweraconducted
conducted full scan ofathe
fulltitle,
scanthen
of the
an title, thenreview
abstract an abstract review
and finally a
andtext
full finally a full
review textthe
using review usingand
inclusion theexclusion
inclusioncriteria.
and exclusion
Amongcriteria. Among
the articles the articlesat that
that remained the
remained
abstract at the
level (n abstract level (nreviewer
= 4), a second = 4), a second reviewer also
also examined examinedofthe
the abstracts theabstracts of confirm
articles to the articles
theirto
confirm their
eligibility, andeligibility,
there wereand there were no with
no discrepancies discrepancies with the first reviewer.
the first reviewer.
Figure 1. PRISMA flow diagram. Source: Moyer et al. [49].Sustainability 2020, 12, 6641 5 of 24
A form was developed for data extraction that included the following aspects: (a) year of
publication; (b) country of study; (c) number of participants; (d) gender; (e) age of participants;
(f) type of application evaluated; (g) theory used; (h) analyses performed; (i) variables included;
and (j) main results. In order to homogenize the results of the different studies and to make the data
more homogeneous, the confidence intervals of each correlation (CI 95%) and the effect size with its
confidence intervals (CI 95%) of each relationship were calculated through the Fisher’s Z statistics [50].
3. Results
3.1. Analysis of the Risk of Bias in Studies
To test quality, risk of bias analysis of the 19 studies evaluated in the research showed that only
three studies had a high score of 15 points or more out of 20 total [1,45,51], most studies (n = 14) had
a mean score between 10 and 15 points and only two studies had a score below 10 points [52,53].
It should be noted that none of the studies analyzed carried out a calculation of the sampling required
for the generalization of the results, which could be due to the fact that all the studies carried out a
selection of the sample for convenience within a certain population. There are also few studies that
established criteria for inclusion in the sample to be selected (n = 5) and no study indicates the author
who carried out each part of the research.
3.2. Summary of Reported Intervention Outcomes
Results of the descriptive data from the analysis of the articles can be seen in Table 2. The analysis
shows that this topic is very recent within the context of sports marketing, with only 13 quantitative
studies addressing the intention to use of sports applications by the sports consumer through the use of
self-administered questionnaires and online. Of the articles analyzed, the majority were published in
2018 (n = 5) and 2020 (n = 5), followed by those published in 2017 (n = 4), three articles were published
in 2015, while only one article was found in 2016 and 2019. Korea has been the country with the highest
production with six articles, followed by the United States and Hong Kong with three publications,
China had two studies and other countries such as Germany, India, Iran, South Africa and Taiwan
each had one publication.
Analyzing the sample used in the different studies, there is a total of 16,025 subjects with an
average sample of 843.42 subjects per study, with the Ndayizigamiye; Kante, and Shingwenyana
study [54] having the smallest sample (n = 139) and Wei, Vinnikova, Lu and Xu study [55] having the
largest sample with a total of 8840 subjects. Approximately a half of the studies (n = 8) used university
students as a sample, followed by studies that considered users of sports applications (n = 4) and other
studies took as their general population [54–56], a population of sports consumers [45], employees
of a sports organization [57] and members of a fitness community [44,58]. Most studies had a higher
proportion of females than males (n = 9), followed by studies that had parity in the sample (n = 5),
four studies had a higher proportion of males while one study did not indicate the gender distribution
of the sample [34]. Finally, all studies except Ha et al. [42] and Yoo et al. [53] reported some data on
the age of the subjects. About half of the studies (n = 10) expressed age using a range, five studies
showed age using mean (M = 24.58 years) and two studies did not specify the age [55,59]. The analysis
indicated that mainly the study population are young subjects between 20 and 29 years old and all are
over 18 years old except Lee, Kim and Wang [45] which also included 17-year-old subjects. Li, Liu,
Ma and Zhang [46] sampled subjects over 25 years of age, while Huang and Ren [60] and Mohammadi
and Isanejad [57] were at least 30 years old.Sustainability 2020, 12, 6641 6 of 24
Table 2. Descriptive data of the analysis of the selected studies.
Data Analysis
Authors Country Sample App Type Theory Measure Outcomes
Methods
Trust in the Fitness App Developer; Descriptive
German’s app user (n = 476)
Sport Social Norm; Injunctive Social Norm; Perceived
Beldad & Hegner [43] Germany Male: 50.0% Female: 50.0% Age: TAM Content Analysis
information Ease of Use; Perceived Usefulness; Intention to
26.7 ± 5.0
Continue Using a Fitness App
Korean consumers (n = 261)
Perceived Enjoyment; Perceived Ease of Use;
Byun, Chiu, & Bae Male:4 9.1%; Female: 50.9%
Korea Sport Brand TAM Content Analysis Perceived Usefulness; Intention to use; Actual
[45] Age: 20–29 (29.9%); 30–39
usage
(34.9%); 40+ (5.2%)
Fitness Community (n = 994) Health Consciousness; Optimism; Innovativeness;
Age: 20− (10.06%); 20–29 Discomfort; Insecurity; Perceived Ease of Use;
Chen & Lin [44] Taiwan Diet/Fitness TRAM Content Analysis
(56.14%); 30–39 (1.83%); 40–49 Perceived Usefulness; Attitude toward Using
(8.65%); 50–59 (3.32%) App; Intention to download app
Korean university students
(n = 204) Optimism; Innovativeness; Insecurity;
Descriptive
Chiu & Cho [61] Hong Kong Male: 51.9%; Female: 48.1% Health/Fitness TRAM Discomfort; Perceived Usefulness; Perceived Ease
Content Analysis
Age: 19–25 (71.8%); 26–30 of Use; Perceived Enjoyment; Intention to use
(10.7%); 30+ (17.5%)
Chinese population (n = 342)
Investment size; Quality of alternative;
Male: 45.6%; Female: 54.4% Descriptive
Commitment; Confirmation of expectations;
Chiu, Cho, & Chi [56] Hong Kong Age: 20− (1.2%); 21–25 (14.9%); Health/Fitness ECM Correlational
Satisfaction; Perceived Usefulness; Continuance
26–30 (35.4%); 31–35 (29.8%); Content Analysis
Intention
36–40 (11.1%); 40+ (7.6%)
University students (n = 294) Appearance Evaluation; Fitness Evaluation;
Cho, Lee, Kim, & Park Correlational
Korea Male: 33.0% Female: 67.0% Diet/Fitness TAM Appearance Orientation; Fitness Orientation;
[59] Content Analysis
Age: 23.2 Perceived Usefulness; Intention to Use App
University students (n = 508) Subjective Norms; Entertainment; Recordability;
Cho, Lee, & Quinlan Descriptive
Korea Male: 34.6%; Female: 65.4% Diet/Fitness TAM Networkability; Perceived Ease of Use; Perceived
[51] Content Analysis
Age: 21.5 Usefulness; Behavioral Intention to Use
Smartphone Use Efficacy; Internet Information
University students (n = 277)
Use Efficacy; Internet Information Credibility;
Cho & Kim [52] Korea Male: 34.3%; Female: 65.7% Diet/Fitness TAM Content Analysis
Perceived Ease of Use; Perceived Usefulness;
Age: 22.5
Behavioral Intention
Indian fitness lefts users (n = 324) Performance Expectancy; Effort Expectancy; Self
Descriptive
Dhiman, Arora, Male: 54.0%; Female: 46.0% Efficacy; Social Influence; Facilitating Conditions;
India Fitness UTAUT2 Correlational
Dogra, & Gupta [58] Age: 20− (16.0%); 20–40 (80.0%); Hedonic Motivation; Price Value; Personal
Content Analysis
40+ (4.0%) Innovativeness; Habit; Behavioral IntentionSustainability 2020, 12, 6641 7 of 24
Table 2. Cont.
Data Analysis
Authors Country Sample App Type Theory Measure Outcomes
Methods
Sport Involvement; Sport Commitment; Social
University students (n = 226) Influence; Personal Attachment; Media
Sport Descriptive
Ha, Kang, & Kim [42] Korea Male: 50.8%; Female: 49.2% TAM Multitasking; Perceived Enjoyment; Perceived
Information Content Analysis
Age: 25.3 Ease of Use; Perceived Usefulness; Usage
Intention
Instruction Provision; Self-Monitoring;
Chinese app users (n = 449)
Self-Regulation; Goal Attainment; Exercise Self
Huang & Ren [60] Hong Kong Male: 43.0%; Female: 57.0% Fitness TAM Regression
Efficacy; Perceived Usefulness; Perceived Ease of
Age: 31.85 ± 6.9
Use; Perceived Enjoyment; Continuance Intention
App users (n = 233)
Male: 68.2% Female: 31.8% Innovativeness; Perceived Ease of Use; Perceived
United Descriptive
Kim, Kim, & Rogol [1] Age: 18–24 (46.8%); 25–34 Sport Team TAM Enjoyment; Perceived Trust; Perceived Usefulness;
States Content Analysis
(31.8%); 35–44 (13.7%); 45–54 Intention; Sport Apps Use
(7.3%); 55+ (0.4%)
College students (n = 267) Entertainment Motivation; Social Utility
Lee, Kim, & Wang United Male: 32.2% Female: 67.8% Correlational Motivation; Performance Expectancy; Effort
Sport App UTAUT
[62] States Age: 17–20 (48.3%); 21–25 Content Analysis Expectancy; Social Influence; Intention to Mobile
(40.8%); 26–29 (8.2%); 29+ (2.6%) Sports Apps Use
Sport App users (n = 211)
Activity Amount Ranking; Activity Frequency
Li, Liu, Ma, & Zhang Male: 45.02% Female: 54.98% Social
China UTAUT2 Content Analysis Ranking; Confirmation; Upward Comparison
[63] Age: 25–30 (41.71%); 30–35 Fitness-tracking
Tendency; Continuous Intention
(47.87%) 35+ (10.43%)
Employers Sport Organization
Technology Anxiety; Technology Self-efficacy;
(n = 332) Descriptive
Mohammadi & Perceived Enjoyment; Perceived Ease of Use;
Irán Male: 37.3% Female: 62.7% IT information TAM Correlational
Isanejad [57] Perceived Usefulness; User Satisfaction; Attitude;
Age: 30− (10.0%); 31–40 (44%); Content Analysis
Intention to use
41–50 (38%); 50+ (8%)
South African population
Ndayizigamiye; (n = 139) Awareness, Effort Expectancy; Facilitating
Correlational
Kante, & South Africa Male: 41.5%; Female: 58.5% mHealth UTAUT Conditions; Performance Expectancy; Social
Content Analysis
Shingwenyana [54] Age: 18–23 (57.15%); 24–29 Influence; Behavioral Intention
(29.9%); 30–35 (7.5%)Sustainability 2020, 12, 6641 8 of 24
Table 2. Cont.
Data Analysis
Authors Country Sample App Type Theory Measure Outcomes
Methods
Perceived Benefits; Perceived Barriers; Perceived
Descriptive
Wei, Vinnikova, Lu, & Chinese population (n = 8840) Threats; Self-Efficacy; Risk Perception;
China Diet/Fitness UTAUT Correlational
Xu [55] Male: 4.78%; Female: 74.55% Performance Expectancy; Weight Loss Intention;
Content Analysis
Behavioral Intention; Use Behavior
University students (n = 1331) Perceived Trust; Perceived Usefulness; Attitude;
Yoo, Ko, & Yeo [53] Korea Sport Content TAM Content Analysis
Male: 65.9%; Female: 34.1% Using intention
Yuan, Ma, University students (n = 317) Performance expectancy; Effort expectancy; Social
United
Khantawala & Peng Male: 21.1% Female: 78.9% Diet/Fitness UTAUT2 Content Analysis influence; Facilitating conditions; Price value;
States
[30] Age: 21 Hedonic motivation; Habit; Intention to use
ECM: Expectation-Confirmation Model.Sustainability 2020, 12, 6641 9 of 24
Regarding the type of App evaluated, six studies evaluated the intention to use diet and fitness
applications [30,44,51,52,55,59], another five studies evaluated sports information Apps [42,43,53,57,62],
two studies measured the intention of fans to use the sports team app [1,45], health and fitness app [56,61],
or fitness [58,60] and one study evaluated a social fitness-tracking app [63] and mHealth related to
promote physical activity [54]. The most widely used theory for the design and use of the mobile
sports app intent of use assessment instrument was TAM (n = 10). Chen and Lin [44] and Chiu and
Cho [61] used a variant of the TAM, Theory of Readiness and Acceptance Model (TRAM), three studies
used UTAUT [54,55,62] and UTAUT2 [30,58,63], and an article with the Expectation-Confirmation
Model (ECM) [56]. The most common method of analysis used was a content analysis by structural
equations using the AMOS statistical package (n = 9) and the rest of the Partial Least Square studies.
Seven studies also performed a correlation analysis of the data [54–59,62], and eight studies performed
descriptive analysis in addition to content analysis [1,42,51,55–58,61].
The variables used by the different studies have been very varied, where the intention to use App
has been found in all studies as a common factor. Considering that this systematic review study focused
on studies based on TAM as the most commonly used theory in sports marketing studies, it implies that
there are other common variables among most studies such as perception of usefulness (n = 13) and
perception of ease of use (n = 10). Some studies have included other different perceptions by relating
them to the previous ones and the intention to use, such as the perception of enjoyment [1,42,45,60,61]
or the perception of trust [1,53]. The remaining variables used have been very diverse, with each study
using different variables that can be seen in Table 2. However, the variable of social influence has
received greater interest from researchers and has been considered in five studies [30,42,54,58,62].
Analyzing the quantitative data on the relationships between the most common variables
associated with TAM (Table 3), the six studies that had a different theory such as UTAUT [54,55,62] or
UTATUT2 [30,58,63] were excluded; however, the study that used ECM was included because there
was a relationship between variables “perception usefulness” and “intention to use” [56]. The sample
was very heterogeneous in terms of the results of the existing relationships and sample size in each
study. In order to homogenize these results, the effect size of each correlation was calculated. A total
of seven relationships were identified between the different variables associated with TAM such as
perception of ease of use (PEOU), perception of utility (PU), perception of enjoyment (PE), perception
of trust (PT), intention to use (ITU) and actual usage (AU).Sustainability 2020, 12, 6641 10 of 24
Table 3. Quantitative data on the relationships between “Theory Acceptance Model” (TAM) variables in the selected studies.
PE-PEOU PEOU-PU PE-ITU PEOU-ITU PU-ITU PT-ITU ITU-AU
Authors
R (CI 95%) R (CI 95%) R (CI 95%) R (CI 95%) R (CI 95%) R (CI 95%) R (CI 95%)
0.180 *** 0.440 *** 0.330 ***
Beldad & Hegner [43] - - - -
(0.092; 0.266) (0.365; 0.510) (0.246; 0.408)
0.584 *** 0.583 *** 0.454 *** 0.157 * 0.318 *** 0.306 ***
Byun, Chiu, & Bae [45] -
(0.498–0.659) (0.497; 0.658) (0.352; 0.545) (0.036; 0.273) (0.205; 0.423) (0.19; 0.41)
0.650 *** 0.310 *** 0.510 *** 0.530 ***
- - -
Chen & Lin [44] (0.613; 0.685) (0.253; 0.365) (0.463; 0.555) (0.484; 0.573)
0.660 *** 0.300 *** 0.500 *** 0.520 ***
- - -
(0.623; 0.694) (0.24; 0.36) (0.452; 0.545) (0.473; 0.546)
0.453 *** 0.222 *** 0.293 *** 0.213 ** 0.373 ***
Chiu & Cho [61] - -
(0.337; 0.556) (0.087; 0.349) (0.162; 0.414) (0.078; 0.340) (0.248; 0.486)
0.299 **
Chiu, Cho, & Chi [56] - - - - - -
(0.199; 0.392)
0.750 ***
Cho, Lee, Kim, & Park [59] - - - - - -
(0.70; 0.80)
0.229 *** 0.001 0.431 ***
Cho, Lee, & Quinlan [51] - - - -
(0.145; 0.310) (−0.086; 0.088) (0.357; 0.500)
0.580 *** −0.130 0.800 ***
Cho & Kim [52] - - - -
(0.496; 0.653) (−0.244; −0.012) (0.753; 0.839)
0.770 * 0.870 * −0.08 0.350 * 0.090
Ha, Kang, & Kim [42] - -
(0.711–0.818) (0.834; 0.899) (−0.51; 0.208) (0.230; 0.460) (−0.041; 0.218)
0.233 *** 0.270 *** 0.404 ***
Huan & Ren [60] - - - -
(0.144; 0.319) (0.182; 0.354) (0.324; 0.479)
0.313 ** 0.163 0.628 *** 0.387 * 0.787 ***
- - (0.192; 0.424) (0.035; 0.286) (0.543; 0.700) (0.272; 0.491) (0.733; 0.831)
Kim, Kim, & Rogol [1]
0.331 *** 0.204 0.728 *** 0.475 * 0.806 ***
(0.212; 0.440) (0.078; 0.324) (0.661; 0.783) (0.369; 0.569) (0.756; 0.847)
0.287 ** 0.149 0.580 *** 0.359 * 0.808 ***
(0.165; 0.400) (0.021; 0.272) (0.489; 0.660) (0.241; 0.466) (0.758; 0.848)
0.370 ** 0.386 ** 0.173 ** 0.192 **
Mohammadi & Isanejad [57] - - -
(0.273–0.459) (0.290; 0.473) (0.067; 0.283) (0.086; 0.293)
0.454 *** 0.403 *** 0.963 ***
Yoo, Ko, & Yeo [53] - - - -
(0.410; 0.496) (0.357; 0.447) (0.959; 0.967)Sustainability 2020, 12, 6641 11 of 24
Table 3. Cont.
Fisher’s Z Fisher’s Z Fisher’s Z Fisher’s Z Fisher’s Z Fisher’s Z Fisher’s Z
Authors
(CI 95%) (CI 95%) (CI 95%) (CI 95%) (CI 95%) (CI 95%) (CI 95%)
Beldad & Hegner [43] - 0.18 (0.09; 0.27) - 0.47 (0.38; 0.56) 0.34 (0.25; 0.43) - -
Byun, Chiu, & Bae [45] 0.67 (0.55; 0.79) 0.67 (0.55; 0.79) 0.49 (0.37; 0.61) 0.16 (0.04; 0.28) 0.33 (0.21; 0.45) - 0.32 (0.19; 0.44)
- 0.78 (0.71; 0.84) - 0.32 (0.26; 0.38) 0.56 (0.50; 0.63) - 0.59 (0.53; 0.65)
Chen & Lin [44]
- 0.79 (0.73; 0.86) - 0.31 (0.25; 0.37) 0.55 (0.49; 0.61) - 0.58 (0.51; 0.64)
Chiu & Cho [61] 0.49 (0.35; 0.63) 0.23 (0.09; 0.36) 0.30 (0.16; 0.44) 0.22 (0.08; 0.35) 0.39 (0.25; 0.53) - -
Chiu, Cho, & Chi [56] - - - - 0.31 (0.20; 0.41) - -
Cho, Lee, Kim, & Park [59] - - - - 0.97 (0.86; 1.09) - -
Cho, Lee, & Quinlan [51] - 0.23 (0.15; 0.32) - 0.001 (−0.09; 0.09) 0.46 (0.37; 0.55) - -
Cho & Kim [52] - 0.66 (0.54; 0.78) - −0.13 (−0.25; −0.01) 1.10 (0.98; 1.21) - -
Ha, Kang, & Kim [42] 1.02 (0.89; 1.15) 1.33 (1.20; 1.46) 0.08 (−0.05; 0.21) 0.37 (0.23; 0.50) 0.09 (−0.04; 0.22) - -
Huan & Ren [60] - - 0.24 (0.14; 0.33) 0.28 (0.18; 0.37) 0.43 (0.34; 0.52) - -
0.32 (0.19; 0.45) 0.16 (0.04; 0.30) 0.74 (0.61; 0.87) 0.41 (0.28; 0.54) 1.06 (0.93; 1.19)
Kim, Kim, & Rogol [1] - - 0.34 (0.214; 0.47) 0.21 (0.08; 0.34) 0.92 (0.80; 1.05) 0.52 (0.39; 0.65) 1.12 (0.99; 1.24)
0.30 (0.16; 0.42) 0.15 (0.02; 0.28) 0.66 (0.53; 0.79) 0.38 (0.25; 0.51) 1.12 (0.99; 1.25)
Mohammadi & Isanejad [57] 0.39 (0.28; 0.50) 0.41 (0.30; 0.51) - 0.17 (0.07; 0.28) 0.19 (0.09; 0.30) - -
Yoo, Ko, & Yeo [53] - - - - 0.49 (0.44; 0.54) 0.43 (0.37; 0.48) 1.99 (1.93; 2.04)
Note: * p ≤ 0.05; ** p ≤ 0.01; *** p ≤ 0.001; PE: Perceived Enjoyment; PEOU: Perceived Ease of Use; PT: Perceived Trust; PU: Perceived Usefulness; ITU: Intention to Use; AU: Actual Usage.Sustainability 2020, 12, 6641 12 of 24
The first relationship between the variables PE and PEOU was found in four different studies
showing results of different degree of relationship, although all significant. In the study by Mohammadi
and Isanejad [57], the effect size was found to indicate a low-medium influence of PE on PEOU [Fisher’s
Z = 0.39 (0.2; 0.50)], Chiu and Cho [61] found a medium influence [Fisher’s Z = 0.49 (0.35; 0.63)],
while Byun et al. [45] found a medium-high influence of PE on PEOU [Fisher’s Z = 0.67 (0.55; 0.79)] and
a very high influence of enjoyment in students on ease of use [Fisher’s Z = 1.02 (0.89; 1.15)]. Another
relationship of perceptions and the most studied is between PEOU and PU. Although all the existing
relationships were significant, they had different levels of relationship: for example, three studies
had a low influence of PEOU on PU with values lower than 0.30 [43,51,61], while Mohammadi and
Isanejad [57] found that PEOU had an influence on lower-middle on PU [Fisher’s Z = 0.41 (0.30; 0.54)].
Other studies found a high or very high influence between these two variables [Fisher’s Z ≥ 0.66]. In the
selected studies, no other studies were found where the different dimensions of TAM were interrelated.
The relationship of the different variables on the ITU is explained below. Firstly, four studies
found an influence of PE on ITU where PE had a low influence [60,61], and moderate and significant
influence on ITU in the different models evaluated with an effect size range between 0.30 and
0.49 [1,45]. In contrast, Ha et al. [42] did not find that PE had an influence on ITU [Fisher’s Z = 0.08
(−0.05; 0.21)]. One of the most studied relationships is the PEOU with ITU, being tested in ten studies
with contradictory results. Seven studies found a significant relationship, however, except Beldad and
Hegner [43] which had a moderate influence [Fisher’s Z = 0.47 (0.38, 0.56)] and Chen and Lin [44] in
their study evaluated two models with moderate-low influences [Fisher’s Z1 = 0.31 (0.25, 0.37); Fisher’s
Z2 = 0.32 (0.26, 0.38)]. The rest had a low influence [45,57,60,61] or nonsignificant influence [1,51,52].
The relationship between PU and ITU was evaluated in all of the studies analyzed finding different
levels of relationship in the studies. Most studies (n = 9) found a moderate and significant influence
between both variables with a range of Fisher’s Z = 0.31–0.66 [1,43–45,51,53,56,60,61]. Some studies
found a significant high to very high ratio with a large influence of PU on ITU based on effect size
values above 0.70 [52,59] and in two of the three models proposed by Kim et al. [1]. Mohammadi and
Isanejad [57] found a low influence on sports organization employees [Fisher’s Z = 0.19 (0.09, 0.30) and
Ha et al. [42] found no PU influence on ITU in university students on sports information Apps.
In turn, two studies evaluated the relationship between PU and ITU observing the existence
of a moderate and significant influence between both variables in the three models proposed by
Kim et al. [1] [Fisher’s Z = 0.38–0.52] and Yoo et al. [53] [Fisher’s Z = 0.43 (0.37; 0.48)]. Finally,
some studies evaluated the relationship between ITU and AU found relationships where ITU had
a moderate-low influence [45] [Fisher’s Z = 0.32 (0.19, 0.44)], while other studies found a moderate
influence [44] and a very high influence [1,53].
3.3. Summary of Factors Relationship by Age
In order to carry out the analysis of the different relationships between the factors analyzed
(Table 3) based on age, an analysis was made of the data shown by the different studies. The studies
have been classified into three groups considering the mean age or the age range with the highest
percentage. One group was established with six studies that had a higher proportion of subjects
under 25 years [1,51–53,59,61], a second group formed by three studies with the age of the subjects
between 25 and 30 years [42,43,56] and finally, a third group had a higher proportion of subjects over
30 years [45,57,60]. Chen and Lin’s study [44] was not classified as it indicated that their sample was
mostly composed of subjects between 20 and 30 years of age.
The relationship between PE and PEOU showed that the study of group 25–30 years was very
high and significant [42], compared to group under 25 and group over 30, which had very similar
moderate and significant relationships with an effect size range between 0.39 and 0.67 [45,57,61].
The relationship between PEOU and PU found that the studies with the lowest influence [43] and the
highest influence [42] belonged to the group 25–30. The studies of the group over 30 had generally
more influencing than the group under 25 who had the most studies with a low influence. However,Sustainability 2020, 12, 6641 13 of 24
the study by Chen and Lin [44] reported that in their two models the relationship between PEOU
and PU was high above 0.70, and significant. Concerning the PE relationship on ITU, the group over
30 had a moderate and significant overall influence [45,60], being higher than the group under 25 [1,61],
while the study of the group 25–30 found no relationship between these two factors [42].
The group 25–30 revealed a significant influence of moderate level on the relationship between
PEOU and ITU with effect sizes higher than 0.37 [42,43], and the studies of the group over 30 found the
existence of significant relationships with a low influence [45,57,60]. On the other hand, most studies of
the group under 25 did not show the existence of significant differences between these factors [1,51,52],
except the study of Chiu and Cho [62] that had a low and significant influence. Chen and Lin [44]
obtained moderate-low relations in their two models in the population between 20 and 30 years old.
The most studied relationship in all studies was between PU and ITU, with a great variability in the
results according to the different studies in each age group. Therefore, the larger influence has been
found in the studies of the group under 25, with studies that had moderate [51,53,60], high [1,59] and
very high [52] relationships, while one study of the group 25–30 observed a high influence [59] and
two studies showed moderate influences [43,56]. However, the group 25–30 had one study in which no
relationship was found between PU and ITU [42]. The group over 30 had all significant relationships
with a variable low level [57] to moderate level [45,60]. In addition, Chen and Lin [44] reported a
moderate influence of PU on UTI in their two proposed models. Finally, the relationship between ITU
and AU has not been studied much, and no studies were found that took it into account in the group
25–30. Regarding the other two groups, the group under 25 obtained that the youngest ones presented
a great influence between ITU and AU giving them significant and high relationships with an effect
size above one point [1,53]. In the study of group over 30, a moderate-low relationship was found [45],
and Chen and Lin had moderate-significant relationships [44].
4. Discussion
The continuous technological advances have awakened the interest of marketing researchers in
the intention to use Apps, especially in the field of sports. Walter [64] explained the existence of a trend
towards increased interest by fitness consumers in using Apps for exercise control. Therefore, the aim
of this study was to conduct a systematic review of the literature on consumers’ intention to use Apps
related to fitness and physical activity. The result of the systematic search has been the existence of a
remarkable interest in the subject, as the studies were found in the last four years; however, studies
focused on sport Apps are still limited (n = 19) with very heterogeneous methodologies.
In the context of marketing, the existence of different theories to explain sports consumer behavior
has been observed, with TAM being the most applied in the different studies found (n = 10) or some
version derived from it such as TRAM [44,61], UTAUT in the study carried out by Lee et al. [62],
Ndayizigamiye et al. [54] and Wei et al. [55], or UTAUT2 used by Dhiman et al. [58], Li et al. [46]
and Yuan et al. [20]. One study used a different model, ECM, which was not derived from TAM [56].
Although most publications use the same base, no similar studies have been found that can be
compared since the different authors have used the two basic constructs (PEOU and PU) of the theory
proposed by Davis [24] and have incorporated other variables such as PE [1,42,45,57,60,61] or PT [1,53].
In addition, they have been relating these variables to the Apps ITU and AU [1,44,45,53] or to various
other variables outside of TAM such as social influence [30,42,54,58,62], Health Consciousness [44],
social norms [43] or sports context as sport involvement or sport commitment [42].
Most of the studies analyzed have tried to predict the influence of PEOU and PU on ITU, finding
significant relationships between both constructs [42–45,51,52,57,61]. These relationships have been
evaluated previously in the context of sport websites as a technological tool prior to the appearance of
the Apps [31,38,39,65]. However, the findings found are different from those proposed by different
studies that concluded with a greater influence of PU on PEOU in ITU [24,38,49,65–70] or where PEOU
had no significant influence on ITU [1,51,52] or in the case of Ha et al. [42] where they found that PUSustainability 2020, 12, 6641 14 of 24
had no influence on ITU as opposed to PEOU. In particular, it should be noted that Davis [24] argued
that PEOU is a secondary determinant construct of ITU in the perception of technology.
Furthermore, the use of other added beliefs such as PE or PT can also play a key role within the
TAM, as PE not only has influence on PEOU [42,45,57,61] but also on ITU [1,45,60,61]. Ha et al. [42]
found no influence of PE on ITU, but the authors felt that while it was not related to ITU, it was related
to PEOU, allowing sports consumers to undermine the difficulty of using the technology [71]. These
results highlight the hedonic motives of sports consumers who often overlook entertainment [26,65,71]
and may make the App more interesting to sports fans if they find it fun and easy to use. On the other
hand, PT has been found to be an important and influential factor on ITU [1,38,39,53,69]; this importance
may be motivated by the fact that if a sports fan finds the information they receive useful and reliable
they will show a greater interest in continuing to use the technology.
For example, in a study in Germany on the use of fitness Apps, it showed that the reasons for
using them were to have the achievement of fitness goals and the enjoyment of being able to share
the results obtained with their contacts [72], so gamification could have a direct relationship with
their use [73]. Another aspect to take into account for consumers is that if they find the App tedious
and requiring tedious procedures initially, it negatively affects their intention to make use of the App
when considering them complex [74]. On the other hand, Wang Egelandsdal, Amdam, Almli and
Oostindjer [75] express that time and effort may discourage users from using health Apps, thus arguing
why PEOU can explain with more influence the ITU new technologies than PEU. A qualitative study
by Tang, Abraham, Stamp and Greaves [76] revealed that the appearance and structure of a weight
loss app’s interface could significantly influence the decision to use such technology. Sports providers
should conduct better market research to better understand what fans want or expect in order to meet
their expectations [77].
Analyzing the results of the relationships according to the age of the subjects in the sample,
three different groups were established according to the average age of the sample or the age range
with the highest percentage of representativeness. The first group consisted of studies with subjects
under 25 years old [1,51–53,59,61], the second group consisted of participants aged between 25 and
30 years [42,43,56], a third group consisted of people over 30 years old [45,57,60] and one study was
not grouped because the age of the sample ranged from 20 to 29 years [44]. Considering the different
age groups and the relationships between the different factors, the results have shown that the group
under 25 in the PU-ITU and ITU-AU relationships, this is, the studies with the larger young population,
showed higher relationships of influence on the usefulness of the application for its use [1,51–53,59,60].
Young people were more likely to use fitness or sport Apps when they found them more functional,
which meant that this intention had a great influence on the actual use of the app [1,53]. The studies in
the group 25–30 and group over 30 found similar moderate relationships between PU-ITU, except for
two studies in the group 25–30, one study observed a high influence between PU-ITU [59], and the
study did not find PU to significantly influence UTIs [42].
On the other hand, the group 25–30 highlighted among the other two groups the relationships
that have evaluated the PEOU factor, emphasizing the influence of this factor on ITU [42,43], while in
the PEOU-PU relationship, the two studies of the group 25–30 that analyzed this relationship were
the ones that had the greatest and least influence compared to the studies of the other groups [42,43].
The subjects in this intermediate group considered more the ease and intuition of the app to be able
to perform it than the younger or older subjects. The group over 30 also found a moderate to high
influence on the PEOU-ITU relationship [45,57]. However, the older group of studies were the ones
that stood out in the PE influence on UTIs [45,60]; that is, an app that is fun will be more likely to be
used. Finally, PE was shown to have a moderate influence on PEOU in the group under 25 [61] and
group over 30 [45,57] and high influence in the group 25–30 [42].Sustainability 2020, 12, 6641 15 of 24
Limitations and Future Research
Among the limitations of this review study could be started with the reduction of studies that
are based on TAM and not the other existing theories or models. Likewise, a document search in the
grey literature was not performed since the researchers marked a criterion that the studies should be
collected in the different databases analyzed. Another aspect that could have conditioned the study
was the focus only on studies that evaluated only fitness and physical activity Apps, discarding the
studies that could evaluate the use of wearables or sports webs that would allow a broader analysis of
existing studies on the intention to use in the sports context. Similarly, the years of research for the
study could have been limited to the dates since the appearance of the Smartphone and the Apps,
resulting in a large number of initial results that were not limited in time.
In addition, another of the limitations found is the lack of a common questionnaire that has been
replicated in different studies and allows a better comparison of the different populations. This fact may
be due to the fact that this line of research is very recent and very few studies have appeared that could
lead to its replication and comparison of studies. In addition, all the studies choose the sample for
convenience, whether the groups of university students or sports groups are easily accessible. The use
of convenience sampling denotes a lack of application of more appropriate sampling that would allow
the generalization of results to a larger universe. Some studies did refer to this limitation [44,78].
The age of the participants has been a widely reported limitation in the different studies [1,51,52,61,78]
where the sample was mainly composed of young people born into the new digital society and whose
beliefs may be very different from those of middle-aged adults who have not been raised in a digital
society and who tend to have greater difficulties in starting to use the new technologies. Only three
studies looked at a sample over 30 years old [45,57,60], while in the literature there is a study that
evaluated the use of websites by people over 50 [79].
These differences between age groups and therefore with digital gaps must also be approached
from a sociodemographic point of view and with very different contexts. For example, Cho et al. [51]
carried out a comparative study between the Korean and American populations, highlighting the
existence of a limitation in this type of study due to the oversocialization of the individual characteristics
of consumers and their contexts. Thus, some authors indicate that an individual’s socioeconomic status
and educational level affect their use of new technologies and Apps, since individuals with a higher
level of education may have better digital skills [51]. In fact, they may have greater access to a larger
number of technological devices, since not only Smartphones should be considered but also other
devices such as tablets, laptops or even wearables [42]. This factor is important to take into account as
currently, there are other technological devices that could use sports Apps (i.e., tablets, i-watch, etc.).
Similarly, the operating system could have an influence as not all Apps are available on the current
large operating systems (Android and IOS). In addition, there are a multitude of different Apps that
perform the same functions and many studies question the intention to use without determining what
type of Apps the consumer uses. This fact could lead to a self-selection bias when filling out the
questionnaire by the consumer considering the App that people use and not one common to the entire
population [44].
With regard to other methodological aspects of the studies, it should be noted that all the studies
found have had a cross-sectional approach, and no longitudinal study has been found to evaluate the
evolution of the subject and his or her real intention to continue using said App. Chen and Lin [34]
point out that there may be a discrepancy between the ITU of the App on the part of the consumer and
the actual use that they make of this App afterwards. In general, this has been a relationship that some
studies have considered [1,35,43]; however, as these are cross-sectional studies, it has not been possible
to verify the change that they have had with respect to a lesser or greater use of the App. Likewise,
not all studies have included other variables associated with TAM such as PE or PT which allow us to
verify their influence on ITU in different groups and contexts.
Finally, this review has mainly focused on the search for quantitative studies, finding several
qualitative studies but only two studies were found that used mixed methods to evaluate the ITU andSustainability 2020, 12, 6641 16 of 24
to be able to check what the user expresses in the questionnaire with the actual opinion about that
App [75,80].
Future lines of research on the intention to use sports Apps or any other device should consider the
inclusion of more variables of TAM in their model, as well as other variables specific to the Smartphone
(social influence, attachment to the device, etc.), the sports context (motivation, commitment,
participation) or variables traditionally linked to sports marketing such as satisfaction [44]. Therefore,
common measuring instruments should be standardized to allow their application in different contexts.
Similarly, the different age generations should be taken into account when evaluating and sampling in
a population that includes consumers of different age ranges.
It would also be interesting to sample populations that do not refer to a single sport or discipline
but rather have a variety of Apps from different sports or sports teams. Future work should also be
carried out in a longitudinal way, being able to check whether the intention to use predisposed by the
subject ends up being the real use of the application or not. Finally, it is interesting to contemplate
studies that cover different social groups with cultural diversity analyzing not only the intention to use
in the context itself but also in the individual characteristics of the consumer with different status and
educational levels to evaluate the digital gap.
5. Conclusions
This systematic review responded to the need for a critical evaluation of existing research on the
intentions of using sports Apps as this is an emerging field of research. The limited number of academic
studies together with the deficiencies in some methodologies as can be seen in the risk analysis of
research bias and the evidence found, has not allowed a more critical evaluation. These findings
highlight the need for more rigorous and systematic research by researchers in the field, putting factors
in common that allow a better evaluation of the context of the use of new technologies in the sports
environment. At the same time, these findings have allowed the research team to identify a range of
recommendations for sports organizations and researchers, which will help them to address future
studies, and thus allow for a better growth and development of the evaluation of the intention to use
Apps in sport.
Practical Implications
Sports organizations, sports marketing experts and new technology developers should make
use of the considerations made in this study when developing or upgrading a sports App either for
general sports information, a sports brand or exercise or health monitoring. Sports Apps have a great
potential for the promotion and sponsorship of different products due to the potential use they have by
consumers through advertising in these technologies. Suppliers of sports brands (retail, teams, etc.)
should carry out an in-depth analysis of the fans by means of one of the tools evaluated that allow
them to design the Apps according to the user’s expectations and to know what type of information or
applicability they expect from it.
Another practical implication that is obtained is the possibility for sports organizations to develop
Apps that have a gamification part that links the fan to consume the sports brand while he can enjoy
certain benefits for using the organization’s App. They should also look for ways to engage the
consumer with the App during the competition, i.e., generate exclusive content that can only be
enjoyed by fans who have attended the live game, causing greater interest in the use of the App.
Finally, to improve the quality of the Apps on Smartphones or other devices, industry and marketing
professionals should examine all communication channels to ensure convenient access to the different
content and services available.Sustainability 2020, 12, 6641 17 of 24
In addition, the period of confinement caused by the COVID-19 pandemic, which has forced
millions of people to stay at home, highlights the importance of this study to know the current situation
on the topic of the intention to use fitness Apps by the population, especially for sports specialists
and managers to know how to fit into the periods of new normality in which social distancing is
forced. Although they have been in development for a long time, during the period of confinement
there has been an increase in the offer of digital channels that help the guided practice of physical
activity through the use of safe, simple and easy to implement programs and applications that cover
activities related to cross-fit, yoga or dance activities for the general population or for the improvement
of physical and mental well-being in older adults [18,81,82]. For experts in sports management or
trainers, platforms such as Youtube or Zoom allow for individualized methods of physical exercise
and real-time contact with the monitor, which allows for feedback to users regardless of where they are
located [83]. Finally, Ammar et al. [84] suggest that future physical activity intervention to stay active
during times of pandemic may be based on information and communication technologies, such as
fitness Apps. Therefore, it is necessary to focus on a more in-depth study on the intention of the
population to use these types of applications to promote active and healthy lifestyles.
Author Contributions: Conceptualization, S.A., J.G.-F., and M.G.-P.; methodology, S.A. and J.G.-F.; formal analysis,
S.A.; investigation, S.A., J.G.-F. and I.V.; resources, I.V.; data curation, M.G.-P.; writing—original draft preparation,
S.A., J.G.-F. and I.V.; writing—review and editing, S.A. and J.G.-F.; project administration, J.G.-F. and M.G.-P.;
funding acquisition, J.G.-F. All authors have read and agreed to the published version of the manuscript.
Funding: This research was funded by University of Seville grant number 3840/0443/Study and design of
technological consumer behavior in Spanish fitness centers, by Valgo Investment, S.L.U.
Conflicts of Interest: The authors declare no conflict of interest.You can also read