Effect of Oral Ingestion of Low-Molecular Collagen Peptides Derived from Skate (Raja Kenojei) Skin on Body Fat in Overweight Adults: A Randomized ...
←
→
Page content transcription
If your browser does not render page correctly, please read the page content below
marine drugs
Article
Effect of Oral Ingestion of Low-Molecular Collagen
Peptides Derived from Skate (Raja Kenojei) Skin on
Body Fat in Overweight Adults: A Randomized,
Double-Blind, Placebo-Controlled Trial
Young Jin Tak 1,2 , Yun Jin Kim 1,2 , Jeong Gyu Lee 1,2 , Yu-Hyun Yi 1,2 , Young Hye Cho 3 ,
Geun Hee Kang 4 and Sang Yeoup Lee 3,5, *
 1   Department of Family Medicine, Pusan National University School of Medicine, Busandaehak-ro,
     Mulgeum-eup, Yangsan-si 50612, Korea; 03141998@hanmail.net (Y.J.T.); yujkim@pusan.ac.kr (Y.J.K.);
     jeklee@pnu.edu (J.G.L.); eeugus@gmail.com (Y.-H.Y.)
 2   Biomedical Research Institute, Pusan National University Hospital, Busan 602-739, Korea
 3   Family Medicine Clinic and Research Institute of Convergence of Biomedical Science and Technology,
     Pusan National University Yangsan Hospital, Yangsan 50612, Korea; younghye82@naver.com
 4   Yeong San Skate Co., Ltd., Naju 58266, Korea; skate1438@naver.com
 5   Medical Education Unit, Pusan National University School of Medicine, Yangsan 50612, Korea
 *   Correspondence: saylee@pnu.edu; Tel.: +82-10-9134-5959

 Received: 2 February 2019; Accepted: 3 March 2019; Published: 7 March 2019

 Abstract: Recent animal studies found the potential of a collagen peptide derived from skate skin
 to have anti-obesity effects through the suppression of fat accumulation and regulation of lipid
 metabolism. However, no studies have yet been performed in humans. Here, this very first human
 randomized, placebo-controlled, and double-blinded study was designed to investigate the efficacy
 and tolerability of skate skin collagen peptides (SCP) for the reduction of body fat in overweight
 adults. Ninety healthy volunteers (17 men) aged 41.2 ± 10.4 years with a mean body mass index of
 25.6 ± 1.9 kg/m2 were assigned to the intervention group (IG), which received 2000 mg of SCP per
 day or to the control group (CG) given the placebo for 12 weeks and 81 (90%) participants completed
 the study. Changes in body fat were evaluated using dual energy X-ray absorptiometry as a primary
 efficacy endpoint. After 12 weeks of the trial, the percentage of body fat and body fat mass (kg) in
 IG were found to be significantly better than those of subjects in CG (−1.2% vs. 2.7%, p = 0.024 and
 −1.2 kg vs. 0.3 kg, p = 0.025). Application of SCP was well tolerated and no notable adverse effect
 was reported from both groups. These results suggest the beneficial potential of SCP in the reduction
 of body fat in overweight adults.

 Keywords: Skate skin; Raja kenojei; collagen; body fat; obesity

1. Introduction
     The global burden of cardiovascular diseases (CVD), which is the most common cause of
death is increasing rapidly despite tremendous treatment options for diabetes, hypertension and
dyslipidemia [1]. It is believed to be mainly attributed to failing to control the growing number
of populations who are obese as a sedentary lifestyle and westernized eating habits have become
prevalent worldwide [2]. Obesity is the root cause of chronic diseases that have been afflicting about
one-third of the total population globally and the crucial factor to solve for prevention of fatal health
issues [3]. Although medical experts have been struggling to find out effective treatment options for
obese people, there have been only a few medications used to suppress appetite by working on the

Mar. Drugs 2019, 17, 157; doi:10.3390/md17030157                          www.mdpi.com/journal/marinedrugs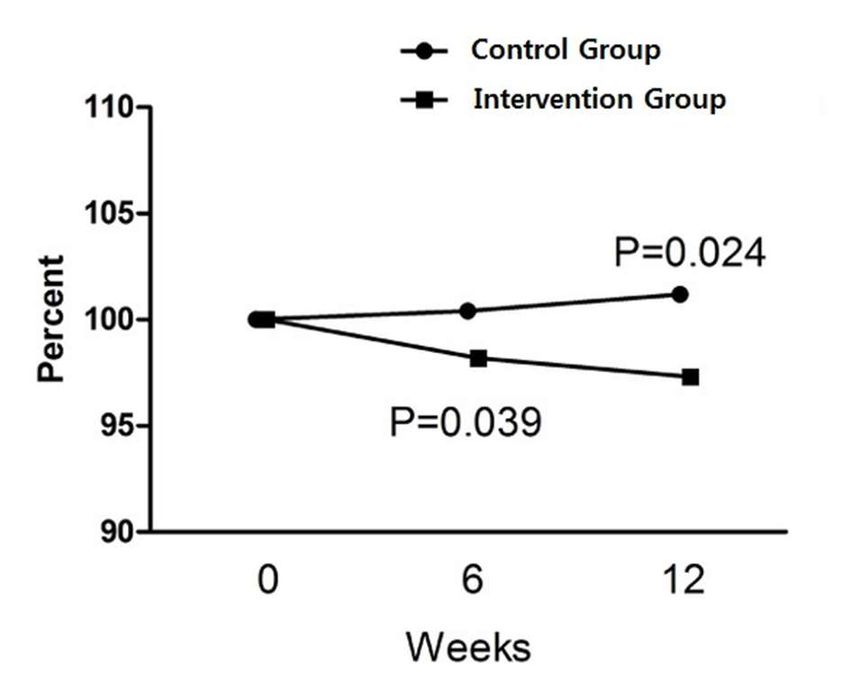
Mar. Drugs 2019, 17, 157                                                                             2 of 12

central neurologic system, which often brings about unexpected side effects such as the urge of suicide,
aggravation of depression or other psychological issues [4]. Therefore, it is necessary to discover a
material with an anti-adipogenic effect to help lose weight that comes from naturally available sources
without any concerns of side effects.
      In an attempt to make these possible, numerous products are now being developed and
commercialized. Among them is collagen that has been widely used as a material in food, cosmetic, and
pharmaceutical industries due to its biological and functional properties [5]. In a recent randomized
controlled trial, post-exercise supplementation of a collagen peptide in combination with resistance
training was seen to improve body composition and increase muscle strength in 148 elderly sarcopenic
men [6]. Especially, collagen peptides derived from sea fish have been recognized as a dietary
supplement which is beneficial to blood pressure [7] and glucose control [8], skin moisturizing [9] and
improved lipids [10].
      Skate is quite a popular food consumed widely in Korea in both a raw and fermented form. From
a nutritional perspective, skate is known to contain taurine, which plays a role in the growth and
development of cells and is an energy booster, anserine that acts as a buffer for muscles [11]. In addition,
it is high in essential fatty acids such as linoleic and linolenic acid, which are beneficial to enhance
cognitive functions by reducing a high lipid level [12]. As many healthy nutrients that skate contains
are discovered [13,14], its demand has been on the rise in recent years. Accordingly, a great number of
by-products such as skin and cartilage remain and go waste in the process of the meat part of the skate.
However, the nutritional values of by-products from skate are also reported to be fairly high [15],
so these can be a useful resource in the fish-supplements industry [16,17]. Previous information
suggests that skate can serve as a good nutrition source for the development of highly functional
collagen peptide materials [11].
      In very recent study, Woo et al. found the anti-obesity effects of collage peptide derived from skate
skin by suppressing fat accumulation and regulation of lipid metabolism in genetic and high-fat diet
(HFD)-induced obese animal model [18], presenting that using skate skin might be an effective and
safe approach for humans to resolve obesity-related health problems. Although an HFD-induced obese
animal is considered to have similar pathophysiology to that of an obese person [19], a well-designed
clinical trial is necessary to confirm the effect and safety of skate skin collagen peptide (SCP) in humans.
However, the effects of collagen from skate skin on changes in body weight have never been explored
in humans. Thus, our study aimed to assess the efficacy and tolerability of SCP for the reduction of
excess body fat in overweight adults. We hypothesized that SCP is an effective, safe agent for the
treatment of obese people.

2. Results

2.1. General Characteristics of the Study Subjects
     Five participants in IG and four in CG withdrew consent for personal reasons that were not
considered associated with the trial. The characteristics of these nine participants were similar to ones
of the others who completed the study. Compliance was satisfactory with participants taking more
than 90% of the supplements given in both IG and CG. Randomization was successful, as the two
groups generated were comparable for most variables and no significant differences were observed
in the baseline demographic and anthropometric characteristics between the two groups (Table 1).
The majority of the participants were women (81.1%) and the mean age of total participants was
41.2 ± 10.4 years. The average BMI of both IG and CG was over 25.6 ± 1.9 kg/m2 , which is more
than the cutoff for defining obesity in Korea [20]. Furthermore, no statistically significant intergroup
differences were observed for alcohol drinking, smoking, calorie intake and physical activities at
baseline. During the whole study period, the double-blind requirement was well maintained.
Mar. Drugs 2019, 17, 157 3 of 12
Table 1. Baseline characteristics of the study subjects.
Intention to Treat Analysis Per Protocol Analysis
Variable
CG (n = 45) IG (n = 45) p* CG (n = 41) IG (n = 40) p*
Male (%) 8 (17.8) 9 (20.0) 0.788 8 (19.5) 8 (20.0) 0.956
Age (years) 40.8 ± 11.1 41.7 ± 9.7 0.750 41.1 ± 11.2 41.8 ± 9.9 0.817
BMI (kg/m2 ) 25.8 ± 1.9 25.5 ± 2.0 0.467 25.8 ± 1.9 25.4 ± 2.0 0.404
Alcohol user (%) 23 (51.1) 18 (40.0) 0.290 20 (48.8) 17 (42.5) 0.570
Smoker (%) 2 (4.4) 1 (2.2) 0.559 2 (4.9) 1 (2.5) 0.573
Calorie intake (kcal/day) 1660 ± 495 1594 ± 357 0.410 1667 ± 515 1601 ± 360 0.427
IPAQ (METs) 1151 (363–1726) 740 (33–2170) 0.813 1158 (396–1658) 903 (33–2655) 0.502
BMI, body mass index; IPAQ, international physical activity questionnaires; SAD, sagittal abdomen distance.
Data was presented as mean ± standard deviation or number (%) except for IPAQ with median (interquartile).
* By Chi-square test or two sample t-test except for IPAQ using Mann-Whitney’s U test.
2.2. Changes inBody Composition
Mar. Drugswere
There 2019, 17,
nox significant
FOR PEER REVIEW
changes in calorie intake (∆ IG: 133.1 kcal/day, p = 0.715 vs.4 of∆ 12 CG:
−51.7 kcal/day, p = 0.436) and physical activities (∆ IG: −205.6 METs, p = 0.166 vs. ∆ CG: 129.4 METs,
HDL-Cholesterol (mg/dL)
p = 0.551) checked at55.0baseline
Baseline ± 10.5 and
57.7 the
± 13.712th week0.2902 of the trial among the participants, reflecting
At 12 weeks effect54.6
no additional that± 11.2
might 55.6have± 12.8
influenced 0.4901 body−0.4 ± 8.9
composition 0.1414aside −2.1 ± 5.9 the0.020
from 3 0.6651
intervention.
LDL-Cholesterol (mg/dL)
After 12 weeks of the trial, CG subjects showed a slight rise in BW by 0.7 kg (p = 0.018), and accordingly
Baseline 2 (p 118.8 ± 28.1 120.9 ± 26.9 0.7112
BMI by 0.3 kg/m
At 12 weeks = 0.015),
119.1 ± 26.8 while IG participants
122.8 ± 27.5 had
0.5292 no0.4significant
± 23.8 increase
0.739 3 in± BW
1.8 17.1 and0.474
BMI 3 (Table
0.35512).
However, BF body
BMI, in IGmass
afterindex;
12 weeksHDL,washighfound decline (−LDL,
densitytolipoprotein; 0.6%,low p =density
0.017) lipoprotein;
from the baseline with a little
SAD, sagittal
decreaseabdomen distance. Shapiro-Wilk’s test was employed for test of normality assumption * p values
of lean body mass. In contrast, there was no change in body composition among CG subjects.
In termswere compared within
of comparison between each the
group from baseline.
groups ** p values
after 12 weeks, IG were compared
subjects turned between
out to groups.
have more 1 p body
values
fat loss than were
the CGderived
ones (− from
1.2 Mann-Whitney's
kg vs. 0.3 kg, pU=test. 2 p values
0.025). were deriveddifference
This intergroup from independent t test. 3
in the percentage of
BW change p values
waswere derivedfrom
observed fromthe
paired
sixtht test.
week4 p values were derived from Wilcoxon’s signed rank test.
of the trial and lasted until the 12th week (Figure 1).
Figure 1. The percentage of changes in body fat during the 12 weeks of the study. P-values were
Figure
derived 1. The
from percentage of U
Mann-Whitney’s changes in body
test with fat during
the intention to the
treat12analysis
weeks of(n the study. P-values were
= 90).
derived from Mann-Whitney's U test with the intention to treat analysis (n = 90).
2.3. Changes in Laboratory Measurements
2.3. Changes in Laboratory Measurements
In both groups, adiponectin levels rose a bit with a larger increase found in IG although it was
In both groups,
not a significant adiponectin
difference betweenlevels rose a bit
the groups with
after 12 aweeks.
larger When
increase
it found
comesintoIG
thealthough it wasno
lipid profile,
not a were
changes significant difference
observed exceptbetween the groups
for n aHDL-C after 12inweeks.
decrease IG. When it comes to the lipid profile, no
changes were observed except for n aHDL-C decrease in IG.
2.4. Safety
2.4. Safety
Most of the subjects completed the protocol without adverse symptoms. One subject in IG
Most of the subjects completed the protocol without adverse symptoms. One subject in IG
complained of dyspepsia and decided to withdraw consent for that reason. However, this symptom
complained of dyspepsia and decided to withdraw consent for that reason. However, this symptom
was not determined to have anything to do with taking SCP. No clinical changes in the levels of liver
was not determined to have anything to do with taking SCP. No clinical changes in the levels of liver
enzyme, creatinine and glucose were observed in each group. No intergroup differences in these
figures were found during the study period (Table 3).
Table 3. Changes in laboratory results related to safety in the ITT population.
Control (n = 45) Collagen (n = 45)
Variable
Week 0 Week 12 p Week 0 Week 12 pMar. Drugs 2019, 17, 157 4 of 12
enzyme, creatinine and glucose were observed in each group. No intergroup differences in these
figures were found during the study period (Table 3).
Table 2. Comparison of changes in measurements in the intention to treat (ITT) population.
Observed Values Changes from Baseline
Variable
CG (n = 45) IG (n = 45) p* CG (n = 45) p ** IG (n = 45) p ** p*
Weight (kg)
Baseline 68.0 ± 8.5 66.6 ± 8.5 0.364 1
At 12 weeks 68.7 ± 8.8 66.8 ± 8.8 0.228 1 0.7 ± 1.9 0.018 4 0.2 ± 1.3 0.183 4 0.155 2
SAD (cm)
Baseline 19.6 ± 2.0 19.3 ± 1.6 0.226 1
At 12 weeks 19.5 ± 2.2 19.2 ± 1.8 0.433 2 −0.1 ± 1.1 0.489 3 −0.1 ± 1.0 0.701 4 0.840 4
BMI (kg/m2 )
Baseline 25.8 ± 1.9 25.5 ± 2.0 0.467 2
At 12 weeks 26.1 ± 2.2 25.6 ± 2.0 0.274 2 0.3 ± 0.7 0.015 3 0.1 ± 0.5 0.265 3 0.153 1
Body fat (%)
Baseline 40.5 ± 4.7 41.2 ± 5.5 0.255 1
At 12 weeks 40.3 ± 4.4 40.6 ± 5.3 0.455 1 −0.2 ± 1.4 0.364 3 −0.6 ± 1.5 0.017 4 0.226 1
Fat mass (kg)
Baseline 27.4 ± 4.0 28.2 ± 7.0 0.744 1
At 12 weeks 27.7 ± 4.0 27.0 ± 4.3 0.458 2 0.3 ±1.4 0.154 3 −1.2 ± 4.8 0.072 4 0.025 1
Lean mass (kg)
Baseline 40.5 ± 7.0 39.8 ± 8.2 0.260 1
At 12 weeks 41.1 ± 7.0 39.8 ± 7.5 0.139 1 0.6 ± 1.4 0.154 3 −0.1 ± 4.0 0.011 4 0.762 1
Adiponectin (ug/mL)
Baseline 3.95 ± 2.0 4.36 ± 2.1 0.314 1
At 12 weeks 4.23 ± 1.8 4.79 ± 2.3 0.456 1 0.28 ± 0.7 0.003 4 0.43 ± 1.48 0.007 4 0.762 1
Total Cholesterol (mg/dL)
Baseline 199.4 ± 28.9 203.0 ± 33.6 0.592 2
At 12 weeks 200.6 ± 32.7 205.8 ± 32.6 0.448 2 1.2 ± 24.5 0.753 3 2.8 ± 17.9 0.292 3 0.288 1
Triglyceride (mg/dL)
Baseline 128.3 ± 114.3 124.2 ± 88.4 0.741 1
At 12 weeks 138.0 ± 85.9 136.8 ± 102.1 0.710 1 9.7 ± 95.0 0.009 4 12.6 ± 51.2 0.095 4 0.301 1
HDL-Cholesterol (mg/dL)
Baseline 55.0 ± 10.5 57.7 ± 13.7 0.290 2
At 12 weeks 54.6 ± 11.2 55.6 ± 12.8 0.490 1 −0.4 ± 8.9 0.141 4 −2.1 ± 5.9 0.020 3 0.665 1
LDL-Cholesterol (mg/dL)
Baseline 118.8 ± 28.1 120.9 ± 26.9 0.711 2
At 12 weeks 119.1 ± 26.8 122.8 ± 27.5 0.529 2 0.4 ± 23.8 0.739 3 1.8 ± 17.1 0.474 3 0.355 1
BMI, body mass index; HDL, high density lipoprotein; LDL, low density lipoprotein; SAD, sagittal abdomen
distance. Shapiro-Wilk’s test was employed for test of normality assumption * p values were compared within each
group from baseline. ** p values were compared between groups. 1 p values were derived from Mann-Whitney’s U
test. 2 p values were derived from independent t test. 3 p values were derived from paired t test. 4 p values were
derived from Wilcoxon’s signed rank test.
Table 3. Changes in laboratory results related to safety in the ITT population.
Control (n = 45) Collagen (n = 45)
Variable
Week 0 Week 12 p Week 0 Week 12 p
AST (IU/L) 24.51 ± 7.9 20.93 ± 5.8 0.003 23.84 ± 10.0 24.87 ± 11.8 0.066
ALT (IU/L) 22.31 ± 13.3 20.76 ± 9.5 0.876 24.02 ± 19.7 25.44 ± 20.1 0.932
Cr (mg/dL) 0.69 ± 0.14 0.66 ± 0.1 0.016 0.71 ± 0.1 0.69 ± 0.1 0.812
Glucose (mg/dL) 91.67 ± 11.8 88.6 ± 9.7 0.033 90.07 ± 10.5 89.58 ± 12.6 0.244
AST, aspartate aminotransferase; ALT, alanine aminotransferase; Cr, creatinine. p values were compared within
each group from baseline.
3. Discussion
To our best knowledge, this study is the first randomized, double-blind, placebo-controlled
trial to identify the efficacy, safety, and tolerability of SCP in overweight people. Although the
molecular mechanism underlying the anti-obesity effect of fish collagen peptides has now been
discovered, the influence of them on body fat in humans had yet to been addressed before our study.Mar. Drugs 2019, 17, 157 5 of 12
Thus, we aimed to see whether SCP could reduce human body fat as well. Our results showed that
oral SCP of 2000 mg daily for 12 weeks decreased a small amount of body fat and was tolerated
without reducing calorie intake and increasing physical activities.
The biological underlying mechanism of this current outcome can be found in previous animal
studies conducted recently [21,22]. Lee et al. observed in obese mice that the oral administration
of fish collagen peptide (FCP) significantly reduced body weight gain induced by HFD without a
significant difference in food intake, confirming that FCP has an anti-adipogenic effect in in vitro
and in vivo models [21]. Their findings demonstrate that subcritical water-hydrolyzed FCP inhibits
lipid accumulation during the differentiation of 3T3-L1 preadipocytes into adipocytes by suppressing
the expression of adipogenic master transcription factors such as peroxisome proliferator-activated
receptor-γ (PPAR-γ), CCAAT/enhancer binding protein-alpha (C/EBP-α) and adipocyte protein 2
(aP2) genes, which mainly regulate the differentiation and maintenance of adipocytes, leading to a
significant decrease in adipocyte size. Moreover, FCP improved the lipid profile showing reduced
serum levels of TC, TG, and LDL-C while increased HDL-C. Another study conducted by Astre G et al.
confirmed the previous results showing HFD-fed mice supplemented by FCP exhibited a significantly
lower weight gain as soon as the 12th week of treatment, whereas no effect was observed in control
group mice [22]. Additionally, lower glucose and a decrease of inflammatory cytokines were seen
among mice treated with FCD, presenting a potential effect of FCP on insulin sensitivity.
Although Lee et al. [21] and Astre G et al. [22] did not use skate as a source of collagen peptides
in their studies, skate skin is also reported as a good source of collagen, consisting of properties of
amino acid-rich collagen. The major amino acids of skate skin are arginine, proline, and glutamic acid.
Of the total amino acids, approximately 19.8% of arginine and 12% of proline are presented in the skin
part [12]. The stability of collagen is proportional to the total amount of collagen and associated with
the pyrolidine (proline + hydroxyproline) content [23], thus it can be enhanced by using skate skin.
A large amount of skate skin is being disposed of as skate is becoming popular in both the fresh and
fermented form owing to the recognition of its high quantity of nutrients and unique flavor in Korea.
From an environmental perspective, therefore, it would be a good solution to prevent by-products
from being excessively generated.
More recent findings of Woo et al. [18] specifically using collagen peptide derived from skate skin
were consistent with the previous research. In this study, a reduced increase in body weight and visceral
adipose tissue was observed in the SCD-fed groups compared to the control group. The anti-obesity
effects of SCP were attributed to being mediated by regulating transcription factors and enzymes which
regulate hepatic lipid metabolism. Histological analysis of the liver revealed that SCP suppressed
hepatic lipid accumulation and reduced the lipid droplet size in the adipose tissue. TG-lowering effect
of SCP significantly suppressed adipose tissue differentiation in a dose-dependent manner, which was
also demonstrated by the histologic results in adipose tissue. Additionally, the researchers observed
that the intake of SCP increased the hepatic protein expression of phosphorylated 5’ adenosine
monophosphate-activated protein kinase (p-AMPK) with elevated adiponectin and reduced leptin
levels. As a regulator of energy balance by affecting whole body fuel utilization, AMPK induces
fatty acid oxidation and inhibits adipocyte differentiation and the synthesis of hepatic fatty acid,
cholesterol [24] emerging as a key target for obesity resolution. It is also involved in the regulation of
adiponectin, which can activate p-AMPK [25]. In line with this result, our study showed a slightly
larger increase in the adiponectin level in IG than that in CG; although this difference between the
groups was not statistically significant. For now, we cannot determine whether this increase in
adiponectin shown in the human study is mediated by the same way that SCP works on p-AMPK in
an animal model. However, our finding can be clinical evidence that p-AMPK may be a good target
with respect to SCP related human experimental study in the future.
In our study, IG saw no statistically significant difference in fat mass (kg). However, there was a
significant change in the body fat percentage (%). Methodologically, body fat (%) by DXA indicates
the body fat (kg) normalized by total body weight (body fat (%) = body fat (kg)/total body weightMar. Drugs 2019, 17, 157 6 of 12
(kg)) [26]. Thus, an increase in total body weight causes underestimated body fat (%) and a decrease in
body weight comes with overestimated body fat (%) even though actual body fat is the same. Our data
shows that the total body weight of CG after 12 weeks was slightly higher than that of IG in which the
difference was not statistically significant. This point may be attributable to the non-significance in fat
mass (kg) change.
In contrast to those animal studies, the present study failed to find improvements in lipid profile
with a slight HDL-C decrease found in IG. The authors cannot infer a convincing explanation for that
from the current findings. Presumably, it was probably because HDL-C is known to mainly increase
by boosting physical activity [27], which was not conducted in our study. From a clinical point of
view, although there was a statistically significant HDL-C reduction in IG, the absolute amount seems
not clinically important since both levels of HLD–C before and after SCD administration were still at
a desirable level from a CVD prevention perspective. Additionally, lipid metabolism is much more
complicated in humans than in animal models and many other factors may have been involved in the
process that our study missed including covariates. Furthermore, our primary outcome was a change
in body fat. Therefore, the size of the study might not be large enough to identify the effect of SCD on
lipids with a study period of 12 weeks. Most importantly, previous animal studies induced weight
gain by feeding a high-fat diet in order for mice to reach a hyperlipidemic state before administration
of SCD while the majority of our study subjects had normal lipid levels at the baseline and this study
did not apply the intervention to the subjects for an improvement in lipid levels.
To fight against obesity and related metabolic disorders, several anti-obesity drugs have been
approved by the FDA for the treatment of obesity. However, it is unclear whether these medications
actually bring about improved health outcomes including the prevention of CVD and improve the
quality of life given that trials of medication-based weight loss interventions showed high study
drop-out rates (≥35% in half the included trials) and the differences in these outcomes were small
among those on medication compared with placebo [28]. Known adverse effects, financial burden by
hefty prices of medications, and failure of the significant outcome of losing weight seem to force obese
people to seek alternative treatments with fewer side effects. In this context, many natural products
have been tested as potential alternative therapies for obesity and our study was one of them.
Consequently, although the absolute amount was small, body fat loss found in our IG was quite
impressive, when considering the fact that the duration of the intervention was relatively short and
that the study did not require the participant to engage in any program in order to increase physical
activity and cut down on calorie intake so that they could keep their daily routine as they usually
had done. Most of the time, subjects who are involved in studies which are designed to demonstrate
the efficacy of anti-obesity drugs are provided with dietary advice to decrease calorie intake and are
encouraged to participate in moderate physical activity programs at least three times a week, which
can be difficult for the subjects to adhere to the trial to the end showing a high drop-out rate and leads
to a lower weight loss outcome than expected [29,30]. Additionally, in our study, the reduction in body
fat occurred as soon as 6 weeks after taking SCD, showing a significant difference from CG and this
gap was sustained until the study ended. On the other hand, recent research has focused on the roles
of gastrointestinal peptides in obesity control [31,32]. They are known to be potential regulators of
satiety such as cholecystokinin (CCK) and to influence food intake, which is critical when it comes to
losing weight [33]. With regards to this point, further study is needed to see if SCD has an impact on
gastrointestinal peptides.
The present study has some limitations. We included woman-dominant participants (81%) who
are considered relatively better at complying with a study protocol and more conscious about their
weight and appearance than men, which may result in a more favorable outcome in weight control
intervention. Moreover, since a 24-h dietary recall is affected by day-to-day variation, the one-day
investigation may not represent the usual intake of the subjects [34]. The IPAQ also has a substantial
measurement error with the tendency to overestimate, although it consists of 27 questions which
reflect on the previous seven days’ physical activities [35]. These weaknesses of self-report surveysMar. Drugs 2019, 17, 157 7 of 12
led to the result of a negative caloric balance shown in our subjects. However, the researchers asked
the participants not to try to change their eating and physical patterns throughout the trial except for
taking SCD so that we could assess the effect of SCD possibly only. In this context, the main purpose of
the 24-h dietary recall and IPAQ in our study was to see if there were significant differences of before
and after SCD administration in the overall calorie intake or expenditure in the daily routine of the
subjects. Consequently, our data showed no changes between the two cited time points as planned.
If there were any changes in them, we would have analyzed data adjusting for the amount of calories
that the participants consumed and spent. Lastly, the current study was conducted by a single center,
which can be limited to generalize the results.
Despite these limitations, our study is considerably valuable owing to several strengths. Firstly,
to the best of the authors’ knowledge, it is the first clinical study to examine the efficacy and tolerability
of SCP on obesity. Moreover, the measurements of body composition were checked by DXA that is
more accurate [36] than bioelectrical impedance analysis, which is most commonly used in the clinical
study and private clinics due to its lower cost and simplicity to apply [37]. Furthermore, many trials
of weight loss interventions have focused on body weight as their primary efficacy endpoint [28].
However, when it comes to resolution of obesity, what is fundamentally important is whether the
intervention can effectively reduce body fat, not just body weight. The current study measured the
change in body fat by using a reliable quantitative method through DXA.
We confirmed that there was no toxicity or severe adverse effect when SCP was applied to
humans. More importantly, only SCD supplement for three months without having to change dietary
habits and physical performance decreased more body fat than the placebo significantly (−1.2 kg vs.
+0.3 kg, p = 0.025) and its effect came out as soon as six weeks after it was taken whereas no effect was
observed in CG. The study suggests that SCD can help reduce excess body fat and it can be considered
a potential alternative treatment for obesity itself and associated disorders. If it is combined with
exercise and dietary intervention, the effect of SCD can be greater. However, a replicated study with a
larger population is needed so as to reconfirm this favorable effect of SCP on body composition and to
elucidate the mechanism responsible for the action of SCP in humans.
4. Materials and Methods
4.1. Study Design and Study Subjects
The present study was designed as a randomized, placebo-controlled, double-blind controlled
clinical trial and approved by the Institutional Review Board at Pusan National University Yangsan
Hospital (IRB No. 02-2017-012). We carried out the study in accordance with the principles of the
Declaration of Helsinki from 26 June 2017 through 5 June 2018. Written informed consents following a
fully detailed description of the study protocol were obtained from all participants before enrollment.
This trial is registered with ClinicalTrials.gov Identifier: NCT03409705.
Eligible subjects were overweight, or obese, defined according to the guidelines of the Korean
Society for the Study of Obesity [20]. One hundred adults aged between 20 and 60 years with any
value from 23 to 30 kg/m2 of body mass index (BMI) were enrolled through recruitment posting at a
tertiary hospital in Yangsan. The individuals were excluded if they had any conditions as following;
(1) previously taken any medication or supplements that can cause a change in body weight within
the past one month including anti-depressants, anti-absorptive agents, appetite suppressors and any
other hormonal products, (2) history of engagement in commercial anti-obesity programs within
the past three months, (3) being treated for hyperthyroidism or hypothyroidism, (4) alcohol abuser,
(5) quit smoking within three months of enrollment, (6) uncontrolled blood pressure, blood glucose,
or gastrointestinal symptoms, (7) an aspartate aminotransferase (AST) or alanine aminotransferase
(ALT) serum level greater than 80 mg/dL or a creatinine (Cr) level greater than 1.5 mg/dL, (8) pregnant
or lactating women or (9) allergic to the ingredient involved. In addition, for safety reasons,
candidates diagnosed with cardiovascular diseases or any cancer during the six months prior to studyMar. Drugs 2019, 17, 157 8 of 12
Mar. Drugs 2019, 17, x FOR PEER REVIEW 8 of 12
commencement
diagnosed withwere also excluded.
cardiovascular Four participants
diseases met during
or any cancer the exclusion
the sixcriteria
months and ten participants
prior to study
declined to participate.
commencement were also excluded. Four participants met the exclusion criteria and ten participants
declined to participate.
4.2. Randomization
4.2.
OneRandomization
hundred adults were recruited for screening and 90 (90%) participants were finally enrolled.
One hundred
After undergoing adultsmeasurements,
baseline were recruited for screening
they and 90 (90%)
were randomly participants
assigned to eitherwere
onefinally
of the enrolled.
two groups
After block
through undergoing baseline measurements,
randomization methods usingthey were randomly
randomized numbers assigned to either
and given one of the
identification two
numbers
on groups through
recruitment: theblock randomization
intervention groupmethods
(IG) (n =using
45), randomized
which received numbers
2000 andmg ofgiven
SCPidentification
per day in the
formnumbers on recruitment:
of capsules, the intervention
or the control group (n =group (IG) (n
45) which was= 45), which
given received(Figure
a placebo 2000 mg 2).ofRandomization
SCP per day
in the
codes wereform of capsules,
created or the
by an expert control group
in statistics using(n = 45) which
nQuery Advisor was
7.0.given
Thosea whoplacebo
were(Figure 2).
responsible
for Randomization
deciding on study codes were created
eligibility by an expert
and conducting theinmeasurements
statistics usingwere
nQuerykeptAdvisor
unaware 7.0.ofThose who of
the results
thewere responsiblethroughout
randomization for deciding theon studystudy
whole eligibility
process.andAllconducting the measurements
of the participants were asked were keptthe
to visit
unaware of the results of the randomization throughout the whole study process.
center four times in total (visit 1; for screening, visit 2; randomization and start taking supplements, All of the
participants were asked to visit the center four
visit 3; 6 weeks after intervention, visit 4; 12 weeks later). times in total (visit 1; for screening, visit 2;
randomization and start taking supplements, visit 3; 6 weeks after intervention, visit 4; 12 weeks later).
Figure 2. Flow diagram of the study subjects.
Figure 2. Flow diagram of the study subjects.
4.3. Intervention
4.3. Intervention
The dosage of SCP applied to the subjects had been determined based on the results from previous
The dosage of SCP applied to the subjects had been determined based on the results from
animal studies where mice fed 300 mg of SCP daily had shown a significant reduction in body fat
previous animal studies where mice fed 300 mg of SCP daily had shown a significant reduction in
without any adverse events. Given the dosage of 300 mg applied to mice of which an average body
body fat without any adverse events. Given the dosage of 300 mg applied to mice of which an average
weight
bodywas in these
weight studies
was in these [18,19], 2000 mg2,000
studies [18,19], of SCP
mg was considered
of SCP appropriate
was considered to be given
appropriate to humans
to be given to
withhumans with an average body weight of 60 kg according to the guidance for estimating the maximumsafe
an average body weight of 60 kg according to the guidance for estimating the maximum
safe starting
starting dose in dose
initialinclinical
initial clinical trials
trials for for therapeutics
therapeutics in adultinhealthy
adult healthy volunteers
volunteers [38]. Two[38].capsules
Two
(500capsules
mg per(500 mg per capsule) of SCP were taken twice a day in the morning and evening by the
capsule) of SCP were taken twice a day in the morning and evening by the subjects
subjects
in IG (totalinfour
IG (total
capsulesfour each
capsules
day)each
forday) for 12 weeks.
12 weeks. Subjects
Subjects in CGinwere
CG weregivengiven
the the placebos
placebos with
thewith
samethe same protocol
protocol and duration.
and duration. Capsules
Capsules werewere visually
visually identical
identical andand supplied
supplied byby SeromCo.,
Serom Co.,Ltd.
Ltd. (Jeonnam,
(Jeonnam, South Korea).
South Korea). Compliance
Compliance was assessed
was assessed by counting
by counting the remaining
the remaining capsules
capsules at at every
every visit
visit and less than 80% of the taken number of capsules was considered to have
and less than 80% of the taken number of capsules was considered to have dropped out from the study. dropped out from
the study.
Reports of anyReports
adverseof any
eventadverse event or unpredicted
or unpredicted drug reaction drug reaction
were werethroughout
reported reported throughout
the study.the
study.Mar. Drugs 2019, 17, 157 9 of 12
4.4. Evaluation of Dietary Intake and Physical Activities
At baseline and the 12th week of the trial, the study subjects were asked to answer the
questionnaire on dietary intake and physical activities that mainly determine the change in body
weight so as to check if there was a significant alteration in their daily routine and to take into account
the extra possible effect on their body composition. Dietary intake was investigated by the 24-h recall,
which is an open-label nutritional survey method for estimating all food products ingested by the study
subjects during the previous 24 h, together with dietary information (time, location, types of food,
amount, and cooking method) and hereby reflecting the recent calorie intake of individuals [39,40].
Alcohol drinking was defined as consumption of alcohol with an average of seven cups for men
and five or more for women, more than two times a week [41] Frequency, intensity and type of
physical activities that the participants had done during the previous weeks were reported using the
international physical activity questionnaires (IPAQ) [35] and the number of physical activities were
represented as the metabolic equivalent of task (METs).
4.5. Measurements
As the primary outcome was changed into body fat mass (kg) and body fat percent of each
subject, dual-energy X-ray absorptiometry (DXA) (Lunar Prodigy 8.50, Lunar Radiation Corp.,
Madison, WI, USA) was implemented twice at baseline and 12th week of the study. The fat mass
percentage was calculated as fat mass/(fat mass + lean mass + bone mineral content). Secondary
outcome variables were changes in BMI, sagittal abdomen distance (SAD), fat mass (kg) and lean
mass (kg) checked by DXA, lipid profile (triglyceride (TG), total cholesterol (TC), high density
lipoprotein cholesterol (HDL-C), low density lipoprotein cholesterol (LDL-C)), free fatty acid (FFA),
and adiponectin. The participants were asked to maintain a fasting state for at least 4 h before the test.
SAD was measured while the participants were lying supine on their back. A caliper with two sliding
arms attached parallel to a vertical scale (Holtain-Kahn Abdominal Caliper 50 cm (98.609XL), U.K.)
(Holtain-Kahn Abdominal Caliper Extra Long 50 cm (Holtain Model 609 XL), Seritex Inc, 1 Madison
St. East Rutherford, NJ, USA) according to the standard method for the use of the caliper [42]. The upper
arm of the caliper was lowered without compressing the abdomen and the arm of the caliper was
placed at the level of L4–L5 under the participant. The reading on the vertical scale with a normal
exhalation was noted in cm. BMI was calculated by dividing weight (kg) by height squared (m2 ).
To measure blood pressure (BP), a mercury sphygmomanometer was used in the sitting position after
a 10-min rest period. Two readings of systolic and diastolic BP were checked at 3-min intervals, and
averages were recorded in the analysis. Blood samples were collected at baseline and after 12 weeks
of study after a 12-h fast. Fasting blood glucose was reported using a glucose oxidase test method
(LX-20, Beckman Coulter, Fullerton, CA, USA). Serum AST, ALT, and Cr were measured using a
Toshiba TBA200FR biochemical analyzer (Toshiba Co. Ltd., Tokyo, Japan).
4.6. Statistical Methods
The sample size of the study was calculated based on the research by Min et al. [43]. The estimated
sample size was 45 patients per group for an 80% power to detect a difference in the mean investigator
assessment score of 0.8, assuming a standard deviation of 1.2472 in the primary outcome variables
and an alpha error of 5% with a 10% of drop-off rate. When a result of a test was unavailable, the
last recorded data entry was included in the analysis (the last observation carried forward method).
Efficacy analysis was conducted on both an intention to treat (ITT) basis on subjects that received
at least one dose of SCP or placebo and that underwent at least one assessment post-baseline and
per protocol (PP) only including data from subjects that completed the study protocol as planned.
The Shapiro-Wilk’s test was employed to test the normality assumption. Intergroup comparisons of
baseline characteristics and their changes at the 12th week of the trial were done using the two-sample
t-test for continuous variables (or Mann-Whitney’s U test in case of valuables showing non-normalMar. Drugs 2019, 17, 157 10 of 12
distributions) or the chi-square test for categorical variables (or Fisher’s exact test in case of valuables
showing non-normal distributions). Intragroup comparisons were conducted using the paired t-test for
continuous variables (or Mann-Whitney’s U test in case of valuables showing non-normal distributions).
An analysis of covariance (ANCOVA) was performed to compare intergroup differences in outcomes
after adjustment for physical activities and covariates that had shown a statistical significance between
the groups at baseline. A p-value of less than 0.05 was considered statistically significant. SPSS version
22.0 (SPSS Statistics for Windows Version 22.0, Armonk, NY, IBM Corp) was employed for the analysis.
Author Contributions: Conceptualization, S.Y.L.; Formal analysis, Y.-H.Y.; Investigation, J.G.L.; Methodology,
Y.H.C.; Project administration, G.H.K.; Supervision, Y.J.K.; Writing—original draft, Y.J.T.
Funding: This research received no external funding.
Acknowledgments: The authors would like to acknowledge the excellent technical assistance provided by
Ye Li Lee, a senior researcher from Integrated Research Institute for Natural Ingredients and Functional Foods at
Pusan National University Hospital.
Conflicts of Interest: The authors declare no conflict of interest.
References
1. Aminde, L.N.; Veerman, L. Interventions for the prevention of cardiovascular diseases: A protocol for a
systematic review of economic evaluations in low-income and middle-income countries. BMJ Open 2016, 6,
e013668. [CrossRef] [PubMed]
2. GBD 2015 Obesity Collaborators; Afshin, A.; Forouzanfar, M.H.; Reitsma, M.B.; Sur, P.; Estep, K.; Lee, A.;
Marczak, L.; Mokdad, A.H.; Moradi-Lakeh, M.; et al. Health Effects of Overweight and Obesity in 195
Countries over 25 Years. N. Engl. J. Med. 2017, 377, 13–27. [PubMed]
3. Kreidieh, D.; Itani, L.; El Masri, D.; Tannir, H.; Citarella, R.; El Ghoch, M. Association between Sarcopenic
Obesity, Type 2 Diabetes, and Hypertension in Overweight and Obese Treatment-Seeking Adult Women.
J. Cardiovasc. Dev. Dis. 2018, 5, 51. [CrossRef] [PubMed]
4. Yao, F.; MacKenzie, R.G. Obesity Drug Update: The Lost Decade? Pharmaceuticals 2010, 3, 3494–3521.
[CrossRef]
5. Hays, N.P.; Kim, H.; Wells, A.M.; Kajkenova, O.; Evans, W.J. Effects of whey and fortified collagen hydrolysate
protein supplements on nitrogen balance and body composition in older women. J. Am. Diet. Assoc. 2009,
109, 1082–1087. [CrossRef] [PubMed]
6. Zdzieblik, D.; Oesser, S.; Baumstark, M.W.; Gollhofer, A.; König, D. Collagen peptide supplementation in
combination with resistance training improves body composition and increases muscle strength in elderly
sarcopenic men: A randomised controlled trial. Br. J. Nutr. 2015, 114, 1237–1245. [CrossRef] [PubMed]
7. Fahmi, A.; Morimura, S.; Guo, H.-C.; Shigematsu, T.; Kida, K.; Uemura, Y. Production of angiotensin
I converting enzyme inhibitory peptides from sea bream scales. Process Biochem. 2004, 39, 1195–1200.
[CrossRef]
8. Zhu, C.-F.; Li, G.-Z.; Peng, H.-B.; Zhang, F.; Chen, Y.; Li, Y. Treatment with marine collagen peptides
modulates glucose and lipid metabolism in Chinese patients with type 2 diabetes mellitus. Appl. Physiol.
Nutr. Metab. 2010, 35, 797–804. [CrossRef] [PubMed]
9. Tanaka, M.; Koyama, Y.-I.; Nomura, Y. Effects of collagen peptide ingestion on UV-B-induced skin damage.
Biosci. Biotechnol. Biochem. 2009, 73, 930–932. [CrossRef] [PubMed]
10. Wang, J.; Xie, Y.; Pei, X.; Yang, R.; Zhang, Z.; Li, Y. The lipid-lowering and antioxidative effects of marine
collagen peptides. Chin. J. Prev. Med. 2008, 42, 226–230.
11. Baek, J.M.; Kang, K.H.; Kim, S.H.; Noh, J.S.; Jeong, K.S. Development of high functional collagen peptide
materials using skate skins. J. Environ. Sci. Int. 2016, 25, 579–588. [CrossRef]
12. Cho, S.H.; Michael, L.; Eun, J.B. Nutritional composition and microflora of the fresh and fermented skate
(Raja Kenojei) skins. Int. J. Food Sci. Nutr. 2004, 55, 45–51. [CrossRef] [PubMed]
13. Hu, F.Y.; Chi, C.F.; Wang, B.; Deng, S.G. Two Novel Antioxidant Nonapeptides from Protein Hydrolysate of
Skate (Raja porosa) muscle. Mar. Drugs 2015, 13, 1993–2009. [CrossRef] [PubMed]
14. Pan, X.; Zhao, Y.Q.; Hu, F.Y.; Chi, C.F.; Wang, B. Anticancer Activity of a Hexapeptide from Skate (Raja porosa)
Cartilage Protein Hydrolysate in HeLa Cells. Mar. Drugs 2016, 14, 153. [CrossRef] [PubMed]Mar. Drugs 2019, 17, 157 11 of 12
15. Song, Y.O.; Kim, M.; Woo, M.; Baek, J.M.; Kang, K.H.; Kim, S.H.; Roh, S.S.; Park, C.H.; Jeong, K.S.; Noh, J.S.
Chondroitin Sulfate-Rich Extract of Skate Cartilage Attenuates Lipopolysaccharide-Induced Liver Damage
in Mice. Mar. Drugs 2017, 15, 178. [CrossRef] [PubMed]
16. Takeshi, N.; Nobutaka, S. Isolation of collagen from fish waste material-skin, bone and fins. Food Chem. 2000,
68, 227–281.
17. Nam, H.K.; Lee, M.K. Studies on the fatty acids and cholesterol level of Raja skate. J. Korean Oil Chem. Soc.
1995, 12, 55–58.
18. Woo, M.J.; Song, Y.O.; Kang, K.H.; Noh, J.S. Anti-Obesity Effects of Collagen Peptide Derived from Skate
(Raja kenojei) Skin Through Regulation of Lipid Metabolism. Mar. Drugs 2018, 16, 306. [CrossRef] [PubMed]
19. Kim, J.H.; Kim, O.-K.; Yoon, H.-G.; Park, J.; You, Y.; Kim, K.; Lee, Y.-H.; Choi, K.-C.; Lee, J.; Jun, W. Anti-obesity
effect of extract from fermented Curcuma longa L. through regulation of adipogenesis and lipolysis pathway
in high-fat diet-induced obese rats. Food Nutr. Res. 2016, 60, 30428. [CrossRef] [PubMed]
20. Lee, S.Y.; Park, H.S.; Kim, D.J.; Han, J.H.; Kim, S.M.; Cho, G.J.; Kim, D.Y.; Kwon, H.S.; Kim, S.R.; Lee, C.B.;
et al. Appropriate waist circumference cutoff points for central obesity in Korean adults. Clin. Pract. 2007,
75, 72–80. [CrossRef] [PubMed]
21. Lee, E.J.; Hur, J.W.; Ham, S.A.; Jo, Y.; Lee, S.Y.; Choi, M.J.; Seo, H.G. Fish collagen peptide inhibits the
adipogenic differentiation of preadipocytes and ameliorates obesity in high fat diet-fed mice. Int. J.
Biol. Macromol. 2017, 104, 281–286. [CrossRef] [PubMed]
22. Astre, G.; Deleruyelle, S.; Dortignac, A.; Bonnet, C.; Valet, P.; Dray, C. Diet-induced obesity and associated
disorders are prevented by natural bioactive type 1 fish collagen peptides (Naticol® ) treatment. J. Physiol.
Biochem. 2018, 74, 647–654. [CrossRef] [PubMed]
23. Johnston-Banks, F.A. Gelatine. In Food Gels; Harris, P., Ed.; Elsevier Applied Science: London, UK; New York,
NY, USA, 1990; pp. 258–259.
24. Lage, R.; Diéguez, C.; Vidal-Puig, A.; López, M. AMPK: A metabolic gauge regulating whole-body energy
homeostasis. Trends Mol. Med. 2008, 14, 539–549. [CrossRef] [PubMed]
25. Da Costa Guerra, J.F.; Maciel, P.S.; de Abreu, I.C.M.E.; Pereira, R.R.; Silva, M.; de Morais Cardoso, L.;
Pinheiro-Sant’Ana, H.M.; de Lima, W.G.; Silva, M.E.; Pedrosa, M.L. Dietary açai attenuates hepatic steatosis
via adiponectin-mediated effects on lipid metabolism in high-fat diet mice. J. Funct. Foods 2015, 14, 192–202.
[CrossRef]
26. Toombs, R.J.; Ducher, G.; Shepherd, J.A.; De Souza, M.J. The impact of recent technological advances on the
trueness and precision of DXA to assess body composition. Obesity 2012, 20, 30–39. [CrossRef] [PubMed]
27. Kraus, W.E.; Houmard, J.A.; Duscha, B.D.; Knetzger, K.J.; Wharton, M.B.; McCartney, J.S.; Bales, C.W.;
Henes, S.; Samsa, G.P.; Otvos, J.D.; et al. Effects of the amount and intensity of exercise on plasma lipoproteins.
N. Engl. J. Med. 2002, 347, 1483–1492. [CrossRef] [PubMed]
28. LeBlanc, E.L.; Patnode, C.D.; Webber, E.M.; Redmond, N.; Rushkin, M.; O’Connor, E.A. Behavioral and
Pharmacotherapy Weight Loss Interventions to Prevent Obesity-Related Morbidity and Mortality in Adults:
An Updated Systematic Review for the U.S. Preventive Services Task Force. JAMA 2018, 320, 1172–1191.
[CrossRef] [PubMed]
29. Khera, R.; Murad, M.H.; Chandar, A.K.; Dulai, P.S.; Wang, Z.; Prokop, L.J.; Loomba, R.; Camilleri, M.;
Singh, S. Association of Pharmacological Treatments for Obesity with Weight Loss and Adverse Events:
A Systematic Review and Meta-analysis. JAMA 2016, 315, 2424–2434. [CrossRef] [PubMed]
30. Smith, S.R.; Weissman, N.J.; Anderson, C.M.; Sanchez, M.; Chuang, E.; Stubbe, S.; Bays, H.; Shanahan, W.R.;
Behavioral Modification and Lorcaserin for Overweight and Obesity Management (BLOOM) Study Group.
Multicenter, Placebo-Controlled Trial of Lorcaserin for Weight Management. N. Engl. J. Med. 2010, 363,
245–256. [CrossRef] [PubMed]
31. Steinert, R.E.; Christine, F.B.; Asarian, L.; Horowitz, M.; Beglinger, C.; Geary, N. Ghrelin, CCK, GLP-1,
and PYY(3–36): Secretory Controls and Physiological Roles in Eating and Glycemia in Health, Obesity, and
After RYGB. Physiol. Rev. 2017, 97, 411–463. [CrossRef] [PubMed]
32. Mishra, A.K.; Dubey, V.; Ghosh, A.R. Obesity: An overview of possible role(s) of gut hormones, lipid sensing
and gut microbiota. Metabolism 2016, 65, 48–65. [CrossRef] [PubMed]
33. Bray, G.A.; Tartaglia, L.A. Medicinal strategies in the treatment of obesity. Nature 2000, 404, 672–677.
[CrossRef] [PubMed]Mar. Drugs 2019, 17, 157 12 of 12
34. Whitton, C.; Ho, J.C.Y.; Tay, Z.; Rebello, S.A.; Lu, Y.; Ong, C.N.; van Dam, R.M. Relative Validity and
Reproducibility of a Food Frequency Questionnaire for Assessing Dietary Intakes in a Multi-Ethnic Asian
Population Using 24-h Dietary Recalls and Biomarkers. Nutrients 2017, 9, 1059. [CrossRef] [PubMed]
35. Craig, C.L.; Marshall, A.L.; Sjöström, M.; Bauman, A.E.; Booth, M.L.; Ainsworth, B.E.; Pratt, M.; Ekelund, U.;
Yngve, A.; Sallis, J.F.; et al. International Physical Activity Questionnaire: 12-Country Reliability and Validity.
Med. Sci. Sports Exerc. 2003, 35, 1381–1395. [CrossRef] [PubMed]
36. Rothney, M.P.; Brychta, R.J.; Schaefer, E.V.; Chen, K.Y.; Skarulis, M.C. Body composition measured by
dual-energy X-ray absorptiometry half-body scans in obese adults. Obesity 2009, 17, 1281–1286. [CrossRef]
[PubMed]
37. Coppini, L.Z.; Waitzberg, D.L.; Campos, A.C. Limitations and validation of bioelectrical impedance analysis
in morbidly obese patients. Curr. Opin. Clin. Nutr. Metab. Care 2005, 8, 329–332. [CrossRef] [PubMed]
38. U.S. Department of Health and Human Services Food and Drug Administration Center for Drug
Evaluation and Research (CDER). Guidance for Industry Estimating the Maximum Safe Starting Dose
in Initial Clinical Trials for Therapeutics in Adult Healthy Volunteers. July 2005; Pharmacology and
Toxicology. APPENDIX B, Analysis of Body Weight Effects on HED Calculations; p. 19. Available
online: https://www.fda.gov/downloads/Drugs/Guidances/UCM078932.pdf%23search=%27guidekines+
for+industry+sfe+starting%27 (accessed on 7 March 2019).
39. Rural Development Administration, National Institute of Agricultural Sciences. Food Composition Table; Rural
Development Administration, National Institute of Agricultural Sciences: Wanju, Korea, 2011.
40. Jung, H.J.; Lee, S.E.; Kim, D.; Noh, H.; Song, S.; Kang, M. Development and feasibility of a web-based
program ‘Diet Evaluation System (DES)’ in urban and community nutrition survey in Korea. Korean J. Health
Promot. 2013, 13, 107–115. (In Korean)
41. Bradstock, K.; Forman, M.R.; Binkin, N.J.; Gentry, E.M.; Hogelin, G.C.; Williamson, D.F.; Trowbridge, F.L.
Alcohol use and health behavior lifestyles among U.S. women: The behavioral risk factor surveys.
Addict. Behav. 1988, 13, 61–71. [CrossRef]
42. Sampaio, L.R.; Simões, E.J.; Assis, A.M.; Ramos, L.R. Validity and reliability of the sagittal abdominal
diameter as a predictor of visceral abdominal fat. Arq. Bras. Endocrinol. Metabol. 2007, 51, 980–986. [CrossRef]
[PubMed]
43. Min, K.S.; Han, D.S.; Kwon, S.O.; Yeo, K.M.; Kim, B.N.; Ly, S. The effect of Sargassum confusum on reduction
of body fat in obese women. J. Nutr. Health 2014, 47, 23–32. [CrossRef]
© 2019 by the authors. Licensee MDPI, Basel, Switzerland. This article is an open access
article distributed under the terms and conditions of the Creative Commons Attribution
(CC BY) license (http://creativecommons.org/licenses/by/4.0/).You can also read