A Critical Review of Policies on Pedestrian Safety and a Case Study of New Zealand - MDPI
←
→
Page content transcription
If your browser does not render page correctly, please read the page content below
sustainability

Article
A Critical Review of Policies on Pedestrian Safety and
a Case Study of New Zealand
Ajjima Soathong , Douglas Wilson, Prakash Ranjitkar * and Subeh Chowdhury
 Department of Civil and Environmental Engineering, The University of Auckland, Private Bag 92019,
 Auckland 1142, New Zealand; asoa236@aucklanduni.ac.nz (A.S.); dj.wilson@auckland.ac.nz (D.W.);
 s.chowdhury@auckland.ac.nz (S.C.)
 * Correspondence: p.ranjitkar@auckland.ac.nz

 Received: 30 August 2019; Accepted: 18 September 2019; Published: 25 September 2019

 Abstract: Vulnerable road users contribute to nearly half of road deaths globally. In New Zealand,
 this group accounts for 26% of road deaths, which includes 8% of pedestrian crashes. This paper
 provides a critical review of the road safety policies from the pedestrian’s viewpoint for some of the
 best performing countries and discusses their effectiveness for the future. A case study is conducted
 for New Zealand to identify factors contributing to the pedestrian crashes and investigate the impact
 of the road safety policies on pedestrian crash trends. The policies are predominantly well informed
 by evidence-based approaches contributing to an overall reduction in the number of road crashes.
 However, little attention has been paid on pedestrian behaviour related to crashes. Finally, the paper
 makes recommendations for improving pedestrian safety to enable better safety outcomes that are
 closer to vision zero.

 Keywords: traffic safety; vulnerable road users; pedestrian safety; policies; Vision Zero; Safe System

1. Introduction
      With economic growth and increased urbanisation, many countries are experiencing
transport-related problems as inherited transport infrastructure is unable to cope with increasing
travel demand. These problems include an increased likelihood of crashes and severity of injury for
unprotected road users, particularly pedestrians, due to their inherent vulnerability. A high proportion
of pedestrian fatality is evident on a global scale, accounting for 22% of all road traffic deaths [1].
      Insight can be gained from experiences of countries that have achieved the lowest number of
road death such as Sweden and the Netherlands. Consequently, many countries are adopting and
implementing a “Vision Zero” strategy [2–4].
      New Zealand faces significant pedestrian safety-related issues as pedestrian crash trends have
increased in recent years, even though the Safe System approach was introduced in 2010 as a national
road safety strategy [5]. The vision outcome targeted a safe road system, which is increasingly free of
death and serious injury. It recognised that people make mistakes and are vulnerable in a crash. It was
expected to reduce the price paid for a mistake so that crashes do not result in loss of life or limb. There
is a lack of evidence-based research that focuses on vulnerable road user behaviour in comparison to
driver behaviour. Research evidence is required for policymakers to develop effective performance
measures [5–7]. With many urban and land use initiatives promoting and encouraging increased
walking trips, increased pedestrian movements in car-centric cities will lead to an increasing proportion
of pedestrian-related crashes unless specific action plans are put in place to protect this group.
      The specific objectives of this paper are as follows:

Sustainability 2019, 11, 5274; doi:10.3390/su11195274                      www.mdpi.com/journal/sustainability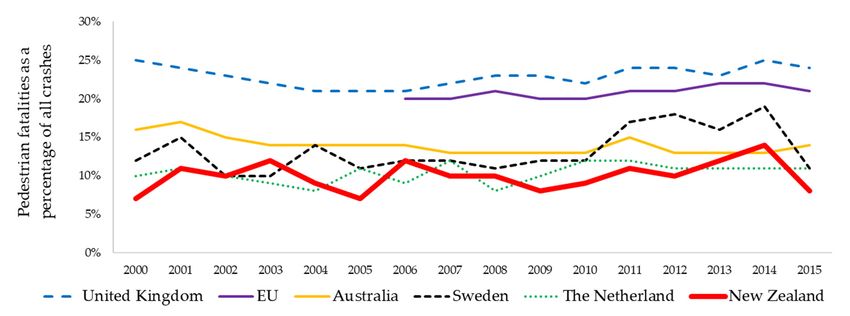
Sustainability 2019, 11, 5274                                                                       2 of 27

•     analyse historical data of pedestrian crashes in New Zealand;
•     compare pedestrian safety performance with best performing OECD countries;
•     identify factors contributing to pedestrian safety between countries analysed;
•     conduct a critical review of the road safety policies from the pedestrian’s viewpoint for some of
      the best performing countries in comparison to New Zealand.
      This paper is organised into six sections. Section 2 provides a discussion on the main factors
contributing to pedestrian safety, followed by a critical review of policies related to road/pedestrian
safety, including Vision Zero and Safe System approach in Section 3. The research approach developed
for this study is explained in Section 4. Section 5 presents a comparative analysis of pedestrian crashes
and policies on road and pedestrian safety in New Zealand and some of the best-performing countries.
Section 6 presents analysis of historical data of pedestrian crashes in New Zealand followed by
discussion and recommendations in Section 7. Finally, some conclusions are drawn in the last section.

2. Factors Contributing to Pedestrian Safety

2.1. Built-In Environment
     Pedestrian crash risk is multi-factored. Crashes vary significantly by location and time, complicated
further by their statistical rareness and largely randomness in relation to being able to predict an
occurrence. Urban cores commonly comprise mix-land use, diversity of trip purposes, and dispersed
walking trip linkages [8]. The main urban road, which is usually classified as an arterial road or
collector road, dominates the concentration of pedestrians and vehicle volumes. Zegeer and Bushell [9]
explain that the number of pedestrian crashes is more likely to occur in areas with a higher population
and road crossing movements. Pedestrians’ risk of death in these zones is 10 times higher than car
occupants [10]. In fact, Jacobsen [11] remarked that vehicle–pedestrian crashes are less likely when
the number of cycling or walking in particular areas increased. In an environment that prioritised
pedestrians rather than vehicular modes, such as self-explaining roads or mixed-use shared spaces,
a road function can influence road users’ manoeuvres and safety outcomes. These environments,
if appropriately implemented, can create a safe, user-friendly place for vulnerable road users to
dominate the primary space function, resulting in fewer crash events [12,13]. However, a key issue is
that self-explaining roads or shared space roads cannot be implemented on all road types, especially
arterial and collector roads when high through movement is prioritised.

2.2. Pedestrian Characteristics
     There is evidence that elderly road user groups have a higher fatality rate in traffic environments
than average road users. Additionally, the consequences of injuries to the elderly can be more
severe [14,15]. Several countries reported that half of the road toll was among this group, and the
proportion was relatively high in urban areas [16]. In addition, due to the increased number of
the ageing population worldwide, a challenge of road safety policies is to ensure safer mobility of
the elderly.
     Road users who are alcohol-impaired is another group that shows a disproportionately high
share in road crashes [17] in the USA indicated that almost 48% of crashes in 2015 were pedestrian
fatalities that involved some alcohol-impairment from both drivers and pedestrians. The trend is
similar in Sweden, where pedestrians with alcohol involvement showed a higher crash risk, and this
constituted between 39% and 60% of pedestrian crashes [18]. Charlton and Starkey (2013) in New
Zealand indicated that alcohol consumption resulted in cognitive impairment such as visual attention,
vigilance, and driving tasks when a BAC level reaches 0.08% [19].
     Distraction by electronic devices using mobile phones or music players among road users does
not currently present as a primary contributing factor to pedestrian crashes. This is most likely due to
under-reporting problems due to the difficulty of obtaining real causality factors. However, an upward
trend in mobile phone use while driving poses a higher likelihood of crashes [20,21]. In New Zealand,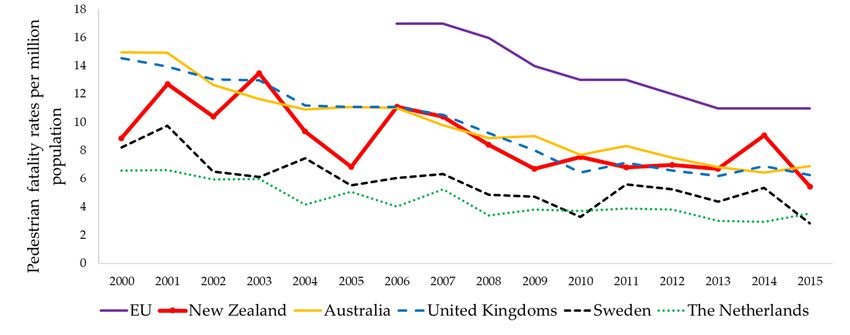
Sustainability 2019, 11, 5274                                                                        3 of 27

mobile phone use remains an issue with 60% of drivers admitting using cell phones while driving,
despite hand-held mobile phones being banned since 2009 [16].

2.3. Pedestrian Behaviour
     Pedestrians and vehicle interactions are common at road crossings where sharing the right of way
creates a greater potential of conflict and, therefore, a higher risk of crash involvement. In most cases,
the casualty can be examined from road rule compliance. Studies indicate that the lack of adherence
to the traffic regulations from both drivers and pedestrians is one of the critical factors associated
with pedestrian crashes [22–26]. King et al. [25] reported that the relative risk of non-compliance
crossing was eight times higher than in legal crossings at signalised intersections. Collisions from
road rule violation may aggravate the situation, particularly when involved with high-speed vehicles.
Várhelyi [26] stated that only one in four drivers would lower their speeds or brake when they are
encountering pedestrians who are on or about to step onto the zebra crossing, and most of them did
not prepare to reduce speed for unexpected situations. Pedestrians are unprotected road users and
as such are significantly more likely to sustain greater injury severity with increased relative vehicle
conflict speeds.
     The provision of controlled pedestrian crossings is believed to enhance the safety and mobility of
pedestrians, but it does not always guarantee road user’s (pedestrian and driver) compliance. Studies
reveal the counterintuitive evidence that the presence of pedestrian crossing facilities is found not to
be significant and seems to create a false sense of safety in some situations [27,28]. Pedestrians are
more likely to be impatient when the waiting time increases [23,27,29–31] or crossing during the red
signal phase seems easy [32]. Non-compliance behaviour is, therefore, considered as one of the key
factors associated with increased crash risk.

3. Policies Related to Road/Pedestrian Safety

3.1. Vision Zero
      Vision Zero was first introduced by the Swedish Parliament in 1997 under an ethical imperative
that “No one will be killed or seriously injured within the road transport system.” While it is accepted
that humans can make mistakes, the core concept is a biomechanical tolerance of a human body. Crash
severity needs to be addressed through the design of a more forgiving transport system in a way that
minimises the forces on humans, thereby preventing or reducing human injury. The main change
is shifted away from a traditional traffic safety system toward the adoption of an approach where
responsibilities are shared between system designers and road users. The system designer has the
ultimate responsibility for the transport design and operation, whereas the road user needs to follow
traffic laws and rules. If the road user fails to obey these rules, the system designer is required to take
a further step to improve infrastructure design to be more forgiving, thereby reducing the severity
of traffic injury and especially the probability of fatal injury. The Swedish Vision Zero had an initial
general target to halve the number of fatalities and decrease serious injuries by one quarter between
2007 and 2020. This strategy resulted in a successful reduction in fatalities. In 1997 when Sweden
launched Vision Zero, the fatality rate was 6.1 killed/100,000 inhabitants. In 2015, the fatality rate was
2.6 killed/100,000 inhabitants, the number of road deaths has decreased by 57%, which represents
an average annual decrease of 3%. [33]. This, however, primarily resulted from improved safety
of the vehicle fleets and infrastructure design and operation with notably reduced traffic operating
speeds [16]. In addition, a renewed commitment to Vision Zero was released in 2016, and this updated
policy highlighted the need for infrastructure design, maintenance, and operation improvements
specifically targeted at vulnerable road users. Speed limit investigations in built-up areas are targeted
primarily at the safety of pedestrians and cyclists [34].
      Vision Zero is said to be driven by an ethical and human value that will not be compromised by
economic aspects or cost-benefit analysis [35]. Adopting Vision Zero requires innovative investment
Sustainability 2019, 11, 5274 4 of 27
approaches into re-engineering and/or operation of the inherited road transport system and a
commitment from the government is an essential step in implementing this strategy. The challenge is
how to appropriately engage society in implementing the required change in investment priorities and
user behaviour within the complex transport system. The Swedish Vision Zero strategy that many
countries have since also adopted or considered adopting has been successful despite the strategy not
clearly articulating specific strategy content [35,36].
3.2. Safe System Approach
In New Zealand, a Safe System approach was introduced in “Safer Journeys” as a national road
safety strategy in 2010. The Safe System principles focus on creating a safe transport system for road
users to reduce the consequences of crashes by recognising human fallibility and their vulnerability.
System designers and system users must share responsibility. All four pillars of the system including
roads and roadsides, speeds, vehicles, and road users need to be strengthened [7]. However, Safer
Journeys does not have a general target reduction. Instead, it uses performance indicators for a specific
group of activities. The implementation and progress are monitored through a series of action plans
periodically from 2011 to 2020. Table 1 summarises the core activities in the New Zealand Safer
Journeys for this period.
Table 1. Immediate targets in New Zealand Safer Journeys.
2011–2012 2013–2015 2016–2020
Safe Roads and Roadsides
• High-risk rural roads, high-risk urban intersections
• Improving road design standard (KiwiRAP)
• High-risk motorcycling routes
• Mixed used arterial for active modes
Safe Road Use
• Impaired driving/riding
• Education, awareness • Enforcement
• Education, awareness
• Motorcyclists • Motorcyclists
• Enforcement measures
• Young drivers and riders • Young drivers and riders
• Drug and alcohol use in drivers
• Alcohol/drug-impaired driving • Cycling and pedestrian safety
(medium concern)
Safe Speed
• Continuing to improve safe speed through a speed management program
• Roll-out of the safety camera program
Safe Vehicle: Continuing to improve the safety of the New Zealand vehicle fleet
Safe Road Use, the Safer Journeys pillars, specifically targets user behaviour of young drivers,
impaired drivers, and motorcyclists through enforcement and education campaigns. This is explained
by targeting improved user performance as drivers who are skilled, alert and able-bodied are more
likely to comply with road rules [7]. Interestingly, driver behaviour change has had a greater role
in meeting outcomes from the action plans compared to pedestrians. This pillar does not include
pedestrian safety or behaviour as a high concern, and a few core activities have focused on this group.
A possible reason may relate to the majority of road crashes that are dominated by vehicle drivers or
occupants, and this remains a critical factor in regulating strategic plans, whilst other road users being
a minority are often overlooked.
Viewing other Safe System pillars, Safe Speed and Safe Roads and Roadsides, New Zealand
policy tends to focus on improving high crash risk location factors, particularly on rural roads. The
pillars, Safe Speed, aims to minimize the impact of vehicle speed as a causal factor to make a crash
survivable. Speed reduction is targeted by influencing road user behaviour through reduced speed
limits, speed enforcement, and speed calming (i.e., chicanes, speed humps, planted side islands, orSustainability 2019, 11, 5274 5 of 27
roundabouts). In recent years, reducing speeds has been an increasing priority, especially around
school zones and other residential zones. Road Controlling Authorities plan to apply speed limits
consistently throughout the nation by 2020; however, priorities have consistently focused on the highest
severity and crash risk rated areas. This often means that network-wide treatments and policies that
focus on non-driver user behaviour because of lower exposure are a lower priority [37,38].
In term of Safe Roads and Roadsides, increased investment has begun and will continue
improvements in rural road safety, such as the “Safety Boost Program”. Approximately $22.5 million of
safety improvements along regional State highways is programmed, adding to an existing $100 million
per annum for rural roads [37]. In urban areas, cycling safety investment improvements has also
significantly increased from a very low initial position, now funded at $400 million [39]. Pedestrian
safety, however, has been considered mainly by identifying and targeting high-risk intersections,
whereas most of the pedestrian crashes, pedestrians being struck while crossing the road, currently
occurs at untreated intersections (see Sections 6.2 and 6.3). Although Urban KiwiRAP has identified
high-risk arterial roads and areas where vulnerable users are most likely to crash, any national approach
is yet to resolve the level of risk systematically. Also, approximately 94% of NZ urban roads are
operated by local government by local road controlling authorities that are less co-ordinated and more
variable in their approach to road safety outcomes [37].
Finally, the Safe Vehicles pillar mainly works toward ensuring compliant vehicle safety standards.
There is no current evidence of encouraging more pedestrian-friendly products in vehicles such as the
frontal protection system, other than encouraging owners to purchase vehicles with higher overall
aggregated ANCAP safety star ratings [40]. With these current and short-term future targets, improved
pedestrian safety may not significantly improve.
Figure 1 illustrates New Zealand pedestrian fatality trends compared to other crash types (areas
of high concern in action plans) before and after the implication of Safer Journeys. The figure indicates
that fatality in vulnerable road users did not significantly decrease. Since the launch of Safer Journeys
in 2010, there was an overall decrease in road deaths involving young drivers, speeding drivers,
and drugs/alcohol-impaired drivers despite a slow increase after 2014. In contrast, the number of
pedestrians killed
Sustainability 2019, 11, has remained
x FOR relatively constant, and the trend has become worse for motorcyclists.
PEER REVIEW 6 of 26
180
160 2010 Safer Journeys Began
140
Number of deaths
120
100
80
60
40
20
0
2000 2001 2002 2003 2004 2005 2006 2007 2008 2009 2010 2011 2012 2013 2014 2015 2016
Deaths involving Speed Deaths involving Alcohol/Drugs
15-24 Year Old Drivers Killed Pedestrians Killed
Motorcyclists Killed
FigureFigure 1. New
1. New Zealand
Zealand roadroad deaths
deaths before
before andand after
after thethe implementation
implementation of of Safer
Safer Journeys.Note:
Journeys.
Deaths involving alcohol/drugs is listed as a factor when a driver’s blood or breath alcohol level is
Note:above
Deaths involving
the alcohol/drugs
legal limit. More detailsisare
listed as a in
shown factor when aA.driver’s
Appendix Factorsblood ortobreath
related alcohol level is above
crashes.
the legal limit. More details are shown in Appendix A. Factors related to crashes.
5. Analysis Results
5.1. Pedestrian Crashes Time Series Data
Globally, Europe, Australia, and New Zealand have lower traffic and health risk compared to
other regions [46]. Of all countries, Sweden, the United Kingdom, and the Netherlands (known as
SUN countries) are among those with best practice in road safety [47]. Figure 2 shows a comparisonSustainability 2019, 11, 5274 6 of 27
4. Materials and Methods
This paper evaluates two primary issues—New Zealand historic reported pedestrian crashes
and national and international road safety policies. The evaluation will help in assessing how close
New Zealand is to achieving targets from a Safe System approach. The research investigated five
years of crash data from 2012 to 2016 (unless stated otherwise) from the New Zealand Crash Analysis
System (CAS) and the amount of walking from 2012 to 2015 from the New Zealand Household Travel
Survey (NZHTS). The CAS database, used to store and analyse road crash causations, is New Zealand’s
primary tool for collecting, storing, and analysing crash records. Data are mainly obtained from Traffic
Crash Reports (TCRs) completed by police officers when crashes occur at investigated scenes. Details
are reviewed and added to the CAS database by the NZ Transport Agency. A five-year period is
preferred because it provides a sufficient number of crashes for meaningful results whilst limiting
the effect of fundamental changes on the network or driving rules. It also helps reduce statistical
fluctuation and the effect of regression-to-the-mean [41]. The amount of walking from NZHTS is
obtained from travel diary questionnaires or self-completed and household interviews. It includes
recreational walks and calculated using a ‘trip leg’ defined as a non-stop leg of travel by a single mode.
For example, driving to work with a stop at the shops on the way would be two trip legs. Crossing or
walking for 100 m or more on a public footpath or road are counted. The data are then weighted to
represent the New Zealand population [42–45].
In comparison to best-performing countries, several databases were obtained. These include
Eurostat, CARE database, the Netherlands (CBS Statistics Netherlands, SWOV Institute for road safety
research), the United Kingdom (Department for Transport, DfT; Transport for London, TfL), Sweden
(Trafikanalys Swedish Transport Administration, SCB Swedish official statistics, Stockholms stad), and
Australia (Bureau of Infrastructure, Transport and Regional Economics, BITRE; Transport for NSW).
5. Analysis Results
5.1. Pedestrian Crashes Time Series Data
Globally,
Sustainability 2019,Europe,
11, x FORAustralia,
PEER REVIEWandNew Zealand have lower traffic and health risk compared 7 ofto
26
other regions [46]. Of all countries, Sweden, the United Kingdom, and the Netherlands (known as
Highways
SUN and/or
countries) regionalthose
are among or local authorities.
with best practice inA road
numbersafetyof[47].
policies
Figureexplicitly
2 shows afocus on the
comparison
improvement
between of infrastructure,
best-performing countriesspeed
to Newmanagement programmes,
Zealand’s crash record. It driver behaviour,
provides and child
the proportion of
pedestrians. Australia has a clear principle toward urban safety management and vulnerable
pedestrian crashes to all crash types. At an initial glance, it looks as if New Zealand had the lowest road
users. Similar
proportions to European
of pedestrian countries,
fatalities. area-wide
However, whentraffic calmingtoofpedestrian
comparing 30 km/h zones areper
fatalities commonly
million
implemented in the United Kingdom, Sweden, and the Netherlands. Guidelines focusing
population (Figure 3), the result shows that New Zealand is not performing as well. Despite a drop in on lowering
speed
the limits tofatality
pedestrian more survivable impact
rate from 2006 speeds
to 2008, are
the lower
rate compared
is still relativelytohigh.
New Zealand.
Figure 2. Pedestrian
Figure 2. Pedestrian fatalities
fatalities as
as aa percentage
percentage of
of all
all crashes.
crashes.speed limits to more survivable impact speeds are lower compared to New Zealand.
Sustainability 2019, 11, 5274 7 of 27
Figure 2. Pedestrian fatalities as a percentage of all crashes.
Figure 2. Pedestrian fatalities as a percentage of all crashes.
Figure 3.
Figure Trend in
3. Trend in pedestrian
pedestrian fatalities
fatalities per
per million
million population.
population.
This is apparent when looking at the average annual percentage of pedestrian crash reductions in
Figure 4. The Netherlands has achieved the highest reduction of serious injuries, whilst the UK has
shown the% Reduction
most in pedestrian
significant change inserious
reducing injuries
pedestrian % Reduction
fatality. Inincontrast,
pedestrian fatalitiesfatalities
pedestrian
NL UK AUS SE NZ UK AUS
and serious injuries have increased in New Zealand. These figures, however, must NL SE NZbe cautiously
interpreted,
0% as data collection methods and the definition of crash severity differs significantly 0.41% between
-0.53% of 1.59%
countries. For example, the definition -0.30%
seriousness in the Netherlands and
-0.43%Sweden is normally
-1.77% -1.30%
referred-5%
to the number of people who are seriously injured -2.56%on MAIS (A trauma scale refer to
-2.69% based
‘Maximum Abbreviated Injury Score.’ Seriously injured = all road victims with a MAIS score of 3 or
more (MAIS3+)) [48].Figure 3. Trend inthe
For Australia, Desired
pedestrian EU28 progress
fatalities
‘high threat to towards 2020injury
per hospitalized
life’ million targetcases
population. for allthat
crash:
are-6.7%
a subset
-10%
of all serious injury [49] are similar categories for serious pedestrian injuries studied in this study.
-15%
% Reduction in pedestrian serious injuries % Reduction in pedestrian fatalities
NL UK AUS SE NZ UK AUS NL SE NZ
-20% -19.38%
0% 0.41%
-0.53% -0.30% 1.59%
-0.43%
-1.77%% change in the number of pedestrian -1.30%
Figure 4. Average annual -2.69% -2.56% casualty (2010–2015). Note:
-5%
Australian pedestrian casualty is analysed from 2010 to 2014, whereas data for 2012 is unavailable.
Desired EU28 progress towards 2020 target for all crash: -6.7%
-10%
-15%
-20% -19.38%
Figure 4. Average annual % change in the number of pedestrian casualty (2010–2015). Note: Australian
Figure 4. Average annual % change in the number of pedestrian casualty (2010–2015). Note:
pedestrian casualty is analysed from 2010 to 2014, whereas data for 2012 is unavailable.
Australian pedestrian casualty is analysed from 2010 to 2014, whereas data for 2012 is unavailable.
5.2. Timeline of Road Safety Policies
The transport authorities in New Zealand have made significant progress since 1987 in reducing
fatal road crashes (although, more recently, this has again been increasing). However, these policies
did not achieve significant reductions in the number and severity of pedestrian crashes as most gains
occurred to vehicle drivers or passengers
Table 2 summarises national road safety strategies and provides examples of local and regional
action plans that have an impact on pedestrian safety from best-performing countries and New Zealand.
As can be seen, the principal strategy was initiated at the highest level from central government
and implemented mostly by the NZ Transport Agency that manages the National State HighwaysSustainability 2019, 11, 5274 8 of 27
and/or regional or local authorities. A number of policies explicitly focus on the improvement of
infrastructure, speed management programmes, driver behaviour, and child pedestrians. Australia
has a clear principle toward urban safety management and vulnerable road users. Similar to European
countries, area-wide traffic calming of 30 km/h zones are commonly implemented in the United
Kingdom, Sweden, and the Netherlands. Guidelines focusing on lowering speed limits to more
survivable impact speeds are lower compared to New Zealand.
As New Zealand does not now manufacture vehicles, vehicle safety is largely impacted by
countries where vehicles are imported from (new and used), and the average vehicle fleet age
(>14 years old) is quite old in comparison to comparator countries. The New Zealand vehicle safety
policy is therefore barely evident other than ensuring vehicles meet minimum ‘warrant of fitness’
standards and encouraging the purchase of vehicles with higher safety standards [40]. In contrast,
countries such as the Netherlands, the United Kingdom, and Sweden have been progressing through
creating tighter generic safety requirements for motor vehicles, i.e., improving frontal impact testing in
cars or pedestrian protection.
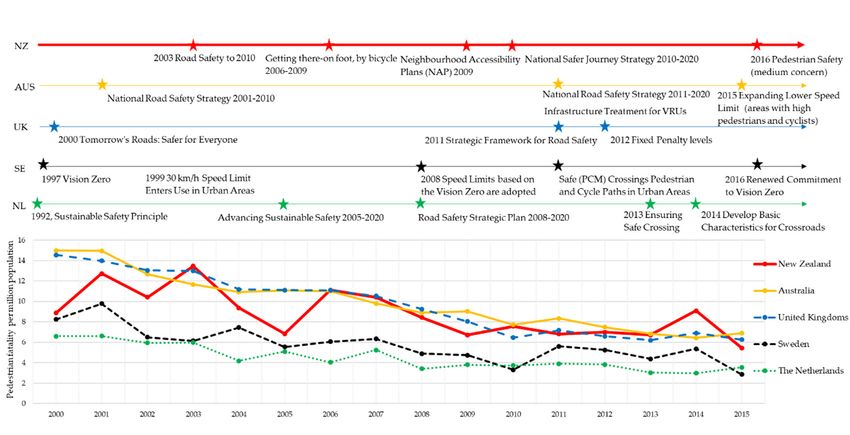
Viewing the timeline of significant events on pedestrian safety and pedestrian death rates per
million population from Figure 5 indicates a relatively crude but un-proven co-relationship between
policies and crash trends. Although this relation may not be fully understood, and notably outcomes in
pedestrian crash reduction cannot be attributed in isolation to a single policy, the strategies have led to
a significant move in reducing pedestrian crashes in some countries. Overall, the United Kingdom and
Australia have shown forward progress in reducing pedestrian deaths in comparison to other countries.
Positive outcomes could be a result from the stringent targets to reduce the number of pedestrian
casualties being one of the major national safety indicators. The Netherlands and Sweden have had the
lowest number of pedestrian deaths, although its reduction rate per year has reached a stable level and
has remained relatively static for the last decade. A possible explanation may be due to these countries’
road safety policies are integrated into various policy areas, and their action plans are constantly
monitored over two decades. Although several policies emphasise the protection of vulnerable road
users through speeds and drivers, there is a strong commitment in an urban environment with a focus
on pedestrians and cyclists.
The policies that may seemingly have had the most positive impact (if taken in isolation) on
pedestrian safety in New Zealand are the Road Safety to 2010 that was implemented in 2003 and the
Getting there-on foot, by bicycle policy in 2006. The number of pedestrian deaths overall during this
period has trended slightly downwards after these policies were introduced, although, from year to
year, there have been significant fluctuations. However, since 2010, with the less obvious action plans
and monitoring programmes targeting specifically pedestrian safety in the Safe System Approach, the
number of pedestrian deaths has remained relatively stagnant.Sustainability 2019, 11, 5274 9 of 27
Table 2. Road safety policies related to pedestrian safety from best-performing countries compared to New Zealand.
Country Road Safety Strategy Programs/Projects Affected Pedestrian Safety
National Road Safety Strategy • The introduction of 50 km/h urban default speed limit
2001–2010 [50] • The introduction of 40 km/h and lower limits in higher-risk pedestrian and school areas
National Road Safety Strategy
• Infrastructure treatment addressing vulnerable road users (VRUs) safety issues (2011–2017)
2011–2020 (One of the national
• Expanding 40 km/h or lower speed limits enforcement in areas with high pedestrians and cyclists
challenges is to reduce the number
(2015–2017)
Australia of serious casualties among
pedestrian and cyclists.) [51] • Advancing the safe system by implementing a range of pilot projects in urban areas for VRUs (progressing)
• Implementing targeted infrastructure improvements related to pedestrian safety such as crossing facility
and signal phasing
NSW Pedestrian Safety Action Plan
• Promoting innovative technology for vehicle safety features
2014–2016 [52]
• Communication and awareness campaigns to promote safety with pedestrians and other road users
• Pedestrian behaviour and attitudes
• Start-up Program Sustainable Safety: a covenant with 24 agreements between the national government
and regional and local authorities (SWOV, 2006 referred to VNG et al., 1997)
• The functionality of the road: the premise that roads can only have a single function (mono-functionality)
Sustainable Safety Principle (1992)
• Homogeneous use by preventing large differences in vehicle speed, mass, and direction
• Predictable use, preventing uncertainties amongst road users, by enhancing the predictability of the roads’
course and the behaviour of other road users.
Advancing Sustainable Safety
Proposes safe speeds 30 km/h for situations with possible conflicts between cars and unprotected road users
The Netherlands 2005–2020 (not policy paper) [53]
• Ensuring safe crossing situations; especially for the elderly (Completion 2013)
• Develop basic characteristics for crossroads (Completion 2014) [55]
• Introducing more stringent generic requirements for motor vehicles, such as the ban on bull bars (with a
Road Safety Strategic Plan view to pedestrian safety)
2008–2020 (Pedestrians is one of the • Encouraging the voluntary introduction of pedestrian detection systems in motor vehicles
emphasis areas) [54] • Improving collision-friendly passenger car features for pedestrians and cyclists by instituting more
stringent testing procedures in Euro NCAP and EU legislation
• Influencing road user behaviour by highlighting the importance of safe behaviour (including an awareness
of their own vulnerability)Sustainability 2019, 11, 5274 10 of 27
Table 2. Cont.
Country Road Safety Strategy Programs/Projects Affected Pedestrian Safety
• Safe speeds: 32 km/h (20 mph) zone, speed enforcement camera
Tomorrow’s Roads: Safer for • Child pedestrian safety achieving the 2010 Target [57]
everyone [56] • Safer infrastructure: an introduction of longer-term for local transport plan, more coordinated local
planning and improvement for walkers and cyclists
• Empowering local citizens and local service providers (enforcement)
Strategic Framework for Road
• Fixed Penalty levels (increase the payment levels for offences related to pedestrian crossings;
Safety (One of the national
The United commenced 2012)
indicators is the rate of pedestrian
Kingdom deaths per billion miles walked) • Clear responsibility for all road users including pedestrians
[58] • Research and information sharing; including research on skills, behaviour, and attitudes given insights
into how to influence people to make safer decisions and perception of road safety
• London’s first Pedestrian Design Guidance (completed by 2014)
Feet First-Improving Pedestrian • Improvements to crossing facilities, innovative crossing (2014–2020)
Safety in London [59] • Technology trials on London’s bus fleet and HGV (completed by 2020)
• Enforcement and Education (completed by 2020)
Healthy Streets for London [60] Making streets more accessible to cross, encouraging walking and connecting communities
• Applying 30km/h speed limit in areas where unprotected road users and cars are mixed (Calm Streets, 1998;
and 11-point program for traffic safety, 1999) [61]
• 30 km/h speed limit enters use in urban areas (1999) [62]
• Speed limits based on Vision Zero are adopted (2008) [62]
Vision Zero (1997) • A new milestone is proposed [63];
-The share of safe pedestrian, cycle and moped (PCM) crossings in urban areas; by changing a PCM crossing
from not being speed protected to being speed protected
Sweden -The share of municipalities with good-quality maintenance of pedestrian and cycle paths
-Improved safety technologies which vehicles will be equipped by 2020
Renewed Commitment to Vision • Create safe traffic environments for vulnerable road users, especially for walking or cycling
Zero 2016 [34] • Further study the issue of speed limits in densely populated areas
• A review of crossings with two or more traffic lanes has been implemented.
• A number of crossings are corrected every year to create after traffic environments.
Stockholm Pedestrian Plan
2015–2020 [64] • Implementing both physical and behavioural measures to improve road safety near schools.
• Separating pedestrians and cyclists and providing more space for both modes to minimize levels of
insecurity and conflict.Sustainability 2019, 11, 5274 11 of 27
Table 2. Cont.
Country Road Safety Strategy Programs/Projects Affected Pedestrian Safety
• Providing the direction for road safety in New Zealand for all road users
• Development of pedestrian and cyclist road safety framework
Road Safety to 2010 [6] • Safer routes (2002) program designed to help local agencies to identify risks to pedestrians and cyclists
in communities
• Pedestrian and cyclist best practice standards and guidelines
• Linking planning of this strategy to Road Safety to 2010
• Development of data quality in the Crash Analysis Database System (CAS)
• Road safety projects to target ‘speed’ and ‘drive to the conditions’
Getting there on foot, by bicycle
• National Safekids Campaign, Walking school bus program
2006-2009 [65] Focus Four (P9):
• Safer routes (ongoing) program
Improve road safety and security
for pedestrians and cyclists • Australasian New Car Assessment Program (ANCAP)
• Enforcement of the road safety-related law
• Share the road campaign guidance
• Community road safety program
Pedestrian Planning and Design • Providing guidelines for improving New Zealand’s walking environment supporting the priorities for
Guide One of the Road Safety to action in Getting there-on foot, by cycle
New Zealand 2010 strategy projects [66] • RTS 14—Guidelines for facilities for blind and vision impaired pedestrians [67]
Neighbourhood Accessibility Plans • Providing guidelines for local authorities to set up neighbourhood accessibility planning projects
(NAP) [68] (targeting pedestrian, cyclist and shared mode user safety and access problems)
Safer Journeys for Schools [69] • Providing guidelines for road safety practitioners to improving safety on the journeys to and from schools
• Ensure roads and roadsides support safer travel for the vulnerable road user
Safer Journeys Strategy 2010–2020 • Encouraging all road users to share the road
[7] • Ensuring that urban development takes pedestrian safety into account (i.e., near schools, retirement
villages, shopping centres, hospitals, and public transport) (Refer to Table 1)
• Road controlling authorities implemented widespread upgrades of pedestrian facilities particularly school
Auckland Regional Road Safety areas and in town centres
Plan 2009–2012 [70] • Pedestrian crash cluster/black spot study, which all territorial authorities agree to implement, is completed
in June 2012.
• Safer Communities and Schools: TravelWise 4 Schools, Walking school buses
• Schools are being assessed for their suitability to adopt a 40km/h speed zone based on Land Transport
Walking Action Plan 2007–2012 [71] NZ criteria.
• Safety demonstration projects: Self-explaining road
• Enforcement: Red light cameraSustainability 2019, 11, 5274 12 of 27
Figure Pedestrianfatalities
5. Pedestrian
Figure 5. fatalitiesrate
rate mapping
mapping with
with thethe major
major strategic
strategic plans.
plans. Pedestrian
Pedestrian Crashes
Crashes in
in New
New Zealand.
Zealand.
6. Pedestrian Crashes in New Zealand
6. Pedestrian Crashes in New Zealand
New Zealand’s Safer Journeys approach may have contributed to an overall death toll reduction.
New Zealand’s Safer Journeys approach may have contributed to an overall death toll reduction.
However, during this same analysis period, pedestrian safety has not significantly improved. A possible
However, during this same analysis period, pedestrian safety has not significantly improved. A
reason for this is less attention has been paid to infrastructure and user behaviour improvements
possible reason for this is less attention has been paid to infrastructure and user behaviour
targeting pedestrian safety in comparison to more dominant crash types. To identify what these
improvements targeting pedestrian safety in comparison to more dominant crash types. To identify
problems are and the gap between pedestrian crashes and Vision Zero targets, the study further
what these problems are and the gap between pedestrian crashes and Vision Zero targets, the study
analysed New Zealand pedestrian crash records.
further analysed New Zealand pedestrian crash records.
6.1. Trends
6.1. Trends
As can be seen from Figure 6, the total reported number of pedestrian deaths and injuries,
As canthe
throughout becountry,
seen from Figure
has some 6, the total
year-to-year reported
rise number
and fall from of2000
969 in pedestrian
to 1004 indeaths and injuries,
2017. Nevertheless,
throughoutcrashes
pedestrian the country, has some
have decreased year-to-year
mainly rise and
on minor injuries fall from
between 2013969 in 2000
to 2016, to 1004
whereas in 2017.
no significant
Nevertheless, pedestrian crashes have decreased mainly on minor injuries
reduction in pedestrian fatalities and serious injuries were found. Notably, only a proportion of between 2013 tominor
2016,
whereas
injury no significant
crashes are recorded reduction in pedestrian
in CAS [72]. Data that fatalities and serious
includes minor injuriesiswere
injury crashes found.
therefore lessNotably,
reliable
only a proportion of minor injury crashes are recorded in CAS [72]. Data
because the under-reporting issue is much higher and more variable depending upon the locationthat includes minor injuryin
crashes is
Sustainability therefore
2019, 11, x less
FOR reliable
PEER REVIEWbecause
comparison to fatal and serious injury crashes. the under-reporting issue is much higher and more variable
12 of 26
depending upon the location in comparison to fatal and serious injury crashes.
Figure 7 provides the number of pedestrian fatalities and serious injuries (FSi) per million km
1200 1104 1091
walking from969 20051027 1032 983
to 2015. The result has1012
shown 1018 in FSi rate since 2011 with a1004
933 986 957
a gradual increase small
Number of Pedestrian
1000 920 961 880 871 888 873
fluctuation during this period, despite a slight drop in walking by an average annual rate of about
1%. The800 pedestrian risk exists, but data interpretation is mainly drawn from the million km walking
crashes
600
per year, where it is not yet finalized. Overall, it can be concluded that pedestrian safety has not
400 improved.
significantly
200
0
2000 2001 2002 2003 2004 2005 2006 2007 2008 2009 2010 2011 2012 2013 2014 2015 2016 2017
Overall pedestrian casualty Fatal Serious Minor
Trendofofthe
Figure6.6.Trend
Figure thepedestrian
pedestriancasualty
casualtyin
inNew
NewZealand
Zealandfrom
from2000–2017.
2000–2017.
Figure 7 provides the number of pedestrian fatalities and serious injuries (FSi) per million km
walking fromPedestrian crashThe
2005 to 2015. per result
millionhas
kmshown
walkinga per year increaseMillion
gradual km walking
in FSi rate per with
since 2011 year a small
0.50 1,000
fluctuation during this period, despite a slight drop in walking by an average annual rate of about
Fsi per million km
walking per year
Sustainability 2019, 11, x; doi: FOR PEER REVIEW www.mdpi.com/journal/sustainability
0.40 900
.36 .37
.34 .33
0.30 .32 800
walking
.31 .32 .31 .28 .31
.30
0.20 7001000 880 871 873
Number of Pedest
800
crashes
600
400
200 2019, 11, 5274
Sustainability 13 of 27
0
2000 2001 2002 2003 2004 2005 2006 2007 2008 2009 2010 2011 2012 2013 2014 2015 2016 2017
1%. The pedestrianOverall pedestrian
risk exists, but casualty
data interpretationFatal Serious
is mainly drawn Minor
from the million km walking
per year, where it is not yet finalized. Overall, it can be concluded that pedestrian safety has not
Figure 6. Trend of the pedestrian casualty in New Zealand from 2000–2017.
significantly improved.
Pedestrian crash per million km walking per year Million km walking per year
0.50 1,000
Pedestrian Fsi per million km
Million km walking per year
0.40 900
.36 .37
.34 .33
0.30 .32 800
walking
.31 .32 .31 .28 .31
.30
0.20 700
0.10 600
0.00 500
2005 2006 2007 2008 2009 2010 2011 2012 2013 2014 2015
Figure 7.
Figure Pedestrian FSi
7. Pedestrian FSi per
per million
million km
km walking
walkingfrom
from2005–2015.
2005–2015.Note:
Note:Million
Millionwalking
walkingyear
yearinin2015 is
2015
a preliminary result and has not been finalized. For more details, see Appendix B.
is a preliminary result and has not been finalized. For more details, see Appendix B.
In addition, according to the summary of transport future for New Zealand report [73], the number
In addition, according to the summary of transport future for New Zealand report [73], the
of walking trips has been forecasted to increase rapidly by 25% and almost 50% in Auckland to 2042/2043,
number of walking trips has been forecasted to increase rapidly by 25% and almost 50% in Auckland
despite a gradual reduced trip per capita. The future opportunities and choices are projected to shift to
to 2042/2043, despite a gradual reduced trip per capita. The future opportunities and choices are
public transport and active modes, in particular, the urban cores where there will be major improvements
projected to shift to public transport and active modes, in particular, the urban cores where there will
in public transport and facilities for walking and cycling. Pedestrian crash quantity, therefore will
be major improvements in public transport and facilities for walking and cycling. Pedestrian crash
likely to increase because of the overall increased exposure.
quantity, therefore will likely to increase because of the overall increased exposure.
6.2. Locations and Times of the Day
6.2. Locations and Times of the Day
Pedestrian crashes in urban areas are much higher than rural zones due to intense interactions
Pedestrian crashes in urban areas are much higher than rural zones due to intense interactions
between vehicles and pedestrians in urban cores. Of all 5139 pedestrian crashes (CAS, 2012–2016),
between vehicles and pedestrians in urban cores. Of all 5139 pedestrian crashes (CAS, 2012–2016),
almost 42% occurred on major urban roads, whilst 40% was on minor urban roads. When filtering the
almost 42% occurred on major urban roads, whilst 40% was on minor urban roads. When filtering
total number of pedestrian crashes to pedestrian crashes at road crossings, 89% occurred at uncontrolled
the total number of pedestrian crashes to pedestrian crashes at road crossings, 89% occurred at
sites (Figure 8). Uncontrolled crossings are facilities where provisions are made for cyclists and/or
uncontrolled sites (Figure 8). Uncontrolled crossings are facilities where provisions are made for
pedestrians to cross the road and priority is not given through the use of signals. The range of facilities
cyclists and/or pedestrians to cross the road and priority is not given through the use of signals. The
includes kerb extensions, median refuges, raised platforms, kea crossings, and zebra crossings [74].
range of facilities includes kerb extensions, median refuges, raised platforms, kea crossings, and zebra
The reports also show that most pedestrian crashes occur during peak hour between 14:00 and 18:00
crossings [74]. The reports also show that most pedestrian crashes occur during peak hour between
and morning peak from 8:00 to 9:00. Fatal crashes are about three times higher at evening peak than
14:00 and 18:00 and morning peak from 8:00 to 9:00. Fatal crashes are about three times higher at
during the night. This may primarily because there are more cars and more pedestrians’ movements
evening peak than during the night. This may primarily because there are more cars and more
on the road than any other times.
pedestrians’ movements on the road than any other times.
6.3. Contributing Factors
The exposure of conflict between pedestrians and vehicles is known to be more frequent at road
crossings and consequently creates a higher risk of crash involvement, particularly in urban areas.(876 crashes) of the total. Drivers did not see or look for another party comprised 12%, whilst alcohol
or drugs from both pedestrians and drivers accounted for a further 6%. In rural areas, pedestrians
wearing dark clothes (failed to notice category) and alcohol-impaired non-drivers were the leading
causes of pedestrian fatality and serious injury. It is possible that poor visibility and higher operating
speeds on 2019,
Sustainability rural11,roads
5274 may affect drivers’ ability to see, perceive, react and brake appropriately and
14 of 27
therefore impact speeds and consequently, injury severity is greater.
Pedestrian crossing in prohibited places
Pedestrian crossing in prohibited without marking passing lines, 2%
Sustainabilityplaces
2019,without
11, x FOR PEER
marking, REVIEW
16% 13 of 26
Pedestrian crossing in prohibited
places at painted island, 8%
Figure 9 shows that crossing the road was the leading factor in pedestrian FSi accounting for 28%
(876 crashes) of the total. Drivers did not see or look for another party comprised
89%
12%, whilst alcohol
or drugs from both pedestrians and drivers accounted for a further 6%.atIn rural
Uncontrolledareas, pedestrians
crossing sites
Pedestrian Crossing ,
wearing dark clothes (failed to notice category)5%and alcohol-impaired non-drivers were the leading
causes of pedestrian fatality and serious injury. It is possible that poor visibility and higher operating
speeds on rural roads may affect drivers’ ability to see, perceive, react and brake appropriately and
11% at Signalized crossing
therefore impact speeds and consequently, injury severity is greater.
Pedestrian crossing in prohibited
places without marking at centre line, Pedestrian crossing in prohibited
56% places atcrossing
Pedestrian raised island, 11% places
in prohibited
Pedestrian crossing in prohibited without marking passing lines, 2%
places without marking, 16% Figure 8.New Zealand
Zealand pedestrian
pedestrian crash
crash locations.
locations.
Figure 8. New Pedestrian crossing in prohibited
places at painted island, 8%
6.3. Contributing Factors
Pedestrian crossing road
The exposure of conflict between pedestrians and vehicles is known 89%to be more frequent at road
crossings and consequently
2% 2% creates a higher Pedestrian risk of Crossing
Miscellaneouscrash involvement,
, particularly
at Uncontrolled in sites
crossing urban areas.
Figure 9 shows that 3% crossing the road was the 5% leading factor in pedestrian FSi accounting for 28%
(876 crashes) of the total. Drivers did not see or Driver
lookdid fornot see or party
another look for another party
comprised 12%,until
whilst alcohol
4% too late
or drugs from both 4% pedestrians and drivers accounted for a further 6%.
11% at Signalized crossingpedestrians
In rural areas,
28% Alcohol or drugs (pedestrian or driver)
wearing dark clothes
Pedestrian 4% in(failed
crossing to notice category) and alcohol-impaired non-drivers were the leading
prohibited
Pedestrian crossing in prohibited
causes places without marking at centre line,
of pedestrian6% fatality and serious injury.
places
It is possible
at raised
that poor visibility and higher operating
island, 11%diverted
56% Driver attention
speeds on rural roads may affect drivers’ ability to see, perceive, react and brake appropriately and
therefore impact speeds 12% and Figure 8. New Zealand
consequently, injury pedestrian
Driver severity
failed to crash
is locations.
greater.
give way
14%
Entering or
Pedestrian leavingroad
crossing land use
2% 2% Miscellaneous
3%
Figure 9. The leading causes of pedestrian fatality and serious injury in New Zealand. Note: Details
of each category is shown in Appendix A. Driver did not see or look for another party until
4% too late
4% 28%
6.4. Victims’ Characteristics Alcohol or drugs (pedestrian or driver)
4%
The number 6% of pedestrian deaths and injuries per million
Driver attention h walking across different age groups
diverted
(see Appendix B. Data and analysis of the number of pedestrian deaths and injuries rate) (as shown
12%
in Figure 10) illustrates that Driver failed to give way
14%the over-75 group is the most vulnerable. This group spent less time
walking than other groups, but their fatal and serious injury (FSi) rate was the highest. The evidence is
Entering or leaving land use
consistent with a previous study [75], implying the failure of the elderly in being able to either see and
perceive risk and taking an appropriate counteraction movement may result in a higher risk of
Figure 9. The leading causes of pedestrian fatality and serious injury in New Zealand. Note: Details of
collisions. The risk of road crashes in adults aged 25–34 years was also higher than others, and this is
each category
Figure is shown
9. The leading in Appendix
causes A. fatality and serious injury in New Zealand. Note: Details
of pedestrian
most likely due to higher risk-taking actions. In contrast, there was a significant drop in the crash risk
6.4. of each category
Victims’ is shown in Appendix A.
Characteristics
among children aged 10–14 years-old in New Zealand compared to previous studies [75,76]. This could
result from
The the implementation
number of pedestrian of road and
deaths safety education
injuries policies,hwhere
per million children
walking acrossare trainedage
different to begroups
aware
6.4. Victims’ Characteristics
of the safe road crossing, using walkways and safe practices in and around vehicles [77,78].
(see Appendix B. Data and analysis of the number of pedestrian deaths and injuries rate) (as shown
The number of pedestrian deaths and injuries per million h walking across different age groups
in Figure 10) illustrates that the over-75 group is the most vulnerable. This group spent less time
(see Appendix B. Data and analysis of the number of pedestrian deaths and injuries rate) (as shown
walking than other groups, but their fatal and serious injury (FSi) rate was the highest. The evidence is
in Figure 10) illustrates that the over-75 group is the most vulnerable. This group spent less time
consistent with a previous study [75], implying the failure of the elderly in being able to either see
walking than other groups, but their fatal and serious injury (FSi) rate was the highest. The evidence is
and perceive risk and taking an appropriate counteraction movement may result in a higher risk of
consistent with a previous study [75], implying the failure of the elderly in being able to either see and
collisions. The risk of road crashes in adults aged 25–34 years was also higher than others, and this
perceive risk and taking an appropriate counteraction movement may result in a higher risk of
is most likely due to higher risk-taking actions. In contrast, there was a significant drop in the crash
collisions. The risk of road crashes in adults aged 25–34 years was also higher than others, and this is
risk among children aged 10–14 years-old in New Zealand compared to previous studies [75,76]. This
most likely due to higher risk-taking actions. In contrast, there was a significant drop in the crash risk
among children aged 10–14 years-old in New Zealand compared to previous studies [75,76]. This could
result from the implementation of road safety education policies, where children are trained to be aware
of the safe road crossing, using walkways and safe practices in and around vehicles [77,78].Sustainability 2019, 11, x FOR PEER REVIEW 14 of 26
Sustainability 2019, 11, 5274 15 of 27
Comparing between genders (Figure 11), males represented a higher FSi per million h walked than
females from
Sustainability all11,age
2019, groups.
x FOR Males aged 25–44 were exposed to a crash risk 2.7× higher than for women
PEER REVIEW 14 of 26
could
of the result
same age.fromHowever,
the implementation
there was lessof difference
road safetyineducation policies, genders
crash risk between where children are age
among the trained
of 0–to
14 aware
be and the ofover
the 65.
safe This
roadmay relate
crossing, to the
using similarity
walkways of time
and spent
safe walking
practices inwithin
and these
around groups.
vehicles
Comparing between genders (Figure 11), males represented a higher FSi per million h walked than [77,78].
females from all age groups. Males aged 25–44 were exposed to a crash risk 2.7× higher than for women
Number ofin
of the same age. However, there was less difference FSicrash
per year
riskrecorded
betweeningenders
road crashes
among the age of 0–
14 and the over 65. This may relate to the similarity of time
FSi per million spenthours
walking walking within these groups.
6.5
60 7.0
Million walking hour per year
Fsi / yearof Fsi / year
/ yearhour / year
50 Number of FSi per year recorded in road crashes 6.0
FSi per million walking hours 6.5 5.0
60
40 7.0
Million walking hour per year
3.6
of number
3.4 4.0
walking
50 3.2 3.2 3.2 6.0
30 2.7 2.7
Millionhour
2.3 2.4 2.2 3.0
5.0
40
20
Average
3.6 2.4 2.5 2.0
Average number
1.3 3.4 4.0
Million walking
2.2 1.2 3.2 3.2 2.2 3.2
30
10 2.7 2.7
2.3 2.4 1.0
3.0
2.2
200 2.5 0.0
1.3 2.4 2.0
2.2 1.2 2.2
10 Age1.0group
0
Figure 0.0
10. Pedestrian fatal and serious injury (FSi) per million walking hours by different age groups.
Figure 10. Pedestrian fatal and serious injury (FSi) per million walking hours by different age
groups. Age group
Comparing between genders (Figure 11), males represented a higher FSi per million h walked
than females from all age groups. Males aged 25–44 were exposed to a crash risk 2.7× higher than for
women Figure 10. Pedestrian
of the same fatal andthere
age. However, serious injury
was less(FSi) per million
difference walking
in crash riskhours by different
between gendersageamong the
year per year
year pre year
100% groups. 25
age of 0–14 and the over 65. This may relate to the similarity of time spent walking within these groups.
80% 20
hours perhours
crashes
100% 25
60% 15
of crashesofpre
Million hwalking
80% 20
40% 10
Proportion
5.3 5.0 4.6
60% 3.5 3.3 15
20% 3.1 2.4 5
1.9
Million hwalking
1.8
40% 4.4 10
1.3 1.9 1.8 1.7
Proportion
0% 0.9 2.1 5.3 1.6 2.2 0
5.0 4.6
0-4 5-14 15-24
3.1 25-34 35-44 3.5
45-54 55-64
3.3 65-74 75+
20% 1.8 1.9 2.4 5
FSi crashes per year recorded in road crashes (Male) 4.4
0% 0.9 1.3 1.9 1.8 1.7 crashes
1.6 (Female)
2.2 0
FSi
2.1crashes per year recorded in road
0-4 5-14 15-24 walking
Million 25-34 hours35-44
per year45-54
(Female) 55-64 65-74 75+
FSi per million walking hours (Female)
FSi crashes
Million per year
walking recorded
hours in (Male)
per year road crashes (Male)
FSi
FSicrashes per year
per million recorded
walking hoursin(Male)
road crashes (Female)
Million walking hours per year (Female)
FSi per million walking hours (Female)
Figure 11. Pedestrian FSi walking
Million per million working
hours hours
per year by age groups and genders.
(Male)
FSi per million walking hours (Male)
6.5. Road Users’ Behaviour
Figure 11. Pedestrian FSi per million working hours by age groups and genders.
AnalysisFigure 11. Pedestrian
of pedestrian crashFSirecords
per million
(CASworking hours by
2012–2016) age groups
from and genders.
NZ police reports suggests that
6.5. Roadinvolved
factors Users’ Behaviour
in pedestrian crashes primarily involve people making unsafe choices such as a
6.5. Road decision
drivers’ Users’ Behaviour
to go/not crash
to gorecords
or pedestrians decidingfrom
when and where to cross the road. The
Analysis of pedestrian (CAS 2012–2016) NZ police reports suggests that factors
reported evidence
Analysis of from
pedestrianCAS indicates
crash that
records 89%
(CAS of all reported
2012–2016) fromfactors
NZ relate
police to
involved in pedestrian crashes primarily involve people making unsafe choices such as a drivers’ road
reports user behaviour
suggests that
on pedestrian related
factors crashes were likelyprimarily
(>50%) asinvolve
opposedpeople
to vehicle drivers be related to pedestrian
decisioninvolved
to go/notin topedestrian crashes
go or pedestrians deciding when and wheremaking unsafe
to cross choices
the road. such
The as a
reported
behaviours.
drivers’ This to
decision must be considered
go/not to go or in relation to
pedestrians crashes when
deciding being and
multi-factored
where to events
cross theand thatThe
road. it is
evidence from CAS indicates that 89% of all reported factors relate to road user behaviour on pedestrian
commonly
reported reported
evidence thatCAS
from almost every crash
indicates that (>90%)
89% of hasreported
all human-related
factors factorstoinroad
relate the crash
user occurring.
behaviour
related crashes were likely (>50%) as opposed to vehicle drivers be related to pedestrian behaviours.
on pedestrian related crashes were likely (>50%) as opposed to vehicle drivers be related to pedestrian
behaviours. This must be considered in relation to crashes being multi-factored events and that it is
commonly reported that almost every crash (>90%) has human-related factors in the crash occurring.You can also read