Documentation of a New Zealand blue whale population based on multiple lines of evidence
←
→
Page content transcription
If your browser does not render page correctly, please read the page content below
Vol. 36: 27–40, 2018              ENDANGERED SPECIES RESEARCH
                                                                                                    Published May 17
 https://doi.org/10.3354/esr00891              Endang Species Res

                                                                                                   OPEN
                                                                                                   ACCESS

         Documentation of a New Zealand blue whale
        population based on multiple lines of evidence
          Dawn R. Barlow1, Leigh G. Torres1,*, Kristin B. Hodge2, Debbie Steel1,
        C. Scott Baker 1, 3, Todd E. Chandler1, Nadine Bott 4, Rochelle Constantine3,
        Michael C. Double5, Peter Gill6, Debra Glasgow7, Rebecca M. Hamner 1, 8,
            Callum Lilley 4, Mike Ogle4, Paula A. Olson5, 9, Catherine Peters10,
           Karen A. Stockin10, Christopher T. Tessaglia-Hymes2, Holger Klinck2
    1
     Marine Mammal Institute, Department of Fisheries and Wildlife, Oregon State University, Newport, OR 97365, USA
          2
           Bioacoustics Research Program, Cornell Lab of Ornithology, Cornell University, Ithaca, NY 14850, USA
                   3
                    School of Biological Sciences, University of Auckland, Auckland 1142, New Zealand
                         4
                          New Zealand Department of Conservation, Wellington 6143, New Zealand
             5
              Australian Marine Mammal Centre, Australian Antarctic Division, Kingston, TAS 7050, Australia
                                   6
                                    Blue Whale Study, Narrawong, VIC 3285, Australia
                                       7
                                        PO Box 98, Paekakariki 5034, New Zealand
        8
         Department of Life Sciences, Texas A&M University − Corpus Christi, Corpus Christi, TX 78412-5802, USA
                        9
                         Southwest Fisheries Science Center NMFS/NOAA, La Jolla, CA 92037, USA
     10
       Coastal-Marine Research Group, Institute of Natural and Mathematical Sciences, Massey University, Auckland 0745,
                                                        New Zealand

        ABSTRACT: Species conservation depends on robust population assessment. Data on population
        abundance, distribution, and connectivity are critical for effective management, especially as base-
        line information for newly documented populations. We describe a pygmy blue whale Balaen-
        optera musculus brevicauda population in New Zealand waters with year-round presence that
        overlaps with industrial activities. This population was investigated using a multidisciplinary
        approach, including analysis of survey data, sighting records, acoustic data, identification photo-
        graphs, and genetic samples. Blue whales were reported during every month of the year in the
        New Zealand Exclusive Economic Zone, with reports concentrated in the South Taranaki Bight
        (STB) region, where foraging behavior was frequently observed. Five hydrophones in the STB
        recorded the New Zealand blue whale call type on 99.7% of recording days (January to December
        2016). A total of 151 individuals were photo-identified between 2004 and 2017. Nine individuals
        were resighted across multiple years. No matches were made to individuals identified in Aus-
        tralian or Antarctic waters. Mitochondrial DNA haplotype frequencies differed significantly be-
        tween New Zealand (n = 53 individuals) and all other Southern Hemisphere blue whale popula-
        tions, and haplotype diversity was significantly lower than all other populations. These results
        suggest a high degree of isolation of this New Zealand population. Using a closed capture-
        recapture population model, our conservative abundance estimate of blue whales in New Zealand
        is 718 (SD = 433, 95% CI = 279−1926). Our results fill critical knowledge gaps to improve manage-
        ment of blue whale populations in New Zealand and surrounding regions.

        KEY WORDS: Blue whale · New Zealand · Photo-identification · Abundance · Acoustics · Genetics ·
        Population connectivity · Conservation

                                                                © The authors 2018. Open Access under Creative Commons by
*Corresponding author: leigh.torres@oregonstate.edu             Attribution Licence. Use, distribution and reproduction are un-
                                                                restricted. Authors and original publication must be credited.
                                                                Publisher: Inter-Research · www.int-res.com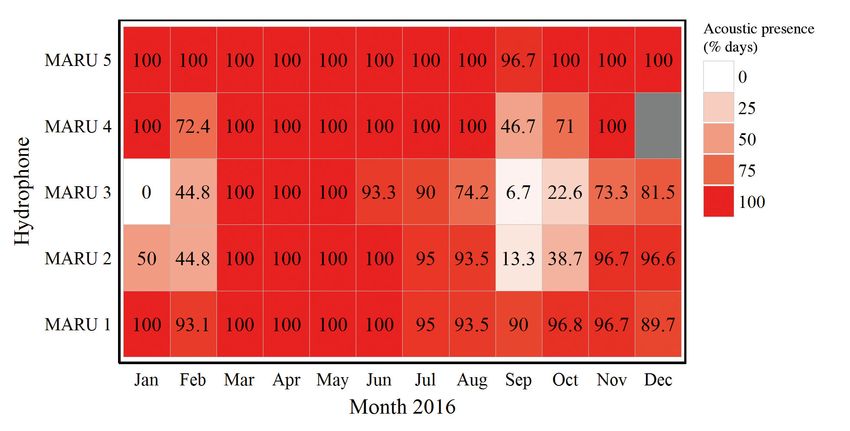
28                                        Endang Species Res 36: 27–40, 2018

                  INTRODUCTION                               1999, Attard et al. 2015). Baseline data on population
                                                             abundance, distribution patterns, and connectivity
   Efficacy of species conservation efforts is contin-       are fundamental to assess and mitigate impacts from
gent upon robust knowledge of population status.             industrial activity and longer-term environmental
Without information on the spatial and temporal dis-         shifts.
tribution, residency patterns, connectivity, and abun-          Blue whales (B. m. brevicauda and B. m. interme-
dance of populations, conservation efforts will be           dia) in New Zealand are currently listed as ‘migrant’
ineffective. When new species and populations are            species under the national threat classification sys-
first described, it is critical that data on these funda-    tem (Baker et al. 2016). Yet, Torres (2013) hypothe-
mental population parameters are collected to pro-           sized that the South Taranaki Bight (STB) region of
mote ecological understanding, as well as timely and         New Zealand is an important foraging ground for
effective management plans.                                  blue whales (see Fig. 1) based on (1) opportunistic
   Blue whales Balaenoptera musculus were severely           blue whale sightings in the STB recorded during
exploited by the commercial whaling industry (Clap-          seismic surveys, (2) observations of blue whales in
ham et al. 1999, Branch et al. 2007, Torres 2013). For       the STB from Soviet and Japanese whaling records,
example, model estimates indicate that Antarctic             (3) stranding records of blue whales around New
blue whale B. m. intermedia populations were re-             Zealand, and (4) oceanographic studies in the STB
duced to less than 1% of their original population           documenting regional upwelling events that cause
size by commercial whaling (Branch et al. 2004). As a        high productivity (Shirtcliffe et al. 1990) and lead to
result of such broad scale exploitation, blue whale          large aggregations of krill Nyctiphanes australis, a
populations around the world typically remain di-            known blue whale prey item in the Australasian
minished and are poorly understood. While blue               region (Gill 2002). However, a dedicated study of
whales are no longer hunted, such reduced popula-            blue whales in New Zealand had not been conduc-
tion sizes can increase their vulnerability to threats       ted. As it is difficult to distinguish between the Ant-
from modern anthropogenic activities.                        arctic and pygmy blue whale subspecies based on
   Three subspecies of blue whales are currently rec-        morphology alone, and the distinction is rarely made
ognized in the Southern Hemisphere: Antarctic B. m.          in sighting and stranding records, Torres (2013) used
intermedia, pygmy B. m. brevicauda, and Chilean              ‘blue whale’ to refer to both subspecies and recom-
blue whales (recognized as a subspecies by the Soci-         mended that future work identify the subspecies of
ety for Marine Mammalogy Committee on Taxon-                 blue whale occupying the STB region.
omy, but not yet named; Committee on Taxonomy                   The potential use of the STB region by blue whales
2017, Galletti Vernazzani et al. 2017). The pygmy            is of management concern as the area sustains New
blue whales found in the Indian Ocean and off Aus-           Zealand’s highest concentration of marine industrial
tralia appear to have diverged from Antarctic blue           activity. The oil and gas industry has a strong pres-
whales around the last glacial maximum and are               ence in the region, with active extraction platforms
genetically, acoustically, and morphologically dis-          and ongoing seismic survey efforts to explore for
tinct from Antarctic and Chilean blue whales (Branch         more oil and gas reserves and new drilling locations
et al. 2007, LeDuc et al. 2007, Miller et al. 2014,          (Torres 2013). Vessel traffic frequents the STB, with
Attard et al. 2015). Under the International Union for       multiple major ports in the region and the neighbor-
Conservation of Nature (IUCN) Red List of Threat-            ing major shipping channel in the Cook Strait (Raw-
ened Species, Antarctic blue whales are classified as        son & Riding 2015). The recent approval of the coun-
‘Critically Endangered’ (Reilly et al. 2008), and            try’s first seabed mine in the STB, slated to extract
pygmy blue whales are listed as ‘Data Deficient’             50 million tons of iron sands per year for a 35 yr period,
(Cetacean Specialist Group 1996).                            will likely mean increased anthropogenic pressure
   The International Whaling Commission (IWC) has            on blue whale habitat in the future (Environmental
recognized the significant data gaps regarding               Protection Authority 2017). Due to pressure from the
pygmy blue whale populations by highlighting                 commercial whaling industry, all blue whale popula-
pygmy blue whale population assessment as a ‘top             tions are likely already depleted (Branch et al. 2007,
priority’, with an emphasis on estimating the abun-          Torres 2013), and may therefore be especially vulner-
dance of populations in New Zealand, Indonesia,              able to modern threats from the aforementioned
Australia, and the Southeast Pacific (IWC 2017a).            anthropogenic sources.
Currently, no reliable abundance estimates exist for            In this study, we apply a multidisciplinary ap-
pygmy blue whales in any region (Clapham et al.              proach to describe a New Zealand blue whale popu-
Barlow et al.: Documentation of New Zealand blue whale population                          29

lation, including dedicated surveys, acoustic moni-        dorsal fin shape (Sears et al. 1990). Unmanned aerial
toring, genetic assessment, distribution analysis, and     system (UAS) flights were also conducted, which
photo-identification. Our objectives are to (1) de-        allowed for non-disturbing, closer approach and the
scribe spatial and temporal patterns of blue whale         additional aerial perspective to enhance our observa-
presence within New Zealand waters, (2) quantify           tional power for establishing behavior state. Based
patterns of individual resighting events in New            on surface observations, behavior states were classi-
Zealand and within the STB region, (3) genetically         fied as travel, forage, social, rest, or unknown. Travel
identify the subspecies of New Zealand blue whales         was defined as directional movement and regular
and describe connectivity to other southern hemi-          surfacing. Indications of foraging included surface
sphere blue whale populations, and (4) estimate the        lunges and staying in one area for a prolonged period
abundance of blue whales in the STB region and in          with irregular surfacings or fluke-out dives. Social
New Zealand. This baseline population assessment           behaviors included mother−calf nursing, prolonged
of New Zealand blue whales will contribute to the          coordinated surfacing such as racing, and tactile con-
revision of their national threat classification status    tact between individuals. Resting behavior consisted
and enable informed management decisions for miti-         of logging near the surface with minimal forward
gating impacts from industrial activity.                   movement. All behaviors that did not fit within these
                                                           classifications were considered unknown. These data
                                                           describe blue whale behavior patterns in the STB,
           MATERIALS AND METHODS                           but are not necessarily indicative of a behavioral
                                                           budget.
                    Data sources

                Dedicated fieldwork

   Vessel-based surveys for blue whales were con-
ducted in the STB region (Fig. 1) in January and Feb-
ruary of 2014, 2016, and 2017. A 14 m jet-propelled
catamaran equipped with a flying bridge (height
~4 m) for observational work was used as the re-
search platform for the 2014 and 2016 field seasons.
In 2017, the research platform was a 19.2 m vessel out-
fitted with a comparable flying bridge and equipped
with a secondary small rigid-hull inflatable boat for
closer approach to the whales. Prior to each survey
day, daily images of remotely sensed sea surface
temperature and chlorophyll a concentration were
assessed to locate areas of upwelled water and high
surface productivity; survey tracklines were not stan-
dardized, but rather directed toward productive or
previously unsurveyed areas.
   Survey effort was conducted at vessel speeds of 8
to 12 knots in suitable weather conditions (Beaufort
Sea State < 5). During the surveys, one observer was
posted on the port and another on the starboard sides
of the flying bridge, and additional observers sur-
veyed the entire area. At all whale sightings, survey
effort was stopped, and the date, time, and location
were recorded. The animal(s) were then approached
for photo-identification (photo-ID) effort with concur-
rent behavioral observation. Photographs of the left       Fig. 1. New Zealand, indicating the location of the South
                                                           Taranaki Bight (STB) region (marine area within the red cir-
and right sides of each blue whale were captured
                                                           cle). Locations of the 5 marine autonomous recording units
whenever possible for identification of individuals        (MARUs) deployed in the STB region to assess blue whale
based on unique body pigmentation patterns and                      vocalization patterns are shown in the inset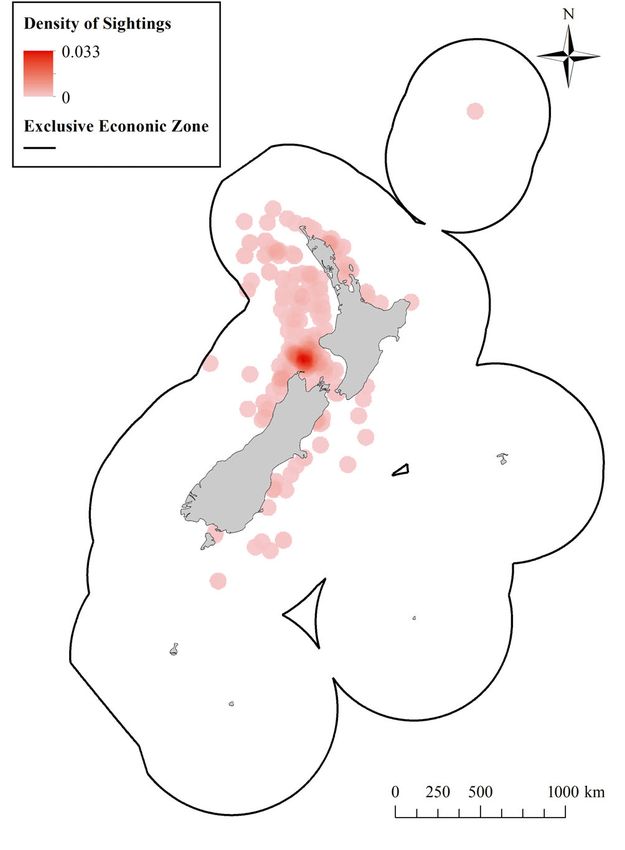
30                                      Endang Species Res 36: 27–40, 2018

   Once photo-ID effort was complete, tissue biopsy        (see Table S2 in Supplement 1), including contribu-
sampling effort was initiated. Skin and blubber            tions from within the New Zealand EEZ (15 sources),
biopsy samples were collected using a lightweight          from Australian waters (3 sources), and from Antarctic
biopsy dart (cutting head size 7 × 19 mm) fired from a     waters (1 source).
Paxarms biopsy rifle (Krutzen et al. 2002). A fine-
mesh (300 µm) dip net attached to a long pole was
used to collect opportunistic fecal samples from sur-                        Analytical methods
face waters. Biopsy and fecal samples were stored in
sterile containers and frozen at −20°C until genetic                 Distribution of reported sightings
analysis.
   To assess the spatio-temporal patterns of blue             All reported blue whale sightings (from dedicated
whale vocalizations in the STB region, marine auto-        surveys and opportunistic sources) were compiled to
nomous recording units (MARUs) (Calupca et al.             assess their spatial and temporal distribution in New
2000) were deployed at 5 sites (Fig. 1). Each MARU         Zealand. The total number of blue whale sighting re-
hydrophone had a flat frequency response (± 2.0 dB)        ports in each month of the year was tabulated within
in the 15 to 585 Hz band and recorded continuous           the STB region and within the New Zealand EEZ.
acoustic data at a 2 kHz sampling rate with a high-        Given the non-systematic data collection, this synthe-
pass filter at 10 Hz and a low-pass filter at 800 Hz.      sis describes the temporal pattern of sighting reports,
Acoustic data were collected from 23 January to 30         not necessarily the temporal distribution of blue whales.
June 2016, and 11 July to 29 December 2016 (MARU              To assess the spatial distribution of sighting re-
refurbishment occurred during the brief interim            ports, all sighting locations within the New Zealand
period). While a New Zealand blue whale call type          EEZ were plotted in ArcMap 10.4.1 (ESRI 2016) and
has previously been documented and described (Mc-          converted to a point density map using a search
Donald 2006), the source level is unknown. The esti-       radius of 50 km. The resulting map is an assessment
mated source level for pygmy blue whale song in the        of available sighting reports, not a complete depic-
eastern Indian Ocean is 179 ± 2 dB re 1 µPa at 1 m         tion of the spatial distribution of blue whales in the
(Gavrilov et al. 2011), and the estimated maximum          New Zealand EEZ.
acoustic detection range is 50 to 200 km (Gavrilov &
McCauley 2013), depending on the recorder capabil-
ities, ambient noise levels, and sound propagation                                Acoustics
conditions. We expect that the detection range of our
hydrophones is comparable with that found by                  Acoustic data were examined for the occurrence of
Gavrilov & McCauley (2013); thus, all acoustic detec-      blue whale song (McDonald et al. 2006) using Raven
tions of blue whales were from within the New              Pro 1.5 (Cornell Lab of Ornithology, Ithaca, USA).
Zealand Exclusive Economic Zone (EEZ).                     While blue whales produce several different vocal-
                                                           izations, song is understood to be produced only by
                                                           males and likely serves a reproductive function,
             Opportunistic data sources                    although the year-round occurrence of blue whale
                                                           song may suggest a broader function of the call than
  Opportunistic blue whale photographs and sight-          exclusively reproduction (Oleson et al. 2007). Other
ings were compiled for analysis. Data sources include      blue whale vocalizations, including D-calls, were not
incidental blue whale sightings confirmed, collated,       analyzed. Data were visually reviewed in consecu-
and administered by the New Zealand Department of          tive 15 min spectrograms, with a 10 to 250 Hz fre-
Conservation; reports from marine mammal observers         quency bandwidth (512 point Hann window; 50%
during seismic surveys; opportunistic sightings re-        overlap). Each recording day was manually reviewed
ported during surveys for other marine mammals, and        in its entirety by an experienced analyst, and the
sightings from whale watch vessels (see Table S1 in        daily acoustic presence of the New Zealand blue
Supplement 1 at www.int-res.com/articles/suppl/n036        whale call type was annotated for each MARU re-
p027_supp/). The blue whale sub-species of these           cording site. Percent monthly presence for each site
sightings are unknown. Replicate reported sightings        was normalized for recording effort by dividing the
were identified and removed from the dataset prior to      number of days containing the New Zealand blue
analysis. Photographs of blue whales suitable for indi-    whale call type by the number of recording days ana-
vidual identification were provided from 19 sources        lyzed within the month.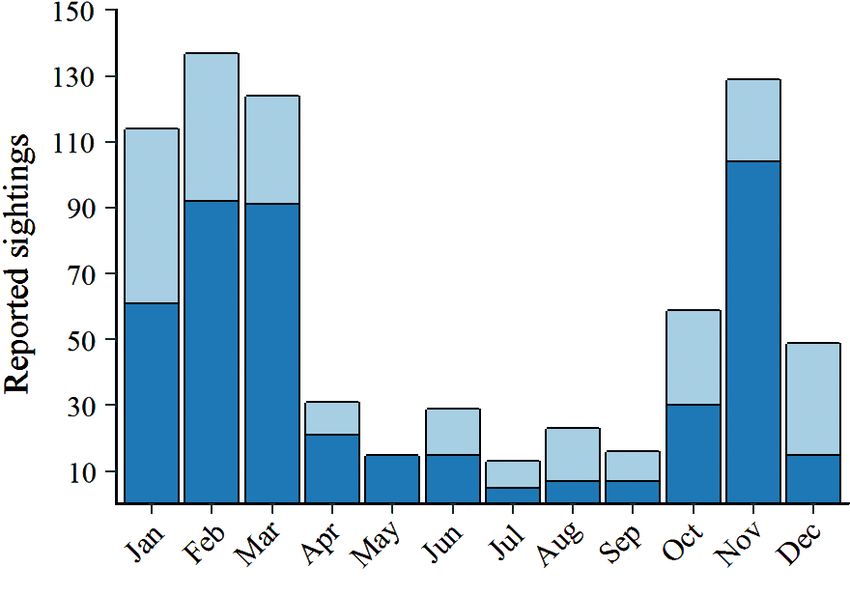
Barlow et al.: Documentation of New Zealand blue whale population                       31

                 Photo-identification                      ferred to a 2 ml tube and frozen in 800 µl of Long-
                                                           mire’s buffer (Longmire et al. 1997) until extraction.
   Photographs of blue whales from dedicated sur-          Total genomic DNA was extracted from the filtered
veys in the STB region were reviewed and grouped           samples using the phenol/chloroform method de-
by individual within each sighting event, and indi-        scribed above for skin samples with an extended
viduals were then compared between events. Using           mixing period during the first phenol:chloroform:
standard methods (Sears et al. 1990), individuals          isoamyl alcohol step to ensure the filter had com-
were identified using unique body pigmentation pat-        pletely dissolved. Initial attempts to amplify DNA
terns and dorsal fin shape. Photograph quality was         from some fecal samples failed, suggesting the pres-
assigned a rating on a scale of 1 to 5 (with 1 repre-      ence of PCR inhibitors. Affected DNA was cleaned
senting the lowest quality and 5 the highest), based       with a OneStepTM PCR inhibitor removal kit (Zymo
on the angle of the photographer to the whale,             Research). In some cases, 2 applications were neces-
amount of the whale that was visible in the photo-         sary to remove all inhibitors.
graph, sharpness of the image, and glare from the             A standard DNA profile, including molecular sex,
sun. Photographs of quality 1 and 2 were discarded to      amplification and sequencing of 410 bp of the mito-
minimize error in identifying individuals. Using the       chondrial DNA (mtDNA) control region, and micro-
individuals identified from the dedicated surveys, a       satellite genotyping of up to 15 loci, was generated
discovery curve was generated by plotting the cumu-        for all samples following methods described by
lative number of identified individuals versus the         Sremba et al. (2012). An additional 2 microsatellite
cumulative number of days of survey effort. It should      loci, DlrFCB17 and GATA98, were genotyped follow-
be noted that, while for most individuals both sides of    ing methods described by LeDuc et al. (2007). Con-
the whale were photographed, for some only left-side       trol region sequences were visualized and manually
or right-side photographs were obtained. Therefore,        reviewed using the program Sequencher v4.6 (Gene
it is possible that some individual whales were counted    Codes Corporation). Individual haplotypes were
twice; this can only be reconciled with further data       aligned with previously published blue whale haplo-
collection in future work.                                 types (LeDuc et al. 2007, Sremba et al. 2012, Torres-
   Subsequently, images of the whales identified dur-      Florez et al. 2014, Attard et al. 2015) downloaded
ing the dedicated surveys within the STB region            from GenBank. Microsatellite alleles were analyzed
were compared to the 19 other sources of opportunis-       using Genemapper v4.0 (Applied Biosystems), and
tically collected photo-ID data (see Table S2). Indi-      peaks were visually inspected. Samples that ampli-
viduals resighted in multiple years were examined in       fied at less than 12 loci were considered to be poor
greater detail, and the sighting locations of resighted    quality and were removed from the dataset.
animals were plotted in ArcMap 10.4.1.                        Replicate samples of individual whales were identi-
                                                           fied using CERVUS v3.0.3 (Kalinowski et al. 2007) and
                                                           probability of identity (PID) was calculated for pairs of
                      Genetics                             samples showing exact matches. Mismatches of up to
                                                           3 loci were allowed to prevent false exclusion due to
   Biopsy and fecal samples collected in the STB dur-      allelic dropout and other genotyping errors (Waits et
ing 2014, 2016, and 2017 were analyzed along with          al. 2001). Electropherograms from mismatching loci
tissue samples held at the New Zealand Cetacean            were reviewed and corrected or repeated.
Tissue Archive (NZCeTA) at the University of Auck-            An exact binomial test implemented in Program R
land. The NZCeTA included samples previously col-          version 3.4.0 (R Core Team 2017) was used to test
lected from beachcast blue whales (see Fig. 2 from         whether the sex ratio of males to females differed
Torres 2013, Table S2 for details) and biopsy samples      from 1:1, after removing replicate samples. Arlequin
of 3 live individuals: 1 from the Hauraki Gulf (2006)      v3.5.1.2 (Excoffier & Lischer 2010) was used to calcu-
and 2 from the Cook Strait (2011 and 2013) (Fig. 1).       late haplotype diversity and to test for mtDNA haplo-
Total genomic DNA was extracted from skin tissue           type differentiation between (1) STB and NZCeTA
following standard proteinase K digestion and phe-         samples, and (2) pairwise between the combined
nol/chloroform methods (Sambrook et al. 1989),             New Zealand samples and 3 other populations: Ant-
modified for small samples (Baker et al. 1994). Fecal      arctic blue whales in the Southern Ocean (n = 183,
samples were first filtered through a 0.4 µm cyclo-        Sremba et al. 2012), Chilean blue whales in the
pore polycarbonate track etched membrane filter            Southeast Pacific including the Chilean coast (n =
(GE Healthcare Life Sciences). The filter was trans-       113, Torres-Florez et al. 2014), and pygmy blue
32 Endang Species Res 36: 27–40, 2018
whales from the south and west coasts of Australia An abundance estimate for blue whales in New
(n = 89, Attard et al. 2015) that included sequences Zealand was generated using the 3 survey years as 3
previously published by LeDuc et al. (2007). The sig- separate capture periods (see Table 3). For this esti-
nificance of differences in haplotype diversity be- mate, we also used a Bayesian Markov chain Monte
tween the New Zealand dataset and the other blue Carlo closed-population model in multimark. A com-
whale populations was tested using a permutation plete lack of information on population parameters
procedure implemented in Program R, Genetic_ such as immigration and emigration rates as well as
diversity_diffs v1.0.4 (Alexander et al. 2016). Analy- the inability for multimark to compute abundance
sis of molecular variance (AMOVA) implemented in estimates for open populations incorporating multi-
Arlequin was used to estimate mtDNA differentiation ple mark types inhibited the application of an open-
of the New Zealand blue whales from the other pop- population abundance model. We provide this closed-
ulations, using both FST based on haplotype diversity population model abundance estimate for New Zea-
and ΦST based on nucleotide diversity. land blue whales as a conservative estimate, and fur-
ther justification of this approach is provided in the
‘Discussion’. The same detection probability parame-
Abundance estimates ters were assumed as for the within-year estimates
with the addition of an ‘effort’ covariate, which ac-
The 3 years of survey effort were used to generate a counted for the difference in survey length between
within-year capture-recapture abundance estimate the 3 capture events. Survey length was measured by
for the STB region for each year and a conservative kilometers of survey effort in each year.
abundance estimate for blue whales in New Zealand.
A Bayesian closed population model was used, which
was fitted using Markov chain Monte Carlo in the R RESULTS
package multimark (McClintock 2015). Models in
multimark allow for the inclusion of multiple ‘mark Distribution of sightings
types’. Here, our 2 mark types were left- and right-
side photographs. It is possible that some individuals Three dedicated surveys were conducted in the
were counted twice if left- and right-side photographs STB region in 2014 (n = 7 d between 24 January and
were not obtained simultaneously at one encounter, 3 February), 2016 (n = 11 d between 23 January and
and this is accounted for by the population models 8 February), and 2017 (n = 9 d between 5 and 20
implemented in multimark. The use of multimark February). This survey effort resulted in a total of 64
avoids the need for separate right-side and left-side blue whale sightings. The most frequently observed
abundance estimates, and increases our overall sam- known behavior was foraging (32.8% of sightings),
ple size. We assumed no behavioral response to the followed by travel (6.3%), socializing (4.7%), and
capture events (i.e. captured individuals were no less rest (0%). Behavior was unknown for 56.3% of sight-
likely to be re-photographed on a subsequent occa- ings. Eight mother−calf pairs were observed, includ-
sion), equal probability of type 1 and type 2 encoun- ing documentation of nursing behavior through UAS
ters (i.e. we were equally likely to obtain a left-side (see the video in Supplement 2 at www.int-res.com/
photograph as a right-side), a conditional probability articles/suppl/n036p027_supp/). Combining observa-
of obtaining both mark types simultaneously (i.e. for tions from these dedicated surveys with the oppor-
some animals we had only left-hand or right-hand tunistic sightings data, a total of 740 blue whale
side photographs, and for some we were able to ob- sightings have been reported in New Zealand waters
tain both during the encounter), and allowed for tem- between 1900 and 2017. Of these, 704 had precise
poral variation in detection probability. sighting coordinates, while regional sighting loca-
For each within-year abundance estimate, 3 cap- tions were provided for the remainder. The sightings
ture periods were designated as groups of consecu- without precise location data were used for the tem-
tive survey days separated by breaks in survey activ- poral distribution assessment, but not for the spatial
ity due to poor weather conditions (see Table S3 in distribution analysis.
Supplement 1). Therefore, if an individual was seen Blue whale sightings were reported during every
multiple times on the same day or on consecutive month of the year (Fig. 2), both in the STB region and
days, it was not counted as a resighting to avoid elsewhere in the New Zealand EEZ. Fewer sightings
pseudo-replication that would bias the abundance were reported during the austral winter months,
estimate. between May and September. For nearly everyBarlow et al.: Documentation of New Zealand blue whale population 33
Fig. 2. Blue whale sighting reports by each month of the year
between 1900 and 2017, including systematic survey and
opportunistic data sources (n = 740). (Light blue) All reports
from within the New Zealand Exclusive Economic Zone
(EEZ), and (dark blue) reports from the South Taranaki
Bight (STB) region
month, the majority of reported blue whale sightings
within the New Zealand EEZ occurred in the STB
region. The spatial distribution of blue whale obser-
vations illustrates a predominant concentration of
sightings in the STB region (Fig. 3). Additional areas
with slightly elevated densities of blue whale sight-
ing reports include the Kaikoura, Hauraki Gulf, and
Bay of Islands regions, which could be an artifact of
Fig. 3. Spatial distribution of blue whale sighting reports
elevated marine observations in these areas (i.e. that provided geographic coordinates within the New
whale watch and research vessels). Zealand Exclusive Economic Zone between the years 1980
and 2017 (n = 704). Densities are calculated as the number of
blue whales per km2 with a 50 km search radius. A mini-
mum-maximum stretch type with a gamma stretch of 1.5
Acoustics was applied for visualization
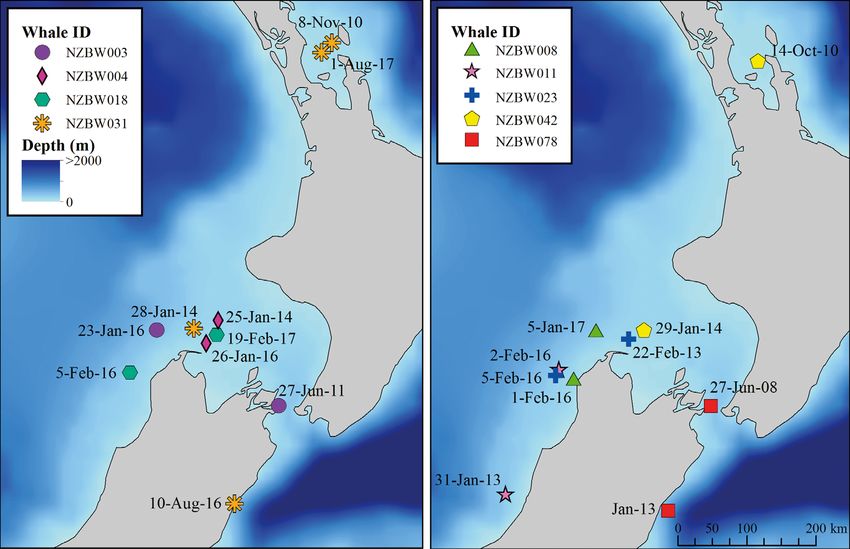
The total number of recording days ranged be-
tween 295 and 331 for each MARU site. New Zealand based data collection was underway (January and
blue whale calls (Fig. 4; McDonald et al. 2006) oc- February 2016). We therefore consider it highly un-
curred regularly at all 5 sites in the STB region likely that any photographs obtained during the ded-
(Fig. 5; mean daily occurrence 86.6% across all sites). icated fieldwork in the STB are of Antarctic blue
Calls occurred most frequently at sites MARU 5 and whales.
MARU 1, with 99.7% and 96% daily acoustic pres-
ence, respectively. All sites had 100% daily acoustic
presence during March, April, and May 2016, and Photo-identification
≥90% daily acoustic presence in June and July.
While no blue whale calls occurred at site MARU 3 in A total of 89 individual blue whales were identified
January 2016, this hydrophone was only recording during dedicated surveys in the STB region over the
for 6 days of the month (Fig. 5). Percent daily acoustic 3 survey years. These identifications included 64 for
presence of calls was less at sites MARU 2 (44.8%) which both left- and right-side identification photo-
and MARU 3 (44.8%) during February 2016, and for graphs were obtained, 12 left-side only IDs, and 13
all sites during September 2016 (Fig. 5). No acoustic right-side only IDs; we acknowledge that the true
data were collected at site MARU 4 during December number of unique individuals observed may be
2016. slightly lower than 89. The discovery curve depicts a
No Antarctic blue whale vocalizations (McDonald consistently upward trend and does not appear to be
et al. 2006) were recorded during times when vessel- reaching an asymptote (Fig. 6), indicating we are still34 Endang Species Res 36: 27–40, 2018
portunistic photograph dataset yielded 78 sightings
for the identification of 62 individuals, and when
combined with the STB region survey sightings, a
total of 151 unique individuals were identified (93
left- and right-side, 36 left-side only IDs, 22 right-side
only IDs). This collection represents the most com-
prehensive photo-ID catalog of blue whales in New
Zealand waters.
Nine blue whales were resighted across multiple
years in the New Zealand EEZ (Fig. 7). For all of
these inter-annual resightings, at least one of the
sightings was in the STB region. For 4 of these re-
sightings, both observations occurred in the STB
region within the same monthly period of different
years (NZBW004, NZBW018, NZBW008, NZBW023),
indicating consistent temporal use of this area by
individuals. The maximum number of resightings for
an individual was 4 times over a 7 yr period, and this
individual (NZBW031) was observed with a calf at 3
out of 4 observations. No blue whales identified any-
Fig. 4. Spectrogram of New Zealand blue whale call type re- where in the New Zealand EEZ matched to any
corded on 25 February 2016 at marine autonomous record-
photograph in the Australian collection (n = 197) or
ing unit (MARU) 4. Call type consists of 3 pulsed calls (A,B,C),
followed by a tonal call (D). Spectrogram visualized with a Antarctic collection (n = 65).
1024 point fast Fourier transform, Hann window, 90% overlap,
0.488 Hz frequency resolution, and 204 ms time resolution
Genetics
in the discovery phase and not yet nearing identifica-
tion of the entire population. A total of 72 samples were available for genetic
Opportunistic photographs of New Zealand blue analysis. This included 43 biopsy samples and 14
whales identified between 2004 and 2017 were com- fecal samples collected in the STB in 2014, 2016 and
piled and a total of 322 photographs were deemed 2017. Additionally, the NZCeTA contained samples
suitable for identification and comparison. This op- from 12 beachcast whales from around New Zealand
Fig. 5. Percent of recording days with acoustic detection of the New Zealand blue whale call type, by each month of 2016 at
each hydrophone location (MARU 1 to 5). No data were collected at site MARU 4 during December 2016Barlow et al.: Documentation of New Zealand blue whale population 35
effort, they represent 2 unique individuals that were
not present for potential resampling during survey
effort, and as such, they were retained in the genetic
dataset.
Genotype matching identified 10 whales sampled
multiple times in the STB region by biopsy and/or
fecal sample; these samples show sufficiently low
PID values (1.17 × 10⁻⁹ to 7.65 × 10⁻⁸) to support that
the matches are not due to random chance. After
removing within-year replicates, genotypes were
compared between STB individuals and samples
from the NZCeTA. This comparison identified 1
individual sampled in the STB in both the 2014 and
Fig. 6. Blue whale photo-identification discovery curve of the 2016 field seasons (P ID = 5.63 × 10⁻⁹). All genotype
cumulative number of unique individuals identified versus matches were confirmed by photo-ID. With all
the cumulative number of days of survey effort. Data were replicates removed, the New Zealand blue whale
derived from dedicated survey effort in the South Taranaki genetic catalogue contains 53 individuals. Of these,
Bight (STB) region during 2014, 2016, and 2017
29 individuals are females and 17 are males; the
sex could not be determined for 7 individuals due
and biopsy samples collected from 2 live whales in to degradation of the DNA. The sex ratio of 17:29
the Cook Strait and 1 in the Hauraki Gulf. Six of the did not differ significantly from 1:1 (exact binomial
fecal samples and 2 skin samples collected from test, p = 0.104).
beachcast whales failed to amplify for 12 or more loci Control region haplotypes were sequenced from 52
and were considered poor quality. The 6 poor quality individuals, which included all but one of the NZCeTA
fecal samples were removed from further analysis. samples (Table 1). After control region sequences
As the 2 poor quality skin samples obtained from were trimmed to a 410 bp consensus region and
beachcast whales were collected before any biopsy compared with published sequences on GenBank,
Fig. 7. Inter-annual resighting locations for blue whales in the New Zealand Exclusive Economic Zone. Two panels are used
for visual clarity. Note: precise sighting coordinates were not given for NZBW031 in August 2016 or for NZBW078 in January
2013; however, approximate locations were provided. The exact date of the sighting was not provided for NZBW078 in
January 201336 Endang Species Res 36: 27–40, 2018
Table 1. Frequencies of mitochondrial DNA haplotypes for these 2 blue whale populations show a low level of
individual pygmy blue whales sampled in the South Tara- differentiation, indicated by FST (0.04, p = 0.009) but
naki Bight (STB) region and from beachcast animals around
not ΦST (0.013, p = 0.075).
New Zealand held at the New Zealand Cetacean Tissue
Archive (NZCeTA). Haplotype codes follow LeDuc et al.
(2007) except for haplotype 15 (Attard et al. 2015) and the 2
newly identified haplotypes (BmuNZ18 and Bmu17NZfl) Abundance
GenBank code STB NZCeTA Total NZ The 2017 survey yielded the highest number of
individually identified whales, even though the 2016
Haplotype d EU093921 30a 10 39
survey covered the most distance (Table 3). Within-
Haplotype e EU093922 1 2 3
Haplotype ii EU093952 2 1 3 year abundance estimates of blue whales in the STB
Haplotype mm EU093956 1 1 1 region were relatively similar for each survey year
BmuNZ18 2 0 2 (Table 3), with a mean of 140 (SD = 28). Using all sur-
Haplotype 15 HQ130731 1 0 1 vey years of photo-ID captures, our abundance esti-
Bmu17NZf1 1 0 1
mate for New Zealand blue whales from a closed
Total 38 14 52
a
population model is 718 (SD = 433, 95% CI = 279−
One sample was heteroplasmic for haplotype d and an
undescribed haplotype, and was excluded from further 1926) individuals. While the uncertainty around this
analysis estimate is large, the point estimate of 718 is likely an
underestimate of total population size.
7 haplotypes were identified in the New Zealand
dataset: 4 previously described by LeDuc et al. DISCUSSION
(2007), 1 previously described by Attard et al. (2015),
and 2 previously undescribed. The 2 new haplotypes Our multidisciplinary study demonstrates that a
presented here are referred to as BmuNZ18 and genetically distinct blue whale population occurs in
Bmu17NZf1. The majority of the samples in the New New Zealand waters year-round. This finding is of
Zealand dataset (75%) were haplotype d (LeDuc et significant conservation importance considering the
al. 2007). history of exploitation and current anthropogenic
The haplotype diversity of the New Zealand data- threats.
set was 0.406 ± 0.085 (SD), which is significantly Given that blue whales in New Zealand waters are
lower than any of the other blue whale populations not solely ‘migrant’, revision of the current threat
tested (p < 0.001 for all comparisons; Table 2). There classification status of blue whales in New Zealand is
was no significant differentiation in mtDNA haplo- warranted. We estimated the abundance of this pop-
types between the STB and NZCeTA collections (F ST ulation to be 718 (SD = 433) individuals, determined
= 0.000, p = 0.684), so they were combined for com- that they are genetically most similar to the pygmy
parison to the other areas. The combined New blue whale subspecies Balaenoptera musculus brevi-
Zealand collection showed highly significant differ- cauda found off Australia, described multiple indi-
entiation from the Southern Ocean and Southeast vidual resightings within New Zealand waters across
Pacific populations for both FST and ΦST (Table 2). The multiple years and in multiple seasons, highlighted a
New Zealand collection of samples was most similar lack of photo-ID matches between New Zealand blue
to the Australian pygmy blue whale population. Yet, whales and photograph collections from neighboring
Table 2. Pairwise comparisons of mitochondrial DNA control region differentiation using haplotype (FST) and nucleotide (ΦST)
diversity (± SD) between New Zealand pygmy blue whales and 3 other blue whale populations: the Southern Ocean, the
Southeast Pacific, including Chile, Ecuador and Peru, and the Australian population
Dataset Sample No. of Haplotype Nucleotide FST p-value ΦST p-value
size haplotypes diversity (h) diversity (π)
New Zealand 52 7 0.406 ± 0.085 0.001 ± 0.001 – – – –
Southern Ocean 183 52 0.969 ± 0.004 0.014 ± 0.007 0.257 < 0.001 0.333 < 0.001
Southeast Pacific 113 19 0.904 ± 0.012 0.014 ± 0.006 0.310 < 0.001 0.381 < 0.001
Australia 89 14 0.680 ± 0.053 0.003 ± 0.002 0.040 0.009 0.013 0.075Barlow et al.: Documentation of New Zealand blue whale population 37
Table 3. Within-year abundance estimates of pygmy blue during the winter months (Balcazar et al. 2015).
whales for the South Taranaki Bight region for each survey Although the breeding and calving locations of this
year
New Zealand population are currently undeter-
mined, our hydrophones often recorded blue whale
Year Survey Unique Abundance SD 95%
song, which is thought to be associated with breed-
effort IDs estimate CI
(akm) ing behavior, during every month of the year. Addi-
tionally, we observed multiple mother−calf pairs,
2014 315 22 109 97 29−379 including documentation of nursing behavior. At this
2016 2759 26 145 99 47−417 stage we have only assessed acoustic presence, and
2017 1677 42 166 80 75−367
we recognize that this does not account for call den-
sity. Further analysis of our acoustic dataset will elu-
cidate the spatial and temporal occurrence patterns
regions, and documented year-round presence in the of blue whales in the STB region for a multiple-year
STB region where foraging was frequently observed recording period.
during surveys. These results lead us to hypothesize While the concentration of blue whale sightings in
that this newly documented blue whale population the STB region (Fig. 3) is influenced by both dedi-
may be largely resident to New Zealand, although cated and seismic survey observer effort in the area,
we recognize that excursions beyond New Zealand we believe the STB region to be critical habitat for
waters may occur. Individual movement data are New Zealand blue whales. If Kaikoura, the Hauraki
needed for hypothesis confirmation. Gulf, and the Bay of Islands were occupied by blue
Despite the paradigm that baleen whales migrate whales with the same frequency as the STB region,
seasonally between high-latitude feeding grounds to sighting reports in these areas would likely be
low-latitude breeding grounds, there are several greater due to relatively high observation effort by
exceptions (Geijer et al. 2016). It has been noted that marine mammal scientists and the whale watching
blue whales may not always fit this rigid categoriza- tourism industry. Furthermore, while feeding blue
tion and that migration patterns may also change whales have occasionally been reported in the Hau-
over time (Calambokidis et al. 2009, LeDuc et al. raki Gulf and Kaikoura, oceanographic conditions
2017). Furthermore, it has been established that there are different from those in the STB region,
there is a year-round resident population of Northern which is characterized by a wind-driven upwelling
Indian Ocean blue whales B. m. indica in Sri Lanka system that produces a plume of cold, productive
(e.g. de Vos et al. 2014) based only on observations of water associated with high concentrations of Nyc-
blue whales in the waters surrounding Sri Lanka dur- tiphanes australis (Shirtcliffe et al. 1990, Torres
ing every month of the year (Ilangakoon & Sathasi- 2013). These oceanographic conditions are unique
vam 2012). We similarly present evidence of blue within New Zealand, and are consistent with well-
whale sighting reports in New Zealand waters dur- documented blue whale habitat in Australia (Gill
ing every month of the year, which is corroborated by 2002), Chile (Buchan & Quiñones 2016), and Califor-
acoustic detections of the New Zealand blue whale nia (Croll et al. 1998). We therefore posit that, even in
call on 99.7% of recording days by at least 1 hydro- the absence of New Zealand-wide systematic survey
phone during 2016. These findings highlight the effort for blue whales, we have substantial evidence
importance of relying on applicable scientific data for to indicate that the STB region is an important area
conservation management rather than on paradigms. for blue whales within the New Zealand EEZ, partic-
While blue whale sightings and vocalizations were ularly for foraging.
reported during every month of the year, fewer sight- The resighting of 9 individual whales between
ings were reported during the winter months, which years within the New Zealand EEZ demonstrates site
could indicate that a proportion of the population fidelity to New Zealand waters. In addition, Olson et
migrates to other waters, including a yet unknown al. (2015) reported one other photo-identification
breeding ground. However, during the winter months match between years, sighted in the Cook Strait and
with fewer visual sightings, we recorded a high daily Oamaru (Fig. 1). Of all these inter-annual resight-
acoustic presence in 2016, indicating that decreased ings, at least one of the sightings was made in the
visual sightings may be an artifact of observer effort. STB region (Fig. 7), further emphasizing the likely
In contrast, recordings from Australian waters show a importance of the region for blue whales in New
stronger seasonal pattern of blue whale acoustic Zealand. It is also noteworthy that 3 of the inter-
detections, including a drop-off or complete absence annual resightings were made in different seasons,38 Endang Species Res 36: 27–40, 2018 indicating that at least some individuals make use of tion of a closed population model. However, we rec- the region in both winter and summer. ognize that there are several caveats that must Genetically, our samples of New Zealand blue accompany this population abundance estimate. The whales are most similar to the Australian pygmy blue New Zealand blue whale call has infrequently been whales, but differ significantly in haplotype frequen- recorded outside New Zealand waters (in Tonga and cies and diversity. We described 2 new mtDNA hap- eastern Australia; Balcazar et al. 2015). We also lotypes in the New Zealand population, and the acknowledge that births and deaths likely occurred genetic samples are characterized by very low haplo- between 2014 and 2017 creating some degree of bias type diversity. This is significantly lower than that of in the estimate. However, this bias is expected to be the pygmy blue whale population found in southern minimal given the short duration of the study period Australia that was described as having the lowest relative to the low pregnancy rates (Lockyer 1984) genetic diversity of any blue whale population and high survival probabilities for blue whales (Ichi- (Attard et al. 2015). As hypothesized by Attard et al. hara 1966). The rates of individual movement be- (2015) for the southern Australian pygmy blue whale tween the STB and other areas of New Zealand are population, the low genetic diversity of the New not well understood at this time, and therefore could Zealand population may reflect a relatively recent not be accounted for in our abundance model. The founding event. While there was significant differen- result of the closed population model using our 3 sur- tiation for FST based on haplotype diversity, there was vey years as discrete capture periods, therefore, rep- no significant differentiation for ΦST based on nucleo- resents a conservative abundance estimate (N = 718, tide diversity between the New Zealand and Aus- SD = 433) for the blue whale population occupying tralian populations. This indicates that the New New Zealand waters. This New Zealand estimate is Zealand population is most closely related to the qualified as a Category 2 abundance estimate under Australian population, and likely corroborates the the standards set by the IWC, described as ‘an under- hypothesis of a more recent founding event as it estimate, suitable for ‘conservative’ management but takes longer for population separation to be reflected not necessarily reflective of total abundance’ (IWC in ΦST. The low genetic diversity makes these popu- 2017b). The upward trend of the discovery curve in- lations potentially vulnerable to future climate change dicates that we are not yet nearing full identification and other anthropogenic impacts (Attard et al. 2015). of the whole population. Additionally, the low rate of The vulnerability of the New Zealand population resightings resulted in wide confidence intervals may be exacerbated by their year-round occupancy around the estimate, which may be reduced with of the STB region, where they are frequently exposed subsequent years of data collection and analysis. to anthropogenic activities. In this study, we document a unique New Zealand The IWC has prioritized the need for population blue whale population through a comprehensive pop- assessments of pygmy blue whales (IWC 2017a). We ulation assessment that determined evidence of year- present the first abundance estimate for any pygmy round presence, individual resightings across years, blue whale population to date. Although our conser- and genetic differentiation from other regions. These vative abundance estimate for pygmy blue whales in multidisciplinary results align and lead us to hypothe- New Zealand is based only on photographs captured size that this blue whale population may be mostly during dedicated survey effort in the STB region, we resident within New Zealand waters. The concentra- consider this estimate representative because (1) the tion of blue whales in the STB region is of significant majority of all reported blue whale sightings oc- management importance due to the high industrial curred in the STB region (Fig. 2), (2) individuals re- presence in this area. Further investigation into po- occur in the STB region across multiple years, with tential space-use conflict between blue whales and some evidence of individual movement between the industrial activity such as seismic surveys, oil and gas STB region and other parts of New Zealand (Fig. 7), drilling and extraction, seabed mining, and vessel (3) no matches have been made between individual traffic is warranted. A vital first step in any impact as- blue whales identified in New Zealand and those sessment is baseline information on population distri- identified in Australia or Antarctica, and (4) the New bution, connectivity, and abundance, which we have Zealand population has significant genetic differenti- provided here. We recommend that subsequent ation from all other known southern hemisphere blue analyses build on these findings to investigate blue whale populations. In the absence of any known whale spatial and temporal habitat use patterns and immigration/emigration between New Zealand and assess the potential cumulative effects of industrial other regions, this last point also justifies our applica- activity on the behavior and health of the population.
Barlow et al.: Documentation of New Zealand blue whale population                           39

Acknowledgements. Funding for this project was provided           ground in northern Patagonia, Chile. Mar Ecol Prog Ser
by The Aotearoa Foundation, The New Zealand Department            554:183−199
of Conservation, The National Geographic Society Waitt         Calambokidis J, Barlow J, Ford JKB, Chandler TE, Douglas
Foundation, The Marine Mammal Institute at Oregon State           AB (2009) Insights into the population structure of blue
University, The National Oceanographic and Atmospheric            whales in the Eastern North Pacific from recent sightings
Administration’s Cooperative Institute for Marine Resources       and photographic identification. Mar Mamm Sci 25:
Studies (NOAA/CIMRS), Greenpeace New Zealand,                     816−832
OceanCare, Kiwis Against Seabed Mining, The Interna-           Calupca TA, Fristrup KM, Clark CW (2000) A compact digi-
tional Fund for Animal Welfare, The Thorpe Foundation,            tal recording system for autonomous bioacoustic moni-
and an anonymous donor. The project was accomplished              toring. J Acoust Soc Am 108:2582
through the dedicated work and support of many individu-       Cetacean Specialist Group (1996) Balaenoptera musculus
als including the crew of the RV ‘Star Keys’ (Western Work        ssp. brevicauda. IUCN Red List Threat Species 1996:
Boats) and the RV ‘Ikatere’ (National Institute of Water and      e.T2479A9449204. http://dx.doi.org/10.2305/IUCN.UK.
Atmospheric Research), Kathy Minta and Minda Stiles from          1996.RLTS.T2479A9449204.en (accessed 15 August 2017)
Oregon State University, Ian Angus, Laura Boren, Hannah        Clapham PJ, Young SB, Brownell RL Jr (1999) Baleen
Hendriks, Andrew Lamason, and Dave Lundquist from the             whales: conservation issues and the status of the most
New Zealand Department of Conservation, and Edward                endangered populations. Mammal Rev 29:37−60
James Moore III from the Bioacoustics Research Program at      Committee on Taxonomy (2017) List of marine mammal
Cornell University. Blue whale sightings and photo-identifi-      species and subspecies. Society for Marine Mammalogy,
cation contributions are also recognized from Blue Planet         www.marinemammalscience.org (accessed 15 August
Marine, the Ministry for Primary Industries, OMV, Petro-          2017)
leum Geo-Services, Dolphin Safari, Whale Watch Kaikoura,       Croll DA, Tershy BR, Hewitt RP, Demer DA and others
and the following individuals: Olive Andrews, Haley Baxter,       (1998) An integrated approach to the foraging ecology of
Aneke Bowker, Jaime Brown, Deanna Clement, Sonja                  marine birds and mammals. Deep Sea Res II 45:
Clemens, Tony Crocker, Eric de Boer, Nico de la Brosse,           1353−1371
Sarah Dwyer, Deanna Elvines, Viraj Gamage, Sarah Gard-         de Vos A, Pattiaratchi CB, Harcourt RG (2014) Inter-annual
ner, Dan Govier, Theresa Kirchner, Krista Hupman, Helen           variability in blue whale distribution off southern Sri
McConnell, Don Neale, Terry Visser, Jody Weir, and Roger          Lanka between 2011 and 2012. J Mar Sci Eng 2:534−550
Williams.                                                      Environmental Protection Authority (2017) Decision on mar-
                                                                  ine consents and marine discharge application: Trans-
                                                                  Tasman Resources Limited. Extracting and processing
                   LITERATURE CITED                               iron sand within the South Taranaki Bight. New Zealand
                                                                  Government, Wellington. https://www.epa.govt.nz/assets/
Alexander A, Steel D, Hoekzema K, Mesnick SL and others           Uploads/Documents/Marine-Activities-EEZ/Activities/
   (2016) What influences the worldwide genetic structure         TTRL-Marine-Consent-Decision-EEZ000011-FINAL-
   of sperm whales (Physeter macrocephalus)? Mol Ecol 25:         version.pdf
   2754−2772                                                   ESRI (Environmental Systems Research Institute) (2016)
Attard CRM, Beheregaray LB, Jenner KCS, Gill PC and               ArcGIS Desktop: Release 10. Environmental Systems
   others (2015) Low genetic diversity in pygmy blue              Research Institute, Redlands, CA
   whales is due to climate-induced diversification rather     Excoffier L, Lischer HEL (2010) Arlequin suite ver 3.5: A
   than anthropogenic impacts. Biol Lett 11:20141037              new series of programs to perform population genetics
Baker CS, Slade RW, Bannister JL, Abernethy RB and others         analyses under Linux and Windows. Mol Ecol Resour 10:
   (1994) Hierarchical structure of mitochondrial DNA gene        564−567
   flow among humpback whales Megaptera novaeangliae,          Galletti Vernazzani B, Jackson JA, Cabrera E, Carlson CA,
   world-wide. Mol Ecol 3:313−327                                 Brownell RL (2017) Estimates of abundance and trend of
Baker CS, Chilvers BL, Childerhouse S, Constantine R and          Chilean blue whales off Isla de Chiloé, Chile. PLOS ONE
   others (2016) Conservation status of New Zealand mar-          12:e0168646
   ine mammals, 2013. New Zealand threat classification        Gavrilov AN, McCauley RD (2013) Acoustic detection and
   series 14. New Zealand Department of Conservation,             long-term monitoring of pygmy blue whales over the
   Wellington                                                     continental slope in southwest Australia. J Acoust Soc
Balcazar NE, Tripovich JS, Klinck H, Nieukirk SL, Mellinger       Am 134:2505−2513
   DK, Dziak RP, Rogers TL (2015) Calls reveal population      Gavrilov AN, McCauley RD, Salgado-Kent C, Tripovich J,
   structure of blue whales across the Southeast Indian           Burton C (2011) Vocal characteristics of pygmy blue
   Ocean and the Southwest Pacific Ocean. J Mammal 96:            whales and their change over time. J Acoust Soc Am 130:
   1184−1193                                                      3651−3660
Branch TA, Matsuoka K, Miyashita T (2004) Evidence for         Geijer CKA, Notarbartolo di Sciara G, Panigada S (2016)
   increases in Antarctic blue whales based on Bayesian           Mysticete migration revisited: Are Mediterranean fin
   modelling. Mar Mamm Sci 20:726−754                             whales an anomaly? Mammal Rev 46:284−296
Branch TA, Stafford KM, Palacios DM, Allison C and others      Gill P (2002) A blue whale (Balaenoptera musculus) feeding
   (2007) Past and present distribution, densities and move-      ground in a southern Australian coastal upwelling zone.
   ments of blue whales Balaenoptera musculus in the              J Cetacean Res Manag 4:179−184
   Southern Hemisphere and northern Indian Ocean. Mam-         Ichihara T (1966) The pygmy blue whale, Balaenoptera mus-
   mal Rev 37:116−175                                             culus brevicauda, a new subspecies from the Antarctic.
Buchan SJ, Quiñones RA (2016) First insights into the             In: Norris KS (ed) Whales, dolphins and porpoises. Uni-
   oceanographic characteristics of a blue whale feeding          versity of California Press, Berkeley, CA, p 79−113
40 Endang Species Res 36: 27–40, 2018
Ilangakoon AD, Sathasivam K (2012) The need for taxo- LeDuc CA, Hildebrand JA (2007) Behavioral context of
nomic investigations on Northern Indian Ocean blue call production by eastern North Pacific blue whales.
whales (Balaenoptera musculus): implications of year- Mar Ecol Prog Ser 330:269−284
round occurrence off Sri Lanka and India. J Cetacean Olson PA, Ensor P, Olavarria C, Bott N and others (2015)
Res Manag 12:195−202 New Zealand blue whales: residency, morphology, and
IWC (International Whaling Commission) (2017a) Report of feeding behavior of a little-known population. Pac Sci 69:
the Scientific Committee Annex H : Report of the sub- 477−485
committee on other Southern Hemisphere whale stocks. R Core Team (2017) R: a language and environment for sta-
IWC, Bled tistical computing. R Foundation for Statistical Comput-
IWC (International Whaling Commission) (2017b) Report of ing, Vienna
the Scientific Committee Annex Q : Report of the ad hoc Rawson A, Riding J (2015) South Taranaki Bight marine traf-
working group on abundance estimates, stock status and fic study. Prepared for Trans-Tasman Resources by Marico
international cruises. IWC, Bled Marine. Marico Marine NZ, Wellington. https://www.epa.
Kalinowski ST, Taper ML, Marshall TC (2007) Revising how govt.nz/assets/FileAPI/proposal/EEZ000011/Applicants-
the computer program CERVUS accommodates geno- proposal-documents-Application- documents/Report-
typing error increases success in paternity assignment. 27-Marico-Marine-Traffic-Study-December-2015.pdf (ac-
Mol Ecol 16:1099−1106 cessed 27 March 2017)
Krutzen M, Barre LM, Moller LM, Heithaus MR, Simms C, Reilly SB, Bannister JL, Best PB, Brown M and others (2008)
Sherwin WB (2002) A biopsy system for small cetaceans: Balaenoptera musculus ssp. intermedia (errata version
darting success and wound healing in Tursiops spp. Mar published in 2016). IUCN Red List Threat Species 2008:
Mamm Sci 18:863−878 e.T41713A98837960. http://dx.doi.org/10.2305/IUCN.UK.
LeDuc RG, Dizon AG, Goto M, Pastene L and others (2007) 2008.RLTS.T41713A10543676.en (accessed 4 August 2017)
Patterns of genetic variation in Southern Hemisphere Sambrook J, Fritsch EF, Maniatis T (1989) Molecular cloning:
blue whales and the use of assignment test to detect mixing a laboratory manual. Cold Spring Harbor Laboratory
on the feeding grounds. J Cetacean Res Manag 9:73−80 Press, Cold Spring Harbor, NY
LeDuc RG, Archer FI, Lang AR, Martien KK and others Sears R, Williamson MJ, Wenzel FW, Bérubé M, Gendron D,
(2017) Genetic variation in blue whales in the eastern Jones P (1990) Photographic identification of the blue
Pacific: implication for taxonomy and use of common whale (Balaenoptera musculus) in the Gulf of St.
wintering grounds. Mol Ecol 26:740−751 Lawrence, Canada. Rep Int Whal Comm Spec Issue 12:
Lockyer C (1984) Review of baleen whale (Mysticeti) repro- 335−342
duction and implications for management. Rep Int Whal Shirtcliffe TGL, Moore MI, Cole AG, Viner AB, Baldwin R,
Comm Spec Issue 6:27−50 Chapman B (1990) Dynamics of the Cape Farewell
Longmire JL, Maltbie M, Baker RJ (1997) Use of ‘lysis buffer’ upwelling plume, New Zealand. N Z J Mar Freshw Res
in DNA isolation and its implications for museum collec- 24:555−568
tions. Occas Pap Mus Tex Tech Univ 163:1−3 Sremba AL, Hancock-Hanser B, Branch TA, LeDuc RL,
McClintock BT (2015) multimark: An R package for analysis Baker CS (2012) Circumpolar diversity and geographic
of capture−recapture data consisting of multiple ‘non- differentiation of mtDNA in the Critically Endangered
invasive’ marks. Ecol Evol 5:4920−4931 Antarctic blue whale (Balaenoptera musculus interme-
McDonald MA (2006) An acoustic survey of baleen whales dia). PLOS ONE 7:e32579
off Great Barrier Island, New Zealand. N Z J Mar Freshw Torres LG (2013) Evidence for an unrecognised blue whale
Res 40:519−529 foraging ground in New Zealand. N Z J Mar Freshw Res
McDonald MA, Mesnick SL, Hildebrand JA (2006) Biogeo- 47:235−248
graphic characterisation of blue whale song worldwide: Torres-Florez JP, Hucke-Gaete R, LeDuc R, Lang A and oth-
using song to identify populations. J Cetacean Res ers (2014) Blue whale population structure along the
Manag 8:55−65 eastern South Pacific Ocean: evidence of more than one
Miller BS, Collins K, Barlow J, Calderan S and others (2014) population. Mol Ecol 23:5998−6010
Blue whale vocalizations recorded around New Zealand: Waits LP, Luikart G, Taberlet P (2001) Estimating the proba-
1964−2013. J Acoust Soc Am 135:1616−1623 bility of identity among genotypes in natural popula-
Oleson EM, Calambokidis J, Burgess WC, McDonald MA, tions: cautions and guidelines. Mol Ecol 10:249−256
Editorial responsibility: Mike Noad, Submitted: September 25, 2017; Accepted: March 22, 2018
Gatton, Queensland, Australia Proofs received from author(s): April 30, 2018You can also read