Iron Rain: measuring the occurrence rate and origin of small iron meteoroids at Earth
←
→
Page content transcription
If your browser does not render page correctly, please read the page content below
MNRAS 000, 1–13 (2021) Preprint 22 September 2021 Compiled using MNRAS LATEX style file v3.0

 Iron Rain: measuring the occurrence rate and origin of small iron
 meteoroids at Earth

 Tristan Mills1,2★ , P. G. Brown1,2 , M. J. Mazur1,2 , D. Vida1,2 , Peter S. Gural3
 and
 1
 Althea V. Moorhead4
 Department of Physics and Astronomy, University of Western Ontario, London, Ontario, N6A 3K7, Canada
 2 Institute for Earth and Space Exploration (IESX), The University of Western Ontario, London, Ontario N6A 3K7, Canada
 3 Gural Software and Analysis LLC, Lovettsville, VA USA
arXiv:2109.10265v1 [astro-ph.EP] 21 Sep 2021

 4 NASA Meteoroid Environment Office, Marshall Space Flight Center EV44, Huntsville, Alabama 35812, USA

 Accepted XXX. Received YYY; in original form ZZZ

 ABSTRACT
 We report results of a four-year survey using Electron Multiplied Charged Coupled Device
 (EMCCD) cameras recording 34761 two-station video meteor events complete to a limiting
 magnitude of +6. The survey goal was to characterize probable iron meteoroids. Using only
 physical properties of the meteor trajectories including early peaking light curves, short lumi-
 nous trajectories, and high energies accumulated per area at beginning, we identified 1068 iron
 meteors. Our iron candidates are most abundant at slow speeds < 15 km/s, where they make up
 ≈20% of the mm-sized meteoroid population. They are overwhelmingly on asteroidal orbits,
 and have particularly low orbital eccentricities and smaller semi-major axes when compared
 to non-irons between 10-20 km/s. Our iron population appears to be more numerous at fainter
 magnitudes, comprising 15% of slow (10-15 km/s) meteors with peak brightness of +3 with
 the fraction rising to 25% at +6 to +7, our survey limit. The iron orbits are most consistent with
 an asteroidal source and are in highly evolved orbits, suggesting long collisional lifetimes (107
 years). Metal-rich chondrules (nodules) found in abundance in EL Chondrites are one possible
 source for this population. We also propose a possible technique using R-band colours to more
 robustly identify fainter iron meteors with very high confidence.
 Key words: meteors – meteoroids

 1 INTRODUCTION dominated precursor meteoroids, recovered in Antarctica is < 2%
 (Taylor et al. 2000). These results suggest that iron meteoroids are
 The composition and origin of extraterrestrial dust impacting Earth
 a small fraction of the impactor population at Earth.
 are varied. At large sizes, the many distinct classes of meteorites
 However, more recently, a spectral survey performed by Vo-
 demonstrate directly that asteroidal parent bodies have experienced
 jáček et al. (2015, 2019) classified 15 out of 152 meteors as iron
 diverse evolutionary histories. The distinct populations of interplan-
 at mm-sizes. Campbell-Brown (2015) reported a population of low,
 etary dust particles and micrometeorites (Bradley 2007; Genge et al.
 slow meteors at mm and smaller meteoroid sizes that appeared to
 2008) also show that many different classes of solar system bodies
 have properties consistent with iron, and appeared to increase in
 deliver dust to Earth (Carrillo-Sánchez et al. 2016) and that these
 abundance with decreasing mass. This suggests that the fraction of
 parent populations differ significantly.
 iron meteoroids as a function of size and orbit type or entry speed
 Among all the material impacting Earth, iron mete-
 may vary and raises the question: what fraction of the meteoroid
 oroids/meteorites are among the most processed and distinct. While
 population closer to the mass influx peak at Earth (near 10−8 kg
 comprising 4% of all observed meteorite falls (Borovička et al.
 Love & Brownlee (1993)) are iron meteoroids?
 2019), the fraction of apparently iron meteoroids producing fire-
 In addition to questions of the origin of such a unique compo-
 balls is much smaller, of order 1% (Borovička 2006). The differ-
 sitional meteoroid population, ‘irons’ pose a greater risk to space-
 ence is likely due to recovery biases, such as the higher density of
 craft. Single-plate penetration equations can be used to assess how a
 iron meteorites, their resistance to weathering and their ability to
 spacecraft would withstand hypervelocity impacts, and many, such
 be magnetically isolated. At still smaller sizes, the abundance of
 as the Cours-Palais equation, have a dependence on impactor den-
 I-type micrometeorite spherules, believed to be derived from iron-
 sity (Hayashida & Robinson 1991). Due to the higher density of
 iron, the predicted damage caused by iron meteoroids of similar
 ★ E-mail:tmills8@uwo.ca velocity and mass is greater. Understanding this population of small

 © 2021 The Authors
2 T. Mills et. al.
iron meteoroids is thus also of great practical interest for both the (2020), who found 8 iron spectra out of their 220 meteor sample—an
design and operation of spacecraft. abundance of 3.6%. These irons generally behaved similarly to the
 Early detections of iron meteoroids were necessarily limited irons of Vojáček et al. (2019).
to bright and large meteors due to the insensitive nature of early In a larger study of 7000 two-station video events with limit-
photographic films. Halliday (1960) reported a fireball spectrum ing meteor magnitudes of +6.5, a distinct “low, slow population”
coinciding with neutral iron that had a low velocity and begin height. of meteors with velocities below 30 km/s and begin heights less
The meteoroid was high density, and asteroidal in origin based on than 86 km was found (Campbell-Brown 2015), though no spectral
its orbit. Ceplecha (1966, 1967) reported a particularly large fireball information was available. These meteors also displayed short light
with peak brightness of -10 magnitude, whose spectrum consisted curves, sudden onsets with early peaks, and began at low heights
of Fe I, Fe II, and trace Ni I and Co I lines. The authors theorized for their speeds, consistent with the iron characteristics identified
a spraying of droplets as the main process of ablation. Yet another by Borovička et al. (2005); Vojáček et al. (2015). These low, slow,
study of brighter iron meteors identified 7 out of 287 fireballs as sudden onset meteors also became more prominent at fainter magni-
being caused by iron meteoroids at an initial mass range of 3-280 g tudes; 3% of meteors brighter than +3 showed these characteristics
(ReVelle 1994), representing a roughly 2-5% occurrence frequency while between peak meteor magnitudes of +6 and +3 more than 6%
in the tens of gram sizes across all speeds. had these features.
 Evidence from direct collection at smaller sizes suggests irons Motivated in part by these contemporary observations, Čapek
may be more abundant. Iron micrometeorites (MMs) have been & Borovička (2017) developed a comprehensive ablation model for
identified in the form of I-type spherules—oxidized iron grains small iron meteoroids. The authors tested several ablation scenarios
(Genge et al. 2008). While these particles can provide insight for irons guided by the existing data on begin heights, trail lengths,
into small iron particles near Earth, MMs, and particularly I-type and light curve shapes validated with meteors previously identified
spherules, suffer heavy biasing; I-types are resistant to weathering through spectra as being iron. They found best agreement using
and can be separated from sediments via magnets, and are also more a model whereby ablation is dominated by melting and droplet
likely to survive atmospheric entry than silicate particles (Genge injection into the air stream.
2016). Investigations of cosmic spherules report I-type abundances Building on this early model work, Čapek et al. (2019) im-
of 2% from Antarctic wells, and close to 30% from deep-sea collec- proved the iron ablation model by considering how droplets ablate
tions (Maurette et al. 1987; Taylor & Brownlee 1991; Taylor et al. independently after a delay is introduced from their release into the
2000). Most I-type spherules are consistent with asteroidal sources, air stream. This study examined 1500 two-station events of mm-
mostly from ordinary chondrite parent bodies (Genge 2016). sizes and isolated a population with short light curves and sudden
 The first comprehensive spectral survey of sporadic meteors luminosity onset. This low, slow population consisted of 45 possible
with peak magnitudes between +3 and -1 magnitude (roughly cm- iron meteors, 9 of which were confirmed irons based on spectra. The
sizes), by Borovička et al. (2005), identified 14 of 97 meteors as improved iron ablation model reasonably described these meteors
having only iron emission. The authors suggested this population in terms of begin height, brightness, and length, though became less
could reflect a pure iron, iron-nickel, or iron sulfide population. consistent with measurements for larger (brighter) iron meteors. A
These iron-rich meteoroids displayed sudden onsets of luminosity comprehensive hydrodynamic model of meteoroid melting and ab-
with their peak brightness occurring in the first half of their trajec- lation has also been presented by Girin (2019) and produces similar
tories. All but one had velocities less than 20 km/s, and all but one observational predictions to Čapek et al. (2019).
had begin heights lower than 90 km. Vojáček et al. (2019) noted that iron meteoroids typically re-
 A larger video survey at similar sensitivities (mm-sizes) per- quire more energy per unit cross-section prior to become visible
formed by Vojáček et al. (2015, 2019) found that 15 out of 152 mete- than stony material. This is because not only is heat better con-
ors had characteristics consistent with iron meteoroids. In particular, ducted throughout the body of an iron meteoroid, but iron’s heat of
these events possessed short, faint light curves, reached peak bright- vaporization is also very high. As a result, irons must receive higher
ness early in their trajectories, became luminous at low heights, and total amounts of energy to start spraying droplets, and thus will also
were most common at low speeds. All of these characteristics are penetrate deeper into the atmosphere (Genge 2016).
suggestive of a distinct population, a conclusion supported by the Most of the meteoroids in the Čapek et al. (2019) sample
height and lightcurve differences as compared to spectrally “nor- possess asteroidal orbits, with inclinations lower than 40◦ . All 9 of
mal” meteors (Borovička et al. 2005; Vojáček et al. 2015). Vojáček the detected two-station irons from Borovička et al. (2005), 10 of
et al. (2015) noted that only representative shower spectra (across 15 from Vojáček et al. (2019), and 7 of 8 from Vojáček et al. (2020),
different brightnesses) were used in their analysis, and so the frac- had asteroidal orbits with inclinations less than 45◦ , aphelia in the
tion of iron meteors still exceeds 2% if the total number of spectra asteroid belt at less than 4.5 AU, and Tisserand parameters with
selected from was under 750 meteors. respect to Jupiter greater than 3. One iron each from Vojáček et al.
 Augmenting these data from mm-sizes, Matlovič et al. (2019) (2019) and Vojáček et al. (2020) was found to have a perihelion
presented a combined spectral-physical-orbital survey of 202 me- smaller than 0.2 AU and was classified as sun-approaching. Of the
teors having peak brightness from -1 to -14, corresponding to cm remaining irons from Vojáček et al. (2019), two were Jupiter-family
to dm sizes. Only one pure iron spectra was found in their sample, objects, with inclination smaller than 45◦ , aphelia larger than 4.5
corresponding to an abundance of 0.5%. This lone iron meteoroid AU, and Tisserand parameters with respect to Jupiter between 2 and
was asteroidal, had high material strength but a short trajectory, and 3. They note, however, that an asteroidal origin for these Jupiter-
was cm-sized. The authors suggest that at cm to dm sizes irons are family irons cannot be excluded. Interestingly, there were also two
significantly less abundant than at mm sizes, which is supported by irons with Halley-type orbits with inclination larger than 60◦ . It is
other studies that have probed to dimmer brightnesses and smaller unclear how they came to these orbits other than having originated
sizes such as Campbell-Brown (2015); Borovička et al. (2005); from HTCs.
Vojáček et al. (2015). The low, slow population identified by Campbell-Brown
 Another study at cm-sizes was performed by Vojáček et al. (2015) also generally possessed asteroidal orbits. While the Tis-

 MNRAS 000, 1–13 (2021)
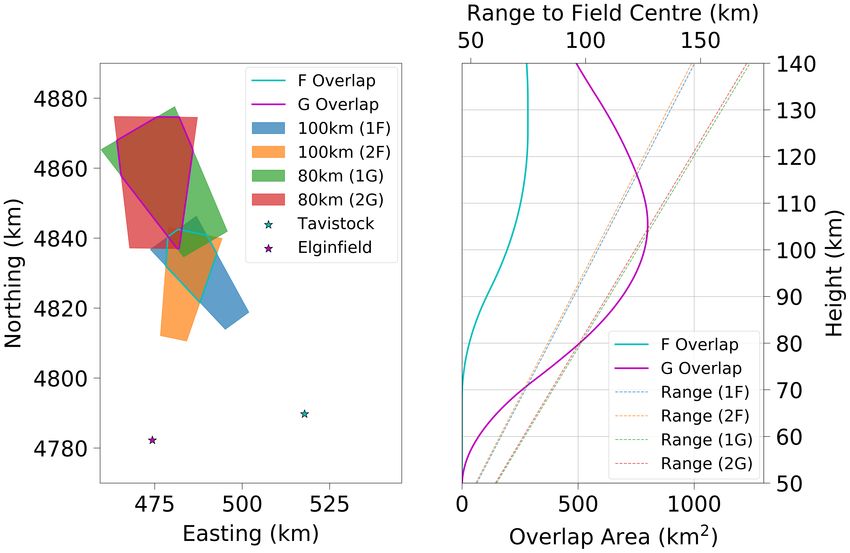
Iron Rain: measuring the occurrence rate and origin of small iron meteoroids at Earth 3
serand parameters and low inclinations of these objects suggests
asteroidal origins, the possibility that they evolved through radia-
tive forces into these orbits from more cometary-like orbits cannot
be ruled out.
 One scenario is that the population originally possessed
Jupiter-family type orbits, which then shrank and circularized
through Poynting-Robertson drag, and dynamically decoupled from
Jupiter. The timescale to move from J < 3 to J > 3 would be of or-
der 105 years under PR effects (Subasinghe et al. 2016) for mm-sized
iron meteoroids. The moderate eccentricities of the small number
of published low, slow meteoroids with iron ablation characteristics
suggest, however, that PR drag has not had a dominant effect on
these orbits, though they tend to be more circular than the remain-
ing population. The variety of orbits seen in irons of which there
are spectra, be they Jupiter-family, sun-approaching, or Halley-type
irons, point to complex orbital evolutions (Vojáček et al. 2019).
 The goal of the present study is to constrain the fraction of iron
 Figure 1. Two EMCCDs located at Elginfield Observatory (encased in
meteoroids in the mm size range impacting the Earth, and to explore
 aluminium housings for temperature and dust control).
their likely origin. In contrast to prior studies, we focus on the small-
est meteoroid population detectable with optical instruments using
a statistical—rather than event-by-event—approach. In particular, Our camera system consists of four Nüvü HNü 1024 EMCCD
we wish to survey the abundance of irons as a function of entry cameras situated across two sites: Elginfield (43.264◦ N, 80.772◦ W)
speed, size/brightness and orbit-type, thereby requiring significant and Tavistock (43.194◦ N, 81.316◦ W) in southwestern Ontario,
number statistics. Canada. The EMCCDs were operated at 16.7 fps in 1x1 binning
 To accomplish this goal, we analyze 34761 two-station video (1024x1024 pixels) between January 2017 and March 2018, then
meteors detected down to a limiting peak magnitude of +7 (with 32.7 fps at 2x2 binning (512x512 pixels) after March 2018. All
measured light curves as dim as +8) that were recorded during a four- imagery is 14-bit depth. Camera specifications are given in Table 2.
year automated survey. Motivated by the work of Čapek et al. (2019), The cameras begin to show saturation effects near meteor magni-
we develop selection criteria based on the ablation behaviour of in- tudes of +1. For example meteor images and more details about the
dividual meteors to isolate probable iron meteoroids. These criteria system see Vida et al. (2020).
include: comparatively low begin heights as a function of velocity, When the transmission of lenses used (Nikkor 50 mm f1.2)
short trajectories, early brightness peaks, and limiting values for is convolved with the camera’s response function, the system has a
intercepted air stream kinetic energy per unit cross-sectional area. usable wavelength range of 350 nm to 900 nm, with peak sensitivity
 Section 2 summarizes the observational methods used to de- around 550 nm. The stellar magnitude limit per frame is +10.5,
tect meteors, and briefly outlines how data processing is performed and the meteor magnitude limit is between +8 to +9, depending on
on video data. In Section 3 we further outline the ways in which angular velocity.
we distinguish iron meteoroids from the general population. In Sec- The EMCCDs are paired such that two fields of view are both
tions 4 and 5 we discuss the various properties of our selected iron observed from across the two sites as shown in Figure 2. One pair of
candidates, including abundances and orbital characteristics, and cameras is high pointing (labelled F) and the other is low pointing
address the question of detection biases. (labelled G). The F cameras’ overlapping field of view has 150 km2
 of overlapping area at an altitude of 100 km while the G cameras
 cover over 200 km2 of overlapping area between 70 km to > 120
2 EQUIPMENT AND DATA COLLECTION km. All EMCCD cameras are pointed north to avoid illumination
 from the moon and light pollution from population centres.
2.1 Optical Cameras
 As one instrument suite in the Canadian Automated Me-
To extend our survey to the faintest possible optical meteor mag- teor Observatory (CAMO) system, the EMCCD cameras are au-
nitudes, where earlier surveys hint at an increase in the fraction of tonomous. As part of normal operations, a separate guide camera
iron-rich meteoroids (e.g. Kaiser et al. 2005), we use visible-band, monitors the instrumental magnitude of Polaris with a cadence of
low-light sensitive Electron Multiplied Charged Coupled Devices 10s to detect cloudy conditions. When conditions are optimal (no
(EMCCDs), pictured in Figure 1. As we require trajectories, orbits, moon, cloud, rain, high wind, or twilight), observations with the
and complete lightcurves, we use a two-station, automated setup EMCCDs commence and are stored and automatically processed.
with four EMCCDs total, which are paired to overlap at moderate More information on the CAMO system automation control and
(100 km) and lower (80 km) heights. weather monitoring can be found in Weryk et al. (2013); Vida et al.
 EMCCDs function similarly to traditional CCD detectors, but (2021).
upon detection of photoelectrons, secondary electrons are produced. We apply both flats and biases to our imagery to obtain light
The signal is multiplied and read noise no longer contributes to curves. We have observed that flat-field images do not change sig-
the signal (Tulloch & Dhillon 2011). Moreover, EMCCDs have nificantly with time (on scales of months) and so they are updated
low dark current and can operate at higher clock frequencies than manually as needed. Astrometric pointing may drift slightly over
CCDs. The EMCCD cameras use a back-illuminated sensor, leading much shorter periods of time than the flat and bias images. Auto-
to very high quantum efficiency (≈95%). The use of EMCCDs in matic astrometry plates are generated and used for processing with
astronomical applications allows for photon counting of dim sources a cadence of 10 min each night for each camera.
at high speeds—an optimal combination for fast meteor photometry.

MNRAS 000, 1–13 (2021)
4 T. Mills et. al.

Table 1. Summary of literature estimates of Iron meteoroid abundances with size/magnitude/mass.

 Reference Size/mag/mass Iron Fraction Technique

 Maurette et al. (1987) > 50 m 2% Greenland ice cap melt zone
 Taylor & Brownlee (1991) > 100 m 1% Greenland ice cap
 Taylor & Brownlee (1991) > 100 m 26% Deep sea collection
 Taylor et al. (2000) > 50 m 2% Antarctic well collection
 > 100 m 1%
 ReVelle (1994) 10 < m < 280 g 3% Photographic networks
 Borovička et al. (2005) 1 < s < 10 mm 14% Spectral survey
 Campbell-Brown (2015) M < +3 3% Video survey
 +3 < M < +6 6%
 Vojáček et al. (2015, 2019) -5 < M < +3 9.9% Spectral and video survey
 Matlovič et al. (2019) -14 < M < -1 0.5% Spectral and video survey
 Vojáček et al. (2020) 1 < s < 4 cm 3.6% Spectral and video survey

Table 2. EMCCD Camera stations. See text for more details. 2.2 Data Processing
 All raw image data gathered by the cameras each night is stored
 Specification
 in a large ring buffer. Each camera records 10 minute blocks of
 Location 1 (Lat., Long.) 43.264◦ N, 80.772◦ W video throughout the night and these base files are processed once
 Location 2 (Lat., Long.) 43.194◦ N, 81.316◦ W data collection finishes in the morning. Data rates are 1 GB/min per
 Pointing 1F/2F (Alt., Az.) 64.9◦ , 322.8◦ / 65.8◦ , 6.6◦ camera. Detection of meteors is performed using a hybrid approach
 Pointing 1G/2G (Alt., Az.) 47.0◦ , 329.7◦ / 47.2◦ , 359.7◦ consisting of a fast front-end clustering/tracking algorithm that cues
 Camera Nüvü HNü1024 a matched filter measurement refinement and false alarm mitigation
 Sensor Teledyne e2v CCD201-20
 process, collectively called DetectionApplication (DetApp) (Gural,
 Pixels 1024x1024 13 m
 in preparation).
 Digitization 14-bit
 Readout Noise < 0.1 − Per frame output from DetApp includes a positional measure-
 Dark Current @ -85◦ C 0.0004 e− /pixel/s ment estimate of the leading edge of meteor trails, the background
 EM Gain up to 1000 (200 operational) subtracted summed intensity of the visible trail, and a maximum
 Quantum Efficiency ca. 95% likelihood estimate from the matched filter processing. Only events
 Framerate (1x1/2x2) 16.7/32.7 fps with at least 4 detectable frames are retained. Apparent frame to
 Lens Nikkor 50 mm f/1.2 frame motion must be at least 2 pixels (to exclude satellites) but no
 Field-of-View 14.7◦ x14.7◦ more than 150 pixels (maximum apparent angle rate for meteors
 Plate Scale (1x1/2x2) 51.7"/103.4" per pixel given the focal plane characteristics).
 Resolution at 100 km (1x1/2x2) 25/50 m
 For our data pipeline, the individual camera photometric offsets
 Stellar Magnitude Limit +10.5
 are automatically computed at the time of each event and applied to
 Meteor Peak Magnitude Limit +7.0
 each meteor’s lightcurve. A candidate detection is declared if a user
 defined excursion of clustered pixel points above the background is
 reached (typically 1.5 above the mean). A matched filter refine-
 ment is then applied to define the orientation and length of the trail
 along the meteor’s multi-frame track. The matched filter template
 requires the use of a motion propagation model. We have chosen a
 constant acceleration motion model across the focal plane to handle
 the geometric effects of foreshortening or lengthening from view-
 ing geometry changes, and some level of meteor deceleration if
 present. No empirical model can mimic true meteor deceleration,
 but for these narrow field of view systems, the bulk of the velocity
 change is geometric. The resultant fit is made to the actual meteor
 trail per frame including an estimated and convolved point spread
 function, giving a best estimate of the leading edge of the meteor.
 Finally, the meteor track is extended at the start and end of the track
 such that all pick points above background noise are included in the
 photometric light curve.
Figure 2. Field coverage projected onto a UTM grid in the atmosphere at
 Comparison of the resulting speeds with manual reductions
100 km height for the F camera pair, and 80 km for the G camera pair from
 shows good agreement, generally better than 1 km/s at typical me-
Elginfield (leftmost station represented by star) and Tavistock (rightmost
location) (left sub-plot). In the right sub-plot, the overlap areas as a function teor speeds (30 km/s). This is far below the level at which orbit types
of height is shown for EMCCD camera pairs as well as the apparent range are likely to switch between major parent populations (HTC, JFC,
to the field centre at each height. asteroidal), our main concern in this study. However, care should
 be taken if these automated speeds are used for high precision orbit
 measurements - in those cases comparison with manual reductions

 MNRAS 000, 1–13 (2021)
Iron Rain: measuring the occurrence rate and origin of small iron meteoroids at Earth 5
 due to perspective effects. For these specific events, the number of
 points required to fit a constant acceleration was lowered and the
 trajectories and orbits were recalculated. Only events that initially
 reported positive spatial accelerations were reprocessed this way;
 other erroneous trajectories can occur when a short approximately
 constant velocity meteor is assumed to be decelerating. About 7400
 meteors were flagged as accelerating and reprocessed again. In most
 of these cases only one station initially reported acceleration. The
 resulting change to orbital elements in most cases was quite small,
 but the correction applied nonetheless.
 An additional complication in computing trajectories is algo-
 rithm specific. Pylig compares the velocities of multiple sites to
 make sure that they are consistent at each point in time. It therefore
Figure 3. An example of the time change of photometric magnitude zero requires that a minimum of four overlapping points of a meteor’s
points of two paired cameras at different sites over the course of a single
 trajectory are observed between the stations. If there is a gap be-
night (August 21st, 2020). Here each symbol represents a detected meteor,
 tween the portions of a meteor that Pylig observes, Pylig is unable
whose zero-point is dynamically computed per meteor event. All reference
magnitudes for calibration are from the Gaia catalogue (Gaia Collaboration to find a solution. As a check on the Pylig solutions, a constant
et al. 2016). velocity model (Gural 2012) was also employed.
 The Gural solution uses an empirical meteoroid velocity
 model, so it is able to solve trajectories with interruptions in the ob-
should be undertaken. Data were collected in this way through the servation. However, such a velocity model will not perfectly match
end of 2020 with the survey beginning in Jan 2017. observed behaviour and makes assumptions about the dynamic be-
 Due to the large volume of data captured and processed for haviour of the meteoroid (Egal et al. 2017). For this reason, after
each night of EMCCD video, only detected event video snippets are reprocessing as many events using Pylig as possible, the Gural so-
saved to long term storage. Median images of the begin and end time lutions were used in cases where Pylig failed to match any timing
around meteor events were used to find the photometric offsets from offsets and such events were flagged. In general, comparison of the
this save-limited data. In total sixty frames of data bracketing the Pylig and constant velocity model fits for common meteor events
begin and end of an event (roughly 2 sec) are meteor-free and close produced very similar initial speeds, so this trajectory substitution
enough in time that stars can be measured and compared against the for cases where two sites did not have overlapping time of observa-
Gaia G-band magnitude to obtain an accurate photometric offset per tion is expected to produce only minor changes to the initial orbital
event. In the situation where an offset was unable to be computed elements.
for a particular event the next closest offset in time on that camera
and date was used. Figure 3 shows an example of the zero-point
photometric drift computed this way on a night with good seeing. 3 DISTINGUISHING IRON METEORS
 Astrometric measurements are done using an affine automated
plate fit to third order between focal plane x,y coordinates and Gaia The best means to distinguish iron meteoroids from among the gen-
G catalogue star positions, updated every ten minutes. Typical rms eral meteoroid population is through the use of spectra (Borovička
residuals are less than 0.01◦ . Details of the plate transform and fit et al. 2005). This produces a robust means of distinguishing pure
approach can be found in Weryk & Brown (2012). (or primarily) iron material from chondritic-like objects. However,
 Individual camera events at each site were correlated across for a given sensitivity instrument, spectral measurements are only
sites to find true meteors. Initial cross-site correlations were grouped possible on comparatively bright meteors.
by time (with an acceptance window of 2 sec). A secondary filter Past spectral surveys, for example, (e.g. Borovička et al. 2005;
removed any meteors which were found to have begin heights above Vojáček et al. 2015) are typically limited to meteors of peak bright-
160 km or below 60 km, end heights above 120 km or below 50 ness +2 or brighter, with the majority of meteor spectra brighter
km, and initial velocities above 90 km/s or below 6 km/s. The or- than this limit and hence appropriate to meteoroids significantly
bital and trajectory solutions for the remaining "good" meteors were larger than mm in size. To probe the fraction of irons at the faintest
computed using WesternMeteorPyLib (Pylig) (Vida et al. 2019) 1 . possible optical magnitudes precludes spectral methods. Instead,
In total, 55707 two-station video meteors were computed after ap- we adopt quantitative metrics based on the shape of the lightcurve,
plying our initial filters. This number is lowered to 34761 when only beginning height of ablation, and trail length to isolate probable
considering meteors whose beginnings and endings are observed in iron meteoroids. These criteria are adopted based on prior work
at least one camera, which ensures full light curves and accurate (Čapek et al. 2019) where simultaneous spectra were available to
trajectory lengths as the entire trajectory has been observed to our truly distinguish irons and therefore empirically and theoretically
limiting sensitivity (see Section 3). calibrate these quantities. The iron ablation model proposed in that
 However, to ensure data quality with respect to orbit measure- work best described smaller irons with magnitudes fainter than zero,
ment, an additional check was incorporated. During detection, if a appropriate to our study.
meteor has too few points to fit a constant acceleration model with One metric of a meteor’s ablation behaviour is the F parameter,
the matched filter, it is assumed that the meteor has a constant ap- which is the ratio of the distance between the begin height and height
parent angular velocity over such a short length. These short events of peak brightness to the distance between the begin and end heights
can result in positive spatial accelerations in their Pylig solutions (total height extent of the trail). This can be expressed as:
 B − peak
 H = (1)
1 Code accessible from: https://github.com/wmpg/WesternMeteorPyLib B − E

MNRAS 000, 1–13 (2021)
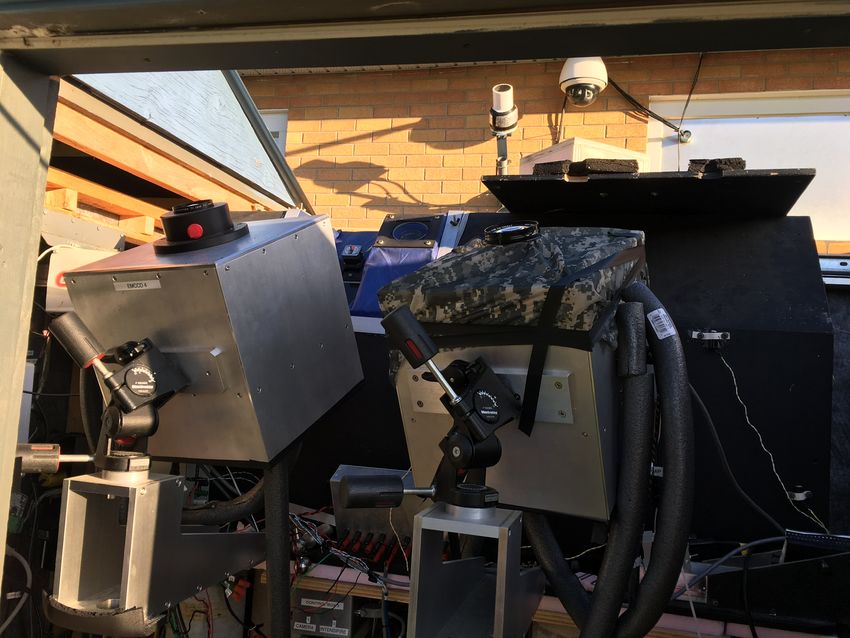
6 T. Mills et. al.
where B , E , peak are the begin height, end height, and height
of peak brightness, respectively (Koten et al. 2006).
 F parameter values range from 0 to 1, with 0.5 representing
symmetrical light curves which peak in the middle. Ideal, single-
body meteors tend to have late-peaking lightcurves with F parame-
ters around 0.7, and dustball-type meteors are more symmetric with
F parameters of 0.5 (Ceplecha et al. 1998). In contrast, Čapek et al.
(2019); Vojáček et al. (2019) found that many (though not all) irons
that were identified by their spectra show early light curve peaks,
and will thus have low F parameters. As a point of reference, 45
iron candidates identified by Čapek et al. (2019) had an average F
parameter of 0.31 ± 0.04. They note that some of their spectrally
identified irons have higher F parameters.
 In addition to early peaking lightcurves, Čapek et al. (2019); Figure 4. Density of iron-like meteors, binned by accumulated energy per
 area and velocity. Plotted meteors have F parameters of less than 0.31 and
Vojáček et al. (2019) found that irons also tend to have short lu-
 luminous trajectories shorter than 9 km. An energy per area line of S = 4
minous trajectories compared to meteors of similar total integrated
 MJm−2 for vertical entry is plotted in green, under which are the majority
brightness/mass. These short trail lengths are a natural outcome of of iron candidates meeting our trail length and F parameter criteria.
the proposed ablation model of Čapek et al. (2019) whereby the
rapid removal of liquid iron from ablating iron meteoroids more
quickly removes mass as compared to normal thermal ablation iron meteoroids was ≈ 8 MJm−2 (see their Figure 7). Because irons
through vaporization. This melting as a primary mode of ablation is also conduct heat inward, and the ratio of volume to cross-sectional
very efficient at quickly removing material giving rise to both low area scales with radius, we expect our smaller-volume irons to have
F parameters and short luminous trajectories. lower accumulated energies per area.
 From the foregoing results of the work of Čapek et al. (2019); The value 4 MJm−2 was chosen such that all iron candidates
Vojáček et al. (2019), we distinguish iron meteoroids from other identified in Vojáček et al. (2019) and only the low-beginning me-
populations in our video data by selecting events with F parameters teors of Figure 4 had higher accumulated energies per unit area.
below 0.31, and trajectories shorter than 9 km—both are the average Moreover, the only significant number of non-iron meteors with
value for iron candidates in Čapek et al. (2019). The 9 km limiting higher accumulated energies in Vojáček et al. (2019) than this value
length could have been set higher; for the lowest begin heights, the were on sun-approaching orbits (which we find almost none of our
F parameter does not strongly change with trajectory length (see iron events displayed as discussed later), and Halley-type events that
Section 4). Both discriminators have exceptions; it is possible for constitute a small fraction of our final iron population (with none at
irons to have higher F parameters and longer trajectories. But by low speeds where our iron population dominates).
choosing conservative cutoffs and imposing multiple conditions we Note that we incorporate the entry angle per event in computing
can have high confidence that our selected iron candidates are in fact this value (so the line above may be slightly lower for lower entry
iron meteors, though our resulting numbers are likely lower limits. angle events). We require that our iron meteoroids must begin at
 To further strengthen our selection process, there is one more lower heights; thus this S constraint is another discriminator to
iron discriminator used in this study. As the heat of vaporization of isolate possible iron meteors because the energy required for them
iron is significantly higher than its melting point, an iron must first to ablate is so high.
melt to begin spraying droplets. Additionally, when an iron mete- We note that the only other spectral class of meteoroids which
oroid is heated, a significant amount of heat energy is conducted have similarly high energy per unit area interception values for
inwards. More energy is therefore needed to bring the surface layer onset of fragmentation/erosion are the sodium-free meteoroids
of the meteoroid to its melting temperature (Vojáček et al. 2019). (Borovička et al. 2005; Vojáček et al. 2019). This implies there
 To acquire this extra energy, irons must penetrate deeper into may be some contamination when selecting irons from this pop-
the atmosphere as compared to regular stony meteoroids. The energy ulation using our criteria. Fortunately, the Na-free population has
( S ) accumulated by a single body meteoroid from collisions with distinct orbital characteristics (Vojáček et al. 2019; Matlovič et al.
atmospheric molecules per cross-sectional area is given by: 2019), being in almost exclusively sun-approaching orbits ( < 0.2
 ∫ ∞ AU), intermediate perihelia ( < 0.4 AU) for larger cm-sized irons,
 1 2
 S = Λ (ℎ)dℎ (2) or Halley-type orbits (e.g. alpha Monocerotids; Borovička et al.
 2 sin ℎ0 2005). This may be used to further discriminate between the iron
Where is the initial velocity (which we approximate as constant and Na-free populations and is further discussed in Section 5.1.
over the luminous trajectory), is the atmospheric density as a While previous studies have noted that meteors classified spec-
function of height ℎ, is the elevation angle from horizontal, and trally as irons tend to be in asteroidal orbits and have low entry
the integral is from the begin height ℎ0 to infinity (Borovička et al. velocities, we do not use these properties as iron discriminators,
2007). We assume the heat transfer coefficient Λ from the air stream but restrict ourselves to physical attributes specific to the ablation
is unity, a reasonable assumption for meteoroids in free-molecular process. While asteroidal origins are the most obvious parent can-
flow conditions appropriate to our data (Popova et al. 2019). didates, the possibility still exists for iron meteoroids to come from
 Figure 4 shows the number density of iron-like meteors binned other sources, possibly on highly evolved orbits. For example, Vo-
by speed and accumulated energy that are isolated as likely irons jáček et al. (2019) noted two irons on Halley-type orbits.
utilizing the F parameter and trajectory length cutoffs previously From all the foregoing, we argue that regardless of orbit, the
described. Also shown is an energy per area isocurve corresponding above discriminators—low F parameter, short luminous trajectory,
to S = 4 MJm−2 for vertical entry. Vojáček et al. (2019) found and high accumulated energies per area—are reasonable physi-
that the energy per unit area needed to begin spraying droplets for cal proxies of ablation to distinguish iron-rich meteoroids from

 MNRAS 000, 1–13 (2021)
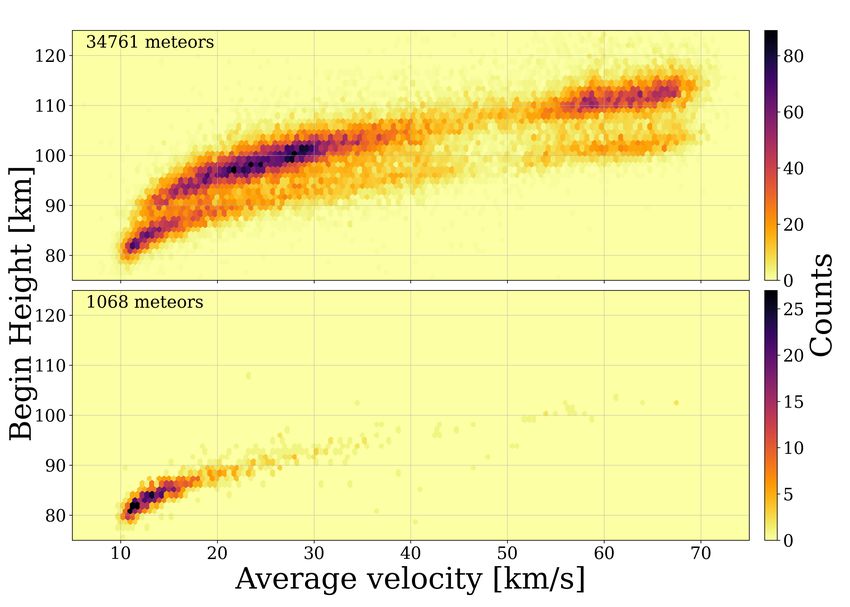
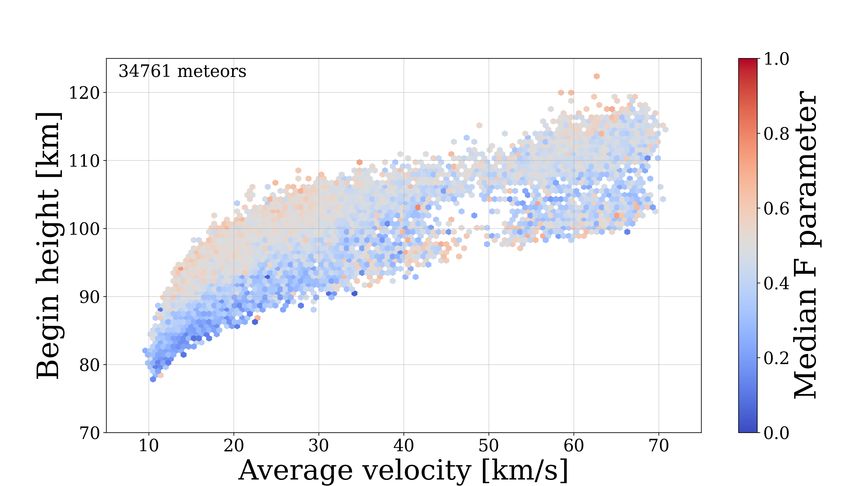
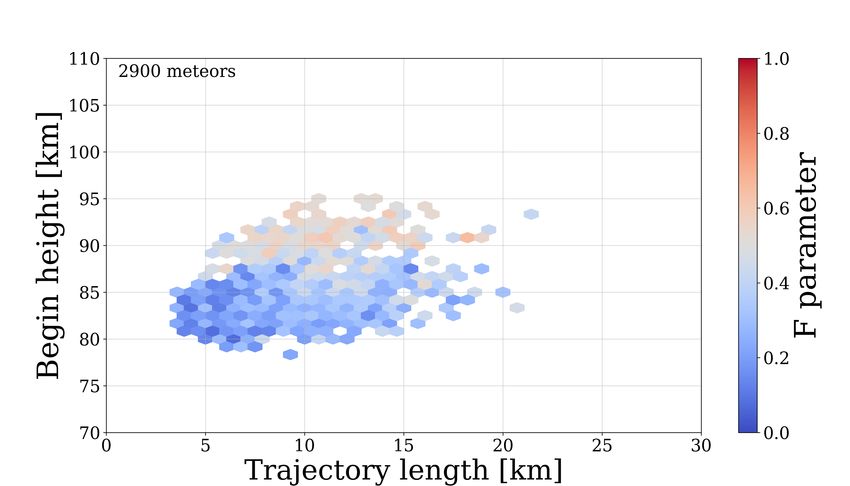
Iron Rain: measuring the occurrence rate and origin of small iron meteoroids at Earth 7

Figure 5. Density plot of begin height as a function of velocity for all
meteors (top panel) and iron candidates (bottom panel).

 Figure 7. Median binned F parameter (left axis) across different begin
 heights (vertical bars) for the four lowest velocity bins. All meteors must
 have their beginning and ending observed in at least one camera. The number
 of meteors in each bin is shown by the dotted line and the right hand axis.

 with this type of structure may release their grains before significant
 thermal ablation occurs and would have F parameters of around 0.5
 (Hawkes & Jones 1975).
 In contrast, refractory material, which need higher temper-
 atures to commence ablation, begin at lower heights. We might
Figure 6. Median binned F parameter across different begin heights and expect this material to possess larger F parameters as they will ab-
average velocities. All meteors must have their beginning and ending ob-
 late more nearly as single body theory predicts, with an F parameter
served in at least one camera, and three meteors must be present in a bin to
be plotted.
 close to 0.7 (Beech 2009). However, we find a strong trend of low F
 parameters at low begin heights, a result similar to Campbell-Brown
 (2015). This indicates that the low, slow population of meteors ab-
cometary and stony material. Thus we aim to correlate the orbital lates quickly and shows sudden onset in luminosity. Together with
origins of small iron meteoroids using these metrics. the low begin height, this is suggestive of a population dominated by
 iron-rich material ablating through melting, rather than refractory
 stony material, as first suggested by Borovička et al. (2005).
4 RESULTS In Figure 7 we see trends in the median F parameter as a
 function of begin height in fixed entry velocity windows. We see
In Figure 5 we show the relative number density of meteor begin a clear tendency for F to be low at lowest heights and then reach
heights, for all meteors and our iron candidates, as a function of a constant value near 0.5 above 90 km. We interpret this to reflect
velocity. The most obvious feature is the well-known bifurcation in the transition to the higher, weaker dustball population where early
the meteoroid population (Ceplecha 1988) between cometary-type fragmentation dominates the lightcurve shape.
material (higher band of begin heights) and stronger, asteroidal-type An interesting feature in Figure 7, most visible in the lowest
material (lower band of heights). speed bin, is an apparent increase in median F at the very lowest
 We begin by examining the trend in F parameter with begin begin heights. In general these still fall below our F cutoff of 0.31,
height among these populations as a function of speed for our entire but the local peak could be an indication of a mixed population
dataset of 34761 meteors with complete lightcurves as shown in of iron meteoroids with a non-iron refractory population ablating
Figure 6. Here each symbol represents the median F value for all more as single bodies, driving the median F higher. It could also
meteors falling in a particular hexbin. reflect differences in iron ablation behaviour with height. A weaker
 There is a gradient of decreasing F parameter with decreasing similar feature is visible in the higher speed bins, but small number
begin height, seen most strongly at low speeds. From prior work statistics preclude any clear interpretation.
(e.g. Jacchia 1958; Ceplecha 1968; Jones 1985; Ceplecha 1988) One obvious means of creating a small F parameter is through
begin height of ablation is a strong proxy for distinguishing between sudden release of grains. However, it is difficult to reconcile such a
physically distinct meteoroid populations. A priori, we expect at process with the low begin heights we observe for the dominant low-
the higher begin heights the lower density, weaker/lower material F population; catastrophic grain release is associated more generally
strength, and dustball type meteors to begin ablating due to the lower with weaker material. An alternative explanation is that these rep-
energy needed for the onset of ablation (Ceplecha 1958). Meteors

MNRAS 000, 1–13 (2021)
8 T. Mills et. al.

Figure 8. Begin height as a function of total path length showing median F Figure 9. Distribution of peak magnitudes for iron (red) and the entire
parameter for meteors with measured speeds from 10-15 km/s. population as a whole. The effective survey completeness is to an absolute
 magnitude of +6 at low speeds using the methodology described in (Vida
 et al. 2020), falling to +5 at 60 km/s.
resent iron meteors. Iron meteors only become visible after melting
(Čapek et al. 2019) and also begin deep in the atmosphere (Vojáček
et al. 2019) and are therefore more consistent with the observed
behaviour of the low, slow population.
 That some form of fragmentation is causing the low-F parame-
ter is further supported by the apparent trail lengths of meteors as a
function of F as shown in Figure 8. This figure shows only meteors in
the 10-15 km/s velocity bin, where the low-slow population is most
numerous, but the trend is similar in higher velocity bins. There is a
noticeable correlation between low begin heights, short trail lengths
and the smallest F-parameters. This suggest that meteors skewing
to early brightness peaks have shorter trails lengths, as expected for
fragmenting meteoroids. The trend in the figure also supports our
adoption of 9 km limiting trail lengths, as the median F remains low
even at longer trail lengths. This is consistent with the behaviour
 Figure 10. Fraction of the entire population (open dark histogram) that are
expected for iron meteors, though the fragmentation would in this
 iron candidates (red vertical bars) at different speeds.
case be in the form of iron droplets (Čapek et al. 2019).
 Using our criteria adopted earlier to identify probable irons,
we select only meteors with < 0.31, luminous trajectory lengths
 < 9 km, and energies accumulated per unit cross-sectional area
before the beginning S > 4 MJ. This produced 1068 total candidate
iron meteors from among our total sample of 34761.
 Figure 9 shows the distribution of peak magnitudes for the
iron and entire population across all speeds. The overall survey is
complete to an absolute magnitude of +6 at low speeds, falling to
+5 at high speeds (60 km/s). This corresponds to masses of order
10−5 kg at speeds of 15 km/s (assuming a fixed luminous efficiency
of 0.7%) and approaches 10−7 kg at speeds of 60 km/s.
 Figures 10 and 11 show the raw measured proportion of me-
teors that meet our criteria to be categorized as probable irons
compared to the total population. At the lowest speeds, these iron
candidates represent 20-25% of all slow, mm-sized meteors be- Figure 11. Raw, observed fraction (red vertical bars) of the entire popu-
tween 10-15 km/s. At higher speeds (> 20 km/s) the fractional lation (open histogram) that are iron candidates at different peak absolute
 magnitudes in the 10-15 km/s velocity range. The total number of counts
values quickly fall to a few percent or less. There are a small num-
 per bin is shown by the open histogram and right hand axis.
ber of potential iron candidates even at very high speeds. This may
represent a small population of irons on Halley-type orbits as has
been previously noted (Vojáček et al. 2019) or may be contamination shows the distribution of J for iron and non-iron meteoroids with
from the Na-Free population. entry speeds from 10-20 km/s, where irons are most abundant. As
 these cover the same range of velocities, there is no a priori reason
 the orbital distributions should differ for purely dynamical reasons.
5 DISCUSSION It is clear there is a strong cut-off in irons for J < 3, whereas a
 significant tail extends below 3 for the non-iron population. It is clear
5.1 Orbital Characteristics there is some JFC (and even HTC) material at these speeds in the
The iron candidates chosen with the trajectory parameters outlined non-iron population while essentially none in the iron population.
in Section 3 overwhelmingly possess asteroidal orbits. Figure 12 Note that PR drag will tend to move objects from low to higher

 MNRAS 000, 1–13 (2021)
Iron Rain: measuring the occurrence rate and origin of small iron meteoroids at Earth 9

Figure 12. The Tisserand parameter with respect to Jupiter ( J ) for iron can-
didates (red) and non-irons (blue) between 10-20 km/s. The iron population
shows a significant drop across the J < 3 boundary (vertical dashed line).

 Figure 15. Median eccentricities of all meteors across begin height in slow
 velocity windows. At the slowest velocities where iron candidates are most
 abundant, the median eccentricity lowers.

 This gradient in eccentricity is further evident in Figure 15
 where the median eccentricity as a function of begin height in finer
 velocity intervals is shown.
Figure 13. The eccentricity distribution of iron candidates (red) and non-
 Figure 16 compares the B and J parameters of iron candidates
irons (blue) between 10-15 km/s, and 15-20 km/s. Iron counts in the bottom and non-iron candidates with entry speeds between 10 to 30 km/s.
panel have been scaled by a factor of 10 for easier visual comparison. The B parameter is a different measure of the energy required
Irons have systematically lower eccentricities than the rest of the population for ablation, and can be used to coarsely classify compositional
between 10-15 km/s. populations of meteoroids (Ceplecha 1967, 1988). It is given by:
 = log + 2.5 log ∞ − 0.5 log cos (3)
 Where is the atmospheric density at the begin height, ∞ is
 the initial velocity and is the zenith angle. By enforcing high
 S values on our iron candidates they will naturally have high B
 parameters. The Tisserand parameter with respect to Jupiter on the
 other hand is independent and shows a stark cutoff at a value of 3.
 The iron candidates are dense, asteroidal material that are distinct
 from the blend of populations at the same velocities.
 While the iron-candidates appear to be a distinct population
 of meteoroids, there is a possible degeneracy with Na-free and
 Na-poor type meteoroids. Borovička et al. (2005), and Vojáček
 et al. (2019, 2015) both note a population of refractory material
 that lacks Na lines in their meteor spectra. It is unclear whether
Figure 14. The semi-major axis distribution of iron candidates (red) and non- this population would have short trajectories or low F parameters
irons (blue) between 10-15 km/ and 15-20 km/s. Irons have systematically similar to irons, but they would have high S values. These Na-free
lower semi-major axis than the rest of the population. and poor classes of meteoroids, however, can be broken down into
 two orbital sources: sun-approaching and cometary. Specifically, the
 vast majority of Na-free meteors have perihelion distances < 0.2
with time; hence the non-irons to the left of the J line are clearly
 AU. From Table 3, only a small portion of our iron candidates are
from JFC parents and comparatively young.
 on sun-approaching or Halley-type orbits. We conclude that there
 The inclinations of both populations in this velocity window
 is not significant contamination of Na-free or Na-poor meteors in
are also low, with irons showing slightly lower inclinations than
 our selected iron population, which has dominantly asteoridal-orbit
non-irons. A more dramatic difference is visible in the eccentricity
 characteristics.
and semi-major axis distributions as shown in Figures 13 and 14.
Here we break down the distributions into 10-15 and 15-20 km/s
bins to illustrate the large difference between the iron and non-iron
populations, the former being on smaller, more circular orbits.

MNRAS 000, 1–13 (2021)
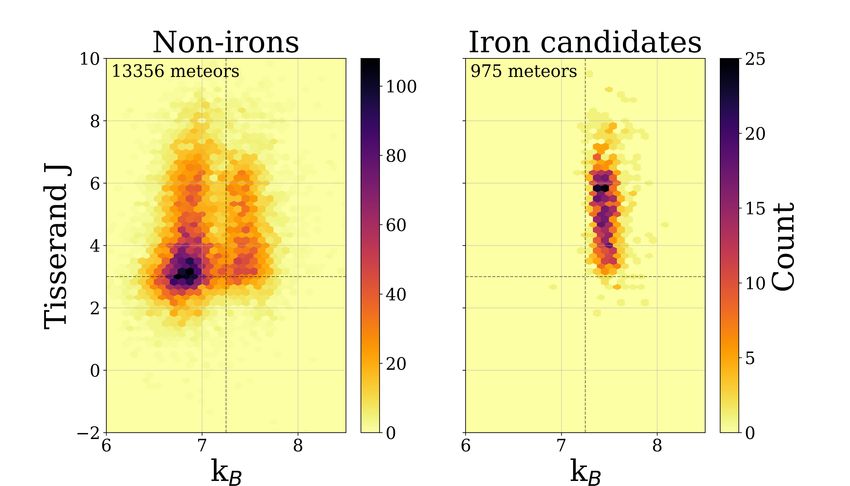
10 T. Mills et. al.

Table 3. Orbits of iron candidates and non-irons following the classification
scheme of Borovička et al. (2005).

 Orbit Iron candidates Non-irons
 Total counts 1068 33641

 Sun-approaching 1.7% 5.4%
 Ecliptic shower 0% 0.5%
 Halley 2.8% 38.7%
 Jupiter family 0.7% 2.1%
 Asteroidal-chondritic 96.2% 65.8%

 Figure 17. Cumulative, normalized histograms of iron candidates and non-
 irons at 10-15 km/s. Meteors with peak magnitudes brighter than +1 magni-
 tude are excluded due to saturation effects. At the lowest speeds and higher
 energies, iron candidates grow in abundance with decreasing energy quicker
 than the general population.

 meteoroids is ejection before PR effects allow dynamical decoupling
 (Dikarev et al. 2002; Nesvorný et al. 2011) or collisonal disruption
 on much shorter timescales (Jenniskens 2008) before significant
 orbital circularization occurs. For the iron candidate meteoroids
 in our survey, sizes range from several mm up to a cm. The PR
Figure 16. Tisserand parameter with respect to Jupiter versus the B param- timescale for iron-objects to reach such low eccentricities from
eter at velocities between 10 and 30 km/s. B = 7.25 and J = 3 marked to JFC-like orbits is of order 107 years.
illustrate the cutoff of iron candidates, which are primarily asteroidal. For such large particles from the main-belt to reach the Earth
 purely through PR drag takes close to 108 years. This timescale
 is an extreme upper limit as objects in NEA-like Earth crossing
5.2 Possible Origin
 orbits have dynamical lifetimes of
Iron Rain: measuring the occurrence rate and origin of small iron meteoroids at Earth 11

Figure 18. The de-biased fraction of iron candidates (red filled bars) as a Figure 19. Mean peak height versus peak magnitude for iron candidates and
function of magnitude (in 0.5 mag bins) with entry speeds between 10-15 non-irons between 10 - 15 km/s, with counts shown above. The difference
km/s. The total number of events per 0.5 magnitude bin is shown on the in peak height between irons and non-irons is consistently between 0.5 -
right hand axis as the unfilled grey histogram. 1.5 km between +7 - +4 magnitudes. The uncertainty bounds represent the
 standard deviation of the population in a given bin.

km/s goes from 21.1% to only 21.9%. The number of meteors with
weightings over 10 makes up 1% of the sample. If the maximum these same normalized and summed spectra, but convolved with
weight of 100 is used instead, < 0.1% of meteors are excluded and our camera system’s response function, all in arbitrary magnitude
the fraction of iron candidates drops to 18.6%. In this case, a few units. While there are only a few iron spectra in this dataset, they
outliers impact the final weighted count, but the overall fraction of do fall above and below the centre of this photometric comparison
iron candidates still only changes by a few percent. However, the line. This variety suggests that iron meteors are not biased towards
fraction as a function of magnitude changes more significantly. We brighter or dimmer observed brightness in our EMCCD cameras,
settle on using a maximum weight of 10 for our final counts in and so the weighted counts as calculated above are still robust.
Table 4. Figure 18 shows the trend in the de-based fraction of iron While there is no bias due to the spectra of iron meteors com-
candidates as a function of absolute magnitude. pared to non-iron meteors, we can exploit the differing spectra to
 In addition to the overlapping area at different heights, the range better isolate irons via colour (Moorhead & Kingery 2020). Using
can also bias our sample. The brightness of a meteor is proportional the same data from Vojáček et al. (2019), a colour comparison can
to the inverse of the range squared. Dim meteors far away from the be seen in Figure 21. Along the x-axis is the instrumental mag-
cameras could therefore be lost. All meteor absolute magnitudes nitude of these meteors in our camera system, but on the y-axis
are calculated using a reference range of 100 km. Simply, meteors we also convolve the spectra with a standard Johnsons-Cousins R
with ranges under 100 km will be more easily detected than meteors colour filter and subtract the original instrumental magnitude. The
at ranges over 100 km. However, counter to this bias, only larger, resulting colour clearly distinguishes irons from the general meteor
brighter material will survive to low heights, also corresponding to population. Two matching cameras with the same field of view,
low ranges. Hence at any given height we observe a mass filtered with one being R-filtered, could theoretically distinguish iron me-
fraction of the total mass distribution impinging at the top of the teors by watching for meteors that are significantly dimmer in the
atmosphere. filtered camera. We have begun such observations, but have not yet
 To determine if this is a significant bias, in Figure 19, the mean accumulated enough events to construct a further analysis of the
peak height versus peak magnitude is shown for both iron and non- population using this additional discriminator.
iron populations. This shows how both populations follow the same We have opted to leave our interpretations largely to observed
peak height trend where they are most numerous. This trend is also brightness values for meteors and not attempted to interpret our
almost identical for both median and mean peak heights. The offset results in event-specific mass units and therefore have avoided use
in peak height between +7 and +4 magnitudes is about 1 km, which of luminous efficiency. The luminous efficiency may be different
at this height corresponds to only a slightly larger range difference for irons compared to stony meteoroids at such low speeds, though
and thus a magnitude difference of < 0.1. There is little difference the luminous efficiency of the latter are usually scaled to that of
in the relative sensitivity of the system to the different populations iron which has better calibration (Popova et al. 2019). This could
across these heights. potentially introduce a bias if the iron meteoroid luminous efficiency
 Since the majority of our iron candidates are at these low was much higher than stony meteoroids. However, it is unlikely there
speeds (between 10 - 15 km/s), and the weightings of the opposing could be significant (more than factor of several) difference between
range and larger mass for deeper penetration biases are small, we the populations as stony meteoroids, presumed to be chemically
ignore these biases when correcting to our final absolute count of similar to chondrites, are themselves 20-25% iron.
iron candidates. The bias corrected fraction of iron candidates can
be seen in Table 4.
 Another possible source of bias comes from differences in 6 CONCLUSIONS
spectra between irons and non-irons. If an iron and non-iron emit
the same number of photons but have a completely different spec- Our major conclusions include:
trum, the observed brightness will depend on our camera’s response (i) Meteoroids with iron ablation properties are most common at
function—potentially biasing us towards brighter or fainter me- very low entry speeds, comprising ≈20% of the mm-sized meteoroid
teors. Figure 20 shows the calibrated, normalized, and summed population with < 15 km/s.
brightnesses of meteor spectra from Vojáček et al. (2019) versus

MNRAS 000, 1–13 (2021)
12 T. Mills et. al.

Table 4. Counts and percentages of iron candidates with range and overlapping area debiasing.

 Iron candidates All meteors % Iron candidate

 Total counts 1068 34761 3.0%
 Weighted total counts 2444 49710 4.9%

 10-15 km/s counts 600 2900 20.7%
 Weighted 10-15 km/s counts 1489 6927 21.5%

Figure 20. The calibrated spectra of Vojáček et al. (2019) are normalized, Figure 21. The calibrated spectra of Vojáček et al. (2019) normalized,
summed, and compared with the brightness of these spectra convolved with summed, and convolved with our cameras optics on the x-axis, compared
our camera’s response function. A photometric comparison line has been with the same convolution plus a standard R colour filter on the y-axis. Iron
fitted with a slope of 1. meteors appear significantly dimmer in the filtered camera as compared to
 other meteors.

 (ii) Most iron meteoroids in our brightness limited survey (>
95%) move in asteroidal orbits; a few percent have Halley-type ACKNOWLEDGEMENTS
comet orbits, though some of the latter may be contamination from This work was supported in part by NASA co-operative agreement
Na-free meteoroids. 80NSSC21M0073, by the Natural Sciences and Engineering Re-
 (iii) We find that height overlap, range and spectral sensitivity search Council of Canada Discovery Grants program (Grant no.
biases are small for our survey and that our raw observed fraction RGPIN-2018-05659) and the Canada Research Chair Program.
of irons at a given absolute magnitude is within a few percent of the The authors thank Z. Krzeminski and J. Gill for technical sup-
estimated absolute number. port.
 (iv) Irons show noticeably lower eccentricities than the equiva-
lent non-iron population between 10-20 km/s. We suggest this may
reflect much older collisional ages and significant PR drag effects
 DATA AVAILABILITY
for irons.
 (v) The observed debiased ratio of iron to non-iron meteoroids The data underlying this article will be shared on reasonable request
has a maximum of 20-25% for meteors of magnitude +5 - +7 at to the corresponding author.
low speeds ( < 15 km/s) and shows some evidence of a continuing
slow increase right to the brightness limit of our survey. The ratio
decreases somewhat at brighter magnitudes, but remains as high as REFERENCES
15% at +3.
 (vi) The origin of the iron population may be metallic chon- Beech M., 2009, Monthly Notices of the Royal Astronomical Society, 397,
 2081
drules/nodules or some form of impact melt as suggested by
 Borovička J., 2006, in Lazzaro D., Ferraz-Mello S., Fernandez
Borovička et al. (2019). Some may be iron sulfide grains or some J., eds, , Vol. 1, Proceedings of the International Astronom-
sort of stony-iron mix. They appear to be too large to represent ical Union. Cambridge University Press, Cambridge, pp 249–
typical metal-trolite grains liberated from chondritic parent bodies 271, doi:10.1017/S1743921305006782, http://www.journals.
through collisions (Kuebler et al. 1999). cambridge.org/abstract{_}S1743921305006782
 Borovička J., Koten P., Spurný P., Boček J., Štork R., 2005, Icarus, 174, 15

 MNRAS 000, 1–13 (2021)
You can also read