Blue Star Helium Limited - (ASX:BNL) June 2020 - The Assay
←
→
Page content transcription
If your browser does not render page correctly, please read the page content below
Blue Star Helium Limited
              (ASX:BNL)

                  June 2020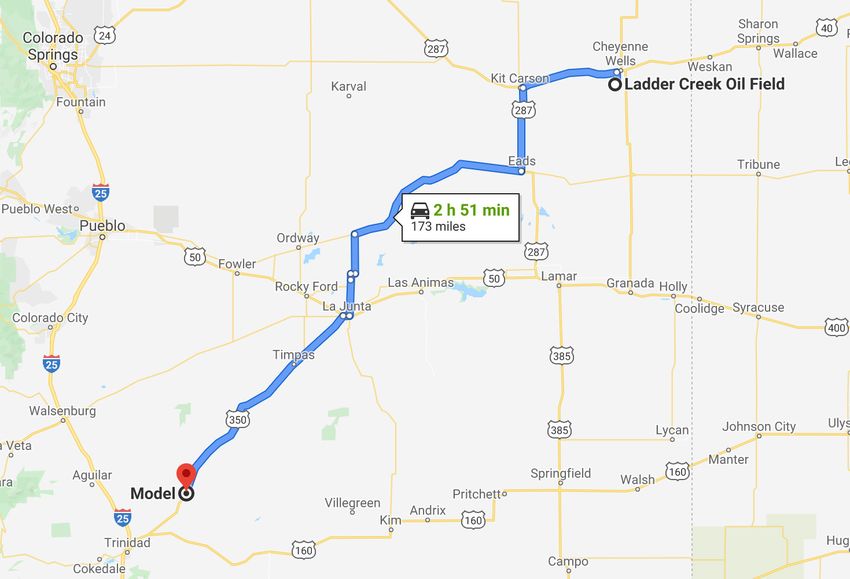
WHO IS IIR?

     Independent Investment Research, “IIR”, is an independent investment research house based in Australia and the United States. IIR specialises in the analysis of high quality commissioned research for
     Brokers, Family Offices and Fund Managers. IIR distributes its research in Asia, United States and the Americas. IIR does not participate in any corporate or capital raising activity and therefore it does
     not have any inherent bias that may result from research that is linked to any corporate/ capital raising activity.
     IIR was established in 2004 under Aegis Equities Research Group of companies to provide investment research to a select group of retail and wholesale clients. Since March 2010, IIR (the Aegis Equities
     business was sold to Morningstar) has operated independently from Aegis by former Aegis senior executives/shareholders to provide clients with unparalleled research that covers listed and unlisted
     managed investments, listed companies, structured products, and IPOs.
     IIR takes great pride in the quality and independence of our analysis, underpinned by high caliber staff and a transparent, proven and rigorous research methodology.

INDEPENDENCE OF RESEARCH ANALYSTS
Research analysts are not directly supervised by personnel from other areas of the Firm whose interests or functions may conflict with those of the research analysts. The evaluation and appraisal of research
analysts for purposes of career advancement, remuneration and promotion is structured so that non-research personnel do not exert inappropriate influence over analysts.
Supervision and reporting lines: Analysts who publish research reports are supervised by, and report to, Research Management. Research analysts do not report to, and are not supervised by, any sales
personnel nor do they have dealings with Sales personnel
Evaluation and remuneration: The remuneration of research analysts is determined on the basis of a number of factors, including quality, accuracy and value of research, productivity, experience, individual
reputation, and evaluations by investor clients.

INDEPENDENCE – ACTIVITIES OF ANALYSTS
IIR restricts research analysts from performing roles that could prejudice, or appear to prejudice, the independence of their research.
Pitches: Research analysts are not permitted to participate in sales pitches for corporate mandates on behalf of a Broker and are not permitted to prepare or review materials for those pitches. Pitch materials
by investor clients may not contain the promise of research coverage by IIR.
No promotion of issuers’ transactions: Research analysts may not be involved in promotional or marketing activities of an issuer of a relevant investment that would reasonably be construed as representing
the issuer. For this reason, analysts are not permitted to attend “road show” presentations by issuers that are corporate clients of the Firm relating to offerings of securities or any other investment banking
transaction from that our clients may undertake from time to time. Analysts may, however, observe road shows remotely, without asking questions, by video link or telephone in order to help ensure that they
have access to the same information as their investor clients.
Widely-attended conferences: Analysts are permitted to attend and speak at widely-attended conferences at which our firm has been invited to present our views. These widely-attended conferences may
include investor presentations by corporate clients of the Firm.
Other permitted activities: Analysts may be consulted by Firm sales personnel on matters such as market and industry trends, conditions and developments and the structuring, pricing and expected market
reception of securities offerings or other market operations. Analysts may also carry out preliminary due diligence and vetting of issuers that may be prospective research clients of ours.

INDUCEMENTS AND INAPPROPRIATE INFLUENCES
IIR prohibits research analysts from soliciting or receiving any inducement in respect of their publication of research and restricts certain communications between research analysts and personnel from other
business areas within the Firm including management, which might be perceived to result in inappropriate influence on analysts’ views.
Remuneration and other benefits: IIR procedures prohibit analysts from accepting any remuneration or other benefit from an issuer or any other party in respect of the publication of research and from offering
or accepting any inducement (including the selective disclosure by an issuer of material information not generally available) for the publication of favourable research. These restrictions do not preclude the
acceptance of reasonable hospitality in accordance with the Firm’s general policies on entertainment, gifts and corporate hospitality.

DISCLAIMER

This publication has been prepared by Independent Investment Research (Aust) Pty Limited trading as Independent Investment Research (“IIR”) (ABN 11 152 172 079), an corporate authorised representative of
Australian Financial Services Licensee (AFSL no. 410381. IIR has been commissioned to prepare this independent research report (the “Report”) and will receive fees for its preparation. Each company specified
in the Report (the “Participants”) has provided IIR with information about its current activities. While the information contained in this publication has been prepared with all reasonable care from sources that IIR
believes are reliable, no responsibility or liability is accepted by IIR for any errors, omissions or misstatements however caused. In the event that updated or additional information is issued by the “Participants”,
subsequent to this publication, IIR is under no obligation to provide further research unless commissioned to do so. Any opinions, forecasts or recommendations reflects the judgment and assumptions of IIR as
at the date of publication and may change without notice. IIR and each Participant in the Report, their officers, agents and employees exclude all liability whatsoever, in negligence or otherwise, for any loss
or damage relating to this document to the full extent permitted by law. This publication is not and should not be construed as, an offer to sell or the solicitation of an offer to purchase or subscribe for any
investment. Any opinion contained in the Report is unsolicited general information only. Neither IIR nor the Participants are aware that any recipient intends to rely on this Report or of the manner in which a
recipient intends to use it. In preparing our information, it is not possible to take into consideration the investment objectives, financial situation or particular needs of any individual recipient. Investors should
obtain individual financial advice from their investment advisor to determine whether opinions or recommendations (if any) contained in this publication are appropriate to their investment objectives, financial
situation or particular needs before acting on such opinions or recommendations. This report is intended for the residents of Australia. It is not intended for any person(s) who is resident of any other country. This
document does not constitute an offer of services in jurisdictions where IIR or its affiliates do not have the necessary licenses. IIR and/or the Participant, their officers, employees or its related bodies corporate
may, from time to time hold positions in any securities included in this Report and may buy or sell such securities or engage in other transactions involving such securities. IIR and the Participant, their directors
and associates declare that from time to time they may hold interests in and/or earn brokerage, fees or other benefits from the securities mentioned in this publication.
IIR, its officers, employees and its related bodies corporate have not and will not receive, whether directly or indirectly, any commission, fee, benefit or advantage, whether pecuniary or otherwise in connection
with making any statements and/or recommendation (if any), contained in this Report. IIR discloses that from time to time it or its officers, employees and related bodies corporate may have an interest in the
securities, directly or indirectly, which are the subject of these statements and/or recommendations (if any) and may buy or sell securities in the companies mentioned in this publication; may affect transactions
which may not be consistent with the statements and/or recommendations (if any) in this publication; may have directorships in the companies mentioned in this publication; and/or may perform paid services
for the companies that are the subject of such statements and/or recommendations (if any).

However, under no circumstances has IIR been influenced, either directly or indirectly, in making any statements and/or recommendations (if any) contained in this Report. The information contained in this
publication must be read in conjunction with the Legal Notice that can be located at http://www.independentresearch.com.au/Public/Disclaimer.aspx.

THIS IS A COMMISSIONED RESEARCH REPORT.
The research process includes the following protocols to ensure independence is maintained at all times:
1)      The research process has complete editorial independence from the company and this included in the contract with the company;
2)      Our analyst has independence from the firm’s management, as in, management/ sales team cannot influence the research in any way;
3)      Our research does not provide a recommendation, in that, we do not provide a “Buy, Sell or Hold” on any stocks. This is left to the Adviser who knows their client and the individual portfolio of the client.
4)      Our research process for valuation is usually more conservative than what is adopted in Broking firms in general sense. Our firm has a conservative bias on assumptions provided by management as
        compared to Broking firms.
5)      All research mandates are settled upfront so as to remove any influence on ultimate report conclusion;
6)      All staff are not allowed to trade in any stock or accept stock options before, during and after (for a period of 6 weeks) the research process.

For more information regarding our services please refer to our website www.independentresearch.com.au.

        Independent Investment Research
Blue Star Helium Limited
                                                                     (ASX: BNL)

Note: This report is based on
information provided by the company                                  HIGH GRADE HELIUM RESOURCE VALUE ADD FOR BNL
as at 17 June 2020
                                                                     Blue Star Helium Limited has strategically rotated out of the energy price exposed US oil and
Investment Profile                                                   gas sector into the helium business. The barriers to entry into helium production are principally
Share Price ($) at 17 June 2020                            0.012     access to a high grade helium source, and the company is moving rapidly on that front. Its
Issued Capital (subject to                                           lease portfolio is located along structure from the Model Dome helium field in Colorado USA,
shareholder approval):                                               which historically was one of the world’s highest grade helium producers. This report uses
Ordinary Shares post issue (M)                             964.0     US oil and gas industry volume units (M=thousand and MM= million). There is an appendix
Options post issue(M)                                      187.9     detailing abbreviations and conversions in the back of this report.
Performance Shares
Fully Diluted (M)                                        1151.9
Market Capitalisation (A$M)                                  11.6
                                                                     KEY POINTS
12 month L/H ($)                                   0.004-0.020       Highly prospective geology – Blue Star is building a land package around the Model Dome
                                                                     field which produced a nitrogen/helium gas at around 8% helium. The US Geological Survey
Board and Management                                                 surveyed their database of US wells drilled and found 13,684 wells containing traces of helium.
Directors:                                                           Of those, only 0.5% contained more than 6% helium, and 0.2% more than 8%. Blue Star
Ross Warner - Chairman                                               believes their leases contain the same reservoir and seal strata, and sources gas from the same
Joanne Kendrick - Managing Director                                  source as Model Dome. Reservoir consultant Sproule estimates Net Prospective Resources of
Trent Spry - Executive Director
                                                                     1U 641MMscf, 2U 3021 MMscf, and 3U 6391 MMscf of recoverable helium net to Blue Star.
                                                                     This Resource is contained in under 20% of BNL’s lease portfolio.
Major Shareholders at 28 May 2020
Board & Management                                         4.5%      Land package is appreciating in value – Bidding for leases in the Las Animas region where
Pamplona                                                   4.8%      Blue Star is exploring has become more competitive in the March 2020 quarter, following
Ms Chunyan Niu                                             4.2%      ownership changes at two helium producing companies in the region. The new owners are
BNP Paribas Nominees                                       3.0%      likely to be more growth oriented, and also more asset acquisitive.
Top 20                                                    48.8%
                                                                     Low cost drilling commencing shortly – The target reservoir strata are shallow at 1000 feet
Share Price Performance                                              or 300 metres below surface. Vertical exploration wells are expected to cost US$300,000 for
                                                                     a dry hole and US$400,000 for a completed producer. The first successful hole should result
                                                                     in a significant re-rating in the company’s share price. Based on Model Dome well production
                                                                     history, we estimate that a 2Mscf/day starter project could be supplied by up to five wells at a
                                                                     total cost of US$2 million. Subject to shareholder approval, cash on hand in July 2020 should
                                                                     be around A$2.5 million plus an additional A$1 million if 1cps options are exercised.
                                                                     Excellent drilling and logistical support services available – The US Mid West is home to
                                                                     an oil and gas industry of long standing, and there is existing helium industry infrastructure,
                                                                     including technical consultants, drilling and logistical contractors available at relatively short
                                                                     notice, and with considerable experience and competence. This human infrastructure
                                                                     considerably reduces the risk to a junior company entering the industry.
                                                                     Processing plants available for lease – There is also considerable physical infrastructure in
                                                                     place, particularly in the region starting 100 miles to the east of Blue Star’s leases. There
                                                                     are existing dedicated helium pipelines, helium separators and liquifiers with spare capacity,
                                                                     and specialty companies that build and lease helium separation plants to third parties. This
                                                                     means that once Blue Star has the well network in place, the balance of the capital equipment
                                                                     required can be leased rather than purchased, reducing pre-production capital costs.
                                                                     The business is scalable – Depending on the reserves and the market demand, this business
                                                                     can be grown in size without being constrained by supply of capital. The critical factor is the
                                                                     operating cost and competitive position of the business as a reliable supplier. This will be
                                                                     underwritten by the high helium content, if it proves up as expected. The valuation leverage to
                                                                     increasing project size is considerable.
                                                                     Potentially strong competitive position – There is some significant supply scheduled to
                                                                     come on line between now and 2026, and forecasting the impact on price will depend on the
                                                                     strength of demand, which has experienced supply shortages for a number of years. In this
                                                                     environment, we believe it is important to emphasise the competitive strength of any project
The investment opinion in this report is current as at the date of
publication. Investors and advisers should be aware that over time   that manages to find 8% Helium. If the Prospective Resource grade proves up, we expect Blue
the circumstances of the issuer and/or product may change which
may affect our investment opinion.
                                                                     Star to be a low cost producer, with little debt on its balance sheet, making it a durable and
                                                                     profitable business, throughout the price cycle.

         Independent Investment Research                                                                                                                         1
Blue Star Helium Limited (ASX:BNL)
VALUATION
At this early stage of development, we are not able to value Blue Star. We cannot value
Prospective Resources and there are no easily comparable pure play helium companies that
can be used as valuation comparisons. We have constructed a Indicative Financial Model of
what a project would look like based on reserves the same size as the announced Prospective
Resource. At an ex-field selling price of US$200/Mscf for A Grade helium, that Indicative Project
would be worth between US$18 million and US$176 million, with a pre-production capital cost
we estimate of US$5 million (Table 8). The NPV/Capex ratio is 3.6x to 35x. We believe we have
been conservative in our cost estimates.
INVESTMENT PROPOSITION
LOW PRE-PRODUCTION CAPEX ENTRY TO LONG TERM CASH FLOW
This is an appropriate business for Blue Star to be in
The pre-production capital cost to enter the business is low (we estimate $3M).
Exploring for gas is risky, but in this case, the well depths will be 1000 feet or 300 metres,
making each exploration hole cheap at US$0.3 million per dry hole.
The support infrastructure is considerable, which significantly reduces the technical risks
relating to exploration, construction and operation, with a large community of contractors,
consultants and equipment providers.
Discoveries are scalable. Blue Star can start small and grow on the back of cash flow.
If the expected helium grade of 8% is realised, Blue Star will have one of the highest grade
helium resources in the world, and with that comes a competitive cost position that will
allow it to maintain cash flow throughout the price cycle.
There are a number of offtake parties, and the market, while opaque, is highly developed,
with a number of producers signed up on long term contracts with specialty gas
corporations.
Helium price outlook - COVID-19 is a significant demand disruption, and forecasting the
recovery adds difficulty. Before the virus impact, spot helium prices anecdotally appeared
to be strong (ie around US$400/Mscf) and the supply demand balance favoured producers.
The forecast in the public domain vary, but the implication was that supply would remain
tight until 2022 when significant new capacity from the Amur project in Russia starts
coming on line.
We are comfortable that the current contractual market for helium in the US is between
US$200/Mscf and US$300/Mscf, and there are likely spot prices above that level. We have
assumed US$200/Mscf in our Indicative Financial Model, which we believe is conservative
enough to avoid potential for significant disappointment, and possibly have room for the
company to achieve higher prices.
Value adding stages
Blue Star Helium has to deliver on a number of steps, each of which should be rewarded
by the market, subject to general market conditions outside Blue Star’s control.
Step 1 is to convert the prospective resource into a reserve. This is likely to require
2-3 successful wells confirming delivery of helium to surface, and supporting positive
economics. The cost would be US$0.3 million to US$0.4 million for each well, or US$0.8-
1.2 million, plus evaluation costs.
Step 2 is to deliver a Feasibility Study combined with offtake contracts. Other small
capitalization project developers have demonstrated that major gas companies are
prepared to offer offtake contracts at the project stage.
Step 3 is funding, with considerable likelihood that the plant is leased from the
manufacturer, and transport capital is funded by haulage contractors. We expect that Blue
Star will have to provide the capital for the drilling and well completion, the access roads
support buildings and general support infrastructure, and start up working capital. Some of
this may be funded by debt, but for now we assume the only source of funding is equity.
Independent Investment Research 2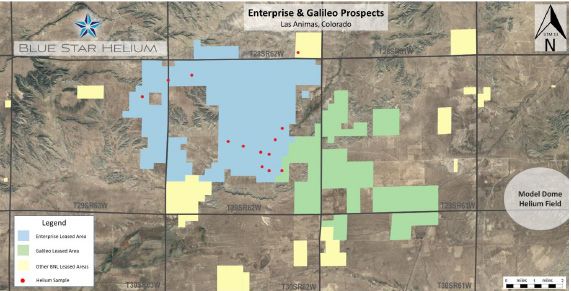
Blue Star Helium Limited (ASX:BNL)
Step 4 is project execution into full production.
Step 5 is to upscale and grow the business, using operating cash flow to further exploration,
and adding additional production modules to increase sales volumes. This would be low
risk organic growth, supported by the lease portfolio the company has been accumulating.
VALUATION
So far we have not found any listed helium pure play producers to use as a value yardstick
to assess what Blue Star would be worth if it drilled out a commercial reserve and
commenced production. Most comparisons that are listed produce or plan to produce
significant hydrocarbons. The pure helium producers we know of are unlisted, with no
visible market valuation.
As an alternative, we have attempted to develop an Indicative Financial Model for a target
project, which suggests that if Blue Star can deliver Reserves in line with the Prospective
Resources, it will own an asset worth between A$17.9M and A$176.1M at a selling price of
US$200/Mscf. We emphasise that this is not a valuation of Blue Star’s project, but one that
can be used by investors as a starting point against which to assess Blue Star’s progress.
The last BLM helium auction sale occurred in August 2018 at US$280/Mscf, and there
have been no auctions since. This US$280/Mscf is still a much talked about price level, so
we have provided our model value at that price. However, to be on the conservative side,
we are using US$200/Mscf as our base case. Renergen announces a US$200/Mscf long
term offtake price for its project, providing a clear benchmark for a Blue Star project.
Blue Star has published an unrisked Prospective Resource. This is an exploration target,
but one with sufficient data to allow the size of the prospective target to be dimensioned.
However, until the target is drilled, there is no certainty of the existence of helium, the
quantity, the quality, nor the flow rate, all of which are required as the basis for an evaluation.
However, owning a share in Blue Star is to effectively own an option on the company’s
potential success. Again we will have trouble valuing the option, but we can provide some
clarity on the parameters of a potential project.
Indicative helium operation as a benchmark
We have reviewed the publicly available information available on helium operations in the
US Mid West, and have generated estimates of the economics of an indicative helium
operation in the region. Those assumptions and the sources behind them are detailed in
the Economics section.
We have run a model based on assuming the Prospective Resources in the Blue Star
announcement of 27 May 2020 are converted unchanged into Reserves. We repeat that
Prospective Resources can fail to appear when drilled. However, the Indicative Financial
Model’s purpose is to an approximate answer the question: “what if drilling proves up a
Reserve somewhere between 1U 641MMscf and 3U 6391MMscf of recoverable Helium
net to Blue Star”.
Table 1 NPV of indicative helium operation in US$M
Helium Price 150 200 250 280 400
Reserve MMscf
Equivalent to 1U 641 MMscf 9.2 17.9 26.5 31.7 52.4
Equivalent to 2U 3021 MMscf 50.8 91.5 132.1 156.5 253.9
Equivalent to 3U 6391 MMscf 99.6 176.1 252.6 298.4 482.0
Source IIR Estimates
Our estimation and modelling suggest that any project is sensitive to both the size of the
Reserve and the long term helium price, but with the bias to the upside for the Blue Star
share price. Blue Star appears to have made a strategically sound decision to invest in this
industry, and is executing that strategy in a competent manner.
Determining the current helium price is difficult, and the future price more so. Renergen
(ASX:RLT) signed an offtake contract for US$200/Mscf escalating with US CPI over time for
A Grade (98% He) product contracted in either second half of 2018 or first half of 2019. This
sets the centre of our valuation table, and we have run sensitivities of minus US$50/Mscf,
and plus US$80/Mscf. The higher price captures the last BLM auction price. The positive
cash flow and NPV at the lower price demonstrates an ability to survive downturns.
Independent Investment Research 3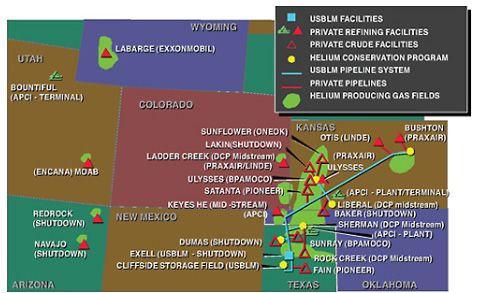
Blue Star Helium Limited (ASX:BNL)
There are anecdotes suggesting the current spot price is closer to US$400/Mscf, and if
that turned out to be the long term price, the valuation range would be US$52 million to
US$482 million, depending on the size of the reserves.
The table below shows the financials for the life of reserve that generates the NPV’s in the
table above at US$200/Mscf selling price.
We have determined a discount rate of 11.2% based on the Capital Asset Pricing Model
formula and the market assumptions as detailed in Table 10 as appropriate for valuing this
company.
Given the currently high level of volatility in the AUDUSD rate, all financial numbers in this
report are in USD, and the reader can convert at whatever the rate is at the time of reading.
In this report, when we convert values into AUD we use an AUDUSD rate of 0.69.
We believe we have been conservative on costs and operating parameters
The reader will see a number of sensitivities later in this report. We include a quick
summary here.
Our Base case is a selling price of US$200/Mscf vs indications that the current market is
closer to US$300/Mscf.
Average well production is assumed to be 500Mscf/d declining a 5%, where initial
production could be 1000Mscf.
Operation costs are assumed to be US$70/Mscf on a gross basis, or US$82/Mscf on a net
of royalties basis. The US$70/Mscf could be lower than US$50/Mscf.
We cost in additional three additional wells (eight vs five) to allow for failures.
Table 2 Life of operating financial metrics at US$200/Mscf selling price and different Reserves
Assumed Net Reserve MMscf Helium 641 3021 6391
Revenue Calculation
Selling Price at Spiggot US$/Mscf 200.0 200.0 200.0
Gross Gas Sold MMscf 738.2 3428.5 7393.4
Gross Revenue US$ million 147.6 685.7 1478.7
Royalty US$ million -22.1 -102.9 -221.8
Net Revenue US$ million 125.5 582.9 1256.9
Financials US$ million
Net Revenue 125.5 582.9 1256.9
Opex -51.4 -238.6 -514.5
D&A -3.2 -6.4 -6.4
EBIT 70.9 337.9 736.0
Tax (BNL has tax losses, which are not accounted for) -19.5 -92.9 -202.4
NPAT 51.4 245.0 533.6
Cash Flow US$ million
Pre Production Capex -3.2 -3.2 -3.2
Sustaining Capex 0.0 -3.2 -3.2
Free Cash Flow 51.4 245.0 533.6
NPV 17.9 91.4 176.1
Operating Assumptions
Helium Sales MMscf/yr 51.0 277.3 500.0
Production Wells 4.0 12.0 22.0
Well Flow Rate Mscf/d 500.0 1000.0 1000.0
Sources: IIR estimates (see Economics section of this report)
How to think about these numbers
Blue Star has a market capitalization of A$11 million, which means that the company’s
share price is factoring in a probability of delivering the 3021 MMscf reserve and US$200.
Mscf price of US$91.4 million outcome as 12%. The implied factors of success for the
other scenarios see Table 3.
Independent Investment Research 4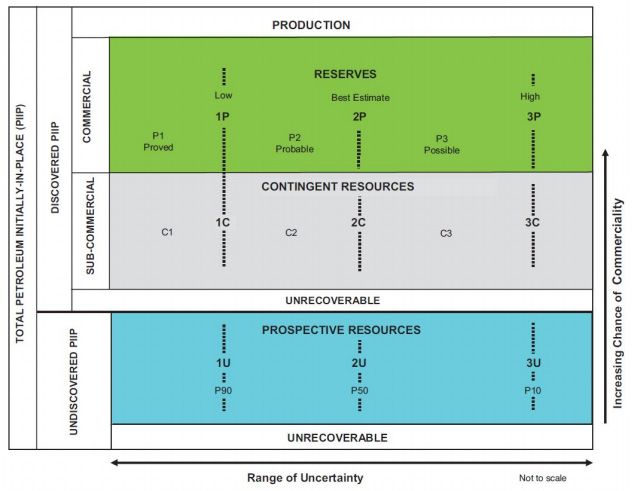
Blue Star Helium Limited (ASX:BNL)
The Prospective Resources are categorized as 1U if there is a 90% chance it exists, 2U if
there is a 50% chance, and 3U if there is a 10% chance. The odds are related to the height
of the gas column in the trap structure. If the structure seal has failed there could be no
gas, and the probability assessment does not capture that aspect of risk.
Table 3 Probability of delivering the NPV for each scenario implied by the current share price
of Blue Star
Helium Price 150 200 250 280 400
Reserve MMscf
Equivalent to 1U 641 MMscf NA 56% 38% 31% 19%
Equivalent to 2U 3021 MMscf 20% 11% 8% 6% 4%
Equivalent to 3U 6391 MMscf 10% 6% 4% 3% 2%
Source: IIR estimates (see Economics section of this report)
Corporate interest in the sector is picking up
The March 2020 quarterly, the company noted that there had been a marked increase in
competition for acreage in Las Animas County. On average, Blue Star has seen a doubling
to the bid prices for leases in its region since December 2019, with some leases seeing a
10x increase, presumably due to either high prospectivity or strategic value.
The timing of increased interest coincides with ownership changes of some pure play
helium producers that may now have stronger growth ambitions supported by stronger
balance sheets. We note that the increased competition started after Tumbleweed
Midstream completed the purchase of DCP’s Ladder Creek helium production network.
Another US helium pure play called Tacitus LLC has had a major change in it shareholder
base, and may also be on a more aggressive acquisition strategy.
Unfortunately all these shareholder transactions are off market and are confidential.
FINANCIAL POSITION
Cash on hand at 31 March 2020 was A$507,480. The company has just raised A$2.30
million at A$0.01/sh. A$0.98 million has been received, and a further A$1.322 million will
be received in July 2020, subject to shareholder approval. Post issue, Blue Star will have
around A$2.5 million. If the current outstanding 1cps options are exercised, the company
will have an additional A$1 million.
RISKS
Exploration success – The value of the helium resource will depend on size and helium
concentration. Concentrations as high as 8% helium are very rare. There is solid grounds
for believing that the Prospective Resource exists, but this can only be demonstrated by
drilling.
Helium price – Discovering the current helium price likely to be paid at the production
facility is difficult to impossible without actually signing a contract. The good news is that
long term take or pay contracts are typically negotiated, so once Blue Star has a contract,
there will be a significant reduction in selling price uncertainty. Until that deal is done, the
current price is opaque, and forecasting future prices from an unknown starting point is
risky. On top of which, while supply demand appears tight in 2021, there is potential for a
surplus supply from 2022. Again, the offset to any potential oversupply is that if Blue Star
has an 8% helium resource, it is likely to be cost competitive throughout the price cycle.
Project Execution – A junior company starting production always carries execution and
operating risk. This is offset if the company employs quality contractors and consultants,
and the US oil patch has operated on this basis for years.
Independent Investment Research 5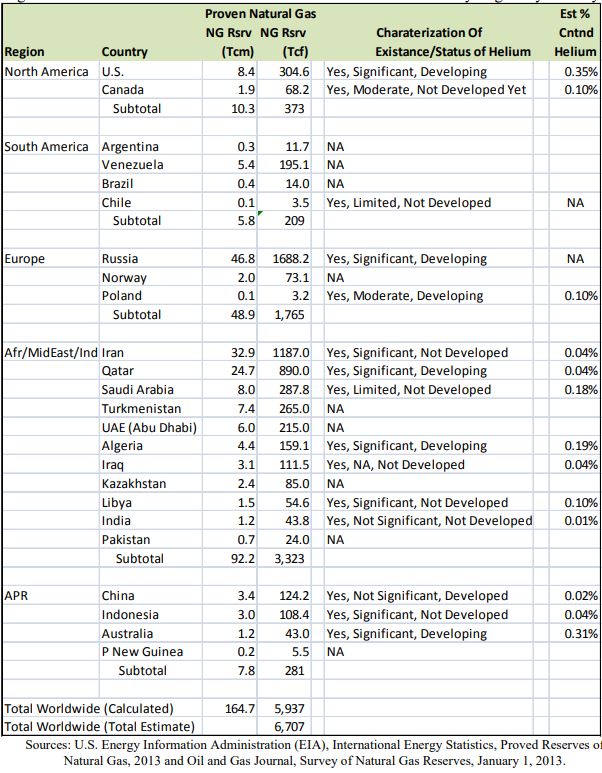
Blue Star Helium Limited (ASX:BNL)
LAS AMINAS HELIUM PROJECT
Location – Close to significant helium processing infrastructure and expertise
Figure 1 Location of US Helium Resources
Source: https://www.nap.edu/read/12844/chapter/7#75
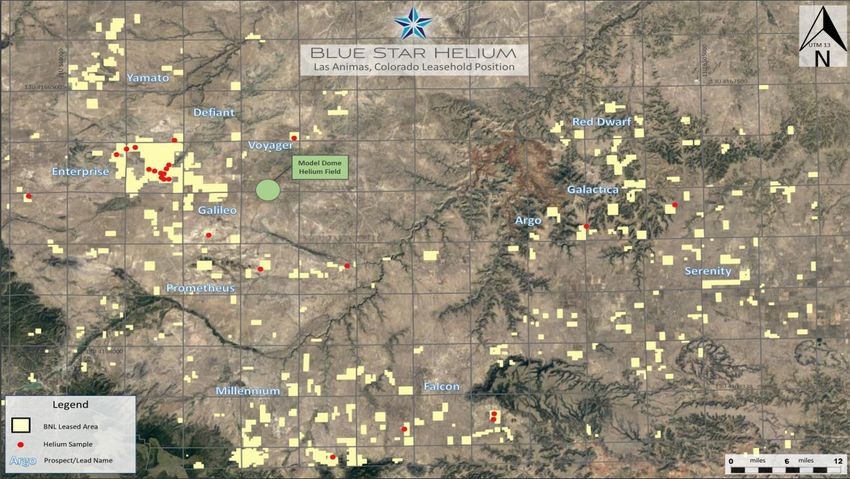
The Blue Star lease portfolio is near the town on Model in Las Animas County, Colorado,
and is 173 miles or 3 hours drive south west of the Ladder Creek oilfield that has extensive
helium processing infrastructure, and 250 miles or a four hour drive to the major helium
storage and processing facilities of the US Bureau of Land Management at the Cliffside
Field near Amarillo, Texas.
The helium production corridor running from western Kansas to north western Texas is
responsible for around 40% of the worlds helium production. There is a highly developed
community of specialist contractors available to support all the production aspects of the
helium business in the region, significantly reducing the start up risk a junior company
would normally experience.
There are 14 helium refining operations in the US, including two in Colorado, five in Kansas,
and four in Texas, with more distant plants in Arizona (1), Oklahoma (1) and Wyoming (1).
The Kansas and Oklahoma plants have a history of toll treating the raw helium gas from
third parties to any market specification and there are a number of haulage contractors
able to supply transport, many associated with or owned by the major gas buyers.
Figure 2 Route from Model to Ladder Creek Helium Processing Infrastructure
Source: Google Maps
Independent Investment Research 6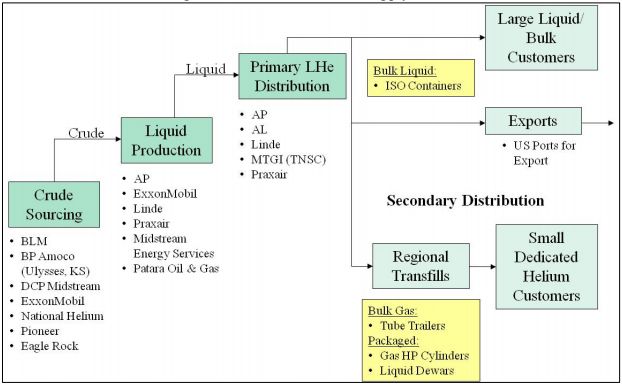
Blue Star Helium Limited (ASX:BNL)
Figure 3 Ladder Creek helium collection and processing network
Source: https://www.tumbleweedmidstream.com/ladder-creek-system
The Ladder Creek assets were recently purchased by Tumbleweed Midstream from DCP
Midstream in January 2020. The CEO of Tumbleweed is Durell J. Johnson, who was
project engineer during the original construction of the network. It is reasonable to expect
he plans to grow the business, and a processing deal with Blue Star should be possible.
Current processing capacity at the Ladder Creek cryogenic processing plant is 40 million
cubic feet of natural gas per day (MMcf/d), easily expandable to 50 MMcf/d.
The plant has the capacity to extract and liquefy 1.5 MMcf/d of helium, with extraction and
liquefaction to purity levels of 99.999 percent. Blue Star’s initial production is planned to
be 0.14MMscf/d.
PROSPECTIVE RESOURCE
When it comes to helium deposits, what is an exciting resource?
In this report, we try to demonstrate that helium is a business that a small company like
Blue Star can enter, because of the huge skill base in the oil and gas industry available at
call from contractors, and the capital intensive plant required to purify the helium gas can
be leased. The main barrier to entering the business is having a helium resource.
An exciting helium resource is one with a high percentage of helium, and preferable having
waste gas components that can vent to atmosphere (ie nitrogen). Waste gas containing
sulphide or methane requires extra processing, because those gasses cannot be vented,
and venting carbon dioxide will probably be restricted in due course.
In 2018, the US Geological Survey reviewed the entire USGS and Bureau of Land
Management (BLM) US drill hole database and found 13,648 wells which flowed gas
containing traces of helium.
Table 4 Helium Concentration distribution within the USGS well database
Equal or more than Trace 1% 2% 3% 6% 8%
Number of Wells 13648 1236 479 209 66 29
Percentage 100% 9.06% 3.51% 1.53% 0.48% 0.21%
Source: Helium concentrations in United States wells
Of all the 13,648 wells the USGS found that contained helium, only 0.48% contained more
than 6% helium and 0.21% more than 8%. These percentages would be lower if all US
wells drilled were included.
Independent Investment Research 7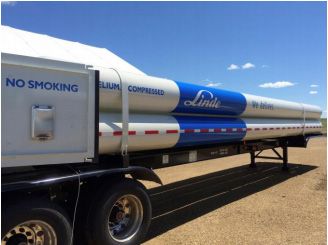
Blue Star Helium Limited (ASX:BNL)
Figure 4 USGS Well Survey - Helium Concentration v Depth for highest grade wells
(Model Dome wells circled)
Source: Helium concentrations in United States wells
A major cost of developing a gas field is the drilling of exploration, then development,
wells, so the shallower the target, the lower cost the drilling program will be. In the figure
above, there are a number of wells encountering helium at good concentrations, only 1000
feet below surface, Fields of this nature would be relatively low cost to develop.
The sweet spot when looking for a helium deposit would therefore be to generate
exploration wells that plotted in the lower right hand quadrant of the figure above.
The Model Dome field would be an example of an excellent target for development. Its
helium grade is around 8%, and typical well depth is 1000 feet.
The Blue Star Enterprise and Galileo prospects are six miles (10 Km) to the west of Model
Dome, and at a similar depth. They have the same reservoir and seal formations, and the
same helium source rocks.
Figure 5 Relationship between the Model Dome Helium Field and Blue Star’s Enterprise
and Galileo prospects
Source: BNL presentation 1 June 2020
Exploration target between 641MMcf and 6391MMcf at first two targets
Blue Star’s Prospective Resource is the result of evaluation work by consultancy group
Sproule, and signed off by Blue Star Executive Director Trent Spry.
Independent Investment Research 8Blue Star Helium Limited (ASX:BNL)
Table 5 Unrisked Prospective Resource
1U (P90) 2U (P50) 3U (P10)
Net Recoverable Helium (MMscf)
Enterprise 372 2296 5003
Galileo 270 725 1389
Total 641 3021 6391
Weighted average Royalty
Enterprise 15.0% 14.4% 14.6%
Galileo 12.5% 12.6% 13.6%
Total 14.1% 13.9% 14.4%
Gross Recoverable Helium (MMscf)
Enterprise 438 2681 5861
Galileo 309 829 1607
Total 746 3510 7469
Gross Recoverable Raw Gas @ 8% (MMscf)
Enterprise 5473 33512 73263
Galileo 3857 10364 20093
Total 9330 43877 93356
Source: BNL release 27 May 2020
While this is a prospective resource, and therefore an exploration target requiring drilling
to confirm existence, the statements directors make in respect of such targets are tightly
controlled by the market regulatory authorities. The company’s release provides clarity on
a number of factors that support the prospective estimate.
Figure 6 Leases over Enterprise and Galileo Prospects, and location of Model Dome helium reservoir
Source: BNL release 27 May 2020
Factors supporting the Prospective Resource
The Enterprise and Galileo prospects are close to the Model Dome Helium Field that
produced before World War II. That field produced at a helium concentration of around 8%
at rates of between 500Mcf/day and 1000Mcf/d per well.
The target gas bearing strata is the Lyons Formation. Blue Star and Sproule have access
to the well logs drilled within and without the company’s leases, as well as gravity and
magnetic surveys over the leases, that have allowed Sproule to estimate 200-250 feet of
structural closure at the top of the Lyons Formation.
Soil samples have detected traces of helium (the red dots in the figure above), which is
a highly positive sign that there is helium in the strata below. All gas traps leak to some
extent, particularly around the edges of interpreted trap structures. Helium traces can only
be sourced from subsurface helium, ie from the radioactive decay of uranium and thorium.
Methane traces can be produced by plant and bacterial activity in the topsoil, giving false
readings, whereas helium cannot.
Independent Investment Research 9Blue Star Helium Limited (ASX:BNL)
The difference between 1U, 2U and 3U Resources is uncertainty over the height of the gas
column in the structure. The more gas that is caught in the structure, the higher the vertical
column of gas and the larger the Resource.
Risks include the failure of the top of the structure to seal, which would have allowed the
gas to escape. The presence of traces still in the soil suggest escape is still continuing, and
there is still gas in the structure below.
Other risks include low porosity (reducing the total gas volume in place), low permeability
(reducing the flow rate without more expensive drilling), and low gas pressure (reducing
the flow rate without more expensive water or gas injection to increase drive). These
variables have been estimated from the Model Dome core, wireline logs and the drill
stem tests (pressure and flow rates) from the surrounding wells, including those at Model
Dome.
Helium fields have a fundamental difference to conventional methane producing gas
fields, in that helium is the smallest molecule of any element or compound, and it main
companion Nitrogen (N2) is also much smaller than a methane molecule, so helium fields
can produce more gas at a faster rate than a methane field with the same permeability
and drive pressure.
Figure 7 Petroleum reserve and resource classifications
Source: Petroleum Resource Management System June 2018 release
Independent Investment Research 10Blue Star Helium Limited (ASX:BNL)
Lease portfolio growing quickly
As at 30 March 2020, Blue Star had a gross land package of 121,086 acres, and 64,924
acres net.
Figure 8 Total lease portfolio at 30 March 2020 – Resources apply to Enterprise/Galileo only
Source: BNL presentation 1 June 2020
The lease tenure varies depending on whether the owner of the mineral rights is a local
landowner (Private), State land (State), or Federal land (BLM).
The local landowners and the Bureau of Land Management which handles access to
Federal lands appear to be settling for a 12.5% royalty and a 5 year plus right to renew for
5 more years in the case of Private deals, and 10 years in the case of the BLM.
The State of Colorado is settling for a 20% royalty.
Blue Star will also be paying an annual rental averaging US$2/acre across the lease
portfolio.
Once in production, the leases can be “held by production” which means as long as there
is production and royalty payments are being made, the leases remain with the lease
holder. Production of helium can be sufficient to satisfy the “held by production” criteria.
Table 6 History of lease acquisition to 30 March 2020
Gross Net Cumulative US$/
Owner Royalty Years
Acres Acres Net acre
22-Aug-19 Enterprise 1800 700 700 Private 12.5% 5+5
19-Sep-19 Enterprise 3320 310 1010 Private 12.5% 5+5
9-Oct-19 Enterprise 0 300 1310 Private 12.5% 5+5
31-Oct-19 Voyager 160 160 1470 Private 12.5% 5+5
26-Nov-19 Enterprise 21824 21824 23294 State 20.0% 2.5
28-Nov-19 59510 3784 27078 Private 12.5% 5+5
5-Dec-19 1640 2280 29358 12.5% 5+5
12-Dec-19 5406 34764 12.5% 5+5
19-Dec-19 5406 40170 12.5% 5+5
25-Feb-20 6483 1645 41815 Private 12.5% 5+5
25-Feb-20 11129 11129 52944 State 20.0% 2.5
30-Mar-20 7566 7566 60510 BLM 12.5% 10 1.5,2.0
30-Mar-20 3465 4415 64925
Source: BNL releases in 2019 and 2020. Note our estimated gross acres do not total to the 30 March 2020 total,
indicating there have beed adjustants to the previously reported gross arces.
Independent Investment Research 11Blue Star Helium Limited (ASX:BNL)
INDICATIVE HELIUM PRODUCTION ECONOMICS AND FINANCING
Blue Star project development plan
In a release dated 26 November 2019, Blue Star management provided guidance as to
how they see the project developing. The plan includes:
–– Design, permit and drill 5 wells. In the release of 27 May 2020 the cost of these wells
was estimated to be US$300,000 for a dry well and US$400,000 for a well completed
for production.
–– Commercial production would require the installation of a separation plant to produce
A Grade Helium (ie over 97.5% He). This is most likely to be a standard modular
Pressure Swing Adsorption (PSA) plant supplied in 2 MMscf/d capacity units capable
of processing 5-10% He input gas into a 98% product stream. These plants are
available for lease from the manufacturer (eg IACX).
The time line into production requires drilling permit approval, which we expect will be
completed by September, then a month of drilling in October, subject to the success of
the initial wells, followed by feasibility study of up to three months, then mobilization,
which the company presentation of 1 June 2020 says would take around 6 months. All up,
from today, Blue Star could be in production in 6-12 months time, ie some time between
January and June 2021.
Figure 9 Timeline to production
2020 2021
Activities J A S O N D J F M A M J J A S O N D
Permitting Drilling Program
Drilling Five Well Program
Evaluation, Feasibility
Contracting Sales, Plant Lease
Permitting And Approvals
Plant mobilization to site
Production
Source: IIR estimates
What would an indicative target project look like?
Table 7 Indicative production from a single 2MMscf/d helium separation module assuming 8% helium
in feed gas
Per Day Per Month Per Year
Modularized Plant Capacity MMscf/period Raw Gas 2.00 60.0 730
Uptime 90%
Gas Processed MMscf/period 1.80 54.0 657
Helium Concentration 8.0%
Recovery 95%
Helium Recovered MMscf/period 0.137 4.10 50
Product He grade 98%
Sale Gas Volume MMscf/period 0.14 4.19 50
Source: IIR estimates based on the 2MMscf/d input and 50 MMSCF/yr Helium production commentary in the BNL
presentation of 1 June 2020 p12. The intermediate data are IIR estimates based on the helium concentration used in
the Prospective Resource announcement of 27 May 2020.
For a 5 year lease contract on the separation plant modules, a reserve of 3,650 MMscf of
raw gas would be required, which is three times covered by the 1U Prospective Resource
of 9330 MMscf of raw gas, which the consultants have estimated at a 90% probability.
The Enterprise and Galileo leases represent ~20% of the company’s gross land package
of 121,086 acres as at 30 March 2020. There is plenty of scope for significant discoveries
elsewhere in the tenement package.
Independent Investment Research 12Blue Star Helium Limited (ASX:BNL)
Helium Contract Pricing
Helium pricing is opaque, with no spot market, and no systematic disclosure of contract
pricing. With the bulk of production subject to long term contracts, including base price/
escalation, even the average realised selling prices of existing producers is not a good
guide to current price levels.
Sales Contracts are typically 10 years or more, with the producer having the right to market
around one in every 10 or 12 trailers, to get a first hand feel for market pricing. The sales
point could be at the spigot or outlet tap at the production site, or the producer could
deliver tube trailers of compressed or liquified gas to end customers.
Renergen (ASX:RLT) is building a LNG plant in South Africa with a helium byproduct. It
announced a contract with Linde on the following terms, which were probably set with
respect to market conditions in late 2018 or early 2019 (Source: Renergen Prospectus 6
June 2019 p29,p132).
–– US$200/Mscf base price
–– Escalating at US CPI
–– Take or pay up to 24MMscf/yr
–– Contract term, sales point not published, but contract is likely to be long term ie 5-10
years, and sales point is in South Africa, so close to the local market but a long way
from major demand centres, and hubs of global price formation.
Tacitus LLC is a Helium pure play currently producing in the US and it through a major
change of shareholders in early 2020. While it is unlisted, the general market commentary
at the time the interest was being marketed in late 2019 suggested that its new contracts
would be priced at closer to US$400/Mscf, while its legacy contracts were at lower price
levels.
Assessment of pre-production capital costs
Table 8 Estimated pre-production capital costs
Unit Cost US$ Total Cost Total Cost A$
Number
million US$ million million
Pre Production Capital Cost 0.65
Drill Exploration/Development wells 8 0.300 2.4 3.7
Completion as producer wells 4 0.100 0.4 0.6
Completed as Salt Water Disposal Wells 2 0.100 0.2 0.3
Plugged and Abandoned 2 0.0 0.0
Total 8 3.0 4.6
Supporting Infrastructure 0.2 0.3
Total Site Capital Cost 3.2 4.9
Source: BNL release 27 May 2020, for costs, IIR estimates for the number of holes
Well network - Blue Star has indicated that it intends to drill five wells into the Enterprise
and Galileo targets. If the successful wells perform like the wells at Model Dome, they
will produce at between 500Mscf/d to 1000Mscf/d. To produce 2Mscf/d between two and
four wells will be needed, and one well or more may be required for Salt Water Disposal
(SWD). It is likely that the company will drill some unsuccessful wells, adding US$300,000
of cost per dry hole. For the purposes of our indicative model. We assume eight wells are
drilled, with three to four completed as producers, two as Salt Water Disposal wells and
two unsuccessful holes which are plugged and abandoned. The total cost of the eight
wells would be us$3 million
Infrastructure - There will need to be support infrastructure comprising roads and buildings.
We have allowed US$0.2M for these items. In more detail, they would include:
–– Helium truck loading facility
–– Access and service roads (gravel)
–– Office and Laboratory
–– Warehouse
–– Electrical reticulation
–– Inlet header, inlet separator and inlet coalescing filter
Independent Investment Research 13Blue Star Helium Limited (ASX:BNL)
Separation Plant – These plants can be leased. IACX is particularly active in this role with
a number of similar plants at various sites in the US.
Assessment of operating cost
We have estimated the operating costs of a 2MMscf/d nameplate capacity plant producing
50MMscf/yr of helium using data from a number of publicly available sources. The reader
should take these as a guide only. The sources are identified, and the reader is encouraged
to review those sources and form her or his own view
The resultant estimated operating cost is US$70/Mscf of Helium produced, or US$291,000/
month.
This costing assumes that the company is the operator of the gas wells and the separation
plant, delivering directly into compressed tube tank trailers, which are used as site storage
and transport. We assume that the helium buyer purchases the helium at the plant spigot or
outlet tap, and the company does not pay for transport. Power is to be delivered by leased
on site generators fuelled by trucked LNG, and is part of the Separation Plant Operating
Cost. In reality, the separation plant is likely to be operated by the plant supplier, and the
lease costs will combine both the capital and operating cost of the separation plant.
Table 9 Summary of operating costs
Operating Cost US$/Mscf Raw US$/Mscf He US$’000/mth US$’000/yr
All calculations based on 1.8MMcf/d raw gas input, 50MMcf/y He output, 98% He in product gas
Lifting Expenses 0.50 6 27 324
Separation Plant Operating Cost 1.85 24 100 1200
Separation Plant (ie $3M @ 20% lease) 0.31 4 17 200
Trailer Lease (three trailers) 1.90 25 103 1233
General and Admin 0.83 11 45 540
Total 5.40 70 291 3497
Sources: see text below, with internet references at the back of this report
Gas production (lifting) costs - Once the production wells are drilled, the cost of gas
production is well known but dependent on volume and scale. In natural gas production,
almost 100% of the gas produced is saleable methane. Production costs range from
US$0.10/Mcf (Chesapeake Energy Marcellus field), A$0.20/Mcf (Chesapeake Energy
Haynesville field) producing 800-1000Bcf/yr. Blue Star will be very small by comparison,
but is also operating shallower wells, so we are comfortable using a gas extraction costs
of US$0.50/Mcf, and we would expect the actual cost to be lower.
Gas separation costs – The DBK helium field is located on Navajo land in New Mexico
but in generally the same US Mid West environment as Blue Star, and is larger but
comparable. The DBK plant produces 380Mscf/d of 98+% helium, from a ~5% helium
feed gas. In 2019, this plant cost US$75,000/month to operate. The initial Blue Star single
module is targeting 140Mcf/d from 7-8% helium feed gas, so should cost less from a
power consumption perspective. The DBK power cost is US$35,000/month supplied from
the grid. Our indicative operation would be about a third of the power usage, but more
expensive on a unit basis because it carries the cost of generator hire, operations and LNG
fuel costs. We have assumed the same overall US$/month cost to be conservative.
Separation plant lease costs – The Bruin Point Energy Limited 51-101 report dated 25
Aug 2017 mentions a capital cost for modular helium plants being between US$700,000
and US$950,000, without specifying the plant capacity or exact purpose (ie extracting
helium and nitrogen from natural gas or extraction of helium from nitrogen). We have no
data on the cost of leasing a plant, but assuming a 20%pa lease rate on a plant that would
cost US$1 million purchase, the lease cost would be US$17,000/month.
Independent Investment Research 14Blue Star Helium Limited (ASX:BNL)
Figure 10 Modular PSA Helium separation unit
Source: BNL presentation 1 June 2020
Product storage cost - DBK trucks gas trailers of helium to Ladder Creek for sale, and it
also uses gas tube trailers for gas storage on site. This is a simple solution to compressed
gas storage, and the trailers in DBK’s case is leased. DBK has to truck 380Mscf/d 660 miles
to sale point, and uses 18 compressed gas trailers, whereas Blue Star’s initial target of one
module producing 140Mscf/d and trucking 173 miles to the same sales point. In theory
that could be achieved with 1.8 trailers. We have assumed three trailers are leased. DBK
pays a rental of US$34,250/mth per trailer (DBK Due Diligence Report), so on the same
basis, leasing the three trailers would cost US$102,750/mth. We assume the offtaker pays
the actual haulage cost.
Cost of Capital
Table 10 Weighted average cost of capital 11.2% assuming zero debt
Cost of Equity Blue Star
Beta 1.95
Risk free rate (Rf) 1.8%
Market Risk over Rf 4.8%
Market premium (Rm) 6.6%
Cost of Equity 11.2%
Gearing
Gearing D/(D+E) 0.0%
Gearing E/(D+E) 100.0%
Nominal WACC
Cost of Equity Ke 11.2%
Cost of Debt Kd 6.8%
Tax Rate 27.5%
Weighted Average Cost of Capital 11.2%
Source: RBA, Yahoo Finance, Market Risk Premia.com, IIR estimates
ASSESSMENT OF COMPETITIVE POSITION
The bulk of the operating cost is related to the raw gas being processed, so the more
helium in the raw gas feed the lower would be the operating cost. Our estimated operating
cost is US$70/Mscf of gross helium. At lower concentrations of helium that operating cost
rises dramatically.
Most helium operations, the helium is a byproduct. The table below shows how much
methane has to be produced per Mscf of Helium to return the cost to US$70/Mscf Helium.
This is a rudimentary calculation and does not take into account the extra costs relating to
the methane production.
Independent Investment Research 15Blue Star Helium Limited (ASX:BNL)
Table 11 Impact of lower helium grade in operating cost
Helium Grade 0.5% 1% 2.0% 4.0% 8.0%
Operating Cost 584 310 173 104 70
Natural Gas production offset Mcf (@ US$3.50/Mscf) 147 69 29 10 0
Source: IIR estimates. Natural Gas price assumed in offset calculation is a long term price of US$3.50/Mcf. The current
spot price is around US$1.80/Mscf, and if that price were used, the Natural Gas production offset production numbers
would double.
SENSITIVITY TO OPERATING COSTS
We believe our cost estimates are very conservative at US$70/Mscf helium product
saleable at site.
There is potential for the operating costs to be as low as US$50/Mscf, or possible lower.
The sensitivity of the Net Present Value to operating costs and Reserve size is shown in
the table below.
Table 12 NPV in US$ million assuming lower operating unit costs at different Reserve sizes
Operating Cost US$/Mscf 90 70 50
Reserve MMscf
Equivalent to 1U 641 MMscf 13.8 17.9 21.9
Equivalent to 2U 3021 MMscf 72.4 91.5 110.5
Equivalent to 3U 6391 MMscf 140.3 176.1 211.8
Source: IIR estimates, based on selling price of US$200/Mscf
The flow rates from the Model Dome wells were between 500 Mscf/d to 1000Mscf/d. For
our lowest valuation, ie the 641MMscf Reserves case, we assumed all four wells operate
at lowest rate of 500Mscf/d. Higher production rates on constant unit costs improve the
NPV. The reality is that higher flow rates would also lower the unit operating cost, adding
more valuation upside.
Table 13 NPV (US$M) sensitivity to production well flow rates (Base Case 500 Mscf/d)
Output per well Mscf/d 500 750 1000
Project NPV A$M 17.9 24.8 29.1
Source: IIR estimates, , based on selling price of US$200/Mscf
INDICATIVE FINANCIAL MODEL
Table 14 Indicative financial model assuming Reserves equal to 1U Resources, processing capacity is
one 2MMscf/d unit, selling price US$200/Mscf
Dec-21 Dec-22 Dec-23 Dec-24 Dec-25 Dec-26
Revenue Calculation
Selling Price at Spiggot US$/Mscf 0 200 200 200 200 200
Gas Sold MMscf 0 51 49 46 44 42
Revenue US$ million 0.0 10.2 9.7 9.2 8.8 8.4
Royalty US$ million 0.0 -1.5 -1.5 -1.4 -1.3 -1.3
Net Revenue US$ million 0.0 8.7 8.2 7.9 7.5 7.1
Financials US$ million
Net Revenue 0.0 8.7 8.2 7.9 7.5 7.1
Opex 0.0 -3.5 -3.4 -3.2 -3.1 -2.9
D&A 0.0 -0.2 -0.2 -0.2 -0.2 -0.2
EBIT 0.0 4.9 4.7 4.4 4.2 4.0
Tax 0.0 -1.3 -1.3 -1.2 -1.2 -1.1
NPAT 0.0 3.5 3.4 3.2 3.1 2.9
Capex -3.2 0.0 0.0 0.0 0.0 0.0
Free Cash Flow -3.2 3.8 3.6 3.4 3.3 3.1
Source: IIR estimates
Independent Investment Research 16Blue Star Helium Limited (ASX:BNL)
We emphasise that this is not a valuation of Blue Star. This model represents an estimate
of one on a number of potential outcomes, depending on the outcome of exploration
drilling which we expect to occur in the second half of 2020.
This model is based on our lowest reserve expectations, where Reserves equal the1U
Prospective Resource. The helium concentration is assumed to be 8%.
The total initial or pre-production capital is estimates by us to be US$3.2 million. This
includes four successful production wells, producing at the low end 500Mscf/d, two
unsuccessful production holes that were plugged and abandoned, two Salt Water Disposal
wells, and infrastructure capital.
The selling price is assumed to be US$200/Mscf at the production plant spigot or outlet
value.
Operating costs are assumed to be US$70/Mscf, as estimated earlier in this section.
The separation plant is leased, as are the power generators, and the helium tube trailers,
which are used for both on site gas storage and gas transport.
Table 15 Indicative financial model assuming Reserves equal to 1U Resources, processing capacity is
one 2MMscf/d unit, selling price US$200/Mscf
Dec-21 Dec-22 Dec-23 Dec-24 Dec-25 Dec-26
Well Performance
Capacity MMscf/d 2000 1905 1814 1728 1645
Availability 90% 90% 90% 90% 90%
Production Mscf/d 1800 1714 1633 1555 1481
Production MMscf/yr 657 626 596 568 541
Helium Content 8.0% 8.0% 8.0% 8.0% 8.0%
Contained Helium MMscf/yr 53 50 48 45 43
Separation
Input Contained Helium MMscf 53 50 48 45 43
Recovery 95% 95% 95% 95% 95%
Output Helium MMscf 50 48 45 43 41
Sales Gas Grade 98% 98% 98% 98% 98%
Sales Gas Production MMscf 51 49 46 44 42
Capex US$ million
Production Well Cost 1.6 0.0 0.0 0.0 0.0 0.0
Salt Water Disposal Well Cost 0.8 0.0 0.0 0.0 0.0 0.0
Dry Holes 0.6 0.0 0.0 0.0 0.0 0.0
Infrastructure 0.2 0.0 0.0 0.0 0.0 0.0
Total Capex 3.2 0.0 0.0 0.0 0.0 0.0
Operating Expense
Lifting US$/Mscf Raw 0.0 0.5 0.5 0.5 0.5 0.5
Separation US$/Mscf Raw 0.0 1.9 1.9 1.9 1.9 1.9
Sep. Plant Lease US$/Mscf Raw 0.0 0.3 0.3 0.3 0.3 0.3
Transport US$/Mscf Sales Gas 0.0 24.5 24.5 24.5 24.5 24.5
G&A US$/Mscf Sales Gas 0.0 10.7 10.7 10.7 10.7 10.7
Lifting US$ million 0.0 0.3 0.3 0.3 0.3 0.3
Separation US$ million 0.0 1.2 1.2 1.1 1.1 1.0
Sep. Lease US$ million 0.0 0.2 0.2 0.2 0.2 0.2
Transport US$ million 0.0 1.3 1.2 1.1 1.1 1.0
G&A US$ million 0.0 0.5 0.5 0.5 0.5 0.5
Total US$ million 0.0 3.5 3.4 3.2 3.1 2.9
Source: IIR estimates
Independent Investment Research 17You can also read