INTEGRATED HEALTH SERVICE PLAN 2016-2019 - APPENDIX: B REGIONAL CAPACITY ANALYSIS AND PROJECTIONS (RECAP) - SOUTH EAST LOCAL HEALTH INTEGRATION ...
←
→
Page content transcription
If your browser does not render page correctly, please read the page content below
Integrated Health Service Plan 2016-2019

Appendix: B
Regional Capacity Analysis and Projections (ReCAP)
ABOUT THIS REPORT
This Regional Capacity Analysis and Projections (ReCAP) report was compiled by the
South East Local Health Integration Network (South East LHIN) as an environmental
scan of the region, and includes socio-demographic, health status, health system
utilization, health human resources, and health funding information. This report was
primarily developed to inform the South East LHIN’s Integrated Health Service Plan for
2016/17 to 2018/19, but can also be used as a reference tool for various regional
planning or research projects.

Data for this report was obtained from a variety of administrative and reporting
sources that are available at the regional, provincial, and federal levels. None of these
sources have endorsed or confirmed the accuracy of the analysis in this report. Many
subject matter experts were consulted to refine the analysis and provide comments on
the information in this report. However, in a few cases time did not allow for extensive
review and feedback from all sectors, particularly the hospital, primary, and long-term
care sectors. Readers with questions or comments about the content in this report are
encouraged to follow up with the South East LHIN Knowledge Management team.

                                                                                            2
BIRTHS AND DEATHS .................................... 24
TABLE OF CONTENTS                                                                 B IRTHS AND M ATERNAL H EALTH ....................... 24
                                                                                     Births and Fertility Rates ................................... 24
                                                                                     Birth Outcomes ................................................. 24
INTRODUCTION ............................................. 5                         Maternal Health ................................................ 25
  S OUTH E AST LHIN G EOGRAPHIC R EGIONS ............ 5                           D EATHS ..................................................... 25
                                                                                     Overall Mortality Trends ................................... 25
POPULATION AND DEMOGRAPHIC
                                                                                     Causes of Death................................................. 26
INFORMATION .............................................. 7
                                                                                     Setting of Death................................................. 27
  P OPULATION D EMOGRAPHICS AND P ROJECTED
  P OPULATION G ROWTH .................................... 7                    COMMUNITY-BASED SERVICES ...................... 28
  S OCIO -D EMOGRAPHIC C HARACTERISTICS .............. 9                          P RIMARY C ARE ............................................ 28
     Immigration and Visible Minorities .....................9                       Types of Primary Care Provider Models ............ 28
     Language ..............................................................9        Utilization of Core Primary Care Services.......... 33
     Living Arrangements for the 65+ Population .....10                              Access to, and Satisfaction with, Primary Care . 34
     Education ...........................................................10
     Labour Force Activity .........................................11            C OMMUNITY H EALTH C ENTRES ......................... 35
     Income ...............................................................11        Client Characteristics ......................................... 36
     Material and Social Deprivation ........................11                      Individual encounters with CHC providers ........ 36
                                                                                     Group Encounters with CHC providers ............. 38
  U NIQUE P OPULATIONS .................................. 12
     Francophone Population ...................................12                 C OMMUNITY S UPPORT S ERVICES ...................... 39
     Indigenous Population .......................................13                 General Data Notes ........................................... 39
                                                                                     General Observations ........................................ 40
HEALTH BEHAVIOURS, HEALTH STATUS, AND                                                Home Support Services ..................................... 41
CHRONIC DISEASE ....................................... 15                           Hospice Services ................................................ 42
                                                                                     Specialized Services ........................................... 42
  H EALTH B EHAVIOURS .................................... 15
                                                                                     Alzheimer Societies ........................................... 43
     Poor Diet ............................................................15
     Physical Inactivity ...............................................15        C OMMUNITY A DDICTIONS AND M ENTAL H EALTH ... 44
     Daily Smokers.....................................................16            Overview of the Addictions and Mental Health
     Heavy Alcohol Consumption ..............................16                      Redesign ............................................................ 44
     Influenza Vaccination .........................................16               General Data Notes ........................................... 45
                                                                                     Utilization of Community AMH Services ........... 46
  H EALTH S TATUS AND C HRONIC C ONDITIONS ........ 17
                                                                                     Community Addictions Services ........................ 48
     Health Status ......................................................17
                                                                                     Community Mental Health Services .................. 50
     Chronic Conditions .............................................18
     Hospitalizations for Chronic Conditions.............22                       H OME C ARE ................................................ 53
     Health Status and Chronic Conditions in the 65+
     Population ..........................................................22

                                                                                                                                                           3
HOSPITAL-BASED SERVICES .......................... 54                         LONG-TERM CARE ........................................ 73
  H OSPITALS IN THE S OUTH E AST LHIN ................ 54                          Bed Supply ......................................................... 73
  E MERGENCY D EPARTMENT ............................. 55                          Wait List and Demand ....................................... 74
     Overall Utilization ..............................................55          Resident Characteristics .................................... 75
     Utilization by Hospital ........................................56
                                                                              HOSPICE PALLIATIVE CARE ............................ 76
     Time of Day ........................................................56
     Lengths of Stay ...................................................57         Hospital-Based Services - Acute Inpatient ........ 76
                                                                                   Community-Based Services ............................... 79
  S AME D AY S URGERY ..................................... 57
  A CUTE I NPATIENT ........................................ 59               HEALTH LINKS .............................................. 80
     Overall Utilization ..............................................59          Overview of the Health Links Initiative ............. 80
     Alternate Level of Care (ALC) .............................60                 Describing the Health Links Target Population . 80
     Services and Programs .......................................61
  S URGICAL AND D IAGNOSTIC W AIT T IMES AND                                  HEALTH HUMAN RESOURCES ......................... 83
  V OLUMES .................................................. 62                P HYSICIANS ................................................ 83
     Completed Cases................................................62             Overall Trends by Specialty ............................... 83
     Open Surgical Cases ...........................................64             Family Physicians ............................................... 83
  I NPATIENT M ENTAL H EALTH ........................... 66                     A LLIED H EALTH P ROFESSIONALS ....................... 86
  C RITICAL C ARE ............................................ 66
     Overall Volume and Distribution of Services .....66                      FUNDING .................................................... 89
     Source of Admission ..........................................67           O VERVIEW OF H EALTH S YSTEM F UNDING R EFORM . 89
     Patient Demographic and Clinical
                                                                                   Why Change is Necessary.................................. 89
     Characteristics....................................................68
                                                                                   Shifting from the Historic Funding Approach .... 89
     Interventions ......................................................69
                                                                                   Components of Health System Funding
     Discharge Information .......................................69
                                                                                   Reform ............................................................... 89
     Average Lengths of Stay.....................................69
                                                                                   HSFR Funding Implications ................................ 91
     Occupancy Rates ................................................70
     Avoidable Days...................................................70        O VERALL F UNDING BY S ECTOR ......................... 94
     Readmissions .....................................................70
                                                                              HEALTH SYSTEM PERFORMANCE .................... 95
     Mortality Rates ..................................................70
                                                                                MLAA I NDICATOR R ESULTS ............................. 95
  P OST A CUTE C ARE ....................................... 71
                                                                                   Performance Indicators ..................................... 95
     Complex Continuing Care ..................................71
                                                                                   Monitoring Indicators........................................ 97
     Inpatient Rehabilitation .....................................71
                                                                              APPENDIX A – GLOSSARY OF TERMS .............. 99

                                                                                                                                                          4
information used (e.g. calendar or fiscal year) is noted
INTRODUCTION at the start of each section.
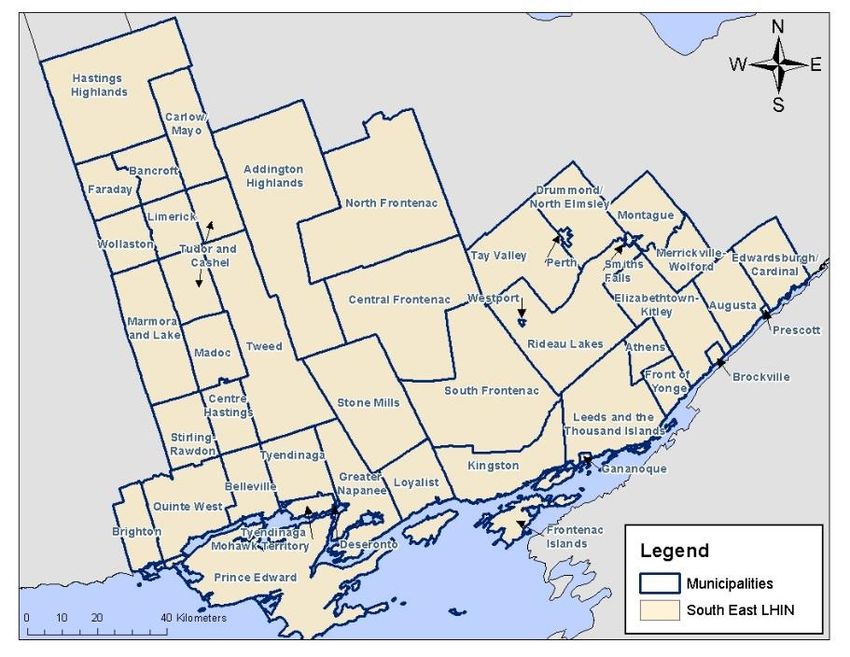
South East LHIN Geographic
This Regional Capacity Analysis and Projections
(ReCAP) report is intended to provide data analysis at
Regions
the local level to support recommendations related to
the development of the Integrated Health Service Plan Historically, ReCAP analyses have been based on the
(IHSP). For this third iteration of ReCAP, the analysis is SubLHIN geographies, along with other geographic
in support of IHSP4 for the fiscal year 2016/17 to groups that make up the LHIN. However, with the
2018/19 period. introduction of the Health Links initiative in the South
East LHIN in 2013, analysis and planning efforts have
The guiding principle behind this effort is that if been focused on these new geographic regions.
programs/services are to meet the needs of the
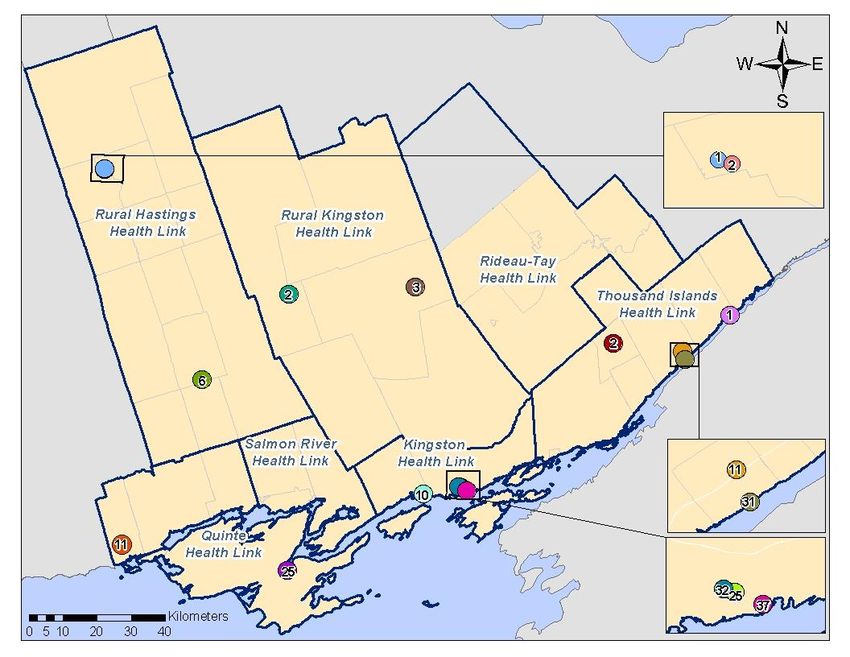
population, then greater emphasis has to be placed on A map with the seven South East LHIN Health Link
the evidence behind local planning and be supported geographies is shown in Figure 1. Maps for the other
by the collection and analysis of available data and geographic regions commonly used for planning
projections at the local level. Information in this purposes (Public Health Units, SubLHINs, and
analysis was obtained in part from the IHSP municipalities) are also included.
Environmental Scan from the Health Analytics Branch
at the Ministry of Health and Long-Term Care
(MOHLTC), and more detailed and local analyses were
accomplished using a number of data sources available
to the South East Local Health Integration Network
(South East LHIN).
The ReCAP analysis has been divided into a variety of
components, including sections on the South East LHIN
population (socio-demographic characteristics, health
status and behaviours, births, and deaths), utilization
profiles of different health system sectors and services
within the South East LHIN, information on Health
Links and their target population, a summary of health
human resources, and information on Health System
Funding Reform (HSFR) and its implications for the
health system. Because the results are quite extensive,
only a bulleted summary of the key findings are
presented in this report.
In most cases, annual information is summarized based
on the fiscal year, which is defined as the period
between April 1 and March 31. The type of annual
5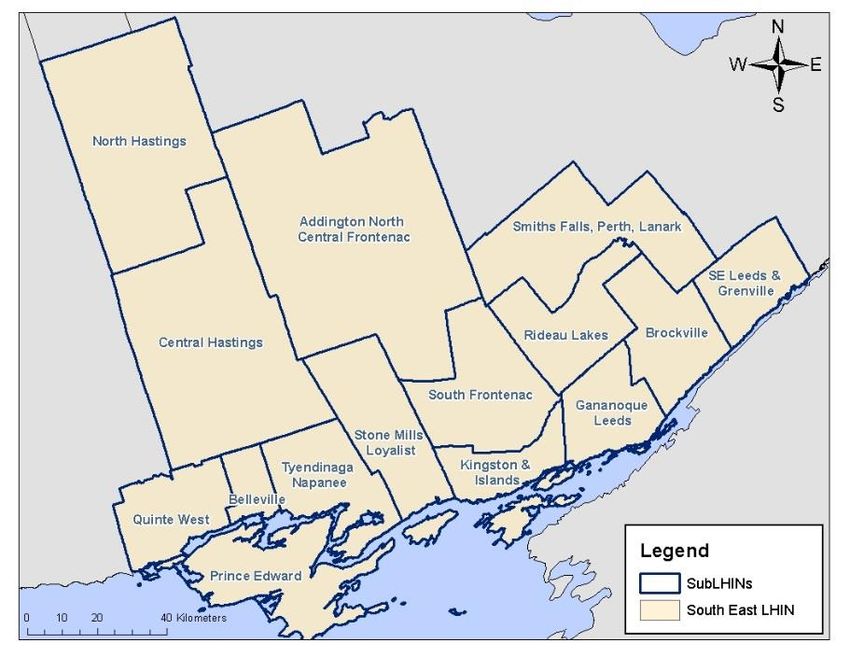
Figure 1: South East LHIN Geographies: (1) Health Links; (2) Public Health Units; (3) SubLHINs; (4) Municipalities.

(1)                                                                          (2)

(3)                                                                         (4)

                                                                                                                      6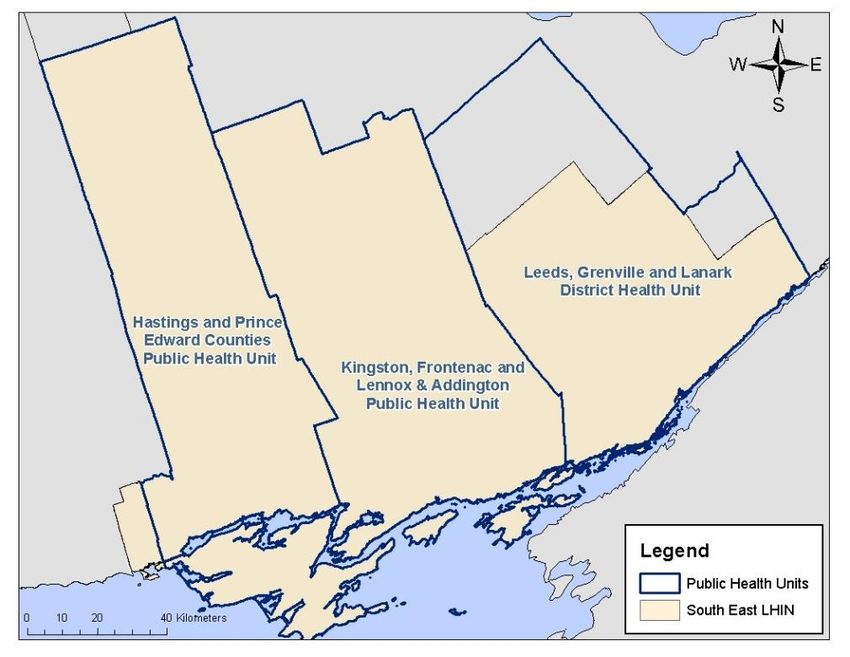
Figure 2: Population Pyramid for the South East LHIN, 2011,
POPULATION AND                                             2016, 2021, and 2026.

DEMOGRAPHIC
INFORMATION

Population Demographics and
                                                                                  Population
Projected Population Growth                                                       Count

Population estimates and projections were obtained
from the Ontario Ministry of Finance. Detailed
projections by SubLHIN and Health Link were computed
                                                            •   As of 2013, one in five South East LHIN residents
by the South East LHIN using a cohort component
                                                                were 65+ years of age. This percentage has
methodology that incorporates factors such as deaths,
                                                                increased from 16.6% in 2006 and is projected to
births, and migration. A detailed explanation for the
                                                                continue increasing as the “boomer” generation
projections methodology can be found here.
                                                                (approximately those 45-64 years of age) ages. By
                                                                2016, those aged 65+ will account for 22% of the
•   As of 2014, the South East LHIN was home to                 LHIN’s population, and by 2026, this proportion
    almost 495,000 people. This accounts for 3.6% of            will rise to 28% (Figure 2). In all of these years, the
    the population of Ontario, making the South East            South East LHIN is expected to have the highest
    LHIN the second smallest LHIN based on total                proportion aged 65+ compared to all the LHINs.
    population.                                                 The 65+ age group is projected to grow in all
                                                                regions of the South East LHIN with average
•   A quarter of the population lives in a large urban
                                                                annual growth between 3.0% and 3.8% between
    centre, while 45% live in a rural area, making the
                                                                2011 and 2026.
    South East LHIN the most rural LHIN population in
    Ontario.                                                •   The 65+ age group is the only age group growing
                                                                dramatically in the South East LHIN, with
•   Just over half of the population lives in the
                                                                projected negative average annual growth rates
    municipalities of Kingston, Belleville, Quinte West,
                                                                for younger age groups. The 75+ population is
    Prince Edward County, and Brockville. Kingston is
                                                                projected to increase by 50% by 2025 and double
    the only municipality with a population greater
                                                                in size by 2033.
    than 100,000; all other areas have a population of
    about 50,000 or less.                                   •   By 2018 (in the time frame of this IHSP), 10% of
                                                                South East LHIN residents will be 75 years of age
•   Between 2009 and 2013, the LHIN population
                                                                and over. By 2025, this will increase to 13%.
    increased by only 1.5%, which was much lower
    than the Ontario growth rate of 3.5%.                   •   The 65-74 and 75+ age groups are projected to
                                                                grow in all Health Links between 2016 and 2021
•   By 2017, there will be more people aged 70 and
                                                                (Table 1). The highest annual growth rate for
    over than those aged 15 and below in the South
                                                                those 65-74 is projected to be in Salmon River
    East LHIN.

                                                                                                                     7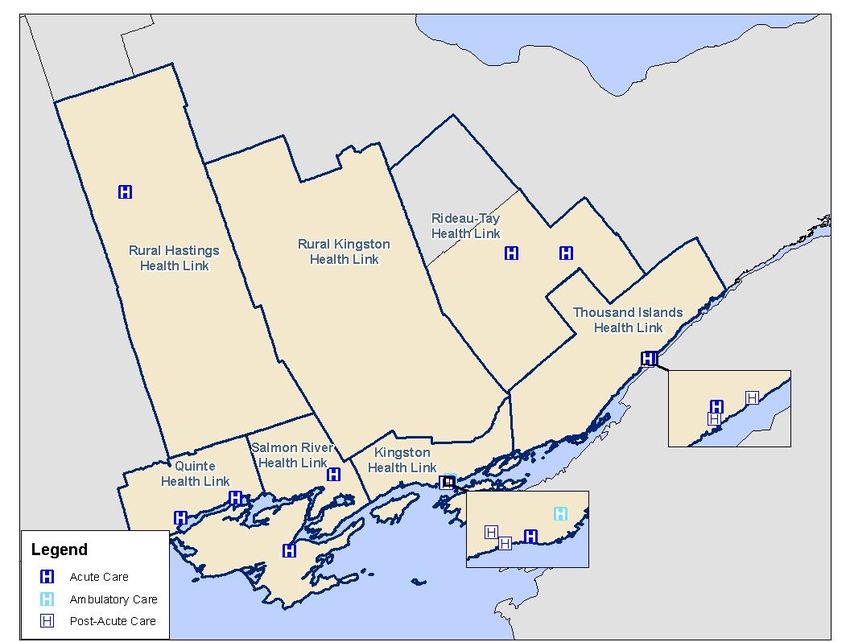
(3.5% annual growth), and the highest rate for              Table 1: Projected Average Annual Population Growth
      those 75+ is in Salmon River and Rural Kingston             between 2016-2021 by Health Link and Age Group.
      (both 4.8%).
                                                                                               Age Group
                                                                   Health Link                                          Total
•     The younger age groups will generally experience                             00-19 20-44 45-64 65-74      75+
                                                                Rural Hastings      -0.1% -0.4% -1.2%    2.7%    4.3%    0.4%
      negative growth in each Health Link, except for
                                                                Quinte              -0.1% -0.4% -0.8%    2.7%    3.1%    0.3%
      the Kingston Health Link where there will be              Salmon River        -0.2%  0.0%    0.4%  3.5%    4.8%    1.0%
      minimal growth (just over 1% annually) in the 0-          Rural Kingston      -0.7% -0.1% -0.7%    2.1%    4.8%    0.3%
      19 and 20-44 year age groups (Table 1).                   Kingston             1.3%  1.1% -0.6%    2.5%    3.0%    1.0%
                                                                Rideau-Tay          -0.7% -0.6% -2.2%    2.9%    4.2%    0.0%
•     The Rideau-Tay and Rural Hastings Health Links            Thousand Islands    -1.7% -1.1% -1.2%    2.0%    3.7%   -0.2%
      are projected to have the highest percentage of           South East LHIN      0.0%  0.1% -0.9%    2.5%    3.6%    0.5%
      the population aged 65+ in 2016 (25.9% and
      25.4%, respectively) (Figure 3). By 2021, the                     highest number of residents aged 65+ in 2016
      population aged 65+ is expected to account for                    (30,538 and 24,172, respectively).
      about 30% of the population in both of these                 •    The aging population in the South East LHIN will
      areas.                                                            have implications for various health issues,
•     In terms of absolute numbers, the Quinte and                      programs, and sectors, which will be explored
      Kingston Health Links are projected to have the                   further in later sections of the ReCAP analysis.

    Figure 3: Population Pyramid by Health Link, South East LHIN, 2011, 2016, 2021, and 2026.

                                                                                                                           8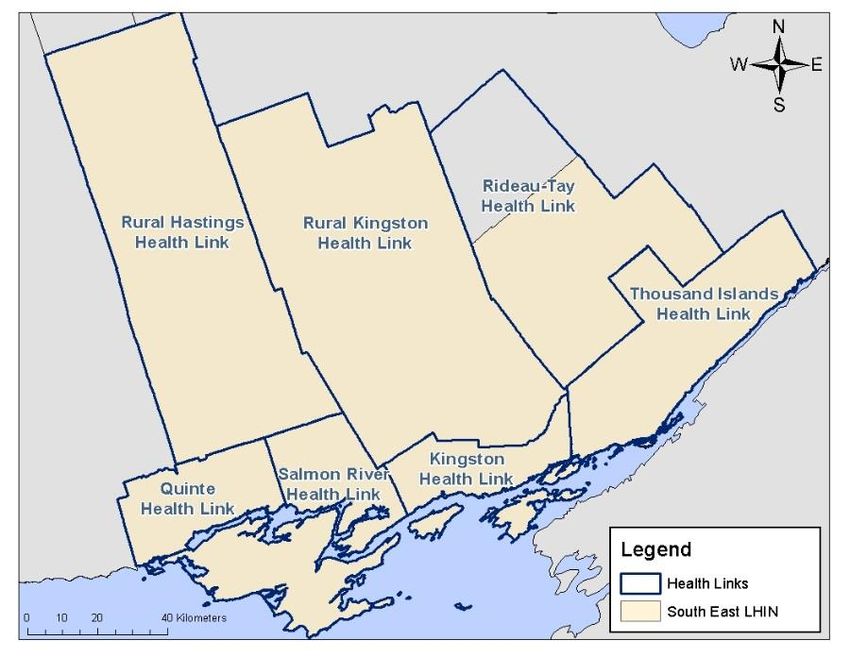
•   Just 3.4% of South East LHIN residents were
Socio-Demographic                                               visible minorities (compared to 25.9%
Characteristics                                                 provincially). There were larger visible minority
                                                                populations in the municipalities of Kingston
Examining socio-demographic characteristics is a                (7.4%) and Belleville (4.9%).
means for understanding the population at a                 •   The majority (79%) of South East LHIN residents
general level, but it is also important for                     were born in Ontario, followed by other places in
identifying possible variation in social factors                Canada (12%), Europe (5%), and the USA,
known to be associated with health status and                   Caribbean/Central & South America, and
health outcomes.                                                Asia/Middle East (~ 1% each).
                                                            •   Certain areas of the South East LHIN had a higher
Information in this section was obtained from the               proportion of residents born in other countries
Statistics Canada 2011 Census and National Household            (e.g., Asia and the Middle East in Kingston – 3.4%
Survey (NHS). Due to high non-response rates for                of the population).
certain areas for the NHS, data for certain
municipalities were not released by Statistics Canada
due to data quality concerns. As a result, the South East   LANGUAGE
LHIN could not use NHS information to produce socio-
demographic information at the Health Link level. LHIN      •   About 9 in 10 people in the South East LHIN
level-estimates were released by the MOHLTC and                 (91.9%) reported English as their mother tongue
were deemed to have acceptable data quality. Also               in 2011, which was substantially higher than the
note that changes in data collection methods between            provincial rate (70.4%) and highest of all the
the NHS and previous census years impaired the ability          LHINs (Figure 4).
to interpret trends over time for NHS indicators.           •   About 3% of the South East LHIN population (or
                                                                about 13,800 people) reported French as their
Definitions for these indicators, as well as additional         mother tongue in 2011. Only 0.2% had no
details about the Census and NHS, can be found here.            knowledge of neither English nor French.
                                                            •   The proportion of the South East LHIN population
IMMIGRATION AND VISI BLE                                        with French as mother tongue has increased
                                                                slightly over time (was 2.4% in 1996).
MINORITIES
                                                            •   The proportion of the population with French as a
•   The South East LHIN has a relatively low                    mother tongue was highest in the Kingston
    proportion of immigrants and visible minorities. In         (3.6%), Rideau-Tay (3.3%), and Thousand Islands
    2011, 8.5% of the population were immigrants                (2.9%) Health Links. Rates were higher when
    (compared to 28.5% provincially) and less than 1%           looking at smaller areas of geography, in
    were recent immigrants (arriving in Canada                  particular municipalities in the eastern part of the
    between 2006 and 2011) (Figure 4). The highest              LHIN (Merrickville-Wolford,
    proportion of immigrants were in the                        Edwardsburgh/Cardinal, and Montague, all >4%)
    municipalities of Kingston and Brighton (~13% of            and larger municipalities including Kingston and
    the population).                                            Quinte West (both ~4%).

                                                                                                                    9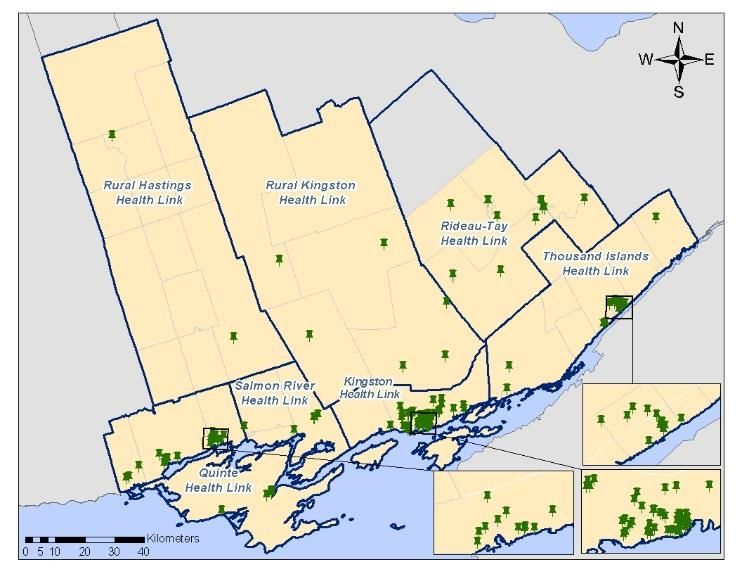
•   Nearly all (96.8%) South East
    LHIN residents reported             Figure 4: Select socio-demographic characteristics, South East LHIN and Ontario,
    speaking English most often         2011.
    at home.
•   The proportion of the South
    East LHIN population with
    French or other languages
    as mother tongue increased
    with increasing age.

LIVING
ARRANGEMENTS
FOR THE 65+
POPULATION
•   In 2011, the majority
    (67.4%) of the population
    aged 65 and over in the
    South East LHIN lived with
    relatives in a private
    dwelling (Figure 4).              Note: Number in brackets indicates the LHIN rank (out of the 14) for each indicator.

•   The proportion of the 65+
    population living alone in the South East LHIN
    (24.1%) was slightly higher than for the province                EDUCATION
    as a whole (22.8%).
                                                                     •    In 2011, 12.5% of South East LHIN residents
•   Females aged 65+ were more likely to live alone                       between 25 and 64 years of age had less than a
    than males (31.8% versus 15.0%).                                      high school education (Figure 4). This rate was
•   Across the LHIN the population aged 65+ living                        slightly higher than the province as a whole
    alone was highest in the Kingston and Thousand                        (11.0%) and has declined over time. The
    Islands Health Links (28.1% and 26.5%,                                percentage of those with less than a high school
    respectively) and lowest in the Rural Kingston                        education was highest in the municipalities of
    Health Link (19.4%).                                                  Tudor and Cashel, Faraday, and Tyendinaga
                                                                          Mohawk Territory (all higher than 27%).
•   The proportion living alone has either remained
    the same or declined over time in all areas of the               •    In 2011, 59.9% of South East LHIN residents
    LHIN (was 27.1% in 1996 for the South East LHIN                       between 25 and 64 years of age had completed
    overall).                                                             some form of postsecondary education. This
                                                                          proportion was lower than the province as a
                                                                          whole (64.8%).

                                                                                                                             10
LABOUR FORCE ACTIVIT Y MATERIAL AND SOCIAL
• Labour force participation rates in 2011 were
DEPRIVATION
lower for the South East LHIN compared to the The deprivation index information presented below
province as a whole (61.0% versus 65.5%, Figure was produced using the methodology developed by
4), which is likely due to the relative size of the Pampalon et al. (see details here). Calculation of the
65+ population in the LHIN. deprivation index for 2011 has not been completed due
• Labour force participation rates were higher for to the data quality issues associated with the NHS.
males compared to females. • Based on data from 2006, certain rural areas of
• Certain areas of the LHIN have lower labour force the LHIN were noted to have higher levels of
participation rates; however, most are areas with material deprivation including Addington
a relatively larger population over 65 years of age North/Central (N/C) Frontenac and North
(e.g., Tudor and Cashel, Limerick, and Faraday). Hastings SubLHIN areas (Table 2). Conversely,
more urban areas tended to be more socially
• Unemployment rates in 2011 were similar deprived, particularly in Kingston & Islands and
between the South East LHIN and the province as Belleville. Looking at the combined material and
a whole (8.0% versus 8.3%). social deprivation measure, Addington N/C
• Certain areas of the LHIN have relatively low Frontenac, North Hastings, and Belleville were
unemployment rates (e.g., Centre Hastings noted to be most deprived.
(2.8%), Westport (3.4%), and Frontenac Islands
(3.7%)). Table 2: Deprivation index rankings (using quintile levels
• Unemployment rates have increased between 1 = less deprived to 5 = more deprived) by type (material,
social, and combined) and SubLHIN area, 2006.
2006 and 2011 in most areas.
SubLHIN Material Social Combined
Addington N/C Frontenac 5 2 5
Belleville 2 5 4
INCOME Brockville 2 4 3
Central Hastings 3 2 4
Gananoque Leeds 1 3 2
• Fourteen percent of the South East LHIN
Kingston and Islands 1 5 3
population were living in low income in 2011, North Hastings 4 3 5
which was similar to the province overall (Figure Prince Edward County 1 2 2
Quinte West 2 2 3
4).
Rideau Lakes 1 2 2
• There was a marked difference in the percent of SE Leeds Grenville 2 2 3
Smiths Falls, Perth, Lanark 2 4 4
population living in low income across the LHIN, South Frontenac 1 1 1
ranging from 3.0% in Frontenac Islands to 39.7% Stone Mills Loyalist 1 1 2
in Tudor and Cashel. Tyendinaga Napanee 3 2 3
11additional inclusion criterion is typically
Unique Populations associated with immigrants to Canada, of which
the South East LHIN has a relatively low
Certain populations within the South East LHIN proportion.
have different health needs or require different
• Additional information on the population
approaches to service provision. The Francophone
reporting French as their mother tongue can be
and Indigenous populations are two such groups
found in the Socio-Demographic Characteristics
that the South East LHIN works with to ensure
section of this document.
optimal health outcomes and equitable access to
services.
Health Status and Health Service
Currently, there are no comprehensive, routine
Utilization
sources of information on the health and health
system utilization of the Francophone and • The Champlain and South East LHINs have
Indigenous populations in the South East LHIN. identified a need for data on Francophone’s
Routine collection of population health and utilization of health services and health status in
service utilization information for these order to plan, fund, and integrate health services
populations is required in order to better plan for in accordance with the needs of the Francophone
the health service needs of these groups. populations in their geographies. A pilot project is
underway which will examine the feasibility of
Information in this section was obtained from the collecting information about a patient’s linguistic
profile at the time of registration with hospitals.
Statistics Canada 2011 Census and National Household
In addition, it will examine the feasibility of
Survey (NHS). See the previous section for additional
data notes and limitations. making this information available to the LHINs in
a format that is useful for planning purposes. The
planned completion date for this project is end of
FRANCOPHONE POPULATI ON fiscal year 16/17.
Demographic Characteristics
Community Engagement
• According to the 2011 Census, 3.0% of the South
East LHIN population (or about 14,100 people) • As part of the Health Care Tomorrow initiative, a
were Francophones, based on the inclusive project championed by the South East LHIN that
definition of the Francophone population (IDF) aims to redefine the health care system across
adopted by the Ontario government in 2009. This our region, a web-based community engagement
definition typically results in higher estimates of survey was used to collect information on health
the Francophone population compared to the system priorities, as well as opinions on what
French as mother tongue definition as it also currently works well or does not work well in the
includes “those whose mother tongue is neither health system. As part of this survey, respondents
French nor English but have a particular were asked to identify their mother tongue.
knowledge of French as an Official Language and Responses from those who identified French as
use French at home”. The impact of the change of their mother tongue were analyzed to understand
definition in the South East LHIN is minimal the priorities and needs identified by the
(~0.1%) compared to the province overall as the Francophone population.
12• Generally, responses from Francophones as a First Nations person, 1.0% as Métis, and 0.2%
mirrored those of non-Francophones in terms of as having multiple and/or other Aboriginal
health system priorities, importance of select identities.
services, concerns about services being moved
• Due to suppression of NHS data in certain areas of
from a community, and issues with seeking
the LHIN (e.g., Deseronto and Wollaston) and
specialist treatment.
other challenges associated with the collection of
• Three key themes emerged from the feedback Aboriginal population data, the LHIN estimate of
from Francophone respondents: the population with an Aboriginal identity is likely
an underestimate of the true value. These
o Communication: Need for clinical staff who
limitations surrounding current data on
can communicate in French (or availability of
Indigenous populations have been recognized at
an interpreter), coordination between
the provincial level and avenues to enhance our
different levels of care, and increased respect
understanding of these populations are being
for patients who do not understand English
explored.
o Access: Need for reduction of wait times for
• Despite the likely undercounting of those with an
select services, availability of local service,
Aboriginal identity, the proportion of the
and a listing of French speaking health service
population reporting an Aboriginal identity has
providers.
increased since 1996, both locally and provincially
o Quality of care: Shifting care to the (both were 1.3% in 1996). Statistics Canada has
community, use of multidisciplinary teams, noted that in addition to natural increases (e.g.,
and holistic approaches to care. births and migration), the increase in the
population reporting an Aboriginal identity is
likely in part due to ethnic mobility (i.e., changes
INDIGENOUS POPULATIO N in self-reporting of cultural affiliation).
Demographic Characteristics
• We have used the term Indigenous as an inclusive Health Status and Health Service
term to describe individuals and collectives who Utilization
consider themselves as being related to and/or
• In terms of available information on the health
having historical continuity with “First Peoples”.
status of the Indigenous population in the South
By using this term, individuals and communities
East LHIN, a previous provincial survey of the
will be supported in self-defining what it means to
Métis population identified issues in the South
them. However, NHS data presented below uses
East LHIN regarding the health status, as well as
other terms as it reflects how questions are asked
the service utilization and access, of this
of respondents.
population group. A summary of this information
• About 3.9% of the South East LHIN population can be found in the previous ReCAP report.
reported an Aboriginal identity in 2011 compared
• The South East LHIN will continue to work with
to 2.4% for Ontario as a whole, with larger
the different Indigenous groups across the region
populations in certain areas of the LHIN (e.g., the
to better understand their population health
municipalities of Tyendinaga Mohawk Territory,
status and health care needs.
Tudor and Cashel, Limerick, and Bancroft). In the
South East LHIN, 2.6% of the population identified
13Mohawks of the Bay of Quinte
• The Mohawks of the Bay of Quinte First Nation is
one Indigenous group within the South East LHIN.
As of February 2015, the registered population
with the Mohawks of the Bay of Quinte was
8,099, of whom 24% live on the Tyendinaga
Mohawk Territory reserve. The Mohawks of the
Bay of Quinte population is generally younger
than the overall South East LHIN population,
particularly those living on reserve.
• The Community Wellbeing group of the Mohawks
of the Bay of Quinte delivers health and social
services using a unique approach to holistic
services to help meet the emotional, intellectual,
physical, and spiritual needs of the community.
Health programs delivered by this group include
home support, community health, home and
community care, and diabetes education.
• Health priorities identified by the Mohawks of the
Bay of Quinte include:
o Addictions and Aftercare
o Mental Health
o Heart Disease
o Fetal Alcohol Spectrum Disorders
o Assisted Living
o Cancer Screening and Care
o Diabetes
o Chronic Disease Management and Prevention
142005 and was similar to the 2013-14 provincial
HEALTH BEHAVIOURS, rate of 61.2% (95% CI 60.3%-62.1%). Rates were
significantly higher in males compared to females
HEALTH STATUS, AND and were similar across all age groups. Rates in
those aged 65+ have significantly increased since
CHRONIC DISEASE 2005, with nearly a 20% difference. By region,
rates have increased in the Leeds, Grenville and
Lanark District and Hasting Prince Edward Public
Health Behaviours Health Units.
Unhealthy behaviours can lead to the PHYSICAL INACTIVITY
development of various health issues, which in
turn decrease quality of life and increase health Physical activity reduces the risk of premature
system utilization. An understanding of the morbidity and mortality, particularly in relation to
current state of these behaviours in the South cardiovascular disease, hypertension, cancer, and
East LHIN can inform planning for future care osteoporosis. It is also associated with positive
needs of the population, as well as identify needs mental health and is an important risk factor for
related to health promotion activities completed overweight and obesity.
by partner sectors such as public health. • In 2013-14, nearly half (45.6%, 95% CI 42.5%-
48.8%) of the population in the South East LHIN
Information on health behaviours is captured through were classified as inactive in their leisure time
the Canadian Community Health Survey. Information is (Figure 5). Rates of physical inactivity in the South
collected from the population 12 years of age and over East LHIN declined between 2001 and 11/12 but
for two-year calendar periods as of 2007-08. Prior to appear to have increased in 2013-14, bringing the
2007, the CCHS collected data every two years over a South East LHIN rate closer to the provincial rate
12-month period. Further information on the CCHS and (46.3%, 95% CI 45.4%-47.3%).
definitions and data notes for these indicators can be
found here.
Figure 5: Self-reported prevalence of various health
behaviors, South East LHIN and Ontario, calendar years
POOR DIET 2013-2014.
Low consumption of fruits and vegetables is
associated with an increased risk of
cardiovascular disease, stroke, functional declines
associated with aging, and possible increased risk
of certain types of cancer.
• The majority (60.0%, 95% Confidence Interval (CI)
57.2%-62.9%) of the population in the South East
LHIN reported consuming fruits and vegetables
fewer than five times per day in calendar years
2013-14 (Figure 5). This rate has increased since
15• Rates of physical inactivity increased with have remained relatively consistent over the past
increasing age and were similar for both sexes, as ten years.
well as across the three South East LHIN public
• In South East LHIN, rates of heavy alcohol
health units in 2013-14.
consumption were higher for males and among
those 18-44 years of age. Rates were similar
across the three South East LHIN public health
DAILY SMOKERS
unit regions.
Smoking tobacco is the most important
preventable cause of lung cancer. It can also
contribute to the development of leukemia and INFLUENZA VACCIN ATION
cancers of the bladder, stomach, kidney,
Influenza vaccination can prevent infection and
pancreas, and cervix. It is also associated with
reduce the morbidity, mortality, and health
Chronic Obstructive Pulmonary Disorder (COPD)
system utilization associated with this illness,
and cardiovascular diseases.
particularly in vulnerable populations such as the
• About one in five (19.5%, 95% CI 16.6% - 22.3%) elderly.
South East LHIN residents report being daily
• In 2013-14, only 41.7% of South East LHIN
smokers, which was significantly higher than
residents reported receiving an influenza
provincial levels in 2013-14 (13.1%, 95% CI 12.5%-
vaccination within the last year. This rate has
13.6%) (Figure 5). While rates for the province
remained relatively constant over time and has
have steadily declined over time, rates in the
remained consistently higher than the provincial
South East LHIN have not changed significantly
rate (which was 33.5% in 2013-14). Rates were
over the past ten years.
significantly higher for females, as well as higher
• Rates were highest in the 18-44 and 45-64 year in the 46-64 and 65+ year age groups. In 2013-14,
age groups. While not significantly different, rates about four in five South East LHIN residents aged
appear to be higher for males and in the western 65+ reported receiving an influenza vaccination
and eastern part of the LHIN. within the last year. Rates were relatively
constant across the three public health unit
regions in the South East LHIN.
HEAVY ALCOHOL CONSUM PTION
• About three-quarters (74.0%, 95% CI 71.1%-
Health problems associated with heavy alcohol 76.8%) of the South East LHIN population
consumption over time include diseases of the reported ever receiving an influenza vaccine as of
liver, pancreas, and nervous system, as well as 2013-14. Again, this was higher than the
certain cancers (e.g., upper respiratory system, provincial rate of 64.1%. Rates have increased
digestive system, and breast). over time for both sexes, all age groups, and in
the three public health unit regions within the
LHIN.
• About one in five (18.6%, 95% CI 16%-21.1%)
South East LHIN residents were classified as heavy • Of note, nearly all (90.6%) of those aged 65+
drinkers in 2013-14 (Figure 5). This rate was not reported ever receiving an influenza vaccination.
significantly higher than the provincial rate of
16.6% (95% CI 15.9%-17.2%). Rates in both areas
16• Rates of reported very good/excellent health and
Health Status and Chronic fair/poor health were similar between the sexes.
Conditions • With increasing age, a lower proportion of the
population reported very good/excellent health
Information on the health status and chronic conditions and a higher proportion reported fair/poor
of the South East LHIN population is captured through health. While rates over time were fairly stable
the Canadian Community Health Survey (see the within most age groups, it appears that the
previous section for additional information about the proportion of those aged 65+ reporting fair/poor
survey). For chronic conditions, people aged 12 and health has decreased over time. Differences in
over are asked to self-report if they have one of these rates over time were significant for the province
“long-term conditions” that are expected to last or overall but not for the South East LHIN. In 2013-
have already lasted 6 months or more, and that have 14, 23.2% (95% CI 19.2%-27.2%) of those aged
been diagnosed by a health professional. The chronic 65+ reported fair/poor health, compared to
disease indicators are presented in order of descending 28.0% (95% CI 23.3%-32.8%) in 2001. Similarly,
prevalence. the proportion of those aged 65+ reporting very
good/excellent health has increased over time.
Note that diabetes prevalence is determined using a
validated algorithm that incorporates data from
• For both indicators, rates were generally more
favorable in the Kingston, Frontenac and Lennox
various administrative sources (see the MOHLTC Key
& Addington Health Unit compared to the other
Performance Measures for the Ontario Diabetes
South East LHIN regions.
Strategy report for details). Also, the incidence of
various types of cancers was obtained from the Ontario
Cancer Registry (2012 for SEER*Stat Release 9 Nov.
Self-Perceived Mental Health
2012, Cancer Care Ontario).
Perceived mental health is a general indication of
the number of people in the population suffering
HEALTH STATUS from some form of mental disorder, mental or
emotional problems, or distress, and is not
Self-Perceived Health necessarily reflected in self-perceived health.
This indicator can serve as a proxy of general • In 2013-14, 69.2% (95% CI 66.3%-72.1%) of the
health in the population; health means not only South East LHIN population reported that their
the absence of disease or injury but also physical, mental health status was very good/excellent.
mental, and social wellbeing. This was similar to the provincial rate of 70.6%
• About three-fifths of the South East LHIN (95% CI 69.8%-71.5%). Rates in both areas have
population (59.8%, 95% Confidence Interval (CI) declined over time (from 73.9% (95% CI 71.8%-
56.7%-63%) reported that their health was very 76.1%) in the South East LHIN in 2003). While a
good/excellent in calendar years 2013-14. This much lower rate overall, it appears that the
was similar to the provincial rate of 59.5% (95% CI proportion of the population reporting that they
58.7%-60.4%). However, about one in ten South have fair/poor mental health has increased
East LHIN residents (13.5%, 95% CI 11.5%-15.6%) slightly over time. In the South East LHIN, rates
reported that their health was fair/poor. Rates for increased from 4.8% (95% CI 3.8%-5.7%) in 2005
both indicators have been relatively consistent to 8.4% (95% CI 6.7%-10%) in 2013-14.
over time for the South East LHIN and Ontario.
17• While high variability in the rates for South East classified as obese in 2013-14. This rate has
LHIN impair comparisons between sub-groups, steadily increased over time and was significantly
provincially, rates of fair/poor self-perceived higher than the provincial rate of 19.2% (95% CI
mental health were higher in females and those 18.5%-19.9%) in 2013-14. The difference between
45-64 years of age. the South East LHIN and Ontario rates has been
increasing in recent years.
• Rates of very good/excellent self-perceived
mental health were relatively consistent over • Rates in 2013-14 were similar between males and
time in all South East LHIN regions except for the females. Provincially, rates were highest for those
Hastings Prince Edward Public Health Unit, where 45-64 years of age. This difference between age
rates appear to have decreased in the last 10 groups appears to be consistent for the South
years (from 74.3% (95% CI 70.6%-77.9%) in 2003 East LHIN; however, rates by age group were not
to 64.1% (95% CI 58.8%-69.4%) in 2013-14). significantly different.
• Across the South East LHIN, rates have increased
between 2005 and 2013 for Kingston, Frontenac
Self-Perceived Life Stress
and Lennox & Addington Public Health Unit and
The emotions produced by stress can modify Leeds, Grenville and Lanark District Health Unit,
immune response and influence the onset and while remaining constant for the Hastings Prince
progression of physical illness; stress may also Edward Public Health Unit.
trigger negative changes in health behaviours as
individuals try to cope.
• About a quarter of the South East LHIN
population (24.0%, 95% CI 20.8%-27.2%) reported CHRONIC CONDITIONS
that most days in their life were quite a bit or
Defined broadly as "illnesses that are prolonged,
extremely stressful in 2013-14. This rate has
do not resolve spontaneously, and are rarely
remained relatively consistent over the last eight
cured completely”, chronic diseases account for a
years and was similar to the provincial rate of
substantial burden of illness due to their
22.7% (95% CI 21.8%-23.5%).
associated morbidity and mortality.
• Females and adults aged 15-64 generally reported
Arthritis
experiencing higher stress levels compared to
other groups. Rates were similar across the three • A quarter of the South East LHIN population
South East LHIN public health unit regions. (24.3%, 95% CI 22%-26.5%) reported having
arthritis in calendar years 2013-14 (Figure 6).
Arthritis prevalence rates have continued to be
Obesity significantly higher in the South East LHIN
Health problems associated with obesity can compared to the province overall (17.9%, 95% CI
include type 2 diabetes, dyslipidemia, 17.3%-18.5%), even after standardizing rates by
hypertension, coronary heart disease, gallbladder age. Rates have remained relatively constant over
disease, obstructive sleep apnea, and certain time.
cancers. • Within the South East LHIN, arthritis appears to
• A quarter of the adult population in the South be more common among females (although not
East LHIN (25.7%, 95% CI 22.9%-28.6%) was significantly higher than males in 2013-14 due to
18Figure 6: Self-reported prevalence of various chronic significantly higher than the provincial rate of
conditions, South East LHIN and Ontario, calendar years 18.5% (95% CI 17.9%-19.1%). Part of this
2013-2014. difference in rates can be attributed to the older
population within the South East LHIN, as rates
between the two areas were more similar after
adjusting for age.
• Rates of high blood pressure were similar
between males and females, and increased
significantly with age. Nearly thirty percent
(28.2%, 95% CI 23.3%-33.1%) of the population
aged 45-64 years and nearly half (46.8%, 95% CI
43.1%-50.5%) of the population aged 65+
reported having high blood pressure in 2013-14.
• Across the South East LHIN, rates were highest in
the Hastings Prince Edward Public Health Unit
(24.0%, 95% CI 20.7%-27.3%) and the Leeds,
Grenville and Lanark District Health Unit (24.6%,
95% CI 21%-28.3%).
Notes: Data with asterisk: Interpret estimate with caution due to
Mood Disorders
high sampling variability. Diabetes prevalence is as of April 2013. Includes conditions such as depression, bipolar
disorder, mania or dysthymia.
high variability in rates) and with increasing age.
About half of the population aged 65+ reported
• The prevalence of mood disorders in the South
East LHIN has steadily increased over the last ten
having arthritis, compared to about 30% of those
years, from 6.8% (95% CI 5.6%-7.9%) in 2003 to
aged 45-64 and less than 10% of those aged 15-44
13.2% (95% CI 11%-15.4%) in 2013-14. Rates for
years of age.
Ontario have also increased but not as much as
• Across the South East LHIN, rates were highest in the South East LHIN rate. While rates between
the Leeds, Grenville and Lanark District Health the two areas were similar in 2003, the South East
Unit (27.0% in 2013-14, 95% CI 23.1%-30.8%), LHIN rate in 2013-14 was significantly higher than
which is in part due to the relatively older the provincial rate of 8.5% (95% CI 8%-9%).
population in this region.
• Rates were significantly higher in females
compared to males (15.9% (95% CI 12.6%-19.1%)
High Blood Pressure versus 10.3% (95% CI 9.6%-11%), respectively). By
age, rates were highest in those between 18 and
• Nearly a quarter (22.8%, 95% CI 20.7%-25%) of 64 years of age. Rates appear to be increasing for
the population in the South East LHIN reported both sexes, all age groups, and in all regions of
having high blood pressure in 2013-14. Rates have the South East LHIN.
steadily increased over the last 10 years, both
within the South East LHIN and in the province
overall. The 2013-14 South East LHIN rate was
19Anxiety Disorders Asthma
Includes anxiety disorders such as phobias, obsessive- • About one in ten (9.8%, 95% CI 8%-11.6%) South
compulsive disorder, or a panic disorder. East LHIN residents reported having asthma in
2013-14. This rate continues to be significantly
• In both the South East LHIN and Ontario, rates of
higher than the provincial rate of 7.6% (95% CI
anxiety disorders have increased over time. In
7.2%-8%).
2013-14, about one in ten (11.0% (95% CI 9.1%-
13%) South East LHIN residents reported having • Rates have remained relatively consistent over
been diagnosed with an anxiety disorder. This time and appeared to be higher for females and
rate was significantly higher than the provincial for younger age groups (although differences
rate of 7.6% (95% CI 7.1%-8.1%). Rates in 2013-14 were not statistically significant for the South East
were similar across the South East LHIN region. LHIN).
• While not significantly different for the South East
LHIN, as is the case for Ontario, rates of anxiety
Heart Disease
disorders appeared higher for females compared
to males. While high variability in the rates for the • In the South East LHIN, 6.4% (95% CI 5.4%-7.4%)
South East LHIN impair comparison between age of the population in 2013-14 reported having
groups, provincially, rates appeared lowest in the been diagnosed with heart disease. This rate has
65+ age group. declined slightly over the past decade, and while
not significantly different, the South East LHIN
rate appears higher than the provincial rate of
Diabetes 4.9% (95% CI 4.6%-5.3%). However, after
adjusting the rate for age, there was little
• The prevalence of diabetes (types 1 and 2) in the
difference between the South East LHIN and
South East LHIN was 12.4% among those 18+
provincial rates.
years of age as of April 2013. This was similar to
the provincial rate of 11.9% and has increased • While not significantly different, rates of heart
slightly over time, from 10.6% in April 2009. disease appeared higher among South East LHIN
males (7.3%, 95% CI 5.9%-8.7%) compared to
• The prevalence of diabetes increased with
females (4.0%, 95% CI 3.6%-4.4%).
increasing age, ranging from 3.8% in those 18-49
years of age to 29.9% in those 80+ years. The • Rates of heart disease were significantly higher in
prevalence within each age group has increased older age groups. One-fifth (20.1%, 95% CI 16.7%-
over time, with minimal increases in those under 23.5%) of South East LHIN residents 65+ years of
60 years of age (Chronic Obstructive Pulmonary Disease LHIN), with notably lower rates of prostate cancer
(COPD) in the South East LHIN (90.1 versus 122.6
provincially) and higher rates of lung cancer (74.5
• In 2013-14, the rate of COPD in the South East versus 58.2 provincially).
LHIN (6.4%, 95% CI 4.9%-7.9%) was significantly
higher than the provincial rate (4.0%, 95% CI • For females, the 2009 age-standardized incidence
3.6%-4.3%). This difference remained significantly rate for all cancers was highest in the South East
higher even after accounting for the older LHIN compared to all other LHINS (400.0 cases per
population in the South East LHIN using age 100,000 population for the South East LHIN
standardization. compared to 373.0 provincially). South East LHIN
rates were also higher for the three most
• Provincially, rates of COPD were higher for common types of cancers in females.
females, as well as with increasing age. A similar
trend was observed for the South East LHIN;
however, these differences were not significant Intestinal or Stomach Ulcers
due to high variability in the rates.
• A relatively low proportion of the South East LHIN
• Rates in the Hastings Prince Edward Public Health population (2.8%, 95% CI 1.7%-3.9%) reported
Unit (8.2%, 95% CI 6%-10.4%) were significantly having intestinal and stomach ulcers as of 2013-
higher than the provincial rate in 2013-14. 14. Rates were similar to the province overall and
have remained relatively consistent over time in
both areas.
Cancer
The incidence of cancer in a region can be
influenced by a variety of factors including Stroke
prevalence of risk and protective factors, uptake • Just under 2% (1.6%, 95% CI 1.1%-2.1%) of the
of cancer screening, and population composition South East LHIN population reported suffering
in the region (such as proportion of immigrants in from the effects of a stroke in 2013-14. This crude
a region). rate appeared higher than the provincial rate of
• In 2009, there were 3,031 new cases of cancer 1.2% (95% CI 1%-1.3%); however, this difference
diagnosed in the South East LHIN; 1,532 of those is in part due to higher prevalence in older age
diagnosed were male and 1,499 were female. The groups and the older age structure of the South
most common types of cancers in males were East LHIN population, as the rates were more
prostate (21% of all male cancer diagnoses), lung similar after adjusting for age.
(17%), and colon and rectum (14%). All other
types each accounted for less than 5% of
diagnoses. For females, breast (26%), lung (12%),
and colon and rectum (12%) were the most
common cancer diagnoses, with all other causes
each accounting for 6% or less.
• The 2009 age-standardized incidence rate for all
cancers in males was similar between the South
East LHIN and the province as a whole (445.3
cases per 100,000 population for the South East
21HOSPITALIZATIONS FOR CHRONIC HEALTH STATUS AND CH RONIC
CONDITIONS CONDITIONS IN THE 65 +
Information was obtained from the Canadian Institute
POPULATION
for Health information’s (CIHI) Discharge Abstract • As previously highlighted, the prevalence of
Database (DAD). Hospitalizations for chronic chronic conditions generally increases with
conditions were identified based on the most increasing age in the South East LHIN, with the
responsible diagnosis noted on the hospitalization exception of mood disorders, anxiety disorders,
record. and asthma, which all have slightly lower
• Hospitalizations due to chronic conditions prevalence in those 45-64 and 65+ years of age
account for a sizable proportion of acute inpatient compared to those 18-44 years of age (Figure 7).
hospital use in the South East LHIN. In fiscal year • W ith increasing age, South East LHIN residents
2013/14, there were about 11,300 were more likely to report fair/poor self-
hospitalizations due to chronic conditions perceived health and less likely to report very
(including arthritis & related conditions, asthma, good/excellent health. In terms of self-perceived
cancer, CHF, COPD, diabetes, hypertension, mental health, there is less of a difference by age
ischemic heart disease (IHD), and stroke), which
accounted for a quarter of all hospitalizations in
the South East LHIN and about 27% of all hospital Figure 7: Self-reported prevalence of various chronic
days. The conditions accounting for the highest conditions in the 65+ population, South East LHIN and
number of hospitalizations and hospital days were Ontario, calendar years 2013-2014.
arthritis and related conditions, cancer, and IHD.
• Compared to other LHINs, the South East LHIN
had the second-highest proportion of
hospitalizations and hospital days for chronic
conditions, which could be due in part to the
older population in the South East LHIN and the
higher prevalence of chronic conditions. In
particular, the South East LHIN had relatively high
hospitalization and hospital day rates per capita
for arthritis and related conditions, cancer, COPD,
and IHD.
Notes: Data with asterisk: Interpret estimate with caution due
to high sampling variability.
22group in those reporting very good/excellent
mental health. Those aged 65+ also reported
significantly lower levels of self-perceived life
stress compared to younger age groups.
• Older adults in the South East LHIN often
reported being limited in certain activities
because of a physical condition, mental condition,
or health problem which has lasted or is expected
to last 6 months or longer. In calendar years
2013-14, just under a half of those aged 45-64
reported sometimes or often having an activity
limitation and just over half of those aged 65+
reported the same. The rate in those aged 45-64
was significantly higher than the provincial rate
(36.4%, 95% CI 34.8%-37.9%).
• A sizeable proportion of the older adult
population in the South East LHIN were classified
as having moderate to poor functional health
based on measures from eight dimensions of
functioning (vision, hearing, speech, mobility,
dexterity, feelings, cognition and pain). In 2013-
14, about a quarter of those aged 45-64 were
noted to have moderate to poor functional health
and about 35% of those aged 65+ were classified
as such. These rates were similar to the provincial
rate.
• Given the aging population in the South East
LHIN, there will be a larger number of people
living with chronic conditions and limitations
resulting from these conditions in the coming
years if all factors related to disease risk,
diagnosis, and survival remain constant. However,
increasing rates of certain risk factors for chronic
disease (e.g., obesity or heavy drinking) in those
under 65 years of age may entail that a greater
proportion of the population will be developing
chronic conditions, resulting in higher disease
prevalence for those over age 65 in the coming
years.
23• Within the South East LHIN, total fertility rates
BIRTHS AND DEATHS have generally increased in all Health Links except
Thousand Islands. The highest rates in 2011 were
in Salmon River, Rural Hastings, and Rideau Tay
(all above 41.5 births per 1,000 females aged 15-
Births and Maternal Health 49).
• In the South East LHIN, fertility rates were highest
Understanding trends in births and maternal in the 25-29 year age group (100.9 births per
health is important for planning obstetrical 1,000 females), followed by the 30-34 and 20-24
services in the South East LHIN, as well as planning year age groups (91.7 and 52.5 births per 1,000
for other community and hospital services that females, respectively). Fertility rates appear to be
support healthy pregnancies. higher for the younger age groups in the South
East LHIN compared to the province as a whole.
Vital Statistics information on births was obtained from Rates in the South East LHIN have increased over
the Office of the Registrar General (ORG), time for those above 30 years of age and have
ServiceOntario via the Ministry of Health and Long- either remained the same or have declined
Term Care’s IntelliHEALTH system. Information on slightly for the younger age groups. Birth rates for
maternal health and some of the obstetric indicators teenagers in the South East LHIN continue to be
were obtained from various reports from Better higher than the provincial rate.
Outcomes Registry & Network (BORN) Ontario. • Within the South East LHIN, fertility rates in those
under 25 years of age were highest in the Rural
Hastings, Quinte, and Salmon River Health Links;
BIRTHS AND FERTILITY RATES rates for those above 35 were highest in the
• In 2011, there were about 2,400 births in the Kingston Health Link.
South East LHIN, a rate of 8.6 births per 1,000 • If current fertility rates remain constant, the
population. This is the lowest rate out of all the number of births in the South East LHIN is
LHINs, which is in part due to the older population projected to remain relatively unchanged by 2026
distribution in the LHIN and, in turn, the lower due to the projected stability in the size of the
proportion of females within childbearing age. population in childbearing age. By Health Link, the
The number of births has remained relatively number of births is projected to decrease in all
constant over the last 10 years. The highest areas except for the Kingston Health Link, which is
number of births in 2011 were in the Kingston expected to see a small increase in the number of
(1,386) and Quinte (1,162) Health Links. All other births (about 150 extra births or a 10% increase
Health Links had less than 520 births in that year. from 2010).
• Among females 15-49 years of age, the fertility
rate in the South East LHIN has increased over the
last 10 years, as it has for the province as a whole.
BIRTH OUTCOMES
While the fertility rate in the South East LHIN was • Similar to the province overall, rates of low birth
more similar to the other LHINs compared to the weight births in the South East LHIN have
crude birth rate, the rate in 2011 (39.5 births per increased over time (to 6.5% of births in 2011 for
1,000 females aged 15-49) was still the lowest of both South East LHIN and Ontario), while rates of
all the LHINs.
24You can also read