The Luton Health Inequalities Strategic Plan 2015- 2020 - Taking a health in all policies approach - Luton Borough ...
←
→
Page content transcription
If your browser does not render page correctly, please read the page content below
The Luton Health
Inequalities
Strategic Plan
Taking a health in all policies approach

2015- 2020
Contents
Introduction ..................................................................................................................................................................................................................................... 2
Progress 2010-2015 ......................................................................................................................................................................................................................... 4
   What do we mean by Health Inequalities? .................................................................................................................................................................................. 5
   What is driving the national agenda? .......................................................................................................................................................................................... 6
   What is driving Luton’s strategic direction? ................................................................................................................................................................................ 7
The framework for reducing health inequalities in Luton ............................................................................................................................................................. 10
   Evidence and Best Practice ........................................................................................................................................................................................................ 12
Why do we need a strategic plan?................................................................................................................................................................................................. 19
   What contributes to the life expectancy gap within Luton? ..................................................................................................................................................... 20
What do we want to achieve? ....................................................................................................................................................................................................... 20
How will we deliver and monitor the plan? ................................................................................................................................................................................... 20
   The Role of the Health Inequalities Board ................................................................................................................................................................................. 21
   The Role of the Lead Individual.................................................................................................................................................................................................. 21
   Reviewing the Plan..................................................................................................................................................................................................................... 21
How will we implement the strategy? ........................................................................................................................................................................................... 21
   STRATEGIC OBJECTIVE: 1. Reducing inequalities for the very youngest children focusing on the critical period in the very early years in life from
   conception to 5 years of age ...................................................................................................................................................................................................... 23
   STRATEGIC OBJECTIVE 2: Enable all Children, Young People and Adults to Maximise their Capabilities and have Control over their Lives .......................... 30
   STRATEGIC OBJECTIVE 3: Creating Fair Employment and Good Work for All .......................................................................................................................... 38
   STRATEGIC OBJECTIVE 4: Ensuring a healthy standard of living by enabling the maximisation of income for families in poverty. ........................................ 46
   STRATEGIC OBJECTIVE 5: Create and develop healthy and sustainable places and communities .......................................................................................... 50
   STRATEGIC OBJECTIVE 6: Strengthen the Role and Impact of Ill Health Prevention ................................................................................................................ 56
Appendix 1. Public Health England’s Health Equity Assessment Tool ............................................................................................................................................. 0
                                                                                                                         1
References ....................................................................................................................................................................................................................................... 2
Introduction
Luton’s first partnership strategy to reduce health inequalities was developed by the Primary Care Trust (PCT) in partnership with Luton
Borough Council (LBC) in 2010. Since then, the political and policy landscape in which we are now operating has changed. Local authorities
have assumed responsibility for Public Health and play a key role in improving health and reducing health inequalities. Health and wellbeing
boards have been set up and health and wellbeing strategies are in place. In addition, there is a growing body of evidence on the most
effective interventions for reducing health inequalities.
This plan takes account of these changes and adopts a different approach to reducing inequalities within Luton. It builds on the following key
findings from the Marmot review of health inequalities Fair Society, Healthy Livesi :
There is a social gradient in health – the lower a person’s social position, the worse his or her health. Action should focus on reducing
the gradient in health.
Health inequalities result from social inequalities. Action on health inequalities requires action across all the social determinants of
health.
Focusing solely on the most disadvantaged will not reduce health inequalities sufficiently. To reduce the steepness of the social
gradient in health, actions must be universal, but with a scale and intensity that is proportionate to the level of disadvantage
(proportionate universalism).
To support the effective implementation of this plan we will adopt the ‘Health in All Policies’ (HiAP) approach which recognises that health is
influenced by a range of social, environmental and economic factors which are beyond the remit of the health sector. In order to effectively
influence population health, health considerations need to be integrated into and broader range of related policy areas such as employment,
education and social policy to support health equity. A HiAP approach ensures that health and health equity considerations become part of
the decision-making process and provide a means to identify and avoid those unintended impacts of public policy and ultimately reduce health
inequalities. To support the effective implementation of this plan we will strengthen the Integrated Impact Assessment process to ensure that
greater account is taken of the health impact of LBC policy decisions. The plan will also have an increased focus on prevention and early
intervention by improving access to non-medical health and wellbeing interventions.
23
Progress 2010-2015
Life expectancy increased for both males and females over the period of the last strategy and the gap with England reduced. However, the life
expectancy gap between the most and least deprived areas within Luton increased and healthy life expectancy is three years less than the
England average. Table 1 shows the movement of the key indicators over the period of the last strategy (2010-2015).
Table 1
Overarching Indicators 2006-08 Latest data Gap with
England
Luton England Luton England
Male Life Expectancy 76.7 77.9 78.4 79.4 narrowing
Female Life Expectancy 80.4 82.0 82.3 83.1 narrowing
Healthy Life Expectancy - male 60.6 (09- 63.2 (09- 59.3 63.3 widening
11) 11)
Healthy Life Expectancy - female 59.6 (09- 64.2 (09- 59.9 63.9 narrowing
11) 11)
Infant Mortality 5.9 4.7 5.1 4.0 narrowing
Life expectancy gap between 8.9 n/a 9.8 n/a widening gap
most and least deprived areas in within Luton
Luton– males
Life expectancy gap between 6.4 n/a 6.6 n/a widening gap
most and least deprived areas in within Luton
Luton – females
Although some progress has been made, the widening gap within Luton indicates that there is still a lot of work to do to reduce the social
gradient in health. Since 2010 there have been a number of interventions put in place which, if appropriately targeted should lead to a
reduction in the social gradient in health. These include:
Key workers working as part of the community midwifery team to provide primary prevention and early help to ‘mums and dads to be’
in two of the most deprived wards in Luton
4 Implementing the ‘Five to Thrive’ approach to support parents with five key messages about understanding the importance of their
babies brain development and attachment
‘Baby Babble’ pilot focused on supporting attachment in a universal setting with targeted families
Introduction of the ‘Pupil Premium’ providing additional funding for to raise the attainment of disadvantaged pupils from reception to
year 11.
A Luton wide apprenticeship strategy to Increase the number of Luton employers recruiting apprenticeships and increase the take up
of apprenticeships by Luton residents
Delivery of Employment, Training and Skills Fairs to increase the number of out of work people moving into employment or training.
Decent Homes Assistance providing support to applicants to repair their properties
Adopting the living wage for all Council employees
Targeted work in Children’s Centres with Adult Education and Job Centre Plus on personal budgeting and money management
targeting families living on low income
Provision of self-help workshops for welfare benefits, employment rights, debt and financial literacy
Adopting prevention and early intervention as a Council priority including the commissioning of an integrated lifestyle service and
developing a model for a social prescription programme.
The effective delivery of this plan cannot be achieved by one organisation alone. It will require commissioners to work closely with providers in
all sectors - local authority, the NHS as well as the third and private sectors and community groups. Many of our partner organisations are
already improving the health of local people every day and we want to ensure that this strategic plan provides opportunities for us to work in a
systematic way, ensuring that the most vulnerable people in Luton are supported and that health inequalities are being addressed at every
opportunity.
What do we mean by Health Inequalities?
Health inequalities refer to differences in people’s health and life chances. Health inequalities are strongly related to the conditions in which
people live, such as their income, employment status or the area they reside in. In Luton, for example, those living in the richer areas will live,
on average, eight years longer than those who live in the more deprived areas.
Most studies agree that the contribution of health care, although important, is responsible for less than half of our health. The biggest
contributor is the wide bundle of factors wrapped up in the phrase ‘the wider determinants of health’, those factors that are not health care,
behaviours or genetics. Determinants of health and health outcomes can affect different groups in different ways. Vulnerable groups and
excluded groups both tend to face multiple problems, suffer from worse health and have poorer access to services.
5What is driving the national agenda?
The Health and Social Care Act 2012 contains the first ever specific legal duties on health inequalities. The Secretary of State for health has a
duty to have regard to the need to reduce inequalities covering the NHS and public health functions for the whole population. NHS England
(NHSE) and CCG’s have duties to have regard to the need to reduce inequalities in access to health services and the outcomes achieved for
patients.
The Act gave local authorities the responsibility for improving the health of the local population and reducing health inequalities is
incorporated within guidance on Joint Strategic Needs Assessments, Joint Health and Wellbeing Strategies and is a condition of the ring fenced
public health grant.
Public Health England exists to protect and improve the nation’s health and wellbeing, and reduce health inequalities ii. From evidence into
action: opportunities to protect and improve the nation’s health (2014) sets out PHE’s priorities for the next five years and recognises that
action on health inequalities requires action across all the wider determinants of health.
Fair Society, Healthy Lives (The Marmot Review)iii – In November 2008, Professor Sir Michael Marmot chaired an independent review to
propose the most effective evidence-based strategies for reducing health inequalities in England from 2010. The report showed that socio-
economic inequalities affect health outcomes and confirmed that there is a social gradient in health. Those who are best off financially do best
on health outcomes too, with the converse true for the poorest. The key findings from the report suggest that in order to tackle health
inequalities, strategy, policy and interventions need to:
• involve people across the social gradient but be proportionately targeted to those with the greatest need
• be developed in partnership with local authorities and community groups and tackled at the community/individual level
• address the wider social determinants of health
• act across the life course, early interventions can be most effective
• recognise that reducing health inequalities is vital for the economy, it’s too expensive not to act
• involve people at the local/community level.
The public health policies of the current government have been heavily influenced by the Marmot review and the Public Health White Paper
Healthy Lives, Healthy Peopleiv adopts the Marmot life course framework for tackling the wider social determinants of health.
Inequalities in Life Expectancy: Changes over time and implications for policyv
6This report from the Kings Fund examines how the relationship between income deprivation and life expectancy has changed over time and
looks at the impact of other variables such as employment, housing deprivation, income and diet.
Key findings:
The social gradient in life expectancy improved between 1999–2003 and 2006–10. In short, income-related inequalities in life
expectancy improved
Employment, housing deprivation and income deprivation among older people and some lifestyle factors including binge drinking and
fruit and vegetable consumption are the most important in explaining differences in life expectancy between areas in 2006-10
Low employment housing deprivation and smoking are among the factors that distinguish areas with persistently low life expectancy
over time
The Public Services (Social Value) Act (2012vi) requires that public bodies in England and Wales must consider:
how what is being proposed to be procured might improve the economic, social and environmental well-being of the relevant area,
and
how, in conducting the process of procurement, it might act with a view to securing that improvement.
The Act covers public service contracts but not goods contracts. Social value is about seeking to maximise the additional benefit that can be
created by procuring or commissioning goods and services above and beyond the benefit of merely the goods and services themselves.
The Social Value Act gives the opportunity to consider a wider definition of value than purely economic cost, therefore using the Act can
enable public sector bodies to consider the potential positive impact on health and wider determinants of health of certain commissioning and
procurement decisions.
What is driving Luton’s strategic direction?
The following reports, strategies and plans provide the strategic direction for addressing health inequalities in Luton
Luton Borough Council Corporate Plan 2014-17vii
Investment Framework (2015-2035)viii
Joint Strategic Needs Assessment (2015)ix
Annual Public Health Reportx (2013-14)
Health and Wellbeing Strategy(HWBS)xi
Better Together Programme.
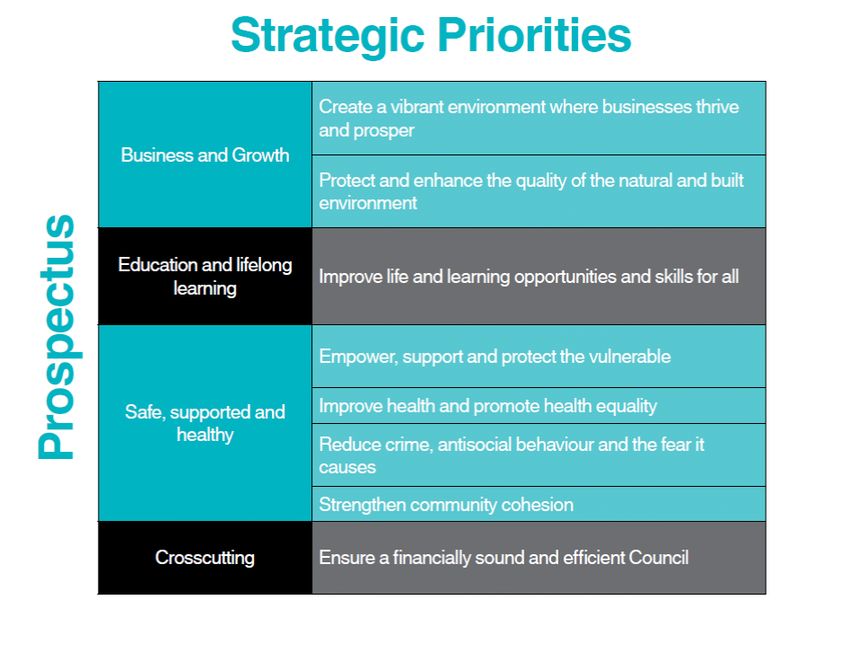
7Luton Borough Council Corporate Plan 2014-17
This Corporate Plan provides a picture of the current status of the authority and highlights the Council’s priorities and plans for service delivery
to 2017. In 2013 the Council produced its Prospectus, which sets the direction for the authority to 2016 in response to the changing economic
environment. The prospectus, based on a three point plan, highlights the link between health and some of the key wider determinants. It is
based on the premise that more businesses will create more jobs; investment in education and training will help local people to get those jobs
and this will increase their resilience, improve their health and reduce their need for public services. The three key themes in the prospectus
are:
business and growth
education and lifelong learning
safe, supported and healthy.
The Council’s strategic priorities outlined in the Corporate Plan support the three themes of the Prospectus (table 2). Improving Health and
Promoting Health Equity is a key priority within the Safe, Supported and Healthy theme and supports the development of this strategic plan.
Table 2
8Investment Framework 2015-2035 builds on the prospectus themes by setting out clearly in one place the investment opportunities that exist
in Luton and how Luton Borough Council and its partners will work to improve life chances and to deliver economic growth in the period from
2015-2035. Over the next 20 years there are opportunities to: create over 18,000 jobs, with over 15,000 in the next 10 years; increase housing
supply with 5,700 new homes; plan for community facilities to meet the needs of our frail and elderly; sustain economic growth; grow the
airport and its European business links; improve public health outcomes; increase education provision; invest socially in families and our
community; improve connectivity with London and the region; increase access to leisure facilities and improve our environment. Having a
joined up plan to address health inequalities in Luton is a key priority within the investment framework.
The Joint Strategic Needs Assessment (JSNA) 2014-18 provides a comprehensive analysis of the current and future health and wellbeing
needs of people in Luton. The needs assessment recognises the stark inequalities that exist both within the borough and between Luton and
the rest of the country and reducing these inequalities is the overarching priority of the JSNA. This health inequalities strategic plan will
provide a framework for addressing the key recommendations in the report.
Annual Public Health Report (2013-14)
The Luton 2013-14 Annual Public Health Report focussed on the ‘wider determinants of health’ and made some specific recommendations for
action including:
refresh the Health Inequalities Strategy with a specific focus on the wider determinants of health
develop and support initiatives to ensure Luton residents in work have a sufficient income to fund a healthy lifestyle
prioritise early years by increasing support for families to achieve improvements in early child development, and continue to improve the
quality of pre-school education to ensure a healthy start in life
increase awareness of mental health issues in the workplace to reduce stigma and discrimination through Mental Health First Aid (MHFA)
training
continue to support people into employment through skills and employability programmes with a particular focus on people with mental
health issues and disabilities
ensure strategies to tackle community safety issues such as violence and sexual exploitation incorporate evidence-based, preventative
interventions.
These recommendations have been included within this strategy.
Luton’s Health and Wellbeing Strategy ‘A Healthier Future’ (2012-19) provides the strategic direction for improving health and reducing
inequalities in Luton. It will be refreshed in 2015 to bring it in line with the new JSNA recommendations. This strategic plan will be closely
9aligned with the Health and Wellbeing Strategy, adopting the principles and providing more detail on how one of the three key outcomes will
be achieved: Reduced Health Inequalities within Luton.
Improving access to health and wellbeing is a key priority within the Luton Better Together programme. The Better Together Board has
agreed to scope out how a range of current services can work together with the aim of keeping people well. This includes Luton Access, Live
Well Luton, Active Luton, Adult Social Care prevention work and social prescription. The proposed model will reconfigure services through
the creation of an integrated neighbourhood based programme. This will also help clinicians address the wider social determinants of health
by building an infrastructure that connects people with long term conditions and multiple co-morbidities with non-medical interventions that
promote health, wellbeing, and social inclusion.
The framework for reducing health inequalities in Luton
While individuals’ behaviours do matter (for example, studies show around half of the health inequalities between rich and poor are the result
of smokingxii), the reality is that our health is impacted by a range of wider determinants including:
good employment
higher educational attainment
safe, supported, connected communities
poor housing and homelessness
living on a low income
social isolation, exclusion and loneliness
stigma and discrimination.
The Marmot review concluded that reducing health inequalities would require action on six policy objectives. The health inequalities strategic
plan will be framed around these six objectives:
1) giving every child the best start in life
2) enabling all children, young people and adults to maximise their potential and have control over their lives
3) creating fair employment and good work for all
4) ensuring a healthy standard of living for all
5) creating and developing healthy and sustainable places and communities
106) strengthening the role and impact of ill health prevention
Improving health and closing the gap between those with the most and those with the least requires action across all of these.
This plan should be seen as an overarching framework that brings together the key priorities and actions in the JSNA and existing corporate
and departmental strategies and plans to address health inequalities in Luton.
Luton’s conceptual model for reducing Health Inequalities
Governance Health equity Lens Outcomes
Health
Evaluate
inequalities
Health outcomes
briefing Improved health
Inequalities and wellbeing
Board: outcomes
Priority setting (PH, NHS & ASC)
through Health
inequalities and reductions
Strategic Plan Health Equity in health
Monitoring impact Assessment Tool
and Governance (HEAT) analysis inequalities
Development of
implimentation
plan
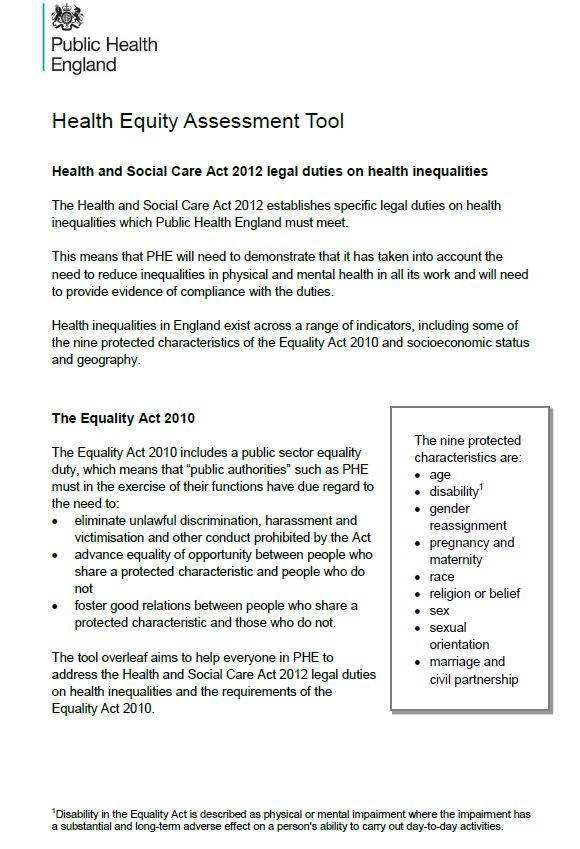
11The Health equity Lens process involves an assessment of health inequalities against the protected characteristics (under the Equality Act 2010)
and socioeconomic factors. The PHE Health Equity Assessment Toolxiii (appendix 1) will be used in the development of implementation plans,
considering the evidence briefing.
Implementation plans will be signed off by the Health Inequalities Board, ensuring there is appropriate monitoring of outcomes and equality
dimensions. Action will then be evaluated. Outcomes on the priorities will be monitored including equality dimensions, which will inform the
agreement of future priorities.
Evidence and Best Practice
Using and promoting evidence based practice is key to the delivery of effective health improving programmes. We will, wherever possible use
the best available evidence from a range of sources. NICE provides a wide range of reviews of effectiveness of public health programmes.
However, not all of the topics we want to focus on or the groups where we know there are health inequalities are covered by NICE guidance. In
these cases, we will use other evidence based reviews such as those from the Cochrane Collaboration, the national Library for Public Health
and in published reviews in peer reviewed journals.
Where evidence is not available we will use best practice guidelines to develop programmes to address our priorities and ensure that there are
measures of effectiveness embedded in each programme as well as robust evaluation.
The following national reviews have highlighted what local health and wellbeing systems should be addressing to deliver improved population
health and to reduce health inequalities in effective as well as cost effective ways and can be used to inform action planning. The key
recommendations are summarised in Table 3.
Table 3
Action to reduce health inequalities in Luton should focus on the six Marmot objectives outlined above. In addition to these six policy
objective, the Marmot review provides the following evidence based recommendations:
Source: http://www.instituteofhealthequity.org/projects/fair-society-healthy-lives-the-marmot-review
Objective Recommendations
1. Give every child the best start in 1a. Increase the proportion of overall expenditure allocated to the early years and ensure
life expenditure on early years development is focused progressively across the social gradient
121b. Support families to achieve progressive improvements in early child development, including:
Giving priority to pre- and post-natal interventions that reduce adverse outcomes of pregnancy
and infancy
Providing routine support to families through parenting programmes, children’s centres and key
workers, delivered to meet social need via outreach to families
Developing programmes for the transition to school
1c. Provide good quality early years education and childcare proportionately across the gradient.
This provision should be:
Combined with outreach to increase the take-up by children from disadvantaged families
2. Enable all children, young 2a. Ensure that reducing social inequalities in pupils’ educational outcomes is a sustained priority.
people and adults to maximise
their capabilities and have 2b. Prioritise reducing social inequalities in life skills, by:
control over their lives Extending the role of schools in supporting families and communities and taking a ‘whole child’
approach to education
Consistently implementing ‘full service’ extended school approaches
Developing the school-based workforce to build their skills in working across school home
boundaries and addressing social and emotional development, physical and mental health and
well-being.
2c. Increase access and use of quality lifelong learning opportunities across the social gradient, by:
Providing easily accessible support and advice for 16–25 year olds on life skills, training and
employment opportunities
Providing work-based learning, including apprenticeships, for young people and those changing
jobs/careers
Increasing availability of non-vocational lifelong learning across the life course.
3. Create fair employment and 3a. Prioritise active labour market programmes to achieve timely interventions to reduce long-term
good work for all unemployment.
133b. Encourage, incentivise and, where appropriate, enforce the implementation of measures to
improve the quality of jobs across the social gradient, by:
Ensuring public and private sector employers adhere to equality guidance and legislation
Implementing guidance on stress management and the effective promotion of wellbeing and
physical and mental health at work
3c. Develop greater security and flexibility in employment, by:
Prioritising greater flexibility of retirement age
Encouraging and incentivising employers to create or adapt jobs that are suitable for lone
parents, carers and people with mental and physical health problems
4. Ensure healthy standard of living 4a. Develop and implement standards for minimum income for healthy living
for all
4b. Remove ‘cliff edges’ for those moving in and out of work and improve flexibility of Employment
5. Create and develop healthy and 5a. Prioritise policies and interventions that reduce both health inequalities and mitigate climate
sustainable places and change, by:
communities Improving active travel across the social gradient
Improving the availability of good quality open and green spaces across the social gradient
Improving the food environment in local areas across the social gradient
Improving energy efficiency of housing across the social gradient.
5b. Fully integrate the planning, transport, housing, environmental and health systems to address
the social determinants of health in each locality.
5c. Support locally developed and evidence based community regeneration programmes that:
Remove barriers to community participation and action
Reduce social isolation
6. Strengthen the role and impact 6a. Prioritise investment in ill health prevention and health promotion across government
of ill health prevention departments to reduce the social gradient.
6b. Implement an evidence-based programme of ill health preventive interventions that are
14effective across the social gradient by:
Increasing and improving the scale and quality of medical drug treatment programmes
Focusing public health interventions such as smoking cessation programmes and alcohol
reduction on reducing the social gradient
Improving programmes to address the causes of obesity across the social gradient.
The Institute of Health Equity have produced a series of evidence reports and briefings about practical, local actions to reduce health
inequalities. The series includes eight evidence reviews and fourteen complementary short briefings. They cover topics from five of the six
policy objectives of the Marmot Review:
Source: http://www.instituteofhealthequity.org/projects/local-action-on-health-inequalities-series-overview
Health Equity Evidence Reviews Health Equity Briefings
Early Intervention 1. Good quality parenting programmes and 1a. Good quality parenting programmes
the home to school transition
1b. Improving the home to school transition
Education 2. Building children and young people’s 2. Building children and young people’s
resilience in schools resilience in schools
3. Reducing the number of young people not 3. Reducing the number of young people not
in employment, education or training in employment, education or training
(NEET) (NEET)
4. Adult learning services 4. Adult learning services
Employment 5. Increasing employment opportunities and 5a. Workplace interventions to improve
improving workplace health health and wellbeing
5b. Working with local employers to promote
good
quality work
5c. Increasing employment opportunities and
retention for people with a long term
health condition or disability
5d. Increasing employment opportunities and
15retention for older people
Ensuring a healthy standard of living for all 6. Health inequalities and the living wage 6. Health inequalities and the living wage
Healthy Environment 7. Fuel poverty and cold-home health related 7. Fuel poverty and cold-home health related
problems Problems
8. Access to green spaces 8. Access to green spaces
King’s Fund ‘Improving the Public’s Health – a Resource for Local Topics covered:
Authorities’ pulls together evidence from successful interventions The best start in life
across key local authority functions about ‘what works’ for Healthy Schools and Pupils
improving health and reducing health inequalities Helping people find good jobs and stay in work
Active and safe travel
Source: http://www.kingsfund.org.uk/projects/improving-publics- Warmer and safer homes
health?gclid=CMjZ68nO7cICFUXKtAod5nwA_g Access to green and open spaces and the role of leisure
services
Strong communities, wellbeing and resilience
Public protection and regulatory services
Health and spatial planning
National Institute for Clinical Excellence (NICE) ‘Local Government Topics covered:
Briefings’ summarise the best available evidence-based information Alcohol
about effective and cost effective public health activity, which will Behaviour change
help improve the health of their communities and to support the Contraception
development of joint health and wellbeing strategies. Domestic violence
NHS Health checks
Source: http://www.nice.org.uk/about/what-we-do/our- Access to health and social care
programmes/nice-advice/local-government-briefings Physical activity
Walking and cycling
Weight management
Drug misuse
16 Workplace health
NICE ‘Judging whether public health interventions offer value for Areas to intervene in to save money:
money’ summarises the economic and health benefits that can be Smoking
gained from public health interventions and the methods that can Alcohol
be used to measure them and what could be gained by placing Weight
greater emphasis on 'prevention rather than cure'. Physical Inactivity
Stroke
Source: http://www.nice.org.uk/advice/lgb10 Diabetes
Good Value for money best buys:
Stop Smoking Services
Healthy eating initiatives
Physical activity programmes
Alcohol interventions
Mental health at work
Safe sex initiatives
A recent World Health Organisation report summarizes cost-effective interventions that provide returns on investment and/or cost savings in
the short term (“quick wins”) and longer term.
Table 4. Summary of interventions found to be cost-effective
World Health Organisation: The Case For Investing In Public Health – Cost Effective Public Health Interventions
Source:
http://www.google.co.uk/url?sa=t&rct=j&q=&esrc=s&source=web&cd=1&ved=0ahUKEwiu3tTz2tPJAhXH8RQKHYyeARUQFggcMAA&url=htt
p%3A%2F%2Fwww.euro.who.int%2F__data%2Fassets%2Fpdf_file%2F0009%2F278073%2FCase-Investing-Public-
Health.pdf&usg=AFQjCNF0iLdehHPmv7Ek1O1fEaKnGLF_QQ&bvm=bv.109395566,d.ZWU
17Intervention focus Quick wins (0-5 years) Longer-term gains (over 5 years)
Environmental Road traffic injury preventiona Removal of lead and mercury
determinants Active transporta Chemical regulation
Safe green spacesa
Heat wave plana
Social determinants Healthy employment programmes
Insulating homesa
Housing ventilation for asthma
Community falls prevention
Resilience Violence prevention legislation Preschool programmes
Prevention of postnatal depression Prevention of conduct disorder
Family support projects Multi-systemic therapy for juvenile offenders
Social emotional learning Detection of and care for the victims of
Bullying prevention intimate partner violence
Mental health in the workplace
Psychosocial groups for older people
Parenting programmes
Depression prevention
Behaviour Lifestyle diabetes prevention programmea Alcohol minimum price
Restricting alcohol availability Counselling to smokers (WHO quite cost-
Community-based youth tobacco control intervention effective)
Workplace obesity intervention Alcohol brief interventions and alcohol driving
Tobacco legislation, taxation and control (WHO very cost- breath tests (WHO quite cost-effective)
effective)
Alcohol legislation, taxation and control (WHO very cost-
effective)
Nutrition – reducing salt; replacing trans fatty acids;
raising public awareness of healthy dietsa (WHO very cost-
effective)
Physical activity mass media awareness (WHO very cost-
effective)
18Vaccination For children: norovirus, pneumococcus, rotavirus, Influenza, pneumococcus
influenza Measles, mumps and rubella; diphtheria,
pertussis and tetanus
Human papillomavirus; hepatitis B, meningitis
C
Screening Screening for abdominal aortic aneurysm Screening for diabetes and impaired glucose
Screening for depression in diabetes tolerance
Cervical cancer screening (WHO very cost-effective) Vascular disease health checks
Breast and colon cancer screening (WHO quite
cost-effective)
Treatment Treatment of depression in diabetes patients Treatment of diabetes (WHO quite cost-
Treatment of CVD (WHO very cost-effective) effective)
Treatment of asthma (WHO quite cost-
effective)
Key: Green: offers a return on investment
Orange: Cost-effective
Black: WHO “best buy” interventions – timescales and costs not included; please note that these calculations were performed for low and middle-
income countries a “win win win” approaches with multiple health, social and environmental benefits: these have been shown to be cost-effective,
with potential returns on investment within five years; they also contribute to wider aspects of sustainability, including economic, social and
environmental benefits.
Why do we need a strategic plan?
life expectancy has been steadily improving in Luton but still remains approximately one year below England
there is a gap of 6.6 years for females and 9.8 years (2011-13) for males between the most and least deprived areas in Luton which
compared with 2006-08 represents a widening gap for both males and females
recent data shows that for males, the life expectancy gap to England widened and, although there has been some improvement, is still
wider than in 2000/02
lower life expectancy is concentrated around the more deprived areas in Luton
males living in Luton spend approximately 23.2% of their life not in good health compared with 20.0% nationally. For females, 26.4% of
their life is spent not in good health compared with 22.8% nationally.
19 health inequalities create a great cost to societies, not only through the direct costs of providing health care for those with avoidable illness
but also the costs of reduced participation in the workforce and lower productivity
the strategy supports the overall vision for Luton to achieve strong, sustainable, balanced growth resulting in improved health and
wellbeing and improved prosperity.
What contributes to the life expectancy gap within Luton?
The main diseases that contribute to the difference in life expectancy between wards in Luton are:
circulatory (coronary heart disease & stroke)
cancer (lung)
respiratory (COPD, pneumonia).
What do we want to achieve?
By 2020 Luton will have:
Outputs Outcomes
upskilled the workforce increased life expectancy in Luton
created new jobs narrowed the life expectancy gap between
Luton and England
provided additional homes narrowed the life expectancy gap within Luton
invested in green travel and carbon more people living longer in good health
reduction
How will we deliver and monitor the plan?
The key function of the Health inequalities Board is to bring key leaders from across the borough to work together to improve reduce health
inequalities in the most effective, efficient and equitable way. The fundamental tasks of the Board will be to:
1. provide direction and vision, acting as a guiding partnership, offering partners the opportunity for shared decision-making to deliver
shared outcomes
2. enable partnership working to deliver coordinated borough wide action, rather than independent organisational responses
3. provide strong governance, to monitor progress against a single set of agreed outcomes and objectives and hold partners to account.
20The Role of the Health Inequalities Board
The Health Inequalities Board is responsible for overseeing the implementation of this plan and holding service directors and CCG leads to
account for delivery of the plan. It will monitor the plan by receiving regular progress reports on the six key objectives. The Health Inequalities
Board will provide regular reports to the Health and Wellbeing Board.
The Role of the Lead Individual
A service director within Luton Borough Council and where appropriate, supported by an associate director from the CCG, will be accountable
for each of the priorities and will ensure that detailed action plans are in place to achieve the expected outcomes. This will include ensuring
that action to address health inequalities is included in all provider contracts. They will provide twice yearly updates on progress.
Reviewing the Plan
The plan will be reviewed annually to take account of any new guidance and evidence and to ensure that the priorities are still relevant.
How will we implement the strategy?
The following section outlines the priorities for each of the six key Marmot objectives, defines the expected outcomes and how success will be
measured. In line with Marmot’s principle of ‘proportionate universalism’ leads will need to ensure that action is targeted in areas of greatest
need if the defined outcomes are to be achieved. In most cases this is likely to focus on the 25% of the population who are most deprived.
21N 25% most-deprived population
Bramingham
Northw ell
Sundon Park
Icknield
Limbury
Leagrave Stopsley
Barnfield
Lew sey
Saints
Challney
Round Green
Biscot
High Tow n
Dallow Wigmore
Craw ley
South
IMD 2010 Farley
65
60
55
50
45
40
0 1 2 3 4 5 km
35
Contains Ordnance Survey data © Crow n copyright and database right [2013]
22STRATEGIC OBJECTIVE: 1. Reducing inequalities for the very youngest children focusing on the critical period in the very early
years in life from conception to 5 years of age
Investment Framework: SSH2 – Flying Start
This priority focuses on:
1) Reducing inequalities in early development of physical and emotional health, and cognitive, linguistic, and social skills.
2) Ensuring high quality maternity services, parenting programmes, childcare and early year’s provision to meet need across the social
gradient.
3) Building the resilience and wellbeing of young children across the social gradient.
The Marmot report states that ‘giving every child the best start in life is crucial to reducing health inequalities across the life course’.
These findings, identified by Marmot in ‘Fair Society, Healthy Lives’ have recently been re-stated in the 2014 State of the Nation report ‘Social
Mobility and Child Poverty in Great Britain’ and supported by the cross party manifesto; ‘1001 Critical Days: the importance of conception to
age 2 period’ (2013).
Every child deserves an equal opportunity to lead a healthy and fulfilling life. Too many children living in Luton do not have the start in life that
establishes the secure and healthy foundation they need in preparation for their life-long health and wellbeing and social and emotional
development, which means they start school not ready and able to learn. Together these increase the likelihood of poorer academic
attainment, poorer social and emotional development and resilience, limited opportunities, and increase the risk of poorer health and
disadvantage in adult life.
Delivering this objective is the challenge for all agencies working with children and families in Luton and the basis for ‘Flying Start’, the multi-
agency early year’s strategy agreed by organisations working in Luton. The commitment is to strengthen the core service offer to families with
young children, focussing on the period from conception to 5 years, where getting it right for families is essential to deliver the health and
wellbeing outcomes we need for our most disadvantaged families.
WHAT WE KNOW
23Life expectancy varies depending on where you live in Luton. There is a 5.8 year life expectancy difference between a boy born in Farley ward,
and a boy born in Bramingham ward and a 7.6 year difference between a girl born in Northwell ward and a girl born in Stopsley ward (2008-12).
Perinatal mental ill-health affects 1 in 10 women and covers a wide range of conditions of varying severity. Maternal mental ill-health has
significant impact on child development, particularly the ability of the affected parent to care for their infant and provide a safe and supportive
environment for the child to develop. Some factors known to increase risk are a family history of mental ill-health, being a lone parent or in a
poorly functioning relationship, low social support, socio-economic disadvantage and early emotional trauma. Based on NICE estimates, every
year 4% of mothers who give birth (approx. 140 Luton women) will require specialist mental health services and 14 of these women will be
admitted for inpatient care. A further 8% will require access to psychological therapies and another 8% will experience ill health but will either
not require or not accept referral to services.xiv
Safeguarding data – in February 2015 there were 100 Luton children aged 0-5 years the subject of a Child Protection Plan (CPP), 37% of all
children who are subject to a CPP in Luton. Of the total children on a CPP, 44% are from the five most deprived ward with the poorest outcomes
for children, of these 40% are 0-5 years of age. Data for 2013/14 shows that Luton has a much higher percentage of children subject to a CPP
(51.3%) compared to England (42.1%) and statistical neighbours (43.2%). There has been a significant increase in the number of children who
have been identified as ‘cause for concern’ where the primary cause is living in homes where there is a parent/ carer experiencing drug or
alcohol misuse issues and/or with mental illness and / or experiencing domestic abuse. The highest percentage of these families being in
Leagrave, Northwell, Limbury, Farley and South.
Child poverty (0-16 years) - Luton is in the top quartile of England authorities with one in four (14,769) children living in poverty. While poverty
affects 27% of children across Luton, the figure for the most deprived wards is considerable higher, for example in Northwell, over 40% of
children are living in poverty.
Infant Mortality Rate (IMR) has reduced from 7.4 in 2007-09 to 5.2 in 2010-12 with provisional 2011-13 data showing a further decrease. The
rate in Luton is the lowest compared to statistical neighbours and the gap between Luton and England (4.1, 2010-12) is closing. The number of
deaths by ward is small. By aggregating data over a 5 year period the data shows that the highest IMR is in Northwell and Farley wards, however
the highest numbers are in Biscot and Dallow, four of the most deprived wards. Research and local data provide firm evidence that the risk
24factors for Luton are deprivation, poor housing, smoking in pregnancy, maternal obesity, and substance misuse. All of which are linked to
deprivation. In addition there are approximately 35% of deaths over the 5 year period where ethnicity, and the link associated with cousin
marriage in the Luton Pakistani community and genetic conditions is a cause or contributory risk.
Low Birth Weight babies (LBW) - In 2012, 5% (163) of all babies born at term (37 weeks or more gestation) had a birth weight of less than
2500g (the weight used to define low birth weight), a decrease from 5.3% in 2011 (171 babies). Luton has one of the highest incidences of LBW
for term babies of all areas within England. LBW increases the risk of child mortality and morbidity and is associated with poorer health in later
life. Key risks associated with LBW are ethnicity, especially South Asian women who are more likely to have smaller babies, lifestyle; particularly
pregnant women with a high BMI, smoking in pregnancy, substance misuse.
Breastfeeding rates at six to eight weeks – Breastfeeding initiation rates show (2013/14) that 76% of women initiated breastfeeding and 56%
were fully or partially breastfeeding at 6-8 weeks. 34% were fully breastfeeding and 21.9% were mixed feeding. The highest breast feeding rates
are in Barnfield where 68% of mothers are breastfeeding (including partial); significantly higher than the Luton average. The lowest is in Sundon
Park, Stopsley, Icknield and Wigmore all with less than 50% of mother’s breastfeeding. Sundon Park (39%) and Wigmore (49%) are both
significantly lower than the Luton average. This shows that breastfeeding rates are not solely dependent on affluence.
Smoking in pregnancy – Women who smoke are more likely to have complications in pregnancy, deliver smaller babies and have an increased
risk of a pre-term birth. The prevalence of smoking at time of delivery in Luton is 12.1% (2013/14) compared to 12.0% nationally. The rate has
reduced by 27% since 2009/10 which is a faster reduction than seen nationally (14% decrease).Smoking prevalence is greatest in the most
disadvantaged areas of Luton especially amongst white British women.
Child Obesity (Reception Year) – The prevalence of childhood obesity and overweight is high in Luton compared to the national average. At
reception year (age 4-5) the percentage of children who are overweight or obese in 2013/14 was 23.2% compared to the national average of
22.5%. The prevalence varies by wards with the highest prevalence (2011/12 to 2013/14) seen in Leagrave ward (27%) with a rate significantly
higher than the Luton average for the same time period (22.7%). Other wards with high rates but not significantly different to the Luton
average were Stopsley (25.8%), Round Green and Icknield.
Dental Health - Results of the survey of three-year-olds show that inequalities in oral health start from a very early age. There are many factors
25that influence poor oral health which include: poor diet and nutrition, particularly the frequent consumption of sugary foods and drinks, using
formula feeds rather than breast feeding young infants, lack of oral hygiene and tooth brushing, low exposure to fluoride therapies including
using toothpastes with low fluoride concentrations and trauma or injury to teeth. Data from 2013/14 shows that 22% of 3 year old children in
Luton have decay experience and 21% have active decay compared with 12% and 11% respectively in England. Compared with statistical
neighbours Luton has the second highest tooth decay. By 5 years the position is poorer, 39% of five year olds have experienced tooth decay and
34% had active tooth decay at the time of the survey. This compares to 28% and 25% respectively for England.
Early Years Foundation Stage Profile outcomes in 2014 show seven wards in Luton where the percentage of children achieving a ‘Good Level of
Development’ is below the Luton average of 52%. The national average is 60%. The percentage of pupils achieving expected levels in
‘Communication and Language’ is below the Luton average of 70% in nine wards. The national average is 77%. For the percentage of pupils
achieving in the ‘Personal Social Emotional elements’ there are eight wards where attainment is below the Luton average of 74%. The national
average is 81%. South, Dallow, Northwell and Leagrave underperform in all three early year’s indicators.
Take up of 2 year funded educational places is important for child development and reducing inequality. Prior to September 2014 the target
for places to be offered to the 20% most economically disadvantaged families was 771 places. Luton’s take up at that time was 82%. With the
target increasing from September 2014, to places to be offered to the 40% most economically disadvantaged families (1718 places). The most
recent DfE data shows that current take up for February 2015 identified 62% take up of education places from the 1,676 potentially eligible
families.
Child care provision - the last childcare sufficiency survey (2011) stated that overall parents who were using formal childcare in Luton were
satisfied with the arrangements they had in place. The use of key statistics and benchmark indicators also suggests that, on the whole, childcare
provision in Luton is generally ‘sufficient’ in many of the areas highlighted by the former Department for Schools, Children and Families (DCSF)
Guidance.
OUTCOMES
The priority is to reduce the gap between child outcomes in the most disadvantaged families (Northwell, Biscot, Dallow, Farley and South and
including families in other areas with similar identified need), and the rest of the town.
By 2020 we will have:
26 improved birth outcomes for babies; with fewer women obese in pregnancy, improved understanding of nutrition and healthy behaviours,
breastfeeding will be increased and fewer children will be obese or have dental decay with improved health and wellbeing into adulthood.
significantly more children by their 5th birthday with age appropriate communication skills and able to interact effectively with adults and
children.
more children securely attached and emotionally resilient, with improved school readiness. In the longer term the impact of poor maternal
mental health and associated risk factors on children’s outcomes are reduced.
LINKS TO
LEAD (WHO WILL OVERSEE
OUR PRIORITIES KPIs STRATEGIES AND
THIS PRIORITY)
PLANS
Full delivery of the Healthy Child Programme 0-5 years aligned Service director: Healthy Lives Reduction in: Flying Start Strategy
with Flying Start, fully meeting the requirements for a universal, / Prevention & Early
Smoking in
“progressive” and “progressive plus” offer for parents based on Intervention
Pregnancy
need.
Maternal obesity
Improve coordination of early years’ provision under Flying Infant mortality
Start to ensure there is an evidenced based core offer to Childhood obesity
reduce the modifiable risk factors as part of contract at age4 - 5years
arrangements. Poor maternal
Development of a 0-19 Health and Wellbeing service for mental health
Luton Childhood
accidents
Increased
initiation and
sustained
breastfeeding
rates
Improvements in
oral health
27Support women during pregnancy to access services and ensure Service director: Healthy Lives Reduction in: Flying Start Strategy
they understand and implement key primary prevention / Prevention & Early
Smoking in Infant mortality
behaviours through targeted support such as via a key worker. Intervention with support
Pregnancy action plan
from CCG
Reduce the proportion of women who smoke during Maternal obesity
pregnancy through targeted stop smoking support, Tobacco Free Luton
Infant mortality
Reduce the proportion of women who are overweight or Strategy
Increased
obese during pregnancy by implementing the healthy
initiation and Healthy Weight
weight in pregnancy pathway and its interventions.
Increase breastfeeding in women through education and sustained Strategy
promoting the normality of breastfeeding, supporting breastfeeding
IM Plan
initiation and access to support in hospital and the rates
community to maintain feeding.
Increase uptake of healthy start vitamins especially for
families eligible for the free scheme.
Deliver a universal evidence based parenting support Service director: Prevention & Flying Start Outcome Flying Start Strategy
programme for parents in the antenatal and post-natal period, Early Intervention/ Healthy framework which Investment Strategy
with targeted programmes for parents who require more Lives includes parenting FNP Implementation
intensive support including Family Nurse Partnership (FNP) and outcome measures plan
to address the gap in parenting for families with older children.
Outcome data for FNP
Ensure effective take up of the two year old early years funded Service director: Schools, Increased uptake of 2 Flying Start Strategy
places in high quality early years provision, enhanced with Challenge & Intervention year old funded
parenting support. places
Assist families with young children who are living on limited Service director: Revs, Bens & Child poverty Flying Start Strategy
incomes and who are in and out of work to access support and Customer services / Housing outcome measures Social Mobility and
advice services including welfare advice, housing support and Anti- Poverty
financial inclusion. Strategy
28You can also read