Giant Garter Snake Habitat Quantification Tool - Part of the Multispecies Habitat Quantification Tool for the Central Valley Habitat Exchange
←
→
Page content transcription
If your browser does not render page correctly, please read the page content below
Giant Garter Snake
         Habitat Quantification Tool
Part of the Multispecies Habitat Quantification Tool for
         the Central Valley Habitat Exchange

   Scientific Rationale and Methods Document, Version 5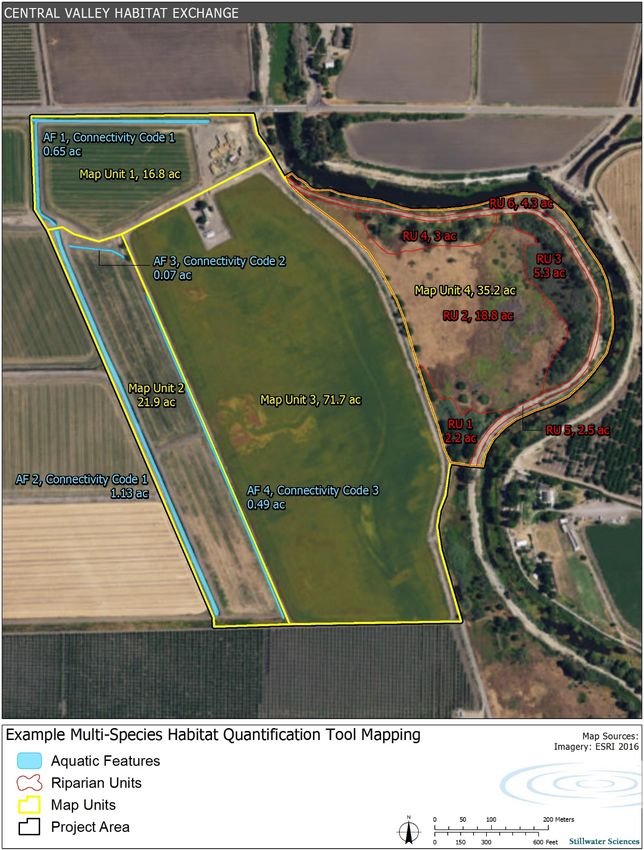
Multispecies Habitat Quantification Tool: Giant Garter Snake

Acknowledgements

The development of the scientific approach for quantifying impacts and benefits to multiple species for
use in the Central Valley Habitat Exchange (Exchange) would not have been possible without the input
and guidance from a group of technical experts who worked to develop the contents of this tool. This
included members of the following teams:

     Central Valley Habitat Exchange Project Coordinators
     John Cain (American Rivers)
     Daniel Kaiser (Environmental Defense Fund)
     Katie Riley (Environmental Incentives)

     Exchange Science Team
     Stefan Lorenzato (Department of Water Resources)
     Stacy Small-Lorenz (Environmental Defense Fund)
     Rene Henery (Trout Unlimited)
     Nat Seavy (Point Blue)
     Jacob Katz (CalTrout)

     Tool Developers
     Amy Merrill (Stillwater Sciences)
     Sara Gabrielson (Stillwater Sciences)
     Holly Burger (Stillwater Sciences)
     AJ Keith (Stillwater Sciences)
     Evan Patrick (Environmental Defense Fund)
     Kristen Boysen (Environmental Incentives)

     Giant Garter Snake TAC
     Brian Halstead (USGS)
     Laura Patterson (CDFW)
     Ron Melcer (formerly DWR; with Delta Stewardship Council as of February 2017)

     Chinook Salmon TAC
     Alison Collins (Metropolitan Water District)
     Brett Harvey (DWR)
     Brian Ellrott (NOAA/NMFS)
     Cesar Blanco (USFWS)
     Corey Phillis (Metropolitan Water District)
     Dave Vogel (Natural Resource Scientists, Northern Water Districts)
     Jacob Katz (CalTrout)
     Jeff Abrams (NOAA/NMFS)
     John Shelton (JD) (CDFW)
     Julie Zimmerman (USFWS)
     Michael Perrone (DWR Yolo Bypass)
     Michelle Workman (EBMUD)
     Neal McIntosh (NOAA)
     Rene Henery (Trout Unlimited)
     Tancy Moore (NOAA)
     Ted Grantham (UC Extension)

                                                                                                          i
Multispecies Habitat Quantification Tool: Giant Garter Snake

     Swainson’s Hawk TAC
     Dick Anderson (CDFW emeritus)
     Jim Estep (Estep Environmental Consulting)
     Nat Seavy (Point Blue Conservation Science)
     Ellen Berryman (ICF)
     Heather Swinney (USFWS)
     Laura Cholodenko, Randi Logsdon (CDFW)
     Monica Iglecia, Valerie Calegari, Karen Velas (Audubon)
     Michael Perrone, Katy Spanos, Michael Bradbury, Ron Melcer (DWR)
     Chris Briggs (Golden Gate Raptor Observatory)

     Riparian Land Bird TAC
     Nat Seavy, (Point Blue)
     Kara Strum (Audubon)
     Ron Melcer (formerly DWR; with Delta Stewardship Council as of February 2017)
     Kristen Dybala (Point Blue)
     Amy Merrill (Stillwater Sciences)

Citation

Environmental Defense Fund and Stillwater Sciences. November 2019. Giant Garter Snake Habitat
Quantification Tool, part of the multispecies Habitat Quantification Tool for the Central Valley Habitat
Exchange: Scientific Rationale and Methods Document. Version 5.

Contact Information

Dan Kaiser, Environmental Defense Fund (dkaiser@edf.org)

                                                                                                           ii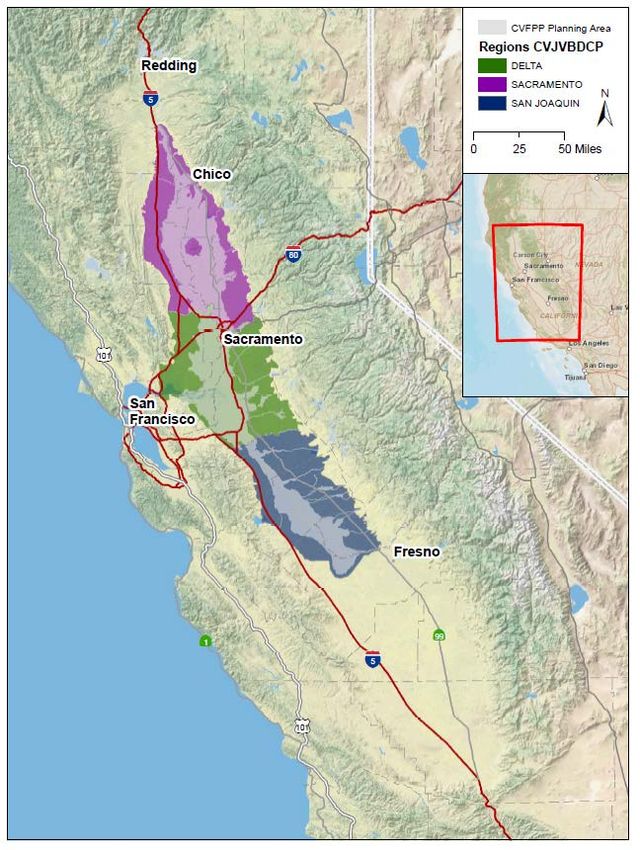
Multispecies Habitat Quantification Tool: Giant Garter Snake

Executive Summary

The Habitat Quantification Tools (HQT) represent a method for quantifying habitat condition for single or
multiple species native to the Central Valley, California. The intent is to create a means of consistently
assessing habitat condition so that high quality habitat can be managed or maintained to benefit the
species. By quantifying habitat condition, the tool also allows for a range of applications that support land
management, enhancement, restoration, or mitigation. Applications include comparison of relative habitat
value between multiple locations, and comparison of relative habitat value for a single location over time
to support quantification of improvements (“credits”) or impacts (“debits”) to habitat condition from a past
or anticipated action.

Species and groups of species currently included in the Multispecies Habitat Quantification Tool (mHQT)
are Chinook salmon (Oncorhynchus tshawytscha), Swainson’s hawk (Buteo swainsoni), riparian land
birds, and the giant garter snake (Thamnophis gigas); more species or groups of species will be added to
this current set. The mHQT has been specifically designed for use in the Central Valley Habitat Exchange
(Exchange); however, it has broad applicability for use in any habitat mitigation and conservation effort for
the target species in the Central Valley. The mHQT is intended to: a) provide a quantitative and effective
basis for developing credits and debits based on habitat quality for one or multiple target species; b) to
incentivize the development of habitat for target species in locations where it provides maximum
ecological benefit; and c) to inform the suite of potential actions necessary in order to improve habitat
condition and achieve maximum habitat quality.

This is the Scientific Rationale and Methods Document for the giant garter snake portion of the mHQT
and the contents describe, explain, and operationalize the scientific approach to quantifying credits and
debits. Habitat conditions that are important for this species are described along with methods for
measuring and reporting on habitat conditions for input to the mHQT. This document includes a
description and definition of the habitat attributes (important characteristics that affect habitat quality, such
as emergent vegetation for giant garter snake, or flood duration for Chinook salmon, or availability of
nestable trees for Swainson’s hawk), parameters measured (relevant and measurable aspects of the
attributes, such as areal cover of emergent vegetation, length of time for flood duration, or number of
trees of given stature within a certain area), and metrics (methods of measurement for each parameter,
such as absolute percent cover emergent vegetation in delineated water body, number of days with over
10 cm water depth covering at least one acre, or number of trees over 8 m tall within the Project Area
boundaries) used to assess habitat quality for each species or suite of species. This document also
provides discussion illustrating why those specific attributes and methods were chosen in constructing the
mHQT, as well as supporting documentation (e.g., peer-reviewed literature, gray literature, expert
opinion), and methods for compiling attribute measurements into site-specific habitat quality scores.

The species or suite of species specific HQTs, the combined operation in the mHQT and the supporting
Scientific Rationale and Methods Documents will undergo further scientific review and revision where
necessary and as additional species are added to the mHQT.

The Central Valley Habitat Exchange’s system for quantifying habitat function is structured around a suite
of core requirements. These include:

    •   Science driven – The system for quantifying habitat function must be based in the best available
        science about the habitat requirements of Central Valley species.

                                                                                                               iii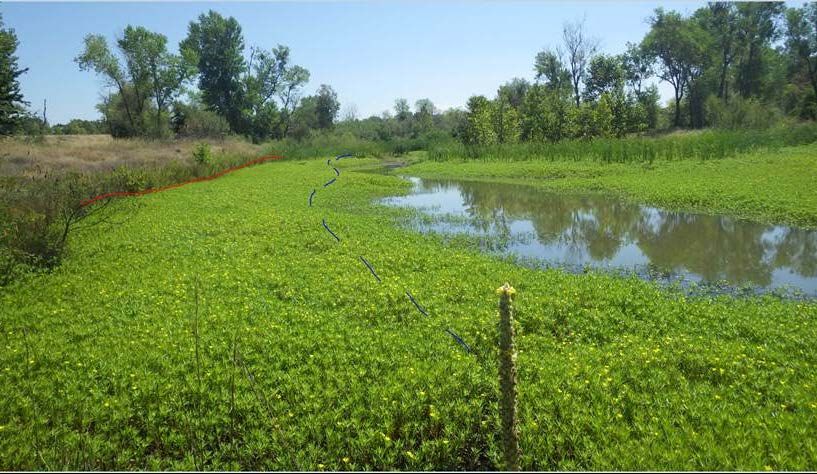
Multispecies Habitat Quantification Tool: Giant Garter Snake

    •   Addresses multiple species – The system should be broad enough to incorporate the habitat
        needs of a suite of species, and define those needs based on a subset of a common suite of
        attributes that will facilitate comparison across species.
    •   Metrics for SMART outcomes – To support recommendations that are implementable, the
        Central Valley Habitat Exchange system must generate metrics that can be used to establish
        outcomes that are specific, measurable, attainable, relevant, and time-bound (SMART).
    •   A common language for conservation objectives and permitting – The Central Valley Habitat
        Exchange metrics should function as a common quantitative language capable of reconciling
        diverse conservation objectives, reducing the complexity of permitting, and improving the
        effectiveness of mitigation.

The mHQT is a multi-scaled approach for assessing environmental conditions, habitat quality and
quantity, and conservation or mitigation outcomes for target native species in the Central Valley. The
mHQT metrics are supported by a suite of specific methods, applied at multiple spatial scales to evaluate
aquatic and terrestrial conditions related to the habitat quality and quantity for the target species. The
purpose of the mHQT is to accurately quantify benefits (“credits”) or impacts (“debits”) to habitat
conditions through habitat “credit” and “debit” conservation and mitigation programs.

The mHQT is designed to be applied at both the landscape scale, as a means of identifying potential
priority areas for habitat restoration, enhancement, or protection, and at the Project Area scale, in which a
specific parcel of land is identified and assessed as a potential area for restoration, enhancement,
protection, or mitigation. Habitat-relevant attributes within the Project Area are measured and
incorporated into the mHQT to assess site-specific conditions for supporting each target species or guild.
The landscape condition information is combined with information on the Project Area itself to generate
an assessment score of the Project Area and associated functional acres of habitat for each focal
species.

Information on the needs and existing and historical distribution of the target species are used to provide
spatial context at the landscape scale for a given land area in order to identify, screen, and prioritize
potential Project Areas, as well as to subsequently modify scores for high priority areas to reflect changes
in landscape value and changes in species landscape needs (e.g., distribution and abundance) over time.
Landscape-level habitat attributes are used to develop a Landscape Context score for a Project Area
and a target species or sets of species. Landscape Context scores include information on the known or
potential occurrence and/or abundance of the species in the area and the occurrence of features in the
nearby landscape that could improve upon or detract from habitat quality in area. Specific landscape
scale attributes most relevant to each target species or set of species are described in the chapters that
follow.

The core of the quantification approach used by the Central Valley Habitat Exchange is an assessment of
a given land area for species-specific habitat attributes via metrics and the assignment of scores based
on the quality and functionality of the land area across those attributes. To translate the attribute value to
an attribute score, a scoring function was developed for each attribute and for each species-specific
habitat type for which the attribute is relevant. This scoring function translates each attribute
measurement into an attribute quality score, ranging from 0 to 1.

A Project Area can be broken out into different ‘Map Units’ that have a consistent vegetation pattern and
are managed consistently and/or have the same inundation regime. Within each Map Unit, finer scale
habitat units of different kinds (e.g., Riparian Units for riparian birds, and Aquatic Features for giant garter
snake) can be articulated. Habitat units have consistent features, defined for each habitat unit type, and

                                                                                                               iv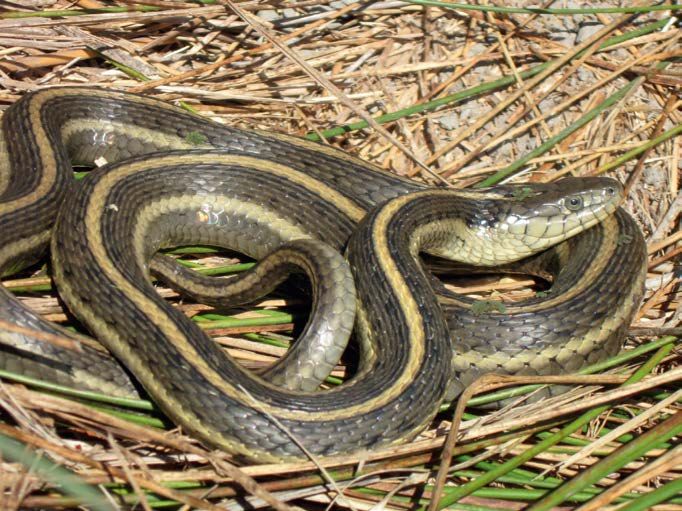
Multispecies Habitat Quantification Tool: Giant Garter Snake

are delineated as polygons that are
Multispecies Habitat Quantification Tool: Giant Garter Snake

Contents

Executive Summary .............................................................................................................. iii
1.0 Overview of the Habitat Quantification Tool ................................................................ 1
  1.1 mHQT Development Process .................................................................................................2
  1.2 Key Concepts ........................................................................................................................4
    1.2.1  Habitat Quality and Species Performance .............................................................................. 4
    1.2.2  Water....................................................................................................................................... 4
    1.2.3  Spatial Scale............................................................................................................................. 8
    1.2.4  Time Scales .............................................................................................................................. 8
  1.3 Framework for Quantifying Habitat Functionality ..................................................................9
    1.3.1  Landscape Context ................................................................................................................ 10
    1.3.2  Habitat Attributes ................................................................................................................. 10
    1.3.3  Spatial and Temporal Scales in the HQT ............................................................................... 11
    1.3.4  Predictive vs. Retrospective Applications of HQT ................................................................. 13
    1.3.5  Habitat Quantification Toolkit............................................................................................... 14
  1.4 Literature Cited in Section...................................................................................................15
2.0     Giant Garter Snake ..................................................................................................... 17
  2.1 Overview of Giant Garter Snake Habitat Attributes .............................................................17
    2.1.1  Habitat Quantification Tool Development Process............................................................... 18
    2.1.2  Giant Garter Snake Natural History ...................................................................................... 19
    2.1.3  Giant Garter Snake Timing Windows .................................................................................... 25
  2.2 Landscape-Scale Habitat Attributes .....................................................................................25
    2.2.1  Proximity to Presumed Range ............................................................................................... 25
    2.2.2  Proximity to Historical Tule Marsh ........................................................................................ 26
    2.2.3  Proximity to Recently Reported Occurrences ....................................................................... 29
    2.2.4  Region within Program Area ................................................................................................. 31
  2.3 Project Area-Scale Habitat Quality Attributes ......................................................................33
    2.3.1  Extent of Connected Aquatic Habitat within Project Area ................................................... 33
  2.4 Map Unit-Scale Habitat Quality Attributes...........................................................................34
    2.4.1  Dominant Vegetation Type ................................................................................................... 35
    2.4.2  Severe Flooding during Winter Dormancy ............................................................................ 36
    2.4.3  Connectivity to Suitable Off-site Aquatic Habitat ................................................................. 37
    2.4.4  Maintenance of Water Conveyances .................................................................................... 42
    2.4.5  Maintenance of Uplands Along Water Conveyances............................................................ 46
  2.5 Aquatic Feature Habitat Attributes .....................................................................................48
    2.5.1  Aquatic Feature Extent.......................................................................................................... 48
    2.5.2  Aquatic Feature Type ............................................................................................................ 50
    2.5.3  Presence of Water During the Active Period ........................................................................ 53
    2.5.4  Emergent Wetland Vegetation Types ................................................................................... 54
    2.5.5  Emergent Wetland Vegetation Percent Cover ...................................................................... 56
    2.5.6  Emergent Wetland Vegetation Complexity .......................................................................... 57
    2.5.7  Terrestrial Vegetation Type................................................................................................... 59
    2.5.8  Terrestrial Vegetation Width along Aquatic Feature ............................................................ 60
    2.5.9  Terrestrial Vegetation Complexity ........................................................................................ 61
    2.5.10 Subterranean Refugia............................................................................................................ 62

                                                                                                                                                      vi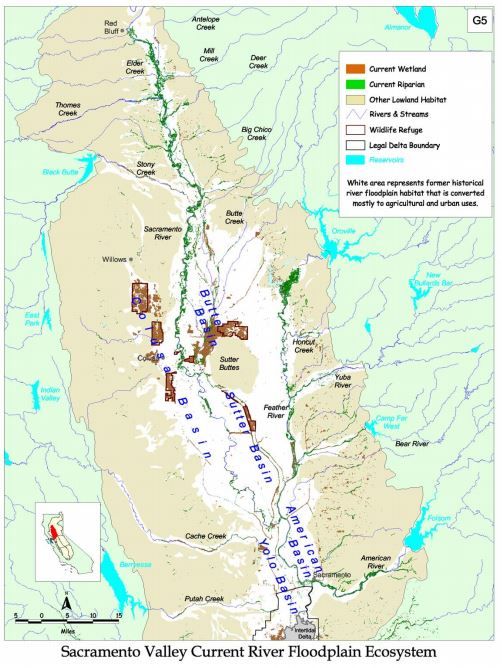
Multispecies Habitat Quantification Tool: Giant Garter Snake
2.6 Scoring ...............................................................................................................................63
2.6.1 Overview of Scoring Approach .............................................................................................. 63
2.6.2 Landscape Context Scoring ................................................................................................... 65
2.6.3 Site Capacity Scoring ............................................................................................................. 66
Combined Landscape and Site Capacity Score .................................................................................... 71
2.7 Literature Cited in Section...................................................................................................73
Tables
Table 1. TAC meeting details and completed steps for development of the giant garter snake HQT. . 18
Table 2. Scoring the timing of different upland vegetation maintenance activities ............................... 48
Table 3. Habitat attributes that address the structure of Aquatic Features and their scoring wts ........ 70
Table 4. Habitat attributes that address management of Aquatic Features and their scoring wts ....... 71
Figures
Figure 1. Map showing extent of Central Valley Habitat Exchange Program Area ...................................... 2
Figure 2. Distribution of major vegetation types in the Delta under pre-European settlement conditions . .. 5
Figure 3A. Historical distribution of floodplain and wetland ecosystems in the Sacramento Valley ............. 6
Figure 4. General overview of the structure of the Habitat Quantification Tools for focal species. ............ 10
Figure 5. Example Project Area for multi-species HQT .............................................................................. 12
Figure 6. Generalized schematic of the Exchange Habitat Quantification Toolkit’s major components. ... 14
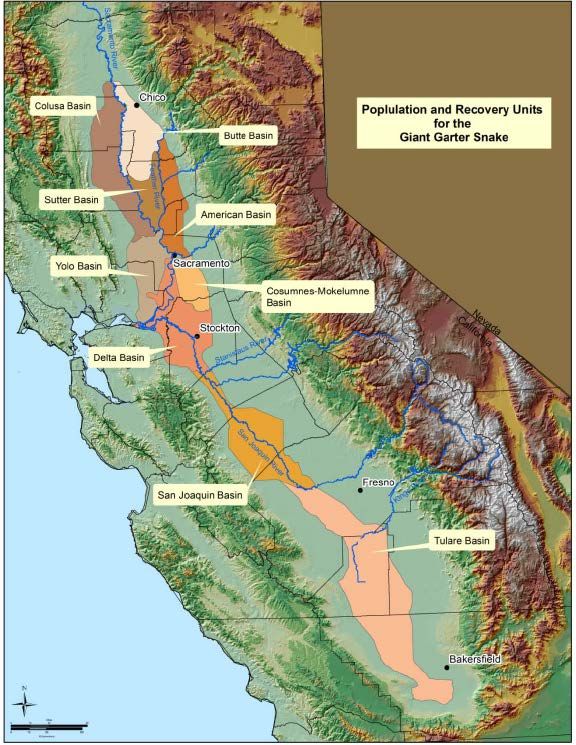
Figure 7. Population and Recovery Units for the giant garter snake, copied from USFWS 2015. ............. 21
Figure 8. Distribution of historic tule marsh................................................................................................. 28
Figure 9. Scoring response function for site distance from historical tule marsh, ...................................... 29
Figure 10. Scoring response function for site distance to recently reported giant garter snake sighting ... 30
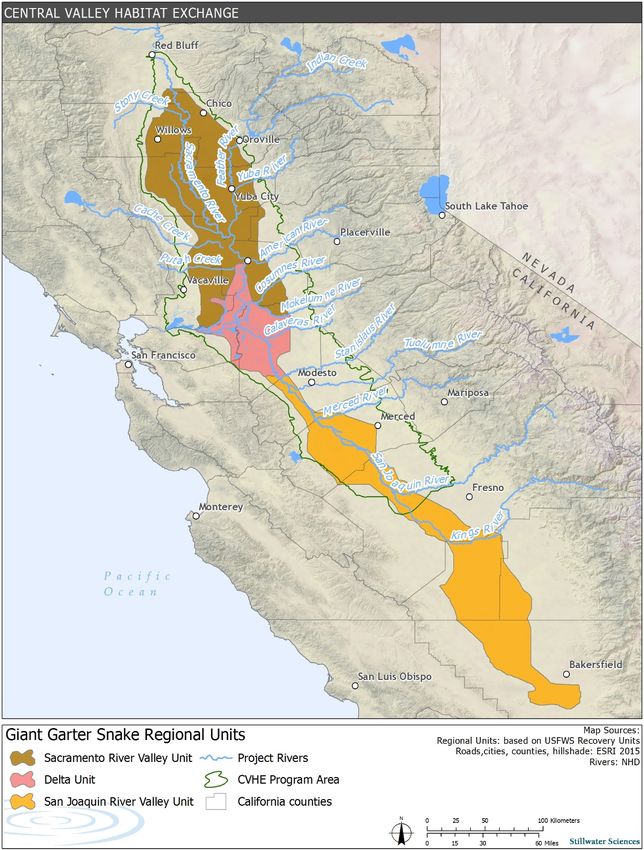
Figure 11. The three giant garter snake Regional Units. ............................................................................ 32
Figure 12. Increased connected aquatic habitat within a Project Area ....................................................... 34
Figure 13. Scoring response functions for Map Unit vegetation types. ...................................................... 36
Figure 14. Aquatic and overland connections between an Aquatic Feature within a Map Unit .................. 40
Figure 15. Scoring response function for the hydrologic distance between ............................................... 41
Figure 16. Scoring response function for the overland distance between Map Unit and suitable aquatic . 42
Figure 17. Scoring response function for number of times canals are graded within a 10-year period ..... 44
Figure 18. Scoring response function for the number of canal sides graded at a time. .... Error! Bookmark
not defined.
Figure 19. Scoring response function for the time of year that canal grading occurs. Error! Bookmark not
defined.
Figure 20. Scoring response function for disposal location of canal dredge spoils. ................................... 46
Figure 21. Scoring response function for the type of vegetation maintenance performed ......................... 47
Figure 22. Scoring function for connected habitat extent ........................................................................... 50
Figure 23. Scoring response function for the type of Aquatic Feature. ...................................................... 52
Figure 24. Scoring response function for the presence of water during the year. ...................................... 54
Figure 25. Giant garter snake basking on tule mat over water ................................................................... 55
Figure 26. Scoring response function for emergent vegetation type within the Aquatic Feature. .............. 56
Figure 27. Scoring response function for the percent cover of emergent vegetation ................................. 57
Figure 28. Patterns of complexity for dominant emergent vegetation cover in an Aquatic Feature. .......... 58
Figure 29. Scoring response function for complexity of emergent vegetation within the Aquatic Feature. 59
Figure 30. Scoring response function for upland percent of ground exposed to sunlight. ......................... 60
Figure 31. Scoring response function for areas that include exposed and covered ground surface.......... 61
Figure 32. Example of an aquatic feature and refugia locations. ............................................................... 62
Figure 33. Scoring response function for abundance of upland subterranean refugia. .............................. 63
Figure 34. Summary of how attributes score categories are combined ..................................................... 65
Figure 35. Detailed diagram of attributes and attribute weighting in the HQT. ........................................... 72
vii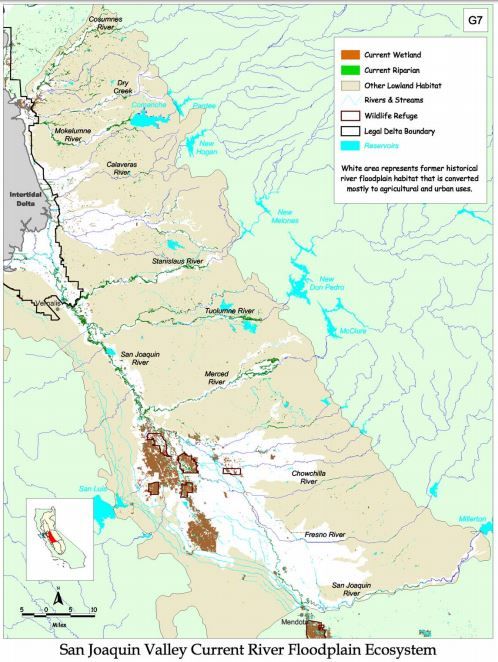
Multispecies Habitat Quantification Tool: Giant Garter Snake

1.0     Overview of the Habitat Quantification Tool

The Multispecies Habitat Quantification Tool (mHQT) applies a multi-scaled approach to assess
environmental conditions, habitat quality and quantity, and conservation or mitigation outcomes for
multiple species native to the Central Valley. The mHQT has been designed for use in the Central Valley
Habitat Exchange (Exchange); however, this tool could have broad applicability for use in other mitigation
and conservation efforts in California’s Central Valley. With its focus on the species dependent upon the
river corridor and adjacent agricultural lands, this version of the mHQT targets off-channel habitat and
associated uplands, much of which is privately owned in the Central Valley.

The Exchange is a new initiative taking advantage of the emerging market of habitat credits to improve
habitat quality in the Central Valley by leveraging the habitat that willing landowners can provide. The
Exchange will facilitate investment in conservation and restoration of vital Central Valley habitat by
promoting, monitoring and assisting in the exchange of habitat credits. The Exchange will allow habitat to
be traded as a commodity by creating habitat credits that willing landowners can sell to private and public
investors. Potential investors include but are not limited to state agencies or private entities seeking
credits for mitigation requirements or restoration mandates. Through the Exchange, landowners will be
paid to “grow” habitat such as flooded fields for salmon and migratory birds, riparian forest for Swainson’s
hawks and wetlands for giant garter snakes. The result will be a new funding stream that will enable
landowners to earn revenue for restoring and maintaining functional habitat. The Exchange program area
covers lands in the California Central Valley that extend up to 91.4 m (300 ft) elevation and downstream
towards the San Francisco Bay, ending at the western extent of the Legal Delta (Figure 1).

The assessment and scoring rationale and methods described in the mHQT measure the quality and
quantity of habitat. The mHQT can determine the degree to which Project Area conditions meet species
habitat requirements and preferences. The mHQT scoring is designed to be responsive to changes in
Project Area conditions that positively or negatively affect habitat quality and quantity and which thereby
affect the amount of habitat credits and debits associated with a Project Area. Changes to habitat quality
include direct and indirect effects of land and water management on the ability of the land parcel and the
surrounding area to support the species. Measures of quality and quantity are combined into “functional
acres”, which are units of habitat quality (“function”) over a given quantity (“acres”) relative to functional
(minimum score or greater) and optimal (maximum score for a given landscape context) conditions. The
Exchange Operations Manual (Exchange Manual) defines how the Exchange uses these scores to
generate credits and debits.

                                                                                                                 1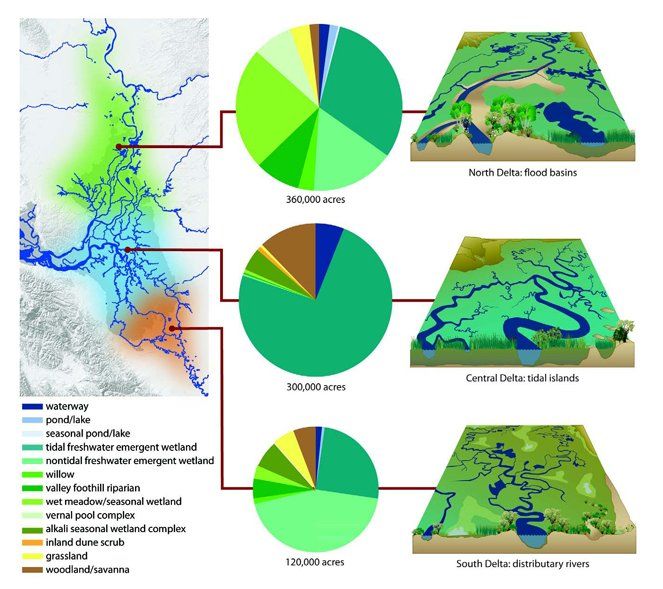
Multispecies Habitat Quantification Tool: Giant Garter Snake

Figure 1. Map showing extent of Central Valley Habitat Exchange Program Area, indicating three major
          regions within the Program Area: Sacramento Valley (pink), Delta and Central Tributaries
          (green), and the San Joaquin Valley (blue).

1.1     mHQT Development Process

The Exchange is a collaboration among American Rivers, Environmental Defense Fund, Point Blue
Conservation Science, Trout Unlimited, California Farm Bureau Federation, Delta Conservancy, California
Trout, Environmental Incentives, Stillwater Sciences, and California Department of Conservation that is

                                                                                                          2
Multispecies Habitat Quantification Tool: Giant Garter Snake
intended to lead to the development of crediting and debiting programs that help promote effective
conservation and mitigation of Central Valley habitats.
The Exchange system for quantifying habitat quality and quantity is an evolving suite of technical
products developed and overseen by scientists from Exchange organizations working in partnership and
with input from other private organizations, NGOs, institutions, and state and federal agencies. The
Exchange’s long-term success will hinge on its ability to meet the needs of a wide range of interests and
stakeholders while accurately reflecting habitat conditions and performance for target species. Technical
workgroup meetings occur regularly and are open to technical staff from parties interested in advancing
this effort.
The Exchange is structured to accommodate habitat exchanges for multiple species, either with
overlapping or spatially separate areas. To-date, HQTs have been developed for four target species or
suites of species:
• Chinook salmon (including winter-run, spring-run, fall run, and late fall-run) (csHQT),
• Riparian land birds (rbHQT,
• Swainson’s hawk (shHQT),
• Giant garter snake (gsHQT)
A technical advisory committee (TAC) was created for the development of each species HQT. Each TAC
is composed of species experts and key personnel from relevant agencies, including CDFW, NOAA,
USFWS, DWR, and members of the Exchange science team with appropriate expertise. The tool
development process has varied slightly for each species-specific tool developed thus far. In the case of
the csHQT and the rbHQT, the tools were initially developed by Stillwater Sciences working under
guidance of the Exchange Science Team and then improved and refined through consultation with the
species or guild-specific TAC. The shHQT and gsHQTs were developed by Stillwater Sciences working
with the species or guild-specific TAC from the beginning.
In all cases, the tools were developed following a similar general sequence of steps. Once the most
important habitat attributes were identified for the Landscape Context score and for the Site Capacity
score, information sources and/or field data collection methods were articulated along with attribute
parameters and the appropriate metrics for measuring them. Habitat suitability response functions for the
identified metrics were then developed to yield scores for each attribute, reported on a scale of 0 to 1.0.
Areas to input relevant landscape and site-scale information were then created in an Excel-based HQT
which links information entered by the user to the articulated response functions. These attribute scores
are then automatically compiled into habitat quality scores for each species or guild relevant for the
Project Area. Draft tools are field tested at multiple locations and with multiple users, refined based on
findings from the field and input from the users, and finalized as a first version which can undergo regular
3Multispecies Habitat Quantification Tool: Giant Garter Snake
updates in order to incorporate new science into the tools. A field manual with guidance on how to collect
data needed for each HQT is developed in parallel with tool development.
The HQT can thus be used to assess the effects of specific changes in Project Area conditions on habitat
quality to inform the most effective management alternatives for one or several species. The components
of these species HQTs are combined into a single spreadsheet tool, referred to as the multispecies HQT
(mHQT). As more species or suites of species are added to the mHQT, more explanatory chapters will be
available to compile into a document for the full mHQT.
1.2 Key Concepts
1.2.1 Habitat Quality and Species Performance
Habitat represents a particular combination of resources (e.g., food, shelter, and water) and
environmental conditions that support a wildlife population’s vital rates—i.e., survival and reproduction
(Morrison et al. 2006). Habitat can vary in quality and therefore its ability to support a population’s vital
rates over time. Simply put, high quality habitat is more likely to sustain resilient populations than poor
quality habitat. Improvement of habitat quality can increase carrying capacity, allowing existing habitat
area to support a higher species density and greater total population size. Poor habitat quality may lead
to low survival and reproduction, lower densities, and eventual extirpation of a population. Marginal
habitat may support some amount of occupancy by a species, but may still result in low survival and/or
reproduction, which will likely lead to population declines without high levels of immigration.
1.2.2 Water
Water is a critical component of habitat for many species, including Chinook salmon and giant garter
snake. Multiple habitat attributes are combined to determine whether an area is suitable in terms of its
ability to provide shelter and food resources for a given species. The California Central Valley was once
dominated by vast stretches of wetlands and floodplains, flanking the Sacramento River and its tributaries
to the north, the San Joaquin River and its tributaries to the south, and extending hundreds of thousands
of acres across the valley floor (Figures 2 and 3A–D). As a result of this unique geography, the historical
Central Valley was perhaps the most productive wetland-floodplain complex in North America, supporting
a diverse and abundant spectrum of wildlife including the now-threatened Chinook salmon, giant garter
snake, and riparian land birds. The winter and spring floodwaters that fed the vast emergent wetlands and
created and supported extensive willow and cottonwood gallery forests that were home to many wildlife
species, also washed young salmon and other native fishes out of the river channels and into the
floodplains and marshes. Protected from the current of the main river and supplied with abundant food
4Multispecies Habitat Quantification Tool: Giant Garter Snake
resources, these sheltered habitats provided environmental conditions that were optimal for growth as the
young salmon migrated out to the ocean. Giant garter snakes thrived in the lowland tule marshes and
myriad bird species lived in the diverse and productive riparian and wetland habitats.
Figure 2. Distribution of major vegetation types in the Delta under pre-European settlement conditions
(from Whipple et al. 2012).
The once hydrologically dynamic central valley landscape has been significantly altered over the last
century; its rivers channelized and levied, wetlands drained, and much of its native riparian habitats
destroyed. Today, only five percent of the Central Valley’s historical wetland complex still exists (Figures
3C and 3D) (Bay Institute 1998, Whipple et al. 2012). Native riparian floodplain habitat has been so
drastically changed that, without remediation, populations of riparian dependent species, including
Chinook salmon, are on the verge of collapse (Katz et al. 2013).
5Multispecies Habitat Quantification Tool: Giant Garter Snake
Figure 3A. Historical distribution of floodplain and wetland ecosystems Figure 3B. Historical distribution of floodplain and wetland ecosystems
in the Sacramento Valley (from Bay Institute 1998). in the San Joaquin Valley (from Bay Institute 1998).
6Multispecies Habitat Quantification Tool: Giant Garter Snake
Figure 3C. Current distribution of floodplain and wetland ecosystems Figure 3D. Current distribution of floodplain and wetland ecosystems in
in the Sacramento Valley (from Bay Institute 1998). the San Joaquin Valley (from Bay Institute 1998).
7Multispecies Habitat Quantification Tool: Giant Garter Snake
1.2.3 Spatial Scale
As with many ecological processes, habitat selection occurs at multiple spatial scales, with individuals
choosing to settle in a location by keying in to different features at different scales, determined in part by
their ability to move among habitat gradients (Wiens et al. 1987, Morrison et al. 2006). For example, birds
are highly mobile and may perceive physical vegetation structure first over a relatively large, landscape
scale, then settle across the landscape according to more fine scale vegetation composition, vertical
structure and other factors, such as competitors. Favorable river reaches or large floodplains attract
congregations of fish capable of swimming from the Ocean coast hundreds of miles inland. Within these
larger scale habitats, the distribution of individuals is often determined based upon habitat characteristics
or competitive interactions at finer spatial scales. In comparison, giant garter snakes are far less mobile
and dispersal is limited to active movement that occurs on the scale of hundreds of meters or relatively
rare incidental and passive movement that can occur at larger scales (e.g., tens of miles) if individuals are
washed downstream during large storm events.
Issues of spatial scale are incorporated into the mHQT through species or guild specific metrics and
scoring functions that account for the Landscape Context and other metrics and scoring functions that
operate at finer scales within the Project Area. Within the Project Area, some features, such as dominant
crop cover, can be measured and reliably reported at broad scales ranging from 40 to 150 acres (e.g., the
size of a farm field). Species respond to other features that occur at finer scales, and these must be
reported at appropriately matching fine scales. For example, vegetation density in various vertical layers
varies among vegetation types and in riparian corridors; these are most reliably observed at scales
ranging from 0.5 to 5.75 acres. Thus, the spatial scale at which habitat attributes are measured and
reported in the mHQT is driven by the scale at which the target species responds to that feature.
1.2.4 Time Scales
Temporal (time) scales also vary among ecological processes, and ecological responses to increasing
time scales may not be linear (Wiens et al. 1987). The time required for a riverine system to respond to
management practices and the time for a fish population’s vital rates to reflect such changes will vary by
ecosystem, geography, area, climate, land use, and species life history. For example, salmon populations
have multi-year life history patterns that result in a two- to five-year periodicity for cohort freshwater
habitat use. Similarly, salmon populations often exhibit large fluctuations in abundance due to cyclical
climate factors that affect marine and freshwater survival (Beamish and Bouillon 1993, Koslow et al.
2002). Swainson’s hawk roam broad areas, foraging in certain crop types depending on management
practices that flush or expose abundant prey (Estep 1989). Growers rotate crop types over one to five or
ten-year rotations to maintain healthy soils. Therefore, it can be difficult to distinguish the effects of
specific conservation actions on a target population, especially if measurements reflect only a single
8Multispecies Habitat Quantification Tool: Giant Garter Snake
snapshot in time. The Multispecies HQT attempts to account for these issues of temporal fluctuations at
different time scales by requiring reporting of conditions that change over time. For example, hydrologic
modeling that combines expected future conditions (e.g., Project Area modifications and/or climate
change) must be performed to estimate future time-dependent Project Area conditions for Chinook
salmon. Repeated empirical measures of habitat conditions during multiple inundation events are used to
assess past or existing habitat quality. Similarly, crop rotations, canal maintenance, and other associated
changes in management practices that affect foraging opportunities must be reported to assess habitat
quality for dependent species, such as Swainson’s hawk and giant garter snake.
1.3 Framework for Quantifying Habitat Functionality
The foundation of the Exchange system for quantifying habitat function is a science-based approach to
measuring the quality and quantity of habitat, based on habitat attribute parameters and metrics, that a
given area (terrestrial or aquatic) or parcel provides for target species, guilds, or groups of species. The
habitat quantification tools for each species or species guild share a similar structure, easing application
of the same site data for multiple species. Characteristics about the surrounding landscape inform the
Landscape Context score; habitat attributes and management practices within the Project Area inform the
Project Area score. For all species, the landscape conditions are combined in some way with the Project
Area scores in order to develop a score for the species-specific (or guild-specific) habitat quality in the
Project Area (Figure 4). The habitat quality, as a percent of the site potential, is then multiplied by the
number of acres proposed in the Project Area to determine the number of functional acres. This process
can be executed for each individual species or species guild, and the habitat acres reported separately,
or the species-specific habitat acres can be combined using rules developed outside of the HQT as part
of the Exchange Program. The components of the habitat quantification tools, including the landscape
context and habitat attributes, are described below. Different applications of the mHQT, including
predictive vs. retrospective, and single species vs. multiple species are also described in the following
sections.
9Multispecies Habitat Quantification Tool: Giant Garter Snake
Aquatic Habitat
Landscape Site
Context Terrestrial Habitat
Capacity
Management
Habitat Quality Functional
Acres
(percent of potential)
Acres
Figure 4. General overview of the structure of the Habitat Quantification Tools (HQTs) for multiple focal
species.
1.3.1 Landscape Context
Within the Exchange Area (Figure 1), habitat function may be modified by contextual information that
describes the regional need and/or opportunity for the target species, linkage to a larger habitat patch or
significant proportion of the population, or other relevant physical and biological conditions in the
surrounding watershed. Contextual information is applicable at a range of scales including: (a) Project
Area location (4th order; e.g., hydrologic connectivity with floodplain, existing vegetation composition
and/or structure directly surrounding the Project Area, soil type, etc.); (b) watershed or local area (3rd
order; e.g., HUC 12) (meander potential, connectivity among habitat patches, surrounding land use
and/or fire regime, etc.); (c) region (2nd order; e.g., channel network density, habitat fragmentation and
connectivity patterns); and, (d) range (1st order; e.g., species ranges).
1.3.2 Habitat Attributes
Attributes are specific habitat characteristics or habitat-forming processes that determine the degree of
habitat function (quality) for individual target species or groups of species for a Project Area. Key
attributes are identified based on their relevance to species needs and tolerances.
Habitat attributes are composed of three types of information: (1) a set of measurable Habitat
Parameters with known relationships to habitat quality that also include specific reportable units for
measuring each parameter, referred to as metrics. Parameters are used to quantify key habitat attributes
10Multispecies Habitat Quantification Tool: Giant Garter Snake
(characteristics and processes) that determine the degree of habitat function of a Project Area; (2)
Attribute Timing that includes the increment(s) of time that is relevant to a given parameter and the
specific timing (e.g., monthly, seasonally, annually) during which a given parameter possesses a given
value, or must achieve a given threshold, in order to meet the habitat needs of the target species; and, (3)
Necessary vs. Beneficial: Where “necessary” indicates that an attribute must be present for an area to
be considered functional habitat; and “beneficial” indicates that the attribute can improve habitat quality
but is not absolutely necessary.
1.3.3 Spatial and Temporal Scales in the HQT
Habitat attributes are observed and measured within the Project Area at the spatial scale most relevant to
the target species. In the current mHQT, attributes are measured at three spatial scales: (1) Project Area,
(2) Map Unit, and (3) Riparian Unit or Aquatic Feature. A Project Area is a parcel, or collection of parcels,
of land identified and evaluated as a potential area for restoration, enhancement, or protection for HQT
target species or suites of species (e.g., giant garter snake). A given Project Area is divided into relatively
homogeneous Map Units that range from 40 to 150 acres in size for the Swainson’s hawk and Riparian
land bird tools and can range up to several hundred acres in size for the giant garter snake tool. All Map
Units must have consistent vegetation patterns, management actions, and flood regimes. A set of
attributes are measured at the Map Unit scale. Nested within these Map Units, Riparian Units are
delineated at finer scales, ranging from 0.5 to 5.75 acres, and used to report consistent areas of
vegetation structure and composition. Within each Map Unit, finer scale “Aquatic Features” can also be
demarcated. Each individual Aquatic Feature will have consistent habitat quality attributes such as
standing or slow-moving water. While Aquatic Features will commonly be linear (e.g., canals), each will
be delineated as a polygon in Geographic Information System (GIS). One or more Aquatic Features can
be within a Map Unit, but a Map Unit does not have to be completely filled with smaller Aquatic Features
and/or Riparian Units, or have any at all.
A rice canal or a stand of riparian forest, while delineated as an Aquatic Feature or Riparian Unit within
one Map Unit, may continue into one or more adjacent Map Units. In this case, the Aquatic Feature or
Riparian Unit will have different identification codes across Map Units but be linked in the HQT by bearing
the same “contiguity code” (Figure 5). This information is used to calculate the extent of continuous
aquatic or riparian habitat that crosses multiple Map Units. For example, a unique Aquatic Feature may
be hydrologically linked to another unique Aquatic Feature, within or across Map Units; these would share
the same “contiguity code” within or across Map Units. Attribute scores for Riparian Units and for Aquatic
Features are rolled up per Map Unit using area-weighted averaging, and these and attributes measured
at the Map Unit scale are rolled up for the Project Area also using area-weighted averaging.
11Multispecies Habitat Quantification Tool: Giant Garter Snake
Figure 5. Example Project Area for multi-species HQT, showing delineations of Map Units within the
Project Area, Riparian Units within a Map Unit, and Aquatic Features within the Map Units that
share connectivity codes across multiple Map Units.
12Multispecies Habitat Quantification Tool: Giant Garter Snake
Information used in the mHQT is also tailored to the time scale most relevant to species needs, including
the active season(s) for the species, and, for salmon, the timing of specific inundation events. For all
species, the mHQT provides scores of habitat quality for a single year. However, conditions over multiple
years can be bundled to reflect a multi-year average when there are repeated or predictable patterns over
time. For example, a repeating crop rotation (five-year alfalfa, two-year tomato, repeat) can be entered for
Swainson’s hawk HQT (swHQT) to reflect average annual conditions, and flood events expected to occur
at least every other year can be used to predict likely habitat quality for the Chinook salmon HQT
(csHQT).
1.3.4 Predictive vs. Retrospective Applications of HQT
HQT scores for species with a high degree of dependence on hydrologic conditions, such as for Chinook
salmon, are currently structured to accommodate two levels of data input: predictive and retrospective.
Predictive data, as the name suggests, is used to estimate potential future conditions and habitat quality
scores for a Project Area, as might be relevant, for example, to a location where new enhancement or
management actions anticipated to change habitat condition are planned. Since this is for future
conditions, there is inherent uncertainty in the input data and resulting HQT scores. For example, for a
given floodplain, topographic and revegetation plans, past flow data, and quantitative hydrologic/hydraulic
models can be used to describe a potential flow event. The likelihood of this event can also be calculated
based upon past flow records. However, some metrics are currently not feasible to reliably predict, such
as stream temperature and dissolved oxygen levels during the flow event. In contrast, retrospective
application of the HQT to a Project Area using empirical observations has much greater certainty of event
occurrence and conditions (although some uncertainty may remain due to the need to extrapolate some
point measurements over space and time) than with predictive applications. For some metrics,
retrospective applications can also be done with greater specificity than predictive applications. For
example, more specific input values on flood timing, duration and extent can be provided when using
observations of actual past events than from predicted likelihood of future events. These differences
between predictive and retrospective information are incorporated in the csHQT at both the data input
and scoring levels. For data input, the user indicates whether they are performing a predictive or a
retrospective assessment, and associated data input cells become highlighted. Scoring is based upon the
same principles but necessarily differs with the differences in data input. Details on how data inputs and
scoring differ between the predictive and retrospective applications are provided in the csHQT chapter for
the mHQT.
13Multispecies Habitat Quantification Tool: Giant Garter Snake
1.3.5 Habitat Quantification Toolkit
The Exchange system for quantifying habitat function for multiple species is composed of a four-part
Habitat Quantification Toolkit that works synergistically to address core Exchange requirements, as
outlined in Figure 6.
Framework for Quantifying Habitat
• Attributes, Parameters, and Metrics for measuring habitat utility
• Landscape context describing habitat potential in landscape
• Project Area, Map Units, Habitat Units for delineating habitat scale attributes
Habitat Utility for Species- Information Base
• Attributes and parameters identified for target species and guilds
• Habitat suitability indices (bins or scoring curves for relevant parameters)
• Habitat quality Species habitat quality scores and recommendations
Field Manual for Quantification
• Methods for measuring and/or modeling value on the ground
• Guidelines for assessment approaches to achieve assurance levels
Spatial Analysis Tools
• Google earth kml with relevant spatial data for landscape context assessment
• GIS ARC INFO shapefiles for landscape context assessment
Habitat Quantification Tool
• Specifies required input information
• Automates calculations of habitat utility score
• Performs stacking to create species specific and multi-species composite scores
• Application to generate recommendations for habitat enhancements
Figure 6. Generalized schematic of the Exchange Habitat Quantification Toolkit’s major components.
The framework for quantifying habitat is provided in this chapter of the Scientific Rationale and Methods
Document and the species-specific information base for each HQT is provided in the species or guild
specific chapters of this document. A brief field manual with clear instructions on collecting input
information for the HQT is provided as a separate document, and is thus far tailored for each species or
guild tool. These Field Guidance documents also describe methods for interpretation and reporting of
14Multispecies Habitat Quantification Tool: Giant Garter Snake
HQT scores, as well as examples of applications under a range of circumstances to achieve assurance
levels. Some of the landscape context information for the HQT can be obtained using either GIS or
Google earth files provided with the mHQT. The HQT itself is an excel spreadsheet that includes input
areas for field and office data, and output score summary tables for each species in the tool.
The multispecies HQT is designed for use by agency personnel, land owners, or third-party consultants. It
is assumed that individual(s) using the HQT have a working knowledge of and access to landscape-scale
information (Google Earth, Arc GIS, or aerial imagery) and Excel software. Some background in natural
resources and farmland management is also essential. More intensive field and/or hydraulic modeling
efforts are required for application of the Chinook salmon portion of the mHQT, as detailed in the Chinook
Salmon HQT chapter of this document. It is expected that those that use the mHQT will have at least a
one-day training in use of the tool and interpretation of the mHQT results.
The mHQT can be applied to establish pre-project baseline conditions, to estimate expected habitat
quality and quantity effects of project implementation, and to objectively and consistently track and report
changes in habitat quality and extent through time, following initial project implementation. The mHQT
accommodates crop rotations and associated schedules for management activities that can affect
species habitat conditions. Baseline conditions are established assuming the existing crop rotation, or
flood regime, extend up to a 10 yr cycle. Information for each crop or flood event type within the cycle is
entered into the mHQT and the scores are developed for the full cycle based on time-weighted scoring.
Thus, if a field under existing, baseline conditions is managed 4 yrs for alfalfa, then 2 yrs for safflower, the
existing conditions score will be based 66% on alfalfa conditions and 33% on safflower conditions. In
similar fashion, these existing conditions can be compared to a different crop rotation and associated
management schedule under ‘restored’ conditions.
1.4 Literature Cited in Section
Bay Institute 1998. From the Sierra to the Sea: The Ecological History of the San Francisco Bay-Delta
Watershed. The Bay Institute of San Francisco. 2nd Printing.
Beamish, R. J., and D. R. Bouillon. 1993. Pacific salmon production trends in relation to climate.
Canadian Journal of Fisheries and Aquatic Sciences 50: 1,002–1,016.
Estep, J. A. 1989. Biology, movements, and habitat relationships of the Swainson's Hawk in the Central
Valley of California, 1986-87. California Department of Fish Game, Nongame.
Katz, J., P. B. Moyle, R. M. Quiñones, J. Israel, and S. Purdy. 2013. Impending extinction of salmon,
steelhead, and trout (Salmonidae) in California. Environmental Biology of Fishes 96: 1,169–1,186.
15Multispecies Habitat Quantification Tool: Giant Garter Snake
Koslow, J. A., A. J. Hobday, and G. W. Boehlert. 2002. Climate variability and marine survival of coho
salmon (Oncorhynchus kisutch) in the Oregon production area. Fisheries and Oceanography 11: 65–77.
Morrison, R. I. G., B. J. McCaffery, R. E. Gill, S. K. Skagen, S. L. Jones, G. W. Page, C. L. Gratto-Trevor
and B. A. Andres. 2006. Population estimates of North American shorebirds, 2006. Wader Study Group
Bulletin 111: 67–85.
Whipple, A., R. M. Grossinger, D. Rankin, B. Stanford, and R. A. Askevold. 2012. Sacramento-San
Joaquin Delta Historical Ecology Investigation: Exploring Pattern and Process. SFEI Report.
http://www.sfei.org/DeltaHEStudy
Wiens, J. A., J. T. Rotenberry, and B. V. Horne. 1987. Habitat occupancy patterns of North American
shrubsteppe birds: the effects of spatial scale. Oikos 48: 132–147.
16Multispecies Habitat Quantification Tool: Giant Garter Snake
2.0 Giant Garter snake
2.1 Overview of Giant Garter Snake Habitat Attributes
The giant garter snake (Thamnophis gigas) Habitat Quantification Tool (HQT) assesses the value of giant
garter snake habitat in a Project Area by incorporating habitat attribute information from the scale of: (1)
the landscape, (2) the full Project Area; (3) a single or set of similarly managed fields, referred to as a
Map Unit, and (4) sections of aquatic habitat that occur within a Map Unit, referred to as Aquatic
Features. Aquatic Features are any aquatic features on a site that support active season foraging.
Landscape-scale attributes include an interrelated combination of proximity to the snake’s presumed
range, proximity to recent documented giant garter snake sightings, and proximity to historical tule marsh.
The single measured Project Area attribute is the compiled extent of connected aquatic habitat within the
Project Area. Habitat quality attributes measured at the scale of the Map Unit include: dominant
vegetation or crop types, severe flooding that could limit the function of winter terrestrial habitat,
connectivity to suitable aquatic habitat, and management of Aquatic Features and adjacent uplands.
Aquatic Feature quality attributes include: the type and extent of each feature; the availability of water; the
type, extent, and complexity of emergent wetland vegetation; the type, extent, and complexity of adjacent
terrestrial vegetation (with respect to basking); and the availability of subterranean refugia (as active
season retreat and non-active season brumation 1 sites).
The giant garter snake HQT is designed to quantify the habitat quality of current site conditions and to
inform restoration initiatives to improve giant garter snake habitat. The giant garter snake HQT was
developed based on the best available scientific information and in partnership with a group of Central
Valley giant garter snake experts that served on the Giant Garter Snake Technical Advisory Committee
(see below).
It is important to consider the time of year the terrestrial vegetation data is collected. The optimal time to
evaluate the extent of the terrestrial vegetation is in spring (e.g., March 15 through mid-June), since that
is the time of year when snakes are coming out of brumation and preparing for the active season, hunting
for food and searching for mates. Field data should be collected between May 1 and September 15
and must be collected when water is present in most Aquatic Features as an overall requirement
for using the giant garter snake HQT. The time constraints on field data collection exist because water
in the canals and other conveyance structures and plants used for cover are not necessarily in the same
condition outside of these dates as they are during the snakes’ active season.
1 Brumation is a hibernation-like state of dormancy that reptiles enter during cold weather.
17You can also read