A Synthesis of State of the Environment Monitoring in the Manukau Harbour - June 2021 - Knowledge Auckland
←
→
Page content transcription
If your browser does not render page correctly, please read the page content below
A Synthesis of State of the
Environment Monitoring in
the Manukau Harbour
June 2021
A synthesis of State of the Environment monitoring in the Manukau Harbour

He Mihi

  Ko Ranginui e tū iho nei te matua e             Ranginui, our sky father, provides our
  whakamarumaru nei i a tātou.                    shelter from above.
 Ko Papatūānuku e takoto ake nei te               Our earth mother, Papatūānuku, from
 whaea i ahu mai ai tātou te tangata, te          whence all people originate, provides
 papa e noho nei hei tūrangawaewae mō             the foundations upon which we stand.
 tātou katoa.
 Ko Tāne e tū rangatira mai nei hei               Tāne, god of the forests, stands as our
 whakahaumaru i te tangata.                       protector.
 Ko Tangaroa hei whakaāio i te iwi.               Tangaroa, god of the seas, helps to
                                                  calm us.
 Ko te hā o Tāwhirimātea hei hā ora ki te         Tāwhirimātea, god of winds, provides
 tangata.                                         the air we breathe.
 Ka heke, ka heke, ki a tātou te tangata.         We trace our descent from these gods.
 Haere te wā, haere te wā, ka tini te             Over time, we have multiplied,
 tangata, ka mahue i a tātou ngā                  outgrowing our surroundings and
 hononga ki te rangi, ki te whenua, ki te         forsaking our familial links to the sky, to
 ngahere, ki te moana.                            the land, forests and seas.
 Nō tātou te haepapa kia tiakina te taiao,        We have a responsibility to care for our
 hei whakamana i ngā whakareanga o                environment, to honour past
 mua, hei oranga anō mō ngā                       generations and provide for those yet to
 whakareanga ā muri nei.                          come.
 Kia mārama tātou ki ngā pānga o te               We must understand how we as people
 tangata ki ngā huringa taiao. Mā roto            have changed our environment. Only
 noa mai i te pūtaiao me te mātauranga            through science and knowledge will we
 e whakaorangia anō ai te mauri me te             be able to restore its mauri and wairua.
 wairua o te taiao.
 Kua eke te wā e tū ai te tangata hei             Now is the time for us all to stand up as
 kaitiaki i te whenua, i te ngahere, i te         kaitiaki for our land, forests and seas. It
 moana. Nō tātou katoa te haepapa –               is a responsibility we must all share – let
 hoake!                                           us uphold it!
 Tuia ki te rangi                                 Bind the domain of the upper realm
 Tuia ki te whenua                                Bind the domain of the land
 Tuia ki te moana                                 Bind the domain of the seas
 Tuia te here tangata E rongo te pō, e            Bind the tapestry of life which affirms
 rongo te ao                                      our connection to the natural world and
                                                  to one another
 Tīhei mauri ora!                                 Let there be life!

                                                                                                iii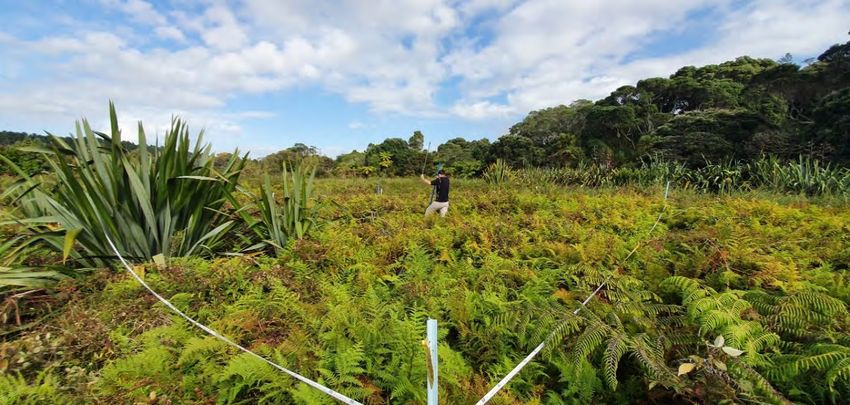
A synthesis of State of the Environment monitoring in the Manukau Harbour
Whakarāpopoto Whakahaerenga
Executive Summary
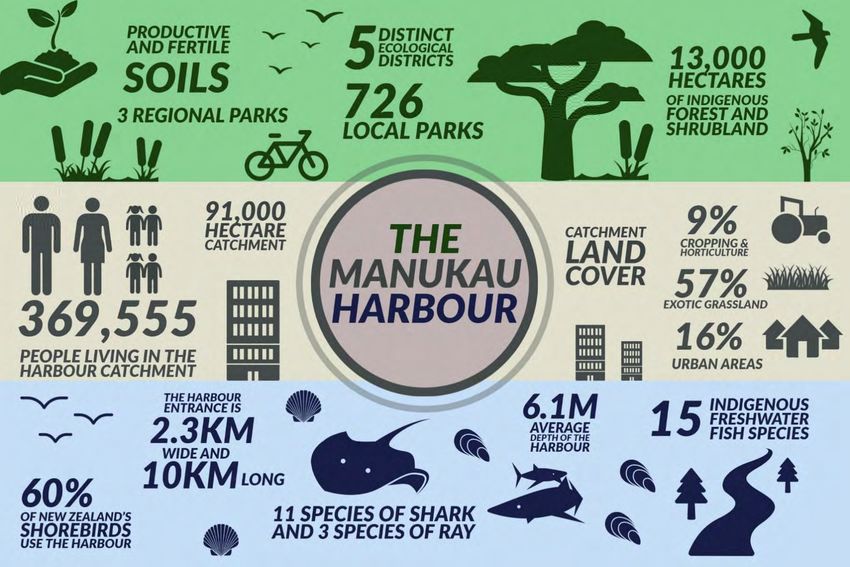
The Manukau Harbour is a large, productive, and important body of water for both Tāmaki
Makaurau and Aotearoa. It provides many ecosystem services of great value to humans
and supports a diverse array of plants and animals. The types of land use and activities
that occur within the catchment surrounding the Manukau are the driving force behind the
harbour’s health, affecting water quality, biodiversity, and ecological processes. State of
the environment monitoring in the Manukau began in 1969, with many programmes
underway for several decades. This report leans on these long datasets and draws
together monitoring results across air, land, and water domains, to describe the current
state of the environment for the Manukau.
Landcover within the Manukau Harbour catchment has remained relatively stable over the
last 22 years, with over half the area dominated by exotic grassland and one fifth as urban.
Less than one tenth of the original forest extent remains and much of this has been
degraded or disturbed. Species richness of native vegetation is highest in the Waitākere
region, while elsewhere in the catchment, lower native plant species richness and higher
proportions of weed species are observed. Problematic weeds and pests are only absent
where intensive weed and pest control takes place. Native bird species accounted for 54
per cent of all birds counted in forests, and 44 per cent in wetlands.
The rich soils around the Manukau are highly valued for their productivity and for
supporting food provision. Rural soils are often over-fertilised in horticultural areas and
compacted in pastoral areas.
Overall air quality in the Manukau Harbour catchment is good and improving, however
exceedances of the National Environmental Standards for Air Quality do sometimes occur
around busy roads or with exceptional events like the Australian dust storms and bush
fires.
Rainfall records up to 2019 in the Manukau Harbour catchment show that rainfall in 2011,
2017 and 2018 was more than 20 per cent higher than the annual average. This led to
increases in both river flows and groundwater levels. Groundwater levels have been
increasing in many aquifers, while some deep sandstone aquifers are showing decreasing
levels, likely due in part to water takes. There are high concentrations of nitrate in shallow
volcanic aquifers. These aquifers feed some of the streams in the southern Manukau
Harbour catchment, which contributes to high nitrate levels in surface waters.
Stream ecosystems in the catchment typically show poor water quality, limited habitat
structure and altered flow, and generally have low ecological value. Zinc and copper are
prominent urban pollutants in streams, although some improvements in concentrations are
iv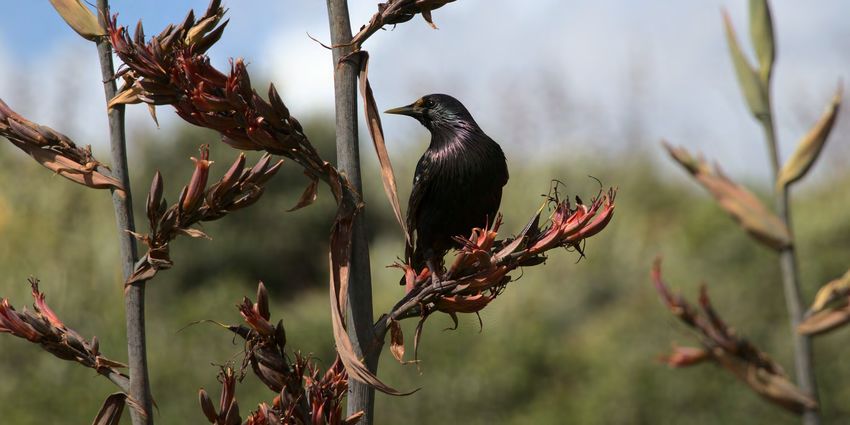
A synthesis of State of the Environment monitoring in the Manukau Harbour

being seen. Several aspects of stream water quality are in a degraded state with the main
water quality issues varying among sites representative of different land use pressures.
Several of these parameters are showing small improvements, although at a slow rate. In
contrast, nitrate is high and continuing to increase in some parts of the catchment.

Coastal water monitoring shows that the Manukau has lower water quality than other
harbours in Tāmaki Makaurau. Nutrient concentrations are elevated compared to regional
reference guidelines and are highest in the Māngere Inlet and near the Māngere
Wastewater Treatment Plant. Significant improvements in coastal water quality occurred
after 2001 following an upgrade to the treatment plant, and further small improvements are
evident in more recent years. Levels of contaminants (copper, lead and zinc) in marine
sediments are elevated in the Māngere Inlet and low at other sites. Excess sedimentation
has had negative ecological impacts in sheltered tidal creeks, reducing the abundance and
diversity of species living in the intertidal mud and sand flats, however sites are healthier in
the body of the harbour.

This report presents and discusses monitoring results and describes current programmes
and initiatives for the Manukau Harbour and its catchment, providing an important base for
future management decisions.

                                                                                               v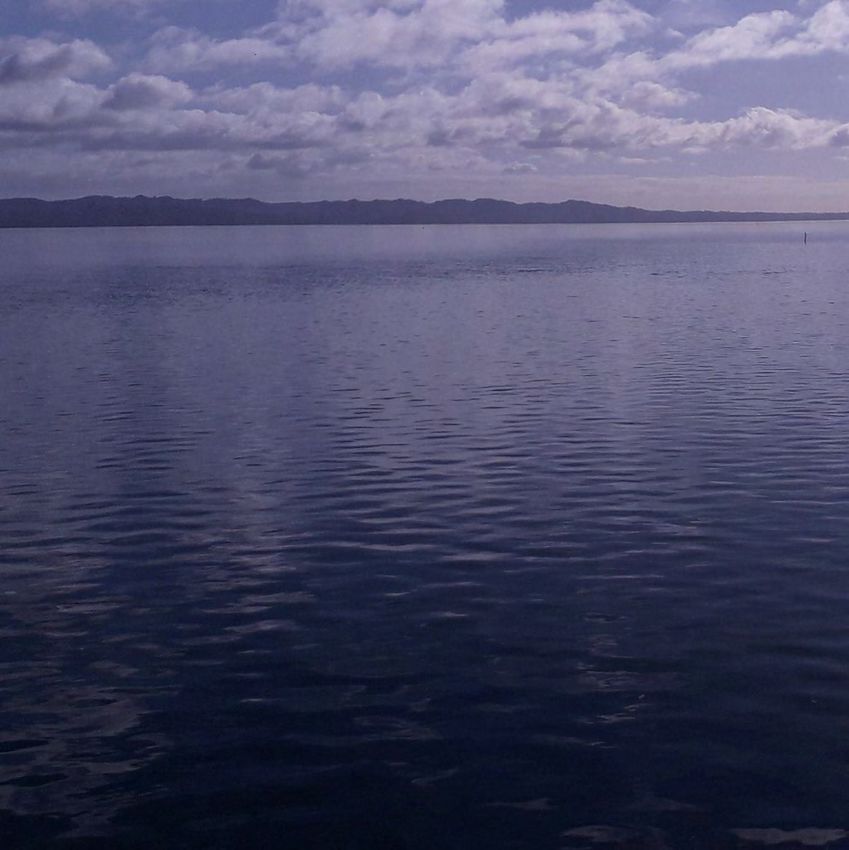
A synthesis of State of the Environment monitoring in the Manukau Harbour

Ngā Rārangi Take
Contents

He Mihi................................................................................................................................ iii
Whakarāpopoto Whakahaerenga / Executive Summary..................................................... iv
Kupu whakataki / Introduction .............................................................................................. 3
   Tā mātou hōtaka aroturuki ā-rohe / Our regional monitoring programme......................... 5
Whenua / Land .................................................................................................................... 7
   Uwhiuwhi Whenua / Landcover ........................................................................................ 9
   Ngahere me ngā Manu / Forest and Birds ..................................................................... 14
   Oneone / Soil ................................................................................................................. 19
Ngā Moana me ngā Wai Māori / Sea and Freshwater ....................................................... 21
   Mātai arowai / Hydrology ................................................................................................ 25
   Awa / Rivers ................................................................................................................... 27
   Moana / Sea ................................................................................................................... 33
Hau / Air... .......................................................................................................................... 45
Whakarāpopototanga / Summary ...................................................................................... 47
Ētahi atu pārongo / Additional Information ......................................................................... 49
Kei te aha Te Kaunihera o Tāmaki Makaurau? / What is Auckland Council doing? .......... 50

                                                                                                                                         2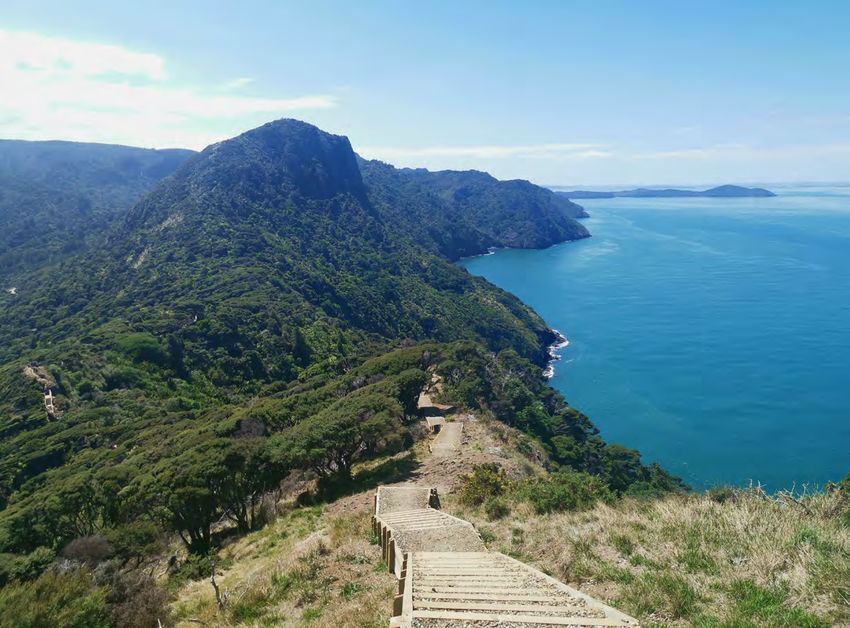
A synthesis of State of the Environment monitoring in the Manukau Harbour
Kupu whakataki
Introduction
In February 2021 Auckland Council published a regional State of the Environment
report which brought together results from technical reports, covering the state and
changes over time in air, land and water domains, to tell the story of the health of
our natural environment in Tāmaki Makaurau. This report provides a synthesis of
those regional findings from monitoring locations within the Manukau Harbour and
its catchment, to provide a basis for future considerations around the management
of the Manukau Harbour. The report focuses on data gathered from long-term
consistent monitoring programmes and reference is made to other available
information. Monitoring information has been reported regularly through technical
reports for individual monitoring programmes. This is the first time all the monitoring
programmes have been brought together in one report for the Manukau.
The Manukau Harbour is a taonga. The body of water and surrounding catchment has a
long and close relationship with the people of Tāmaki Makaurau, as a waterway, a source
of kai, a place for recreation and a place to live. The health of the harbour is paramount
and woven into the health and wellbeing of the people who live, work, and spend time
around it. The area is significant for Māori, its shoreline is home to some of the earliest
settlements in Aotearoa and the harbour and its surrounds hold many sites that are of
strong spiritual and cultural value.
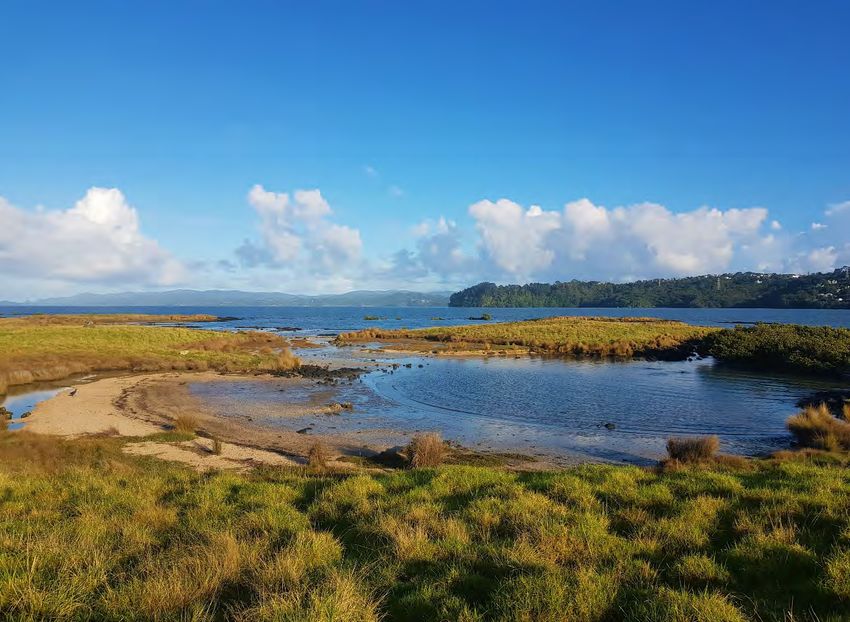
Ecologically, the area is regionally and nationally important, consisting of a diverse range
of habitats that support a huge variety of species. The shoreline is complex, comprising a
number of shallow sheltered creeks and inlets, rocky outcrops, coastal lava flows, and
boulder and sand beaches. Valuable pockets of coastal and marine flora are scattered
across the harbour. This includes patches of saltmarsh, seagrass, mangroves, and in
some areas, intact sequences of connected vegetation extending from coastal algae to
ridge-top forest ecosystems. The harbour is one of the largest in New Zealand and is well
mixed by the Tasman Sea which funnels through the narrow entrance between Whatipu in
the north and Āwhitu in the south. Approximately half the water drains out of the harbour
each low tide, exposing large areas of sand and mud flats that support diverse
communities of marine invertebrates and provide important roosting and foraging areas for
many endemic and migratory shorebirds.
Prior to human arrival, the land surrounding the Manukau was predominantly covered in
lowland podocarp broadleaf forest, along with vast tracts of wetland. Today, the catchment
is dominated by rural land use, containing areas of intensive agriculture and food
production, as well as remaining pockets of native forest, several maunga and adjacent
volcanic fields, and dense urban and industrial areas.
3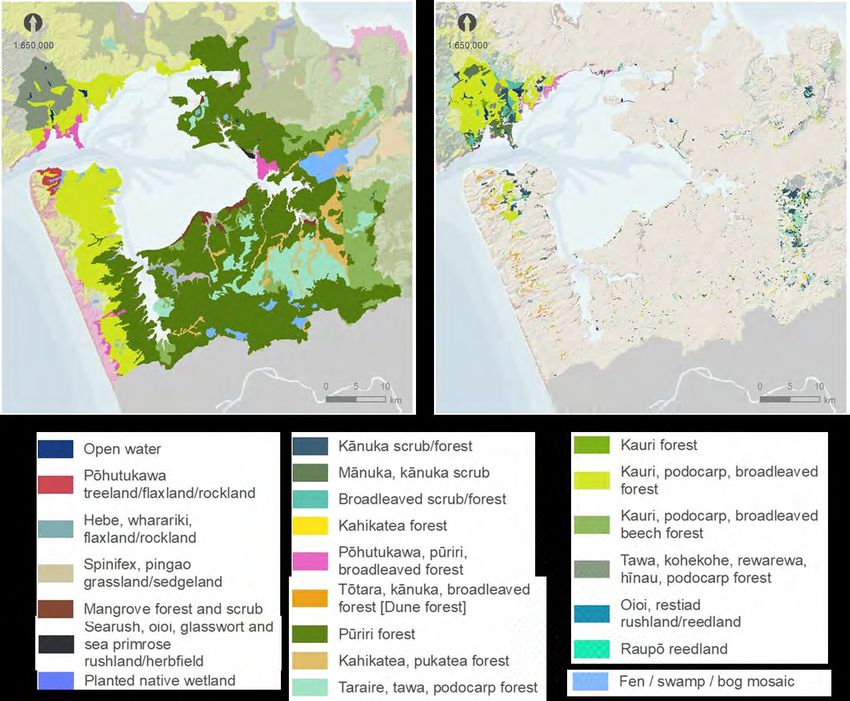
A synthesis of State of the Environment monitoring in the Manukau Harbour

         The impact humans have had on the Manukau has been significant, and the harbour has a
         long history of both modification and pollution. This has impacted the mauri (life force) of
         the Manukau. Historic and current activities continue to affect many aspects of the health
         of the harbour, with industrial, stormwater and wastewater discharge, fine sediment input
         and invasive species having detrimental effects. These impacts have not only been felt
         ecologically, but socially and culturally as well, limiting our ability for recreation, to harvest
         healthy kai and to form connections and engage with the natural environment. Future
         pressures such as new areas of urban development and new and emerging contaminants,
         have the potential to cause further negative impacts if not carefully and proactively
         managed. Coupled with this, the challenges a changing climate bring will further test the
         resilience of the Manukau.
         Despite all of this, the harbour remains able to maintain many ecological services and
         support a myriad of living things, and in some areas, we are seeing improvements.
         Upgrades to wastewater treatment plant discharges have improved water quality in areas
         of the harbour, and improvements in industrial practices have reduced sediment
         contamination in previously heavily contaminated sites. Ongoing and systematic
         monitoring allows the impact of our activities to be better understood and is important to
         inform and drive policy and actions in a direction that can enable productive, sustainable,
         and integrated use of the harbour.

Ambury Regional Park

                                                                                                          4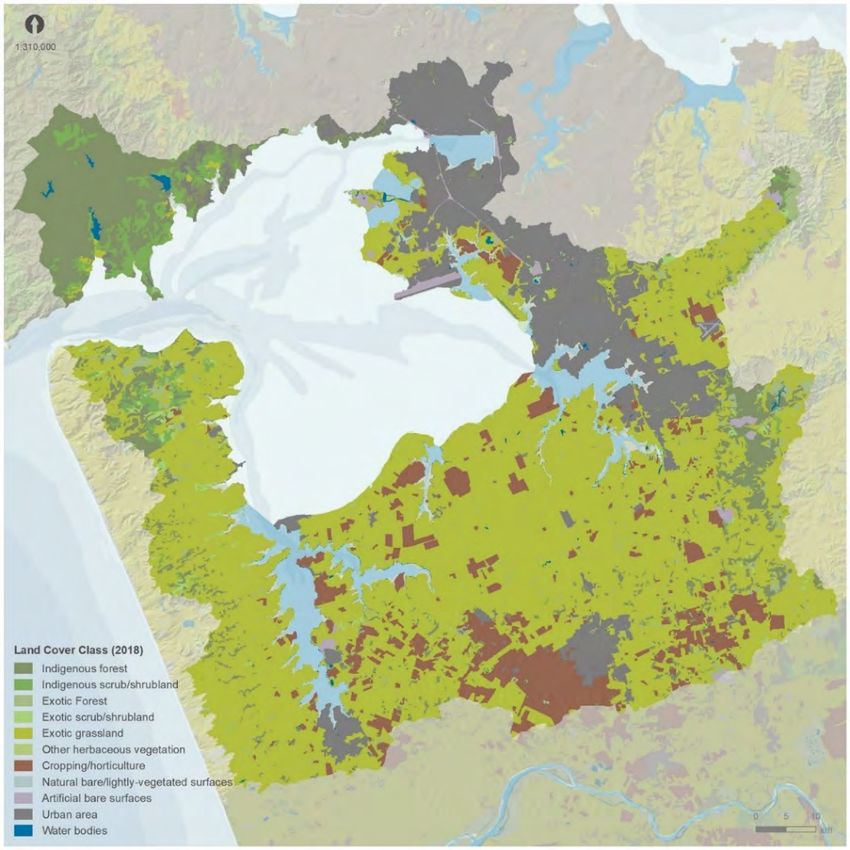
A synthesis of State of the Environment monitoring in the Manukau Harbour

Tā mātou hōtaka aroturuki ā-rohe
Our regional monitoring programme

State of the environment monitoring sites in the Manukau Harbour and catchment

Auckland Council monitors the environment in the Manukau Harbour and surrounding
catchment as part of our state of the environment monitoring programme. This monitoring
is required under the Resource Management Act 1991 and aims to track changes in the
health of the environment through time and to identify potential new issues. In addition, a
large volume of reports and research initiatives have been carried out by Auckland
Council, national organisations, universities, and community groups in the Manukau,
adding to the growing body of knowledge needed to manage such a complex and
important ecosystem. In some cases, monitoring programmes in the Manukau have been

                                                                                              5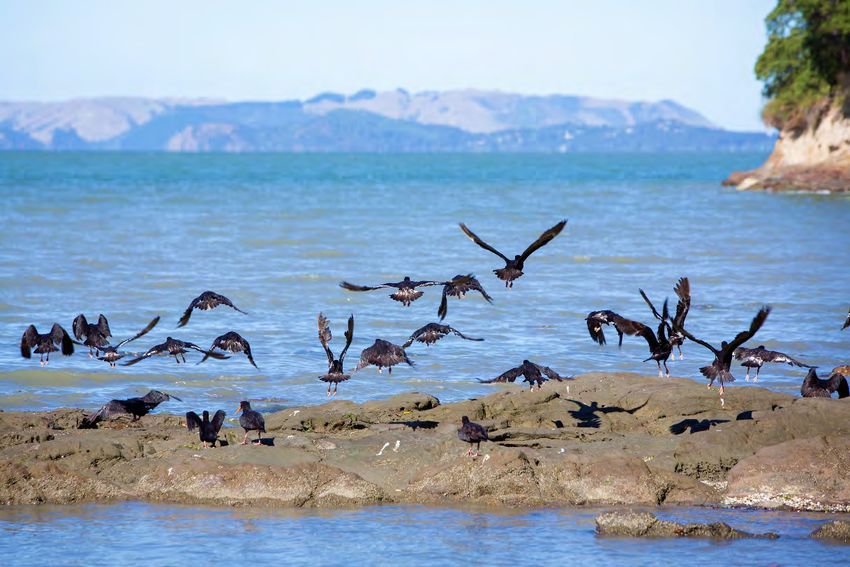
A synthesis of State of the Environment monitoring in the Manukau Harbour

underway for several decades. This long-term data is hugely valuable and essential to
understand the way our activities are impacting the harbour and its catchment over time.
This synthesis report is underpinned by several technical reports providing in depth
analysis and interpretation across 12 monitoring programmes. These reports are available
on Knowledge Auckland and are linked throughout this document. Additionally, relevant
reports and associated sources of information have been included towards the end of this
report.

Start dates of state of the environment monitoring in the Manukau Harbour and catchment

                                                                                           6
A synthesis of State of the Environment monitoring in the Manukau Harbour
Whenua
Land
The catchment of the Manukau Harbour is varied, ranging from steep forested ridgelines
along the northern coastline, to dense urban areas in the east, to flat and fertile plains in
the south. Wetlands that remain work to filter water as it travels to the sea and forests
provide carbon sinks and purify the air we breathe. These habitats provide many
ecological services and are supporting systems for various plants, reptiles, insects, and
marine and terrestrial birds.
The Manukau Harbour plays a significant role for endemic and migratory shorebirds.
Upwards of 30,000 birds use the exposed mud and sand flats daily to feed, while open
green spaces near the coast and actively managed shell banks provide important roosting
areas.
Soil forms the foundation of our terrestrial ecosystems. It provides us with food, timber and
fibre, filters water and sustains plant and animal health. South Auckland has some of the
region’s most productive aquifers and prime soils, making this an important horticultural
and agricultural area. Its high fertility produces grass for grazing animals, kai for our tables,
and its productivity is regionally and nationally important.
The Manukau catchment includes many sites that are of cultural significance to mana
whenua. These are places of connection, to be treasured for their defining features,
history, and in some instances, unparalleled archaeological examples of early settlement,
agriculture, and fortification. The harbour’s coastal fringe is also an important recreational
resource. Numerous walking and biking tracks, spectacular vistas, and regional and local
parks are utilised daily by locals and visitors alike.
Human activities can put considerable pressure on land resources. Historically, loss of
natural habitat has been substantial in the catchment surrounding the Manukau. Native
forests and wetlands have been removed to make way for exotic grassland and urban
settlements, and remaining pockets of vegetation are under pressure from invasive plant
and animal pests. Major land reclamations in the Māngere Inlet to accommodate railway
yards, and on the harbour’s eastern shoreline to accommodate the Auckland International
Airport, have further altered the natural state of the harbour. Areas with high industrial use
have emitted pollutants that affect both the land and waterways, while excessive use of
fertiliser and compaction of soils in the south of the catchment has impacted horticultural
and pastoral land along with the groundwater beneath it.
The health of our land impacts us economically and ecologically. Our farming, forestry and
horticulture rely on the resources and services provided by functioning natural systems.
Climate change will bring new challenges and impacts for our whenua. Healthy, biodiverse
ecosystems provide both stability and resilience to climate driven changes in our natural
environment and will become increasingly important as we work to mitigate and adapt to
these changes.
7A synthesis of State of the Environment monitoring in the Manukau Harbour
What we monitor Why we monitor Where and when we monitor
Describes the types of Landcover or how we use our land influences Landcover is measured using the New Zealand Land Cover Database (LCDB). The
vegetation and built or natural many of our environmental outcomes, e.g., LCDB is a multi-temporal, thematic classification of New Zealand's landcover that
Landcover features that cover the land’s extent of habitat for native species, land stability has been mapped using satellite imagery. It identifies 33 mainland landcover
surface. and the movement of water through the classes. Twenty-nine land covers can be found in the Auckland region. To date there
landscape. are five timestamps between 1996 and 2018.
Composition and abundance of Native birds are a valued part of our indigenous Native and introduced birds are measured using three 10-minute bird counts at each
native and introduced birds fauna that are threatened by pest animals and permanent forest and wetland plot. There are 37 forest plots and 31 wetland plots
Birds seen and heard in forest, scrub, deforestation. They provide many ecosystem within the Manukau Harbour catchment that are monitored every 5 to 10 years since
shrubland and wetland habitat. services including pollination and seed dispersal. 2009 (forest) and 2010 (wetland). Forest sites are visited in November-December,
wetland plots in February-April.
Pest animals – mice, rats, and Pest animals threaten native species and their Rats, mice and possum populations are monitored using chew cards. Peanut butter
possums. ecosystems. We need to understand where they filled cards are fixed to trees and left overnight, attracting mammals that leave
Pest animals are and how their presence changes over time. behind distinctive bite marks. These pests have been monitored at 30 of the 37
forest plots within the Manukau Harbour catchment. Pest animal monitoring was
conducted for five years between 2010 and 2014.
Composition, size and Provides a measure of the ecological integrity of Native and pest plants are measured in standardised ways in permanent 20m x 20m
abundance of native plants in a habitat plot. forest plots. There are 37 plots within the Manukau Harbour catchment that have
Native plants
forest, scrub, shrubland and been monitored every 5 to 10 years since 2009. Forest sites are visited in
wetland habitat. November-December.
Composition, size and Provides a measure of the dominance of pest
abundance of pest plant (weed) plant species which can impact the quality and
Pest plants species in forest, scrub, condition of native habitats. Weeds can out-
shrubland and wetland habitat. compete native species and affect the provision
of food for birds.
Soil quality – pH, total carbon, Healthy soil provides nutritious food, effectively Topsoil quality (0-10cm depth) is monitored periodically using physical, chemical and
total nitrogen, Olsen P, filters water, accommodates beneficial bugs and biological soil health indicators on different land uses occupying representative soil
anaerobically mineralisable absorbs greenhouse gases. Poor soil quality can types. These include horticulture, pasture, native and urban land uses. Sample
nitrogen, bulk density and lead to increased nutrients and sediment collection is generally conducted during the spring of each sampling year. Since
macroporosity. entering our waterways and decreased 1995, three samplings on each soil quality monitoring site have been performed
Soil production. during the periods 1995-2000, 2008-2012 and 2013-2017.
Soil trace elements – including Although trace elements are naturally occurring
arsenic, cadmium, chromium, in soils, as a result of human activity higher
copper, mercury, nickel, lead concentrations accumulate over time and can
and zinc. have serious health and environmental effects.
8A synthesis of State of the Environment monitoring in the Manukau Harbour
Uwhiuwhi Whenua
Landcover
Landcover is an important determinant of the health of the environment across the region.
The latest version of the Land Cover Database (LCDB), version 5, contains landcover data
from late 2018. Version 5 also describes each landcover type over time across several
time steps; 1996/97, 2001/02, 2008/09, 2012/13, and 2018/19, which enables us to look at
spatial distribution and changes over time.
We have used the surface water catchment for the entire Manukau Harbour to define the
catchment boundary. Catchments comprise the area of land in which streams and rainfall
drain to a particular body of water. It’s important to note, that a small portion of catchment
area (3 per cent, 2400ha) extends into the Waikato region. The monitoring network is
limited to the Auckland region, however landcover for the Waikato portion of the catchment
is reported here, to get a complete picture of catchment land use influencing the harbour.
2018 landcover (29 LCDB v5 classes found in the Manukau Harbour catchment grouped into the 11
classes used by Land Air Water Aotearoa (LAWA))
9A synthesis of State of the Environment monitoring in the Manukau Harbour
A map of the broad land cover types in the Manukau Harbour catchment shows the wide
variations in land cover composition. Well over half of the cover is exotic grassland
associated with sheep and beef or dairy farming, and nine per cent is characterised by
cropping and horticulture. Only 12 per cent is covered by mature indigenous forest or
indigenous scrub/shrubland that is regenerating towards mature forest. This is highly
concentrated in the Waitākere ranges, the western edge of the Hunua ranges, and
fragments along the Āwhitu peninsula. Urban area makes up 16 per cent of the catchment,
with the remainder being various other landcover types.
Other Artificial bare
Water Cropping/horti
herbaceous
bodies, 0% surfaces, 1% culture, 9%
vegetation, 0%
Natural Exotic Forest,
bare/lightly- 2%
vegetated
surfaces, 0% Urban area,
16%
Indigenous Indigenous
scrub/shrubla forest, 12%
nd, 2%
Exotic
grassland, 57%
Exotic
scrub/shrubla
nd, 1%
2018 Manukau Harbour catchment landcover (29 LCDB v5 classes found in the catchment grouped
into the 11 classes used by Land Air Water Aotearoa (LAWA))
The Manukau Harbour catchment landcover area in each class has been relatively stable
over the last 22 years. Over time, the area of exotic grassland has generally decreased,
while still maintaining its dominance across the landscape. The urban area, particularly in
areas such as Puhinui, Papakura and Pukekohe, has increased with expansion on the
fringes and in rural settlements. The total area of indigenous vegetation (forest and
scrub/shrubland) has been relatively stable, while the area of exotic forest has fluctuated
(with afforestation/deforestation cycles) and has been trending down in more recent
landcover estimates.
10A synthesis of State of the Environment monitoring in the Manukau Harbour
There has been little relative change in the proportion of different landcover since 1996,
but absolute (net) change is significant for some types. Between 1996 and 2018 there
were significant losses in area of exotic grassland, resulting in a net loss of over 2500ha
(or five per cent). Exotic grassland losses (-2954ha) over this period are largely made up
of conversion to urban area, exotic forest and cropping/horticulture. Whereas the gains in
area of exotic grassland (+288ha) are made up of conversions from exotic forest landcover
classes. While conversion from a rural landcover class such as exotic grassland to urban
area is generally permanent, the conversion between rural landcover types reflects the
cyclical nature of rural land management practices, and the wide range of activities found
in rural landscapes.
Landcover class Losses (ha) Gains (ha) Net change (%)
Artificial bare surfaces -49 182 133 (21%)
Cropping/horticulture -267 650 383 (5%)
Exotic Forest -195 330 135 (8%)
Exotic grassland -2,954 288 -2,667 (-5%)
Exotic scrub/shrubland -63 69 6 (1%)
Indigenous forest -78 64 -14 (0.1%)
Indigenous scrub/shrubland -31 28 -3 (0.2%)
Natural bare/lightly vegetated -0 5 5 (11%)
Other herbaceous vegetation -1 11 10 (9%)
Urban area -7 2,073 2,065 (16%)
Water bodies -83 30 -53 (-11%)
Manukau Harbour catchment showing landcover change between 1996 and 2018
In addition to landcover described above, we also utilise datasets describing natural (pre-
human) and current ecosystems of the Auckland region. ‘Natural’ being the predicted
cover of native ecosystems as they would occur in today’s environment in the absence of
humans, and ‘current’ being the cover of native ecosystems as they occur today. The
maps below show the pre-human and current distribution of indigenous cliff, coastal saline,
wetland and forest indigenous ecosystems in the Manukau Harbour catchment.
11A synthesis of State of the Environment monitoring in the Manukau Harbour
Manukau Harbour catchment showing pre-human (left) and current (right) indigenous cliff,
coastal saline, wetland and forest ecosystems
On the boundary between land and sea, the Manukau Harbour catchment contains a
number of cliff and coastal saline ecosystems. Pōhutukawa and hebe dominated cliff
ecosystems have been reduced to 12 per cent of their original extent. The extent of
mangrove forest and scrub has reduced since pre-human times, but this is one of the few
indigenous ecosystems to have increased in extent more recently, as sedimentation
resulting from land clearance provides an ideal substrate for mangroves in muddy intertidal
flats around the harbour. Wetland habitats are the most severely reduced ecosystem type
in the Manukau Harbour catchment, with only four per cent of their original extent
remaining.
12A synthesis of State of the Environment monitoring in the Manukau Harbour
In the absence of humans, the Manukau Harbour catchment would have been covered by
forest, with kauri, podocarp, pūriri, taraire and tawa all common forest dominants. This
forest cover has been severely reduced, with only nine per cent of the original extent
remaining; a third of which has been degraded or disturbed to such a degree that it is now
classed as regenerating forest that did not occur in pre-human times. The Waitākere
Ranges contain the most forested part of the Manukau Harbour catchment, with 63 per
cent of its original extent remaining, mostly in kauri, podocarp and broadleaf forest. The
large continuous block of forest in the Waitākere Ranges provides many benefits to
biodiversity as well as valuable ecosystem services to Aucklanders, including potable
water, cleaner air, carbon sequestration, regulation of water, recreation and wellbeing.
Greatest deforestation has occurred in the south and east of the catchment, where less
than one per cent of the original forest extent remain. Across the catchment there are
some rare fragments of tawa, taraire, tōtara, pūriri or kahikatea dominated forests, but
these are small and highly fragmented patches surrounded by urban or rural landcover,
which impacts forest ecological integrity. The scale of deforestation will have considerable
impact on soil erosion and sedimentation processes, surface water flow and flooding risk,
and water infiltration and aquifer recharge.
Āwhitu Regional Park
13A synthesis of State of the Environment monitoring in the Manukau Harbour
Ngahere me ngā Manu
Forest and Birds
Deforestation, forest fragmentation and highly modified surrounding land-use impacts the
ecological integrity of forests. As forest patches become smaller and more isolated, they
are less able to provide the conditions and resources necessary for indigenous forest
species to persist and are less likely to be recolonised by forest species when they go
locally extinct. Smaller forest patches have a greater edge to area ratio, and edge effects
can be detrimental to forest communities, although these transition zones can also be
highly diverse. Adjacent land uses including rural and urban development vary in their
ability to provide resources, support movement of native species between forest patches
or expose forest patches to further pressures. Forests that are disturbed, fragmented, and
exposed to human activity become both more exposed and more susceptible to weeds,
pests and pathogens. Adjacent land use will also vary in the extent to which it supports
reservoirs of weed, pest, and pathogen species that can colonise indigenous habitat
patches.
The Manukau Harbour catchment
has 37 permanent forest plots that
have been monitored every five to
10 years since 2009 to assess
regional forest ecological integrity.
For this report, data from the forest
plots are aggregated by the five
ecological districts (ED)
overlapping the Manukau Harbour
catchment, Waitākere, Tāmaki,
Hunua, Manukau and Āwhitu.
Ecological districts were defined by
the Department of Conservation as
an area with a characteristic
topography, geology, climate, soil,
vegetation and human induced
modification. At each forest plot,
measurements of vegetation, birds
The Manukau Harbour catchment ecological districts and and pest animals are based on a
forest and wetland monitoring sites national protocol that aims to
capture as complete a snapshot of
the forest structure, composition and life stages as is feasible.
14A synthesis of State of the Environment monitoring in the Manukau Harbour
The nine plots in the Waitākere ED are predominately in kauri, podocarp, broadleaved
forest and had the highest species richness (i.e., the highest number of different species)
of native vegetation including trees and non-woody understorey species, and the lowest
proportion of plant species that are weeds. This results in large part from the large patch
size and connectivity of this forest. Other forest ecosystem types represented in the plot
network include taraire, tawa, podocarp forest (6 plots), tōtara, kānuka, broadleaved forest
(5 plots), pūriri forest (2 plots), kahikatea, pukatea forest (2 plots) and a number of
regenerating forest types (6 plots). These forest types are typical of lowland areas and
most have been severely reduced in extent from conversion to farming and urban
development. Outside the Waitākere ED there were clear patterns of lower native plant
species richness and higher proportions of plant species that are weeds, especially in
Tāmaki ED and Manukau ED. The abundance of weeds is often driven by proximity to
human activity, and forest patches in both ecological districts are small and surrounded by
urban and rural land use.
Native species richness and per cent of species that are weeds in the five ecological districts within
the Manukau Harbour catchment
The most common tree/shrub weeds in the Manukau Harbour catchment were tree privet,
species of eucalyptus, acacia and pine, prickly hakea and woolly nightshade. The most
prolific non-woody understorey weeds in the Manukau Harbour catchment were wandering
willie, inkweed, cocksfoot, cleavers, cotton thistle and sweet vernal grass.
Pest animal monitoring occurred at 30 of the 37 forest plots and these data are best
aggregated at the catchment scale. Possum were detected in 18 of the 30 plots, and rats
and mice detected in 25 of the 30 plots, emphasising how widespread and abundant these
pest animals are. Possum were detected most frequently in Āwhitu, Waitākere and
Manukau EDs; rat and mice were detected most frequently in Tāmaki, Āwhitu and
Waitākere Eds. Previous reporting has shown that on the mainland, pest animals are only
absent where they are controlled.
15A synthesis of State of the Environment monitoring in the Manukau Harbour
Forest bird counts for the Manukau Harbour catchment showed that 54 per cent of bird
species recorded in forest plots were native species, similar to the regional average of 52
per cent. The most common native species were tūī, tauhou (silvereye), riririro (grey
warbler), pīwakawaka (New Zealand fantail) and kōtare (sacred kingfisher). The most
common introduced species were Eurasian blackbird, common myna, chaffinch, Eastern
rosella and song thrush. Native bird species richness (6-7 species) and abundance (24-35
individuals) was similar across the ecological districts despite large differences in forest
cover, ecosystem type and ecological integrity. Previous reporting has shown that native
bird communities in the Auckland region are largely determined by pest control and
respond best to pest animal eradication strategies. This is because even occasional pest
incursions can do considerable damage to native bird populations. In contrast, introduced
bird species richness and abundance was lower in Waitākere and Hunua ED and higher in
Tāmaki, Manukau and Āwhitu EDs. Previous reporting has shown that introduced bird
communities are more abundant in areas with less indigenous forest.
We also conducted bird counts at wetland sites in the Manukau Harbour catchment, where
31 permanent plots have been monitored every five to 10 years since 2010. The bird
counts showed that 44 per cent of all birds counted were native species. The most
common native birds were tauhou (silvereye), tūī, pūkeko, riririro (grey warbler),
pīwakawaka (New Zealand fantail) and warou (welcome swallow). The most common
introduced birds were common myna, European goldfinch, house sparrow, Eurasian
blackbird and Australian magpie. Three EDs (Tāmaki, Manukau, Āwhitu) had enough
wetland plots (>4) to be compared, revealing higher abundance of native birds in the
Tāmaki and Āwhitu EDs compared to Manukau, which had slightly higher abundance of
introduced birds.
16
Tūī in harakekeA synthesis of State of the Environment monitoring in the Manukau Harbour
Ngā manu takutai me ngā manu moana / Shorebirds and seabirds
Long-term shorebird monitoring by the Ornithological Society of New Zealand / Birds New
Zealand has revealed the Manukau Harbour to be one of the most important shorebird areas in
Aotearoa. The harbour supports a variety of species, which rely on the habitat for feeding and
roost sites. One of the unique advantages of this area is its proximity to eastern coastal waters,
namely the productive Firth of Thames. Shorebirds are known to move from the Manukau to
the Firth of Thames and back using two major flyways, allowing the birds to follow the low tides
when most feeding occurs. The harbour has international significance, being part of the East
Asia-Australasian Flyway, where migrant birds fly from as far as Alaska or Russia to the
Manukau Harbour to replenish, before returning to breed in the Northern Hemisphere.
Key New Zealand breeding shorebirds that use the Manukau Harbour:
• Tūturiwhatu (Dotterels): There are small numbers of the ‘at risk’ northern New Zealand
dotterel and the endemic ‘threatened’ banded dotterel, the latter of which are around in
the 100s in the winter. Tūturiwhatu in general have been recovering thanks to the great
community interest and management efforts from community organisations such as the
NZ Dotterel Minders network.
• Tōrea (Oystercatchers): Large numbers (1000s) of tōrea (South Island pied
oystercatcher) and tōrea pango (variable oystercatcher) use the area. Both are ‘at risk’
species which benefit from feeding during the low tide after which they tend to remain
through the high tide at roost sites until the low tide returns.
• Stilts: Large numbers (1000s over the winter) of poaka (pied stilt) are found in the
Manukau Harbour as well as small numbers of the very rare kaki (black stilt) which is
‘critically endangered’ in New Zealand.
• Ngutuparore (Wrybill): Approximately 90 per cent of this endemic ‘threated’ species total
population can be found in the Manukau Harbour and Firth of Thames in the winter.
Key migrant shorebirds that use the Manukau Harbour:
• Kuaka (Bar-tailed godwit): These ‘at risk’ birds make an eight to nine day non-stop
migration from their breeding sites in Alaska in September to summer in New Zealand.
The largest number (~13,500) use the Manukau Harbour to refuel for their return flight
from March.
• Kuriri (Pacific golden plover): Small numbers of plovers migrate from their breeding sites
in the Arctic tundra of Siberia and Alaska to New Zealand, with usually ~14 summering
in the Manukau Harbour.
• Huahou (Lesser knot): Large numbers (1000s) of this ‘threatened’ species use the
Manukau Harbour in the summer to refuel and prepare for migrating back to their
breeding sites in Russia. About 10 per cent of the population remain in New Zealand,
including ~950 in the Manukau Harbour.
• Ruddy turnstone: A few hundred turnstone spend summer in the Manukau Harbour
before migrating back to their Siberian breeding areas, which includes a refuelling stop
on the shores of the Yellow Sea, a stop that is becoming more difficult to use due to
habitat loss from reclamation and coastal development. A small proportion remain in17the
Manukau over the winter.A synthesis of State of the Environment monitoring in the Manukau Harbour
Ngā manu takutai me ngā manu moana / Shorebirds and seabirds
Several of our most threatened birds, the seabirds, breed and/or use the Manukau Harbour
and nearby coastal Waitākere areas. This includes one of New Zealand’s most important
mainland seabird breeding sites at Te Henga/Bethells Beach, where quite uniquely, five
burrowing seabirds breed – four of which are ‘at risk’ (^) or ‘threatened’ (*): kuaka (common
diving petrel^), ōi (grey-faced petrel), toanui (flesh-footed shearwater*), kororā (little
penguin^), and titi (sooty shearwater^). There are large numbers of ōi (grey-faced petrel)
along the Waitākere northern coastline, with significant breeding colonies at Muriwai, Te
Henga, Piha, Karekare and Whatipu.
More recently, the discovery of ōi (grey-faced petrel) breeding on Cornwallis Peninsula, has
further identified the Manukau Harbour coastline as an important mainland seabird breeding
area. Kororā (Little penguin) are also known to use the harbour for foraging, with known
breeding sites at Whatipu. Other important seabirds in the general area include the ‘at risk’
tara (white-fronted tern), which have significant breeding colonies along the northern
Waitākere coast, and the world’s largest tern, the ‘threatened’ taranui (Caspian tern).
Shorebird and Seabird Monitoring, Conservation and Restoration
There are a variety of pressures on coastal birds in the Manukau Harbour area. Many species
are killed by introduced predators (especially rats, stoats, ferrets, and cats), as well as from
stray dogs. However, progress is being made thanks to both council-based and community-
based pest management programmes in the area, such as the Cornwallis Petrelheads, who
service substantial trap-lines across the peninsula. Habitat destruction is another common
threat to coastal birds, with the greatest effects from the inner Manukau Harbour and southern
areas where the most development and land use changes have occurred. Pollution is also a
potential threat, with a recent surge of international and local studies looking into the effects of
plastics and other contaminants on coastal birds. Auckland Council is currently developing a
regional Seabird and Shorebird Monitoring and Research Programme, which launched in late
2018 (beginning with a focus on seabirds). The programme will help fill in the population and
restoration knowledge gaps, which will be used to develop and implement management
actions to improve the state of seabirds and shorebirds. Included is a new contaminants
programme that will investigate pollution-effects on birds across the region.
18
Ōi (grey-faced petrel)A synthesis of State of the Environment monitoring in the Manukau Harbour
Oneone
Soil
Healthy soils are important for good yields and sustained food and forest production. Soils
store carbon, nutrients and water, and manage the fate of water as it enters the ground,
moves below the root zone of plants and across the landscape. Monitoring soil quality
provides a link between nutrient and contaminant sources and land management
practices. It is a useful tool for informing policies to improve land management and
associated water quality. Excessive fertiliser application and over stocking pastures or
applying intensive cultivation practices reduces soil health. This negatively impacts water
quality through leaching of contaminants and loss of nutrients from erosion or run-off, while
compacted soils result in reduced plant growth.
The 32 soil quality monitoring sites in the Manukau Harbour catchment cover the following
land use categories: horticulture (12), pasture (9), urban (5) and native vegetation (6).
Monitoring showed that some soil quality indicators fell outside the recommended
guideline ranges. Olsen P concentration, an indicator of plant-available phosphorus, was
high on horticulture sites. This shows that more phosphorus fertiliser is being applied than
is being utilised by crops.
Total carbon, total nitrogen and anaerobically mineralisable nitrogen were low on outdoor
vegetable production sites. Soil macroporosity (a measure of cavities in soil that provide
air supply to roots) was low on pasture sites indicating soil compaction. This reduces soil
quality and productivity and increases surface run-off of nutrients and suspended
sediments that can enter our waterways.
Trace elements occur naturally in soils and vary depending on soil type, geology and
climate. Different land use activities add trace elements to the soil that tend to accumulate
over time. Pasture and horticulture sites had the highest mean concentrations of cadmium
and arsenic. On the other hand, urban and horticulture sites had the highest mean
concentrations of copper. Urban sites had the highest concentrations of chromium, nickel
and zinc. Mean concentrations of trace elements at monitored sites are mostly within
guideline ranges.
19A synthesis of State of the Environment monitoring in the Manukau Harbour
Whakapā atu ki ngā ripoata hangarau mō ētahi atu taipitopito:
Refer to the following technical reports for further detail:
Climate change risk assessment for terrestrial species and ecosystems in the Auckland
region. TR2019/014.
Differences in soil quality and trace elements across land uses in Auckland and changes in
soil parameters from 1995-2017. TR2020/001.
Diversity, abundance and distribution of birds in Tāmaki Makaurau / Auckland 2009-2019.
State of the environment reporting. TR2021/08.
Ecological integrity of forests in Tāmaki Makaurau / Auckland 2009-2019. State of the
environment reporting.
Tōrea (oystercatcher), Manukau Harbour
20A synthesis of State of the Environment monitoring in the Manukau Harbour
Ngā Moana me ngā Wai Māori
Sea and Freshwater
Tāmaki Makaurau is a region strongly connected to water. It is one of our most important
resources, and the health of our harbours and estuaries is largely driven by the quality of
water that feeds into them, from rivers, rainfall, and groundwater. These diverse
components form part of a connected system, linking the land and sea. Healthy harbours
and estuaries contribute to cultural and social values and play important roles in climate
regulation, food production and nutrient and water cycling.
The Manukau Harbour is vast, covering around 365km2 with over 450km of shoreline. The
harbour is a relatively shallow basin with four main channels and three major inlets at
Waiuku, Pahurehure and Māngere. The upper reaches of these inlets form the interface
between fresh and salt water and tend to be muddier than the main body of the harbour,
accumulating fine sediment that runs off the land. Abundant communities of benthic
invertebrates in the body of the harbour provide a food source for fish, while the creeks,
inlets, and subtidal vegetation act as nursery habitats for various species. Just over 60 per
cent of the harbour is intertidal. This large tidal movement is the dominant hydrodynamic
process in the Manukau, and the huge volume of regularly mixed water has benefited the
harbour, flushing through channels and helping to remove pollutants.
The Manukau Harbour has always drawn people to its shores. Historically, the coastline
contained important portages to the Waikato River and Tāmaki Estuary, numerous
settlements and pā, and abundant snapper, mullet, flounder, and shellfish provided a
valuable food source for early Māori. Over time, with the development and growth of
Tāmaki Makaurau, pollutants and pressures have had both acute and cumulative impacts
on the health and quality of the harbour. In some areas, this has compromised our ability
to swim, collect seafood and interact with nature.
The marine receiving environment is impacted by high levels of nutrients and sediment.
This is the result of a range of current and historical land use activities, the effects of which
can be seen in monitoring data today. Industries such as phosphate fertiliser works, meat
works and tanneries, have at times discharged waste directly into the harbour. Today, an
important discharge to the Manukau Harbour is the Māngere Wastewater Treatment Plant.
Located on the north-eastern shore of the harbour, it is the largest treatment facility in New
Zealand, discharging over 300 million litres of treated wastewater daily. The treatment
plant underwent major upgrades in the early 2000s, and 500 hectares of open-air oxidation
ponds were replaced with land-based treatment. Further upgrades to increase capacity
and improve nutrient removal were completed in 2018, and treatment now includes
screening to remove solids, biological processes to remove phosphorous and nitrogen,
and ultraviolet light to remove pathogens and bacteria.
21A synthesis of State of the Environment monitoring in the Manukau Harbour
The streams that drain into the Manukau Harbour are relatively small, and their
catchments have been heavily impacted by human activity. The water flowing through
many of them often carries pollutants, and many of their natural functions have been
modified or impaired, reducing their ability to sustain and support diverse biological
communities. Fertiliser application on prime food producing land in Franklin has resulted in
high concentrations of nitrate in shallow volcanic aquifers which then feed surface water
streams that drain to the coast.
River water quality assessment in this report refers to the National Policy Statement for
Freshwater Management 2020 (NPS-FM). The NPS-FM sets out principles for the
management of freshwater in New Zealand and a National Objectives Framework (NOF)
which includes compulsory values, and associated attributes which must be measured to
express how we are maintaining these values. NOF attribute bands describe the current
state of river water quality and ecology where A is the best, and D or E is the worst.
For the regional water quantity and quality state and trends reports, data was examined
from 2010-2019 as a common time period across the regional monitoring programmes.
For this report, additional analysis back to 1990 (1994 for river quality) was conducted,
enabling a longer time period over which the water quantity and quality trends story can be
told.
Cape Horn, Manukau Harbour
22A synthesis of State of the Environment monitoring in the Manukau Harbour
What we monitor Why we monitor Where and when we monitor
Rain gauge network Rainfall is the fundamental part of the water cycle. Seventeen sites covering north, east, and southern locations,
Rainfall measurements inform water allocation, flood ranging from upland areas of the Waitākere Ranges to lowland
Rainfall modelling, flood response, and the design of agricultural areas of the Franklin Ward. Rainfall sites record
infrastructure, including stormwater networks and rainfall in real-time at 0.5mm increments with data telemetry
irrigation systems. direct to Auckland Council’s database.
River water quantity River flow data informs the analysis of water quantity The Puhinui, Papakura, Ngakoroa and Waitangi streams are
state and trend, and the calculation of nutrient loads in monitored for water level and flow rate. This information is
rivers. Understanding river flow regimes aids in water continuously monitored, with measurements sent to Auckland
management to ensure healthy ecosystems and Council’s database every 15 minutes.
ongoing water supply in summer months or under
drought conditions.
River water quality Physical, chemical and biological water quality Water quality is monitored at Puhinui, Papakura, Whangamaire
parameters are a core component that contribute to Ngakoroa and Waitangi streams. Monitoring is undertaken
Rivers/Streams freshwater ecosystem health. We measure parameters monthly with some measurements taken in the field, and others
such as temperature, dissolved oxygen, nutrients, assessed from samples sent to the laboratory.
suspended sediments, and metals. This helps us
understand natural variability in our rivers and the
impacts our activities have on them.
River ecology Ecological parameters provide a good indication of Eight sites in a mix of urban and rural catchments are monitored.
overall stream health and function. Healthy streams are Macroinvertebrate communities are sampled annually, and
able to function more naturally, allowing them to Stream Ecological Valuations are undertaken every two years.
support diverse communities of plants, invertebrates
and fish.
23A synthesis of State of the Environment monitoring in the Manukau Harbour
What we monitor Why we monitor Where and when we monitor
Groundwater quantity Groundwater level monitoring is key to understanding We monitor 28 groundwater wells in 15 different aquifers, using
the underground movement of water; its relationship to both monthly manual measurements and automatic
rainfall infiltration, baseflow discharge to streams, and measurements at 15-min intervals.
interactions between layered aquifers. This information
Groundwater helps determine sustainable limits for long-term water
use.
Groundwater quality Activities on land affect the quality of water that Groundwater quality is monitored in six wells and three springs.
infiltrates into aquifers. Groundwater quality data New sites were added in 2021.
support management efforts for both water and land.
Coastal water quality The health of coastal waters are influenced by the Water quality is monitored at eight sites across the harbour.
quality of water that runs from the land through Sampling is undertaken monthly, on the outgoing tide, in coastal
streams to our estuaries and harbours. We measure areas along the main channels within the harbour. Sites are
physical parameters such as temperature, salinity, adjacent to Māngere Bridge, Shag Point, Puketutu Point,
dissolved oxygen, nutrients, and suspended Weymouth, Waiuku Town Basin, Clarks Beach, Grahams
sediments. Water quality for recreational activities and Beach, and at the Manukau Heads.
human health is monitored separately through the
Safeswim programme.
Contaminants in coastal Contaminants from the land enter rivers and streams Twenty-seven sites around the intertidal coastal fringe of the
Coastal sediment and attach to fine sediments that settle and harbour are sampled either every two or five years. These sites
accumulate in sheltered coastal areas. These are also sampled for benthic ecology at the same intervals.
contaminants can be toxic to marine organisms living
on and in the sediment.
Intertidal benthic ecology The numbers and types of animals found in intertidal Monitored at six sites across the Harbour. The frequency of
environments in our harbours and estuaries are a good monitoring is on a rotating cycle. Currently two sites (Auckland
indication of the health of these ecosystems. Airport and Clarks Beach) are monitored three times per year,
and four sites (Cape Horn, Karaka Point, Puhinui Stream and
Elletts Beach) are monitored annually.
24A synthesis of State of the Environment monitoring in the Manukau Harbour
Mātai arowai
Hydrology
Monitoring the movement and distribution of water in our region informs our management
of this essential resource. Rainfall, river flow, groundwater level and groundwater quality
are all monitored in the Manukau Harbour catchment.
Rainfall is measured at 17 sites in the catchment, eight of which have records that exceed
20 years. Our rainfall sites cover a wide range of microclimates, including the Waitākere
Ranges, the lowland Auckland Isthmus, and the Pukekohe horticultural center. Rainfall
data analysed for this report was presented as total annual rainfall. This highlights wet and
dry years by comparing to long-term averages. There were several recent years (2011,
2017 and 2018) that exceeded the average annual rainfall by more than 20 per cent.
Flow is monitored in four streams in the wider Manukau Harbour catchment. The Puhinui
and Papakura Streams are located in urbanised eastern catchments and the Ngakoroa
and Waitangi Streams are in the rural Franklin area to the south. Trend analyses for low
flow magnitude (represented by the annual 7-day low flow) and high flow frequency
(represented by the number of times that flow exceeded 3-times the median flow) were
completed for the period 1990-2019, inclusive.
The results showed an increasing trend for low flows in the Puhinui Stream, i.e., more
water in the stream during low flow periods, however the amount of the increase was very
small (less than flow gauging accuracy). The Waitangi Stream had a decreasing trend in
low flows, but the amount of the decrease was also very small. The trends for the
Papakura and Ngakoroa Streams were indeterminate (no clear trend toward increasing or
decreasing low flows). The high flow analysis (the number of high flow events per year)
showed an increasing trend for the Puhinui, Papakura, and Ngakoroa Streams, but the
increases were small. The Waitangi Stream had an indeterminate trend in high flow
frequency.
Groundwater level is monitored in 23 wells across the Manukau Harbour catchment.
These wells tap several important aquifers that were formed by the complex geological
history of Tāmaki Makaurau. Many of the aquifers are layered on top of each other as a
result of depositional and erosional processes, and each have unique physical and
geochemical characteristics. Multiple monitoring wells in the same location but at different
depths are therefore necessary to understand the changes in water levels for these
different aquifer layers.
The Waitākere Ranges is not a significant source for groundwater because the rock
formations typically do not yield a useable amount of water, therefore no monitoring wells
25A synthesis of State of the Environment monitoring in the Manukau Harbour
are located here. Most of the groundwater resources with a hydraulic connection to the
Manukau Harbour are located on the Auckland Isthmus and to the south in the Franklin
area, so monitoring is concentrated in these areas. Groundwater levels are highly variable,
depending on factors such as geology, depth, degree of connection to surface recharge,
and water use pressures. Groundwater levels were analysed for the period 1998 to 2020
including mean monthly level, the annual minimum level, and the annual maximum level.
Most sites showed an increasing or decreasing trend in at least one of the three analyses.
The Onehunga volcanic, Manukau Kaawa, and Manukau Waitematā aquifers showed
increasing groundwater level
trends across all three metrics. The
Pukekohe and Bombay volcanic
aquifers showed predominantly
increasing trends in the monthly
and annual maximum analyses.
Kaawa aquifers in Franklin show
decreasing trends in the annual
minimum groundwater level, which
is affected by new groundwater
takes near the monitoring bores
leading to lower levels during the
summer irrigation period. However,
the same Kaawa aquifers have no
decreasing trends in annual
maximum. The general pattern of
increasing trends in groundwater
levels indicates sustainable
groundwater allocation.
Groundwater aquifers in the Manukau Harbour catchment
The Franklin Waitematā aquifers (Waiau Pa, Karaka, Drury) are the only aquifers in the
Franklin area that show decreasing trends across all three analyses. In many cases these
trends are opposite to those in adjacent Kaawa and volcanic aquifers. This indicates that
water use in these deep sandstone aquifers is a likely contributor to groundwater level
declines. It is important to note that in the slightly shorter time period of 2010-2020, no
declining trends were observed in Franklin Waitematā aquifers. The Waiau Pa Waitematā
aquifer had an increasing water level trend for 2010-2020 across all three analyses
(monthly, annual minimum, and annual maximum). There is not sufficient data on water
use to determine if this was a factor in the recent groundwater level increases in the Waiau
Pa Waitematā aquifer. Reliable water use data is a critical gap in the current groundwater
monitoring programme.
26You can also read