IOT CATALOGUE 2021 FOR REAL-TIME CONTINUOUS MONITORING OF: NATURAL, BUILT & AGRICULTURAL ENVIRONMENTS - ICT INTERNATIONAL
←
→
Page content transcription
If your browser does not render page correctly, please read the page content below
IoT Catalogue
2021
For Real-Time Continuous Monitoring of:
Natural, Built & Agricultural Environments
Contents

                           Soil Monitoring ������������������������������������������������������������������������������� 4
                              Soil Moisture & Water Use of Coffee in Vietnam ���������������������������������� 5
                              Soil Moisture: ADR and TDR ������������������������������������������������������������������ 6
                              Soil Moisture: TDT ��������������������������������������������������������������������������������� 8
                              Soil Moisture: Capacitance �������������������������������������������������������������������� 9
                              Smart Parks Irrigation Project ������������������������������������������������������������� 10
                              Soil Tension, Suction & Matric Potential ��������������������������������������������� 12
                              Soil Heat Flux & Temperature ������������������������������������������������������������� 14
                              Soil Oxygen ������������������������������������������������������������������������������������������� 15
                              Soil Nutrient Drainage Monitoring ������������������������������������������������������ 16

                           Plant Monitoring ������������������������������������������������������������������������� 18
                              Green Asset Management in Urban Environment ����������������������������� 19
                              Plant Monitoring: Returns on Investment ������������������������������������������� 20
                              Plant Water Relations: Sap Flow ��������������������������������������������������������� 22
                              Macadamia Sap Flow Monitoring & Irrigation Management������������ 23
                              Scientific Paper: New Zealand Kauri Trees Sharing Water������������������ 26
                              Plant Water Potential: Stem, Leaf and Root Psychrometry ��������������� 27
                              Plant Water Relations: Dendrometry �������������������������������������������������� 28
                              LoRaWAN Avocado Crop Monitoring �������������������������������������������������� 30
                              Plant Light Relations: PAR �������������������������������������������������������������������� 32
                              Plant Light Relations: Controlled Environments ��������������������������������� 33
                              Plant Light Relations: Canopy Light Interception ������������������������������� 34
                              Vegetation Indices & Disease Monitoring ������������������������������������������ 36
                              Infrared Canopy Temperature ������������������������������������������������������������� 38
                              Leaf & Bud Temperature ��������������������������������������������������������������������� 39
                              Weighing Scales For Plant Monitoring ������������������������������������������������ 40
                              Weighing Scales For Bee Hive Monitoring ������������������������������������������ 41
                              Further Custom SNiPs for Plant Irrigation Applications ��������������������� 42
                              Monitoring Plant Water Use in Urban Ornamental Nursery ������������� 43

                           Meteorological Monitoring �������������������������������������������������� 44
                              Rainfall Monitoring������������������������������������������������������������������������������� 45
                              Weather Stations ��������������������������������������������������������������������������������� 46
                              Customised Weather Stations ������������������������������������������������������������� 48
                              Fire Load & Fire Hazard Weather Stations ������������������������������������������ 49

2      ICT INTERNATIONAL       Soil 4-17 Plant 18-43 Meteorological 44-55 Hydrological 56-63 Urban & Industrial 64-69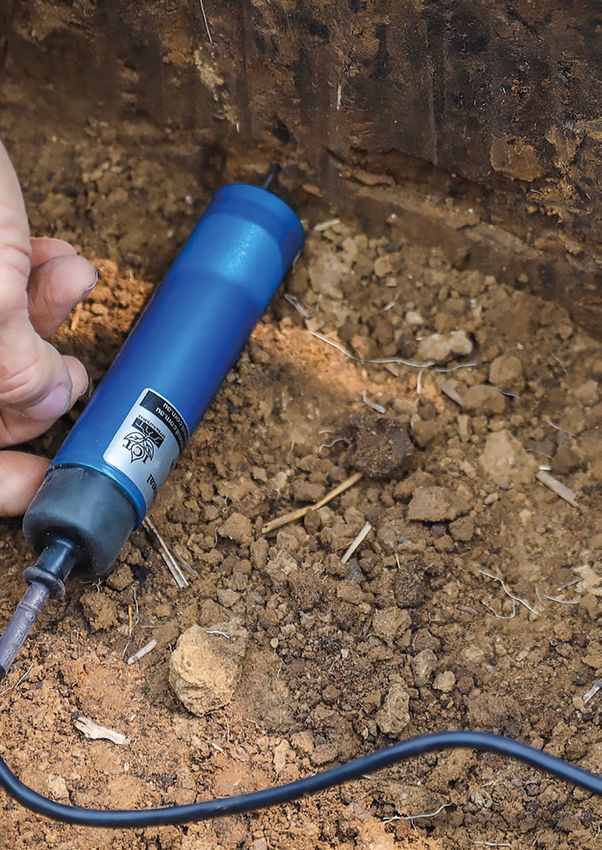
Microclimate Systems - Temperature ������������������������������������������������� 50
                                                Microclimate Temperature Profiling & Spray Drift������������������������������ 51
                                                Microclimate Systems - Temperature & Humidity ����������������������������� 52
                                                Light & Radiation System ��������������������������������������������������������������������� 54

                                             Hydrological Monitoring �������������������������������������������������������� 56
                                                Monitoring Water Quality in Aquaculture Systems ���������������������������� 57
                                                Water Quality Monitoring ������������������������������������������������������������������� 58
                                                Data Buoys ������������������������������������������������������������������������������������������� 59
                                                Water Level Monitoring ���������������������������������������������������������������������� 60
                                                Runoff Monitoring and Sampling �������������������������������������������������������� 62

                                             Urban & Industrial Monitoring ������������������������������������������ 64
                                                Air Quality Monitoring: Particle Size & Noise ������������������������������������� 65
                                                Air Quality Monitoring: CO2 & Oxygen������������������������������������������������ 66
                                                Urban/Industrial Temperature Monitoring ���������������������������������������� 67
                                                Examining Thermal Efficiency in Housing ������������������������������������������� 69

                                             Understanding IoT Sensing Networks ��������������������������� 70
                                                Sensor-Node IoT Packages (SNiPs) ������������������������������������������������������ 72
                                                Example SNiP Setups for Fruit Crop Applications ������������������������������� 73
                                                Understanding IoT Nodes �������������������������������������������������������������������� 74
                                                LoRaWAN Gateways: The Nexus 8 & Nexus Core ������������������������������� 80

                                             Our Capability Statement ������������������������������������������������������ 83

Enabling better global research outcomes in soil, plant & environmental monitoring                         ICT INTERNATIONAL                                 3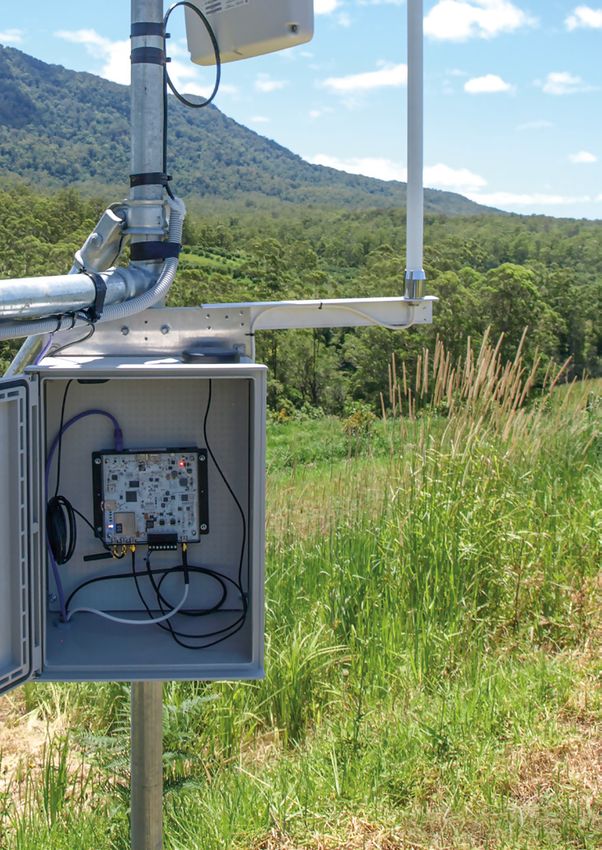
Soil Monitoring

    The moisture status of the soil is a critical factor influencing
    plant production. Correct irrigation scheduling can control
    the soil moisture status, reducing through-drainage and                   Open Format Data Compatible
    maintaining optimum levels of soil water for maximum                        with Flexible Connectivity
    plant growth.                                                                       (pg. 74-75)

    To implement a reliable and accurate irrigation scheduling
    regime regular, objective soil moisture readings are
    essential. There are different technologies available for
    obtaining soil moisture content including ADR, TDR,
    capacitance and neutron. The choice of instrumentation
    will be determined by the form of information required
    by the operator, the soil type, crop, relative cost, and the
    reliability and ease of use in the field.

    IoT (Internet of Things) technology increases the speed,
    consistency, and convenience of data collection and
    application management. ICT International's modular
    range of SNiPs (Sensor-Node IoT Packages) enable real-time
    accurate measurements for continuous soil monitoring.                                            ICT
                                                                                              MFR-NODE
    See pages 70-81 for more information.                                                         pg. 76

    SNiPs reduce the cost of getting a fuller picture on the
    application, replacing traditional loggers for each sensor or
    additional parameter.

                                                                       MP406 Soil Moisture
                                                                          Probes pg. 6

4           ICT INTERNATIONAL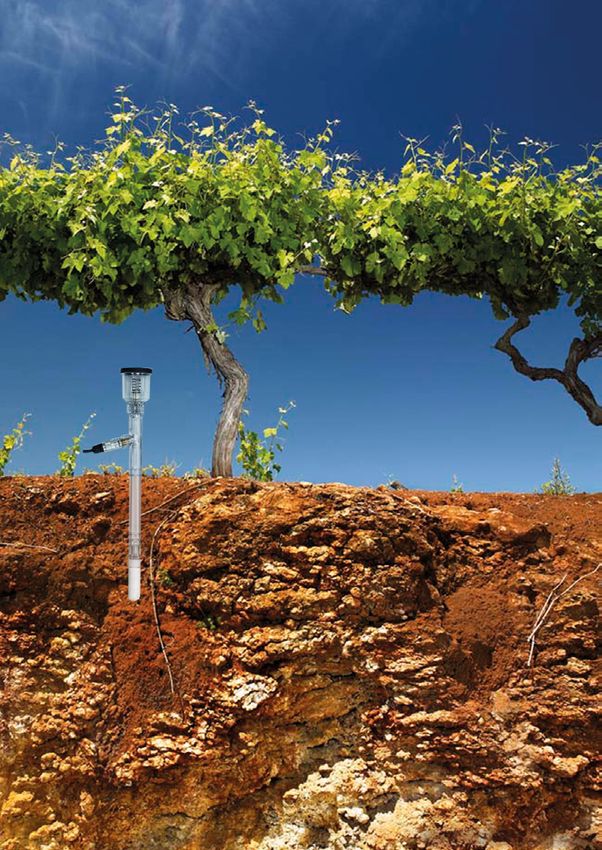
Soil Moisture & Water Use of Coffee in Vietnam
Project background                                                      Outcomes
In the highlands of Central Vietnam, vast areas of                      The ICT International Moisture Probe (MP406)
planted coffee rely heavily on seasonal rainfall.                       – designed for permanent installation/burying,
With changing climate, rainfall becomes more                            connected to ICT Soil Moisture Meter (SMM1), was
unpredictable, and necessitates the investment in                       used to monitor the soil moisture regime from the
optimum irrigation. In cooperation with the Western                     surface to a 45cm profile depth. This allowed for the
Highlands Agriculture and Forestry Science Institute                    calculation of infiltration rates.
(WASI) the soil moisture condition in 4 year-old
Robusta Coffee crop was monitored.                                      The investigation also monitored seasonal
                                                                        variability of tree water use which was found to
Monitoring and network solution                                         be reliant not only on soil moisture availability but
                                                                        also on seasonal sunshine duration. Rainy seasons
   • Soil moisture probes in the surface and at 3                       (between May and December) that bring more
     depths – 15, 30 and 45 cm                                          cloudy days resulted in a lower water usage of the
   • Sap flow meter on 4 year old trees                                 trees. Wet season water use was 3-4 Litres per tree
   • 4G Telemetry system                                                per day and in the Dry season it was 5-6 Litres per
   • ICT Dataview                                                       tree per day.

Enabling better global research outcomes in soil, plant & environmental monitoring           ICT INTERNATIONAL                  5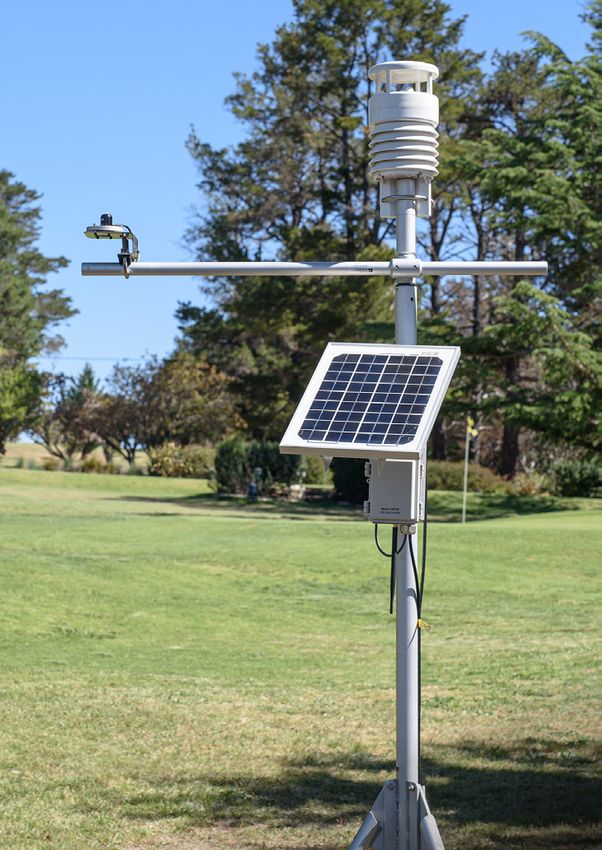
Soil Moisture: ADR and TDR

    The Standing Wave                                                 The Time Domain Reflectometry
    (ADR) Measurement Principle                                       (TDR) Measurement Principle
    Standing Wave, or Amplitude Domain Reflectometry                  Measures the time taken (in nanoseconds) for
    (ADR), uses an oscillator to generate an electromagnetic          an electromagnetic pulse to propagate along a
    wave at a consistent frequency, which is transmitted              waveguide surrounded by soil. Time of travel,
    through a central signal rod, using outer rods as an              or velocity, of this pulse is effected by the
    electrical shield. The electromagnetic wave is partially          dielectric constant (Ka) of the soil. Wetter soil
    reflected by areas of the medium with different dielectric        with a higher dielectric constant, produces a
    constants (water content), producing a measurable                 slower velocity pulse. TDR measures volumetric
    voltage standing wave. ADR measures volumetric soil               soil water (VSW%) independently of all other
    water (VSW%) independently of all other soil variables,           soil variables, including density, texture,
    including density, texture, temperature and electrical            temperature and electrical conductivity.
    conductivity. ADR does not require in-situ calibration            TDR does not require in-situ calibration to
    to accurately measure Volumetric Soil Water (VSW%).               accurately measure VSW%.

    Environmental, agriculture & engineering applications
    requiring assessment of the changes of soil moisture in
    absolute mm and the exact volumetric soil moisture
    use ADR or TDR technologies. ADR sensors that have
    been buried permanently in landfills are still functioning
    after 15+ years.

                                                                                            ICT
                                                                                     MFR-NODE
                                                                                         pg. 76

                                                                                                    MP406 Soil Moisture Probe
                                                                                                            pg. 4-6

6          ICT INTERNATIONAL               Soil 4-17 Plant 18-43 Meteorological 44-55 Hydrological 56-63 Urban & Industrial 64-69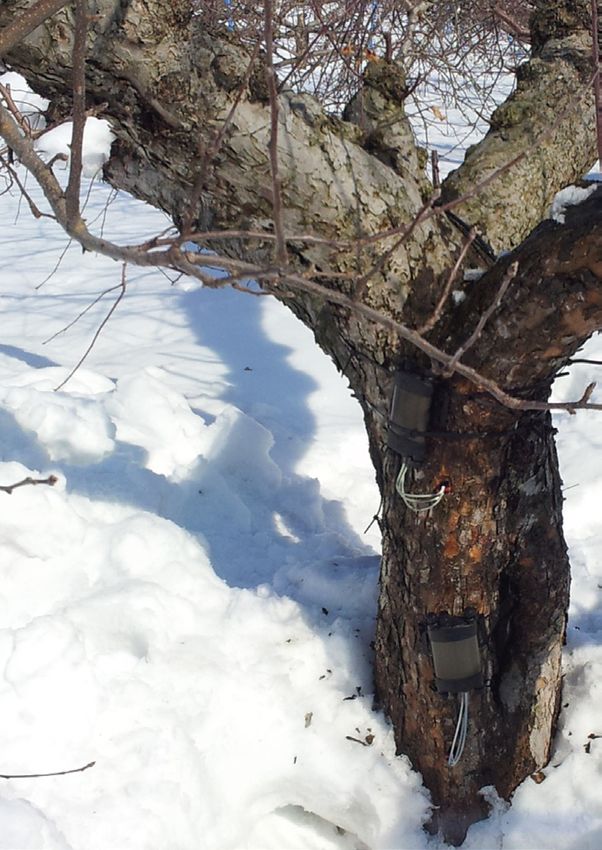
ADR/TDR Soil                SNiP-MP4    SNiP-MP3      SNiP-TDR
Moisture SNiPs

                                                       VWC % /
                                                    Permittivity
SNiP Measures                VWC %       VWC %       / BulkEC /
                                                   Temperature /
                                                    Pore Water EC

Core Sensor/Device           MP406       MP306       TDR-315L
(Measurement Principle)      (ADR)       (ADR)        (TDR)

                                Mineral &
Calibration                                        Mineral Soils
                              Organic Soils

                                                   VWC % / µS /
                                                    cm (bulk)
UOM                          VWC %       VWC %
                                                    °C / µS /cm
                                                   (Pore Water)

SNiP Node                  MFR-NODE    MFR-NODE       S-NODE

Total Sensors
                            Up to 4     Up to 4       Up to 4
SNiP Can Support

Mounting / Power             SPLM7 / 10W Solar Panel (SP10)

                             Tipping   Tipping
Optional SNiP Extensions                               Micro-
                              Bucket    Bucket
of Parameters:                                        Climate
                           Rain Gauge Rain Gauge

                                       ICT INTERNATIONAL            7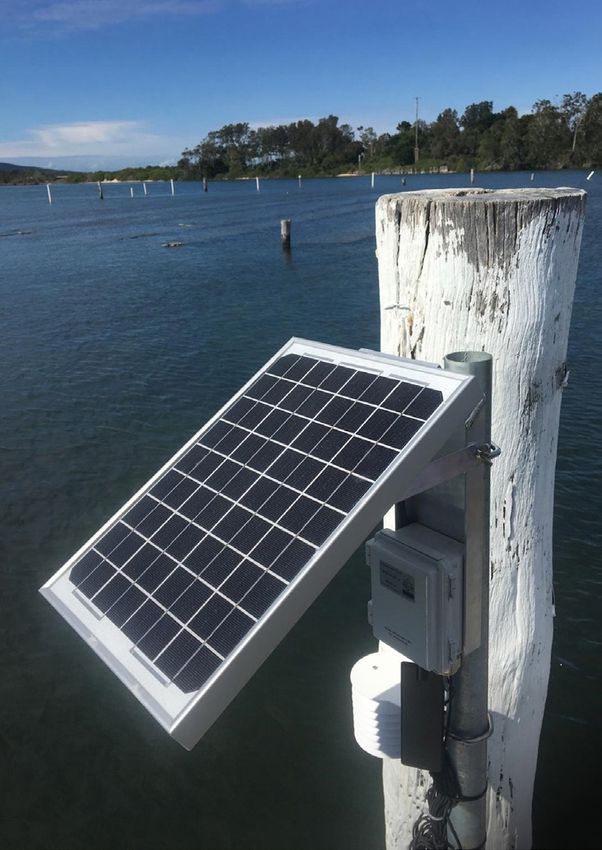
Soil Moisture: TDT

    Time Domain Transmission - SMT-100
                                                                                                          ICT S-NODE
                                                                                                             pg. 77
    The SMT-100 soil moisture probe uses Time Domain
    Transmission (TDT) technology, combining the
    advantages of the low-cost FDR sensor system with                                                SMT-100 Soil Moisture
    the accuracy of a TDR system. Like a TDR, it measures                                                   pg. 8

    the travel time of a signal to determine the relative
    permittivity εr of the soil, converting εr into an easy to        Sports Turf Monitoring
    measure frequency.
                                                                      Single-Point TDT SNiPs                 SNiP-SMT
    The SMT-100 utilizes a ring oscillator to transform               SNiP Measures                 VWC % / EC Temperature
    the signal’s travel time into a frequency. The resulting
                                                                      Core Sensor/Device
    frequency (>100 MHz) is high enough to operate well               (Single-Point)
                                                                                                             SMT-100
    even in clayey soils. Consequently, it corrects the VSW%          UOM                                  VWC % / °C
    value (volumetric soil water) independent of soil type.
                                                                      SNiP Node                               S-NODE
    Maintenance free and frost resistant, the SMT-100 can be
    used for long-term observations (8+ years continuous).            Sensors SNiP Supports              Up to 4 (STD)*
                                                                                           *Custom SNiP can support more

8          ICT INTERNATIONAL               Soil 4-17 Plant 18-43 Meteorological 44-55 Hydrological 56-63 Urban & Industrial 64-69
Soil Moisture: Capacitance

                                                                                                              ICT
                                                                                                              S-NODE
                                                                                                              pg. 77

EnviroPro Capacitance Measurement
Capacitance sensors measure the dielectric permittivity
of a surrounding medium. The configuration is either
like the neutron probe where an access tube, made of
PVC, is installed in the soil or buried probes connected                                                  Multidepth
to a data logger. In either configuration, a pair of                                                   EnviroPro VWC %
                                                                                                       Temperature pg. 9
electrodes form the plates of the capacitor with the
soil in between these plates, acting as the dielectric.
Changes in dielectric constant of the surrounding media
are detected by changes in the operating frequency. The
output of the sensor is the frequency response of the
soil’s capacitance due to its soil moisture level.

Capacitance sensors come in many configurations                               Figure (above) shows down hole capacitance sensors varying in
and many shapes. Due to the low cost and low power                            length and sensor spacing.
consumption capacitance sensors are common.
The impact of temperature and conductivity on the                             The small volume of measurement is
measurement of volumetric soil moisture means they are                        proving a limitation for growers expecting a
suited to monitor relative changes of soil water content                      representative answer for large areas (hectares)
and require in-situ calibration for accurate measurement                      with soil spacial variability. Approaches to
of volumetric soil water content (VSW%). Capacitance                          irrigation scheduling that are more integrative
sensors have a small volume of measurement and are                            such as tree measurements of water use (sap
widely used for irrigation scheduling.                                        flow) are becoming more common.

ENVIROPRO SNiPs                                       SNiP-EP4                         SNiP-EP8                      SNiP-EP12
SNiP Measures                                  VWC % /Temperature              VWC % /Temperature             VWC % /Temperature
Core Sensor/Device (Multi-Point)                    EP100GL-04                       EP100GL-80                    EP100GL-120
Number of Multi-Points (self-
                                                4 sensors (0-0.4m)              8 sensors (0-0.8m)            12 sensors (0-1.2m)
contained sensors per Device):
UOM                                                 VWC % / °C                        VWC % / °C                   VWC % / °C
SNiP Node                                              S-NODE                           S-NODE                         S-NODE
Sensors SNiP Supports                                 Up to 4                          Up to 4                       Up to 4
Mounting / Power                                                                     SPLM7 / SP10

Enabling better global research outcomes in soil, plant & environmental monitoring                  ICT INTERNATIONAL                         9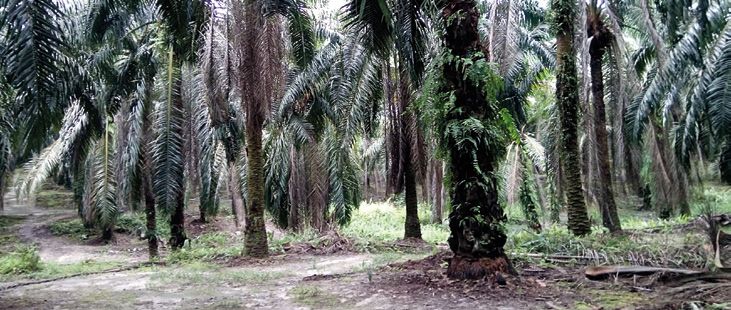
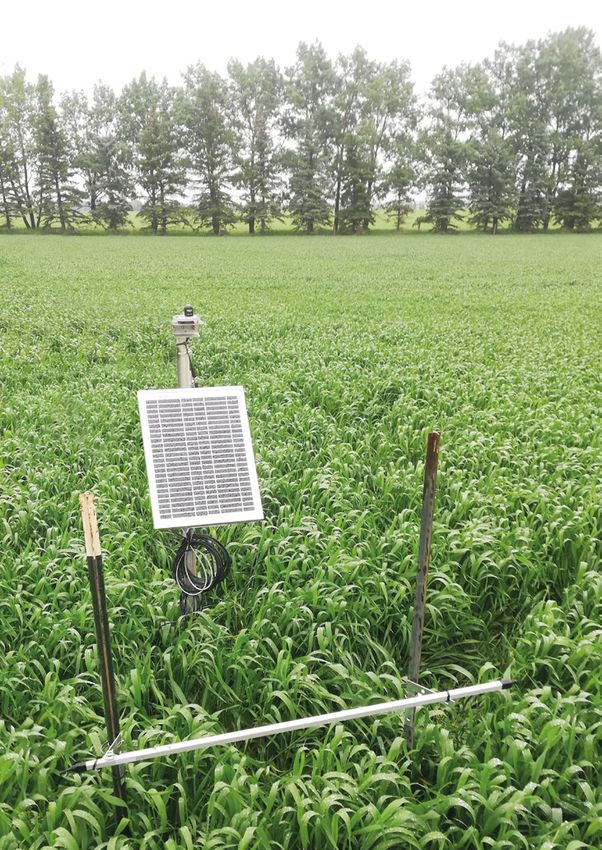
Smart Parks Irrigation Project

 Traditional irrigation systems typically operate on a timer and do not respond to weather conditions or actual
 plant water requirements. Smart irrigation systems which are responsive to plant water requirements can
 optimise water usage, improve plant growth, and reduce nutrient leaching into adjacent water bodies.

 Project Background
 For sustainable management of parks and lawned
 surfaces, it is important that the factors that influence
 changes in soil moisture content are understood and
 measured so that the irrigation conditions can be
 optimised to suit each location and the plant type. In
 2019 the Cairns Regional Council, in conjunction with
 Central Queensland University, commenced the Smart
 Urban Irrigation Project with the aim of optimising
 irrigation via the integration of best available irrigation
 equipment, real time monitoring data and the latest
 irrigation software.

 The project investigated various aspects that influence
 soil water content in Cairns parks, including soil
 properties, plant characteristics, weather conditions,
 and management practices, with the aim of developing
 a computer model that would help control irrigation in
 Cairns parks. Two parks, the Eastern Lagoon and Fogarty
 Park, were selected for intensive investigation. The
 grasses in these parks have shallow root systems (
Monitoring and Network solution
Following Dual EM and infiltration surveys, soil
moisture content at each of the two parks was
monitored at three locations, each broadly
representing low, medium and high moisture zones.
At each location 4x MP406 moisture sensors were
installed at 10, 30, 90 and 120cm depths. The MP406
sensor was selected because of its capacity to
measure VSW% accurately in the saline coastal soils.

The MP406 probes were supported by an MFR-
NODE, which transmitted the data from each site
over LoRaWAN to a solar powered gateway located
on the rooftop of the CQUniversity in Cairns. Given
the public nature of the site all monitoring equipment
was housed in a subterranean junction box and                                                                     ICT MFR-NODE buried in
battery powered. The 4G connection, gateway and                                                                    a subterranean junction
                                                                                 MP406 Soil Moisture Probes       box and battery powered.
nodes were administered using The Things Network
(TTN) LoRaWAN server via 4G connection.

Dashboard View of Past & Realtime Irrigation Drainage Data
The interface has been set up to receive and translate LoRaWAN gateway signals in National eResearch
Collaboration Tools and Resources (Nectar) Cloud which also hosts the Chronograf dashboard with the
InfluxDB database to store, analyse, and manage the data. The Chronograf dashboard helps visualise the
data and sends alerts based on events extremely low or high moisture content. The AI (Artificial Intelligence)
powered brain of the system was also developed for automating the entire irrigation process.

Data from dashboard showing how the MP406 sensors are responding to daily irrigation or rain on the 18th, 19th, 20th December 2019. The Data
assisted the park manager with an ability to discern moisture content of selected soil layers (for example 10cm depth) so a decision can be made
to judge if the park is under or over-irrigated.

This project was supported by Cairns Regional Council, the Australian federal Smart Cities Program and CQU's Centre for Intelligent Systems.

Enabling better global research outcomes in soil, plant & environmental monitoring                     ICT INTERNATIONAL                           11
Soil Tension, Suction & Matric Potential
ICT
MFR-NODE
pg. 76
Jetfill Tensiometers
The force with which water is held in the soil by the soil
particles, is referred to as soil suction, soil tension, or
soil water potential. It indicates how tightly the water is
bound in the soil, and how much energy must be exerted
by plant roots to remove and use the water.
Jetfill Tensiometers
with GT3-15
Transducer pg. 12
Tensiomark for Soil Matric Potential
Figure (above): Left of plant root shows water-saturated soil; right of plant
root shows dry soil with water particles sticking to soil particles. The Tensiomark is a fast response soil matric
potential sensor which measures soil water
Jetfill tensiometers measure in the range 0-70 kPa. The tension from pF 0 up to pF 7 (1 up to 1,000,000
tensiometer can measure very accurately small changes kPa). Wilting point is 1,500kPa, Maintenance-
in soil water potential and because of the fast response free and frost resistant, the Tensiomark bases
these are immediate. The vacuum inside the tensiometer its measurements on the thermal properties
is measured by a vacuum transducer (ICTGT3-15), which of the soil. Tensiomark is factory calibrated
gives a continuous analogue output signal. A resolution and has excellent accuracy and stability.
of 0.1 kPa is attained for this tensiometer transducer.
Turf and vegetable crops are typically irrigated at 30kPa
and cereal crops closer to 50 kPa.
The basic components of a tensiometer include a porous
ceramic cup, a plastic body tube, water reservoir, and a
vacuum transducer. The ceramic cup is placed in good
hydraulic contact with the soil and allows transfer of
water into and out of the tensiometer body according to
the tension in the soil. The vacuum inside the tensiometer
body equilibrates with the soil water tension, and there
is direct response with a vacuum transducer.
12 ICT INTERNATIONAL Soil 4-17 Plant 18-43 Meteorological 44-55 Hydrological 56-63 Urban & Industrial 64-69Soil Water Potential SNiP-GT3 SNiP-SMP
SNiPs
Soil Matric
Soil Water
SNiP Measures Potential &
Potential
Temperature
Core Sensor/Device GT3-15 Tensiomark
UOM kPa pF & ˚C
-100~ 0~1,000,000kPa
Range
+100kPa -40~+80˚C
±2kPa (1% full ±3kPa
Accuracy
range) & 5% FS
SNiP Node MFR-NODE S-NODE
Sensors SNiP Supports Up to 2 Up to 4
Mounting / Power SPLM7 / SP10
Soil Moisture,
System Extension Soil Moisture
Precipitation
Core Sensor/Device GT3-15 couples with
preferred Jet-Filled Tensiometer (length/s):
ICT2725L06NG * (15cm depth into soil)
ICT2725L12NG * (30cm depth into soil)
ICT2725L18NG * (45cm depth into soil)
ICT2725L24NG * (60cm depth into soil)
ICT2725L36NG * (90cm depth into soil)
ICT2725L48NG * (120cm depth into soil)
ICT2725L60NG * (150cm depth into soil)
* Jet Filled Tensiometer, Reservoir, Body & Cup
ICT INTERNATIONAL 13Soil Heat Flux & Temperature
ICT
MFR-NODE
pg. 76
Soil Temperature
The THERM-SS (shown above, left) is a high-quality
thermistor embedded in a protective stainless-steel
THERM-SS pg. 14
body which can be used in a wide range of applications, Temperature Soil Heat Flux
from soil monitoring in agriculture to industrial landfill, HFP01 pg. 14
or mine tailing and concrete monitoring. THERM-SS pg. 14
MP406 Soil Moisture
The ST01 is a high-quality temperature sensor that is Probes pg. 6
specifically designed for soil temperature measurement
in hostile conditions as encountered in outdoor
installation (temperature, radiation, chemicals). Soil Heat Flux
Employing a platinum sensor, at extreme temperatures
a higher accuracy can be attained than with commonly The rate of soil heating and cooling of the soil
used thermistors. is proportional to its diffusivity, and is affected
by water content, soil texture and compaction.
Soil Temp SNiPs SNiP-STP SNiP-STP1 SNiP-SHF Soil heat flux can be calculated from
Soil Soil Soil Heat temperature gradients or from changes in
Measures
Temperature Temperature Flux temperature based upon known thermal
ST01
HFP01, conductivity or heat capacity properties.
Core Sensor THERM-SS 2x THERM-SS,
(PT100) 1x MP406,
Sensors SNiP
However, as these thermal properties
Up to 2 Up to 2 N/A continually change with variations in soil
Supports
W/m2, °C, moisture this approach is impractical and
UOM °C °C
%VSW inaccurate. Direct measurement of the soil
±3% at 5°C heat flux is the simplest approach to follow.
±0.5°C ±0.2°C
Accuracy ±5% Custom
at 25°C at 25°C
Calibration
The SNiP-SHF package, for measurement of
SNiP Node AD-NODE AD-NODE MFR-NODE soil heat flux, includes 1 x HFP01 Soil Heat
Mounting /Power
SPLM7 / Flux Plate, 2 x THERM-SS Thermistors and 1
SP10 x MP406 soil moisture probe. A pyranometer
Optional Soil Soil
Solar can optionally be added for measurement of
SNiP Moisture / Moisture /
Radiation incident solar radiation.
Extensions Precipitation Precipitation
14 ICT INTERNATIONAL Soil 4-17 Plant 18-43 Meteorological 44-55 Hydrological 56-63 Urban & Industrial 64-69Soil Oxygen
ICT
S-NODE
pg. 77
Apogee Soil Oxygen Sensor
The Apogee soil oxygen sensor (SO-411 shown above
with AO-001 Diffusion Head) is used to continuously Apogee Soil Oxygen
SO-411-SS pg. 15
monitor soil oxygen concentration; which is crucial to the
productivity of crops such as avocado, cotton, tomato
and tobacco. Anaerobic soil conditions prevent uptake of
water as the roots cannot respire due to excess water in
the soil profile and daily water use rapidly declines with
resultant significant crop yield loss.
There are two types of O2 in soil – soil pore O2 and
dissolved O2 in soil solution. Soil pore O2 directly impacts
upon plant health, and dissolved O2 upon soil microbial
health. A great equilibrium exists between these two
‘zones’ hence simply measuring the bulk soil O2 is enough.
The SO-411 comes with a thermistor temperature sensor
to correct for temperature changes and a heater to
raise the temperature of the membrane approximately
two degrees above ambient temperature to keep
condensation from occurring on the teflon membrane
and blocking the diffusion path of the sensor.
Soil Oxygen SNiPs SNiP-ASO
Measures Soil Oxygen %
Core Sensor SO-411-SS
Sensors SNiP Can Support Up to 4
UOM % [O2]
Measurement RepeatabilitySoil Nutrient Drainage Monitoring
ICT
MFR-NODE
pg. 76
GroundTruth Lysimeter With Autosampler
Realtime Nutrient Drainage with the GL240
Drainage volume, and nutrient loss, are important MP406 Soil
Moisture Probes
measurements for determining fertiliser and water use pg. 6-7
efficiency and for measuring environmental performance.
The GL240 Gee Lysimeter System is installed to determine
discharge (rates and volume) of water and solutes draining
from the vadose zone into groundwater. The Passive
Wick Gee Lysimeter (Fluxmeter) collects drainage water
from below the root zone of a crop. The combination of
this system with the drainage control tube (DCT) allow
the lysimeter to collect an accurate volume of drainage
water, minimising the risk of either bypass flow (water
flowing around the lysimeter without entering it), or
convergent flow (water moving preferentially into the
lysimeter instead of draining beside it). A submersible
pressure sensor continuously measures reservoir volume,
for real time drainage monitoring. System extensions can
include a rain gauge and soil moisture array. The GL240 or approximately 500 suction cups. All water
Autosampler's reservoir can optionally be automatically that drains through this lysimeter is pumped to
drained into sample bottles on the surface - ideal for use a LoRaWAN-connected autosampler, located
in remote areas or at sites with high rates of drainage. up to 100m away. This allows the lysimeter to
be placed in a representative area of a field,
Ground Strip Lysimeter while the only above-ground device is at the
fence-line. All research and maintenance can
The GroundTruth Lysimeter System combines a very occur without entering the field, and without
large repacked strip lysimeter with automated, realtime disturbing the crop. The autosampler measures
drainage measurement and water sampling. This allows real-time drainage volume and collects a 1%
accurate measurement of nutrient losses in the field, flow-proportional subsample of all drainage
viewable in real-time. Each strip lysimeter is a transect, for later laboratory analysis, e.g. nutrients,
usually 10m long. Actual dimensions can be larger and are microbiology, pesticide residues. The collected
tailored to the site. One 10m long, 4m² lysimeter has an volume is available online and via email alerts,
equivalent capture area to twenty 50cm diameter column so the site only needs to be visited when an
lysimeters, eighty 25cm diameter miniature lysimeters, actual sample requires collection.
16 ICT INTERNATIONAL Soil 4-17 Plant 18-43 Meteorological 44-55 Hydrological 56-63 Urban & Industrial 64-69Integrated Soil
SNiP-GLD-ML SNiP-GLH-ML
Water Drainage SNiPs
SNiP Measures Water and nutrient drainage below the root zone, with sampling access
Gee Lysimeter,
Gee Lysimeter,
Core Sensor/Device 1x TPT Submersible Pressure
1x Level/Temp/EC Sensor
Transmitter
0-173mm of drainage; 0-173mm of drainage;
Measurement Range
0 to 350 mbar 0-1 bar
Sensor IP Rating IP68 - Sensor can be submerged in water to 1m depth
SNiP Node MFR-NODE S-NODE
Node Standard
LoRaWAN, LTE-M Cat-M1 LoRaWAN, LTE-M Cat-M1
Comms Options
10W Solar Panel & SPLM7, 10W Solar Panel & SPLM7,
Mounting / Power 6.5Ah rechargeable 6.5Ah rechargeable
li-ion battery li-ion battery
Optional SNiP Tipping bucket rain gauge, and
Extensions: soil moisture probes (SMT-100 or MP-406) can optionally be added.
Comparing Lysimeter Size & Area
Wick
(50cm) (25cm) (10m)
0.2m2 0.05m2 4.0m2
Standard Column Lysimeters GTLA GroundTruth Lysimeter
ICT INTERNATIONAL 17Plant Monitoring
The plant itself is a very sophisticated transducer or “sensor.”
Using every leaf in the plants canopy, radiation, temperature,
humidity and wind speed are measured and processed. The Open Format Data Compatible
large, dynamic root system of the plant extensively senses with Flexible Connectivity
and processes large volumes of soil for water and nutrition. (pg. 74-75)
The plant then integrates all of these sensed inputs into
a single measurable output that describes its ability to
photosynthesise and grow.
This single integrated output is the Sap Flow (Litres/Hour)
or Plant Water Use (Litres/Day).
IoT (Internet of Things) technology increases
the speed, consistency, and convenience of
data collection and application management.
ICT International's modular range of SNiPs
(Sensor-Node IoT Packages) enable real-
time accurate measurements for continuous
plant monitoring. See pages 70-81 for more
information.
SFM1x (LoRaWAN)
Sap Flow Meter ATH-2S
Air Temp
SNiPs reduce the cost of getting a fuller pg. 22
Humidity MFR
picture on the application, replacing DBV60 pg. 52 NODE
traditional loggers for each sensor or Band Dendrometer pg. 76
Tree Swelling pg. 28
additional parameter.
MP406
Soil Moisture
Probes pg. 6-7
Sensor-Node Integrated Package (SNiP)
for Avocado Irrigation Monitoring
18 ICT INTERNATIONAL Soil 4-17 Plant 18-43 Meteorological 44-55 Hydrological 56-63 Urban & Industrial 64-69Green Asset Management in Urban Environment Thresholds to Measure Urban Tree Health Monitoring urban tree water-use enables the establishment of an upper and lower threshold for optimum water use and tree health, enabling arborists to measure tree health and make confident decisions in the irrigation management of any Urban Forest. Tree water use is highly variable from day to day, and seasonally. If a tree begins to experience water stress it becomes more susceptible to attack from pests and disease, creating a higher risk of limbfall and insurance payout. SFM1 Continuously Monitored The Water Use of Heritage Trees in Sydney, Australia Near the Opera House, Sydney, Australia, a Moreton Over 30 days, from April 9th to May 8th the water use Bay Fig was installed with SFM1 Sap Flow Meters. progressively declined by 30%. This reduction was due The graph above (and right) focuses on 7 days of to reduced solar radiation and ambient temperature this tree's water use. From hot days in April the tree as early autumn transitions towards winter. The graph water use was as much as 360 L/day and on rainy below demonstrates how peak water use is declining days it was as little as 44 L/day. from 360 L/hr to 240 L/hr. Enabling better global research outcomes in soil, plant & environmental monitoring ICT INTERNATIONAL 19
Plant Monitoring: Returns on Investment
 Fertiliser Decisions, Cumulative Water Use and Crop Yield
 There is a close relationship between cumulative water use (CWU) of a crop and final yield. CWU indicates
 photosynthetic activity, dry matter accumulation and hence yield. As the season progresses measurement
 of sap flow will enable the CWU to be determined and how far the actual CWU is less than potential CWU.

 This measured CWU will
 determine fertiliser need
 and irrigation requirement.

 In situations where there
 is possible drainage of
 irrigation    water       and
 hence fertiliser below the
 rootzone, the fertiliser
 program can be planned
 from the measured CWU.
 Monitoring of drainage
 water will indicate losses
 of water and fertiliser out
 of the cropping system,
 potentially to the water
 table. These can all be easily
 and continually monitored.

                                            Cumulative water use (measured by Sap Flow Meter SFM1x) enables fertiliser applications in relation to
                                                                                                     actual plant growth/plant fertiliser uptake

     Continuous Sap Flow of Oil Palm for 62 days Enables Calculation of Actual Yield

 Yield Index: Scale up Frond 17 to whole Palm Tree and Water Use/ha

20         ICT INTERNATIONAL                       Soil 4-17 Plant 18-43 Meteorological 44-55 Hydrological 56-63 Urban & Industrial 64-69
Irrigation & Fertiliser Drainage, Root Activity & Soil Water Extraction
A common problem encountered when irrigating The depth of root extraction of water and fertiliser
light textured soils is deep drainage. This problem is determined by regular measurement of changes
is often undetected and the soil water content must in soil moisture at multiple depths over time during
be measured at a number of depths over a short a drying cycle.
time periods before the problem can be properly
addressed.
Right Graph: Drainage - Water Movement Down;
Left Graph: Crop Water Use - Water Movement Up.
Extended Sensor-Node Integrated Package (SNiP) for Oil Palm Irrigation Monitoring
Rain
Gauge
PRP-02
ICT pg. 45
MFR-NODE
pg. 76
ICT
MFR-NODE
pg. 76
SFM1x (LoRaWAN)
ATH-2S
Sap Flow Meter
Air Temp
pg. 22
Humidity pg. 52
Gee
Lysimeter
pg. 16
MP406 Soil
Moisture Probes
pg. 6-7
SFM1 Sap Flow Meter
on Frond 17 pg. 22Plant Water Relations: Sap Flow
SFM1x Sap Flow Meter
The SFM1x Sap Flow Meter enables individual tree water use applications. The SFM1x features an UCM
and health to be monitored in real time. This is because the (Universal Communications Module) that
SFM has integrated data transmission direct to cloud using enables a customer to choose from:
IoT/LTE-M Cat-M1. The SFM1x Sap Flow Meter is a discrete
standalone instrument based upon the Heat Ratio Method. □ Non-IoT – Data Downloaded via Bluetooth/USB;
This measurement principle has proven to be a robust and □ LoRaWAN™ – Low-Power Long-Range
flexible technique to measure plant water use; being able to connectivity;
measure high, low, zero and reverse flows in a large range of □ LTE Cat M1/Cat NB1/EGPRS – Utilising
plant anatomies & species from herbaceous to woody, and existing mobile networks.
stem sizes > 10 mm in diameter. The theoretical basis and
ratiometric design of the Heat Ratio Method makes possible ICT LoRaWAN and LTE Cat M1/Cat NB1/EGPRS
the measurement of high, low, zero and reverse flows. provide data which is open-format and free from
proprietary formatting or decoding. This provides
The SFM1x Sap Flow Meter consists of two temperature full control of data from the point of sensing and
sensing needles arranged equidistance above and below a allows the end user full flexibility in how they
central heater. These needles are inserted into the water collect, store and view data.
conducting tissue of the plant by drilling 3 small parallel
holes. Heat is then pulsed every 10 minutes into the water
conducting tissue of the plant. The heat is used as a tracer SFM1x Sap Flow Meter
to directly measure the velocity of water movement in the Needle Diameter/Length 1.3 mm / 35mm
plant stem. 2 Measurement 7.5 mm and 22.5 mm
Spacings per Needle from the needle tip
The SFM1x Sap Flow Meter is a dedicated self-contained Output Options Raw Temperatures: °C
Heat Pulse Velocity: cm hr-1
data logger, with a heater and two temperature sensing
Sap Velocity: cm hr-1
needles, that provides power to the heater and logs sap Sap Flow: Litres hr-1
flow in litres per hour of water used by the plant. This is Range Approx. -70 ~ +70 cm hr-1
the water actually used by the plant in litres, completely
Resolution / 0.01 cm hr-1 /
independent of any water that may have been lost to Accuracy 0.5 cm hr-1
evaporation from bare soil, run off or through drainage. Measurement Duration 120 seconds
Heat Pulse 20 Joules typical
The SFM1x has been designed to provide flexible Default (User Equivalent to 2.5 second
communication. With an onboard SD-Card, it provides Adjustable) heat pulse duration,
stand-alone data logging capabilities and full data auto scaling
redundancy in the event of temporary loss of Adjustable Logging
Minimum: 10 mins
communications or dropped packets – ideal for research Interval
22 ICT INTERNATIONAL Soil 4-17 Plant 18-43 Meteorological 44-55 Hydrological 56-63 Urban & Industrial 64-69Macadamia Sap Flow Monitoring & Irrigation Management
The search for more precise water monitoring technologies
Australian macadamia growers, like many orchardists, have focused on indirect indications of plant water
use by using soil moisture sensors to help schedule irrigation events. Irrespective of the soil moisture sensor
technology, relying on very small (millimetres) samples of soil and expecting a meaningful or representative
response across a large area (hectares) has always been problematic for precision agriculture.
Australia macadamia growers are now seeking more precise monitoring technologies that can directly
measure the plant and its water use. The way of doing this is by using the plant itself as a sensor by measuring
sap flow. By directly and continuously monitoring the whole plant, which uses its root system to sample a
large volume (cubic metres) of soil, a very accurate and representative recording of water use and water
status through the orchard can be made. Real-time information about a plant’s water requirement as it
interacts with its ever-changing environment throughout the day and night helps growers better determine
crop water requirements and hence to improve irrigation practices.
Listening to the tree with Sap Flow
In the past, managers have had access to pump and flow
meter data to estimate volumes of applied water with
each irrigation event, but the fate of the applied water
was mostly unknown and difficult to determine.
The new approach in irrigation management begins
from understanding and measuring the volume of water
moving through tree stems in the orchard system. Daily
water-use patterns measured by sap flow meters and
water stress measured by stem psychrometers allow
growers to see when their trees are active (day or night)
and to more closely match the total applied irrigation
water to tree water use at exactly the right time.
Identifying the seasonal differences in macadamia
water use and linking these changing demands with...
ICT INTERNATIONAL 23...key phenological stages of the tree’s yearly cycle will be the key to the foundation for sound and effective
irrigation management. Below is water use using data for the cv816 tree over the observed 37-day period (27
August to 2 October 2018). This is the critical flowering period.
Tree Water Usage (L/Day)
Flowering
Total Individual Average Daily Max. Daily Water Use Water Use For Max. Daily Water
Tree Water Use Tree Water Use Tree Water Use Per Hectare The 6.2ha block Use Per Hectare
64.7 L 18.1 kL/1.81 mm
1.73 kL 46.8 L 484.6 kL 3.0 mL
(17-09-2018) (17-09-2018)
Full Article: Manson, D., & Downey, A. (2018). Sap flow monitoring a new frontier in irrigation management.
AMS News Bulletin, Summer 2018. https://australianmacadamias.org/industry/resources/sap-flow-
monitoring-a-new-frontier-in-irrigation-management
Tree Monitoring Proves Itself on Australian Macadamia Farm
A grower who manages more than 120 ha of mature
macadamia orchards in the Bundaberg region achieved
between 15-20% reduction in applied water during
winter and early spring compared to the same period in
the prior year by using sap flow monitoring (accounting
for rainfall pattern difference between years). This grower
is confident all the trees’ water requirements are being
met with the improved irrigation schedule, which was
Sap Flow Needles in Macadamia Tree
developed by closely observing the constant feedback
from sap flow sensors.
An added benefit is that maintaining reduced soil moisture levels has also reduced soil pathogen pressure and
resulted in healthier trees, especially on the heavier soils. The lower operating soil moisture levels created by
the improved scheduling have also increased the residual buffering capacity of the soil profile against over-
saturation during heavy rainfall events, substantially aiding in erosion control and vigour management.
24 ICT INTERNATIONAL Enabling better global research outcomes in soil, plant & environmental monitoringTiming the Irrigation Using Sap Flow Measurement – An Example
Macadamia flowering in Southern Queensland
Australia, commences around September 1st
lasting approx. one month. It is important to
maintain high water use and low water stress
during flowering to maximise potential yield.
Interpretation of the sap flow and water SFM1x
potential data during the last week of August ICT
(LoRaWAN) pg. 22
MFR-NODE
indicated the commencement of water stress DBV60 Band ATH-2S
Air Temp pg. 76
as the sap flow rate steadily dropped from Dendrometer
pg. 28 Humidity pg. 52
approx. 20L to 12L/day.
Irrigation was applied on September 2nd and
MP406 Soil Moisture Probes
water use or sap flow increased from approx. pg. 6-7 pg. 74-75
12 L/day to approx. 24 L/day. Flexible Connectivity
24L/day
20L/day
Irrigation
12L/day
Time series overlay of sap velocity (Inner & Outer) 7 days prior to irrigation showing a steady reduction in sap velocity.
20L/day
12L/day
Changes in Plant Water Use 7 days prior to Irrigation.
ICT INTERNATIONAL 25Scientific Paper: New Zealand Forestry Kauri Trees Sharing Water
How does a tree without green foliage keep itself alive?
Dr Martin Bader and Assoc. Prof. Sebastian Leuzinger
from Auckland University of Technology have found
that when two trees of the same species are close to
one another, they are able to undertake Hydraulic
Coupling – that is share water, carbon, minerals and
microorganisms.
To prove this, they attached ICT International SFM1 Sap
Flow Meters and PSY1 Stem Psychrometers to a Kauri
Tree and an adjacent stump with no leaves (figure right).
From the data that these instruments captured, Bader
and Leuzinger were able to observe the movement of
the sap between the stump and the tree.
The SFM1 Sap Flow Meter can measure very low sap
flow and reverse sap flow. This enabled measurement
of sap flow toward the tree in day time and reversal
of flow toward the stump at night. The hydraulic
gradient as measured by the PSY1 Stem Psychrometer Figure (above, right) shows SFM1 Sap Flow Meters monitoring
reversed from day to night and hence the direction of sap flow through the stump at different times of day. (Supplied
by Assoc. Prof. Sebastian Leuzinger)
flow reversed from day to night in relationship to this
measured hydraulic gradient.
Figure (above, top) is a combined diagram of Daytime &
Nightime Shared Sap Flow, Based on the Scientific Paper's
Full Reference: Diagrams (Original Photo Supplied: Assoc. Prof. Sebastian
Leuzinger).
Bader, M. K.-F., & Leuzinger, S. (2019). Hydraulic
Coupling of a Leafless Kauri Tree Remnant to
Conspecific Hosts. iScience, 19, 1238–1247.
https://doi.org/10.1016/j.isci.2019.05.009
26 ICT INTERNATIONAL Enabling better global research outcomes in soil, plant & environmental monitoringPlant Water Potential: Stem, Leaf and Root Psychrometry
The PSY1 Plant Psychrometer
The PSY1 Plant Psychrometer integrates all the ambient
environmental parameters acting upon the plant such
as solar radiation, temperature, humidity, wind speed
and soil water availability into a single continuously
measurable variable. It is a stand-alone instrument
for the measurement of plant water potential. It
can continuously log changes in plant water status/
potential, which directly reflect the energy required
to access water or the stress the plant is under. Plant
stems or leaves can be measured using this instrument.
The measurement of water potential in-situ has been
corrected for temperature gradients and calibrated
against the Scholander pressure chamber.
The Psychrometer consists of two chromel-constantan
thermocouples encased in a chromium-plated brass
chamber acting as thermal mass. One thermocouple
is in contact with the sample (sapwood in stems or
substomatal cavity in leaves) and the other thermocouple
simultaneously measures the chamber air temperature
and subsequent to a Peltier cooling pulse, the wet bulb
depression. A third copper-constantan thermocouple
situated in the chamber body measures instrument PSY1 Psychrometer
temperature for correction. All these measurements
Units MPa
allow for precise and repeatable measurements of plant
water potential in MPa units at defined intervals. Range -0.1 MPa to -10 MPa
Resolution 0.01 MPa (0.1 Bar)
The PSY1 has been used in with many plants – forestry
Accuracy ±0.1 MPa (1 Bar)
(banksia, eucalypts, sandal wood, dalbergia, Thuja sp.,
Acer sp.), ornamental nursery (Metasequoia, Syringa),
field crops (sugar cane, wheat, rice, maize, palm oil,
grapes citrus, mango, coffee, avocado) and greenhouse
crops (capsicum, cucumber, tomato, almond).
Enabling better global research outcomes in soil, plant & environmental monitoring ICT INTERNATIONAL 27Plant Water Relations: Dendrometry
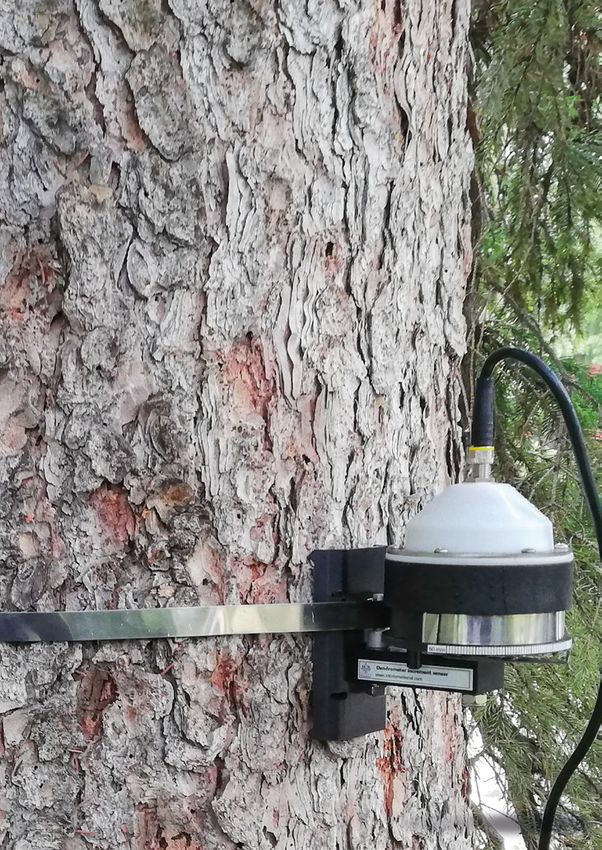
Band Dendrometer
Dendrometer bands are a long accepted
and widely used method of measuring tree
circumference and can provide changes in
tree diameter at breast height (DBH), basal
area, and basal area increment. The DBS60
Band Dendrometer is a high resolution (1μm
[0.001mm]), non-invasive sensor capable
of measuring a wide range of diameters
(50mm>). The stainless-steel band has a
very low linear thermal co-efficient. Thermal
variations caused by daily or seasonal changes
Realtime Dendrometry Data in temperature have no measurable impact on
the measurement accuracy. The DBS60 is IP66
Stem diameter is one of the most commonly measured rated and is designed to be installed in the
attributes of trees. Dendrometers are used to measure harshest field conditions for years at a time.
the diameter of fruits, plants and trees. High resolution
dendrometers are used to monitor the diurnal swelling
and shrinkage of stems. During the day stems “shrink” Pivot Dendrometer
as stomata open and the tree transpires. At night the
stem “swells” due to cessation of transpiration and trunk Pivot dendrometers are designed for simple,
refilling of moisture. error free installation, being fastened on
the stem by a spring-based lever clamp.
Maximum Daily trunk Shrinkage (MDS), the calculated Adherence pressure is set as a compromise
difference in daily minimum and maximum stem between the influence on plant tissues and
diameter, is a commonly used parameter in irrigation installation stability. The DPS40 Pivot Stem
scheduling. Significant crop research has been Dendrometer is a high-resolution pivot-based
undertaken in this field to explore the correlation of sensor for measurement of small stems, from
MDS to physiological and abiotic parameters including 5mm to 40mm, the bearing of the position
soil moisture and water potential, vapor pressure deficit sensor is carefully shaped for minimal effect of
(VPD) and stem water potential. temperature and axial forces.
Seasonal datasets can be used to compare fertilisation
treatments, pruning, thinning or drought treatments.
In forestry dendrometers are used for long term
data collection in the study of growth dynamics,
biomass allocation and carbon uptake. In horticulture
Dendrometers are used to monitor MDS for irrigation
management.
Figure shows Maximum Daily Shrinkage i.e. The maximum
daily stem diameter minus the minimum daily stem diameter.
28 ICT INTERNATIONAL Soil 4-17 Plant 18-43 Meteorological 44-55 Hydrological 56-63 Urban & Industrial 64-69Dendrometry SNiPs SNiP-DPS SNiP-DBS4 SNiP-DBS6
Tree/Stem Tree/Stem Tree/Stem
SNiP Measures Circ. (mm) Circ. (mm) Circ. (mm)
/ Temperature / Temperature / Temperature
DBS60 with
Core Sensor/Device DPS40 modified fixing DBS60
plate
UOM mm / °C mm / °C mm / °C
Increment Range 35mm of 60 mm of 60 mm of
circ. circ. circ.
Minimum Trunk Diameter 5mm 40mm 60mm
Maximum Trunk Diameter 40mm 80mm No maximum
Resolution 0.001 mm 0.001 mm 0.001 mm
SNiP Node S-NODE
Sensors SNiP Supports Up to 4
Mounting / Power SPLM7 / SP10 SPLM7, DBTAPE / SP10
Figure shows 12 months of a data set from an Acacia implexa
growing near Armidale, NSW, Australia. The DBL60 is
manufactured from UV Resistant plastic for many years of data
collection.
ICT INTERNATIONAL 29LoRaWAN Avocado Crop Monitoring
In late 2018, ICT International installed a monitoring program in an avocado orchard with the specific
objective to reduce rates of fruit drop (abscission), hence yield loss, by improved irrigation scheduling.
The Site Project Background
The farm, located on the Mid-North Coast of Avocado trees are particularly sensitive to heat (and thus
NSW Australia, had previously suffered crop water stress) at the time of flowering and fruit set. Water
losses caused by water stress during flowering stress can result in flower and fruit drop, thereby reducing
and fruit set. Seeking a solution to better yield. By forecasting the risk factors which contribute to
detect this risk required real time monitoring plant water stress, notably low soil moisture and high
to enable pro-active management of irrigation Vapour Pressure Deficit (VPD), management decisions
and canopy humidity. can be implemented to minimise the risk of fruit drop.
The Solution: Crop Monitoring Sensors
• Weather station
• Soil Moisture Sensors
• Temperature Sensors
• High Resolution Dendrometers measuring avocado
tree trunk diameter
• Micro-climate sensors outside and within the canopy
measuring temperature, relative humidity and
calculated VPD.
Dendrometer
Integrated Into a LoRaWAN Network
Data from the sensors is transmitted over a private
LoRaWAN network to a Gateway utilising a fixed-point
network connection. Eagle.io is used for data storage
/ visualisation and alarming of soil moisture, VPD and
Maximum Daily trunk Contraction (MDC).
The system notifies operators (via SMS and email) when
irrigation is necessary to avoid plant water stress and
potential fruit drop, hence crop loss.
30 ICT INTERNATIONAL Enabling better global research outcomes in soil, plant & environmental monitoringSNiP-SPW1 SNiP-SPW2 SNiP-SPW3
Soil Moisture, Multi-Point Soil Moisture Soil Moisture /
SNiP
Temperature and EC / & Temperature / Tree Circumference
Measures
Tree Circ. / VPD * Tree Circ. / VPD * / VPD *
SMT-100 / EP100GL-04 / MP406 /
Core Sensor/Device
DBS60 / ATH-2S DBS60 / ATH-2S DBS60 / ATH-2S
SNiP Node S-NODE S-NODE MFR-NODE
Mounting / Power SPLM7, DBTAPE / SP10
Optional Extensions: Solar Radiation
*VPD is derived from measure of ambient temperature and relative humidity
The Outcome
The sensor network was installed in December 2018, prior to a month
of extreme heat which occurred during flowering and fruit set. Over
January, during fruit set, the sensor network detected two significant
plant water stress events, with local VPD levels rising above 5kPa.
Low soil moisture during the second event resulted in severe plant
water stress, reflected by higher levels of MDC of the trunk. Managers
Gateway
observed high numbers of fruit drop coinciding with the second event.
Dashboard View of Past & Realtime Data
VPD above 5kPa
High Trunk
Contraction
Low Soil
Moisture
Remotely controllable irrigation systems are currently being installed. The monitoring system will provide
property owners the information required to remotely control irrigation to reduce plant water stress events.
Enabling better global research outcomes in soil, plant & environmental monitoring ICT INTERNATIONAL 31Plant Light Relations: PAR
Photosynthetically Active Radiation (PAR)
Light intercepted by a leaf may be absorbed, reflected, No quantum sensor can perfectly match the
or transmitted; the fraction absorbed depends on the ideal quantum response, which is defined as
spectral content of the radiation and the absorption an equal response to all wavelengths of light
spectrum of the leaf. between 400 and 700 nm.
Photosynthetically active radiation (PAR) is light of The Apogee SQ-500 Full Spectrum Quantum
wavelengths 400-700 nm and is the portion of the Sensor (389-692nm) has a response closer to
light spectrum utilised by plants for photosynthesis. that of an ideal quantum sensor than the SQ-
Photosynthetic photon flux density (PPFD) is defined as 110. The SQ-110 Quantum sensor (410-605nm)
the photon flux density or PAR. If PAR is low plant growth is used when focusing the PAR measurements
and carbon assimilation is limited, while too much PAR in the green portion of visible light.
may damage the photosynthetic apparatus.
Plant Light SNiPs SNiP-SQS SNiP-SQE SNiP-SQF SNiP-PFR SNiP-RFR
SNiP Measures PAR PAR PAR PAR/FAR Red Red/FAR Red
Core Sensor/Device SQ-110 SQ-120 SQ-521 SQ-521,S2-441 S2-431
0 to 4000 μmol
0 to 4000 0 to 4000 m-² s-¹ (PAR) 0 to 400 μmol
Measurement Range
μmol m-² s-¹ μmol m-² s-¹ 0 to 1000 μmol m-² s-¹
m-² s-¹ (Far Red)
389 to 692 nm 389 to 692 nm 645 to 665 nm
±5 nm ±5nm (PAR) ±5nm (Red)
Wavelength Ranges 410 nm to 655 nm
700 to 760 nm 720 to 740 nm
±5nm (Far Red) ±5nm (Far Red)
Sensor IP Rating IP68 - Sensor can be submerged in water to 1m depth
SNiP Node AD-NODE S-NODE S-NODE S-NODE
Mounting / Power AL-120
Optional SNiP Precipitation,
Soil Moisture, Microclimate
Extensions: Soil Moisture
32 ICT INTERNATIONAL Soil 4-17 Plant 18-43 Meteorological 44-55 Hydrological 56-63 Urban & Industrial 64-69Plant Light Relations: Controlled Environments PAR, Deep Red and Far-Red Light - Impacts on Plant Growth Photosynthetically Active Radiation (PAR) has been measured for many years as an important input to photosynthesis, plant growth and crop yield. In recent times with the advancement of LED manufacturing & light measurement technologies, it is now being understood that the extension of PAR measurement into the Red and Far-Red light range can explain much about plant height, leaf expansion and morphogenic processes of plants. This can be used to advantage with indoor plant production systems and controlled environments. The plant canopy selectively absorbs Deep Red wavelengths (approximately 660 nm) more than Far- Red wavelengths (approximately 730 nm) resulting in a decrease in the Red:Far-Red ratio of light toward the base of the canopy, such changes in light quality result in photomorphogenic changes in plant growth. In agricultural production systems an understanding of these responses is central to optimising planting density and canopy management. ICT International has a range of IoT packages available to connect with Apogee sensors and send data via LoRaWAN or LTE Cat M1/Cat NB1/EGPRS to the cloud for real-time monitoring and control of greenhouse production systems and light interception of field crops. Enabling better global research outcomes in soil, plant & environmental monitoring ICT INTERNATIONAL 33
Plant Light Relations: Canopy Light Interception

                                                                                           Quantum PAR
                                                                                           SQ-110 pg. 32
                                                                                                                ICT
                                                                                                                MFR-NODE
                                                                                                                pg. 76

 Canopy Light Interception
 Plant light interception efficiency is a key determinant
 of carbon uptake by plants; plant productivity over
 seasonal time-scales is approximately proportional to
 intercepted light. Canopy architecture, leaf area, leaf
 angle distribution, and leaf dispersion are determinants
                                                                                    LINPAR
 in the light distribution and interception within the                               pg. 34
 canopy. In horticultural crops pruning strategies can
 optimise tree structure and drive higher productivity
 and increase plant health and longevity.

 The measurement of fraction of intercepted PAR (f) is
 an indicator of a plant’s light use efficiency or its ability
 to convert sunlight into biomass. The simple method
 requires at least one PAR sensor above the canopy to
 measure direct beam and one or more PAR arrays
 beneath the canopy.

 A PAR array is necessary beneath or within a canopy
 because it samples a larger area and considers sunlight
 variability caused by the canopy. Plotting f over a growing
 season against some measure of yield or biomass
 indicates the light use efficiency of crops.

 The MFR-NODE and AD-NODE can be configured with
 LINPAR and PAR sensors to measure, monitor and calculate
 intercepted PAR (f), and hence biomass and yield.

34       ICT INTERNATIONAL                Soil 4-17 Plant 18-43 Meteorological 44-55 Hydrological 56-63 Urban & Industrial 64-69
PAR Array SNiPs SNiP-SQ3 SNiP-SQ6 SNiP-SQ10 SNiP-LPAR
SNiP Measures Photosynthetically Active Radiation (PAR)
Core Sensor/Device SQ-313 SQ-316 SQ-311 LINPAR
(No. of Sensing Points) (3) (6) (10) (33)
0 to 2000
Measurement Range 0 to 4000 μmol m-² s-¹
μmol m-² s-¹
Wavelength Ranges 410-655nm 350-680nm
Sensor IP Rating IP68 IP65
SNiP Node AD-NODE AD-NODE
Optional SNiP Extensions Precipitation,
of Parameters: Soil Moisture
Canopy Light SNiP-CLI SNiP-CLI2
Interception SNiPs
SNiP Measures Canopy Light Interception
Core Sensor/Device SQ-110 (1) + SQ-110 (1) +
(No. of Sensing Points) SQ-311 (10) LINPAR (33)
SNiP Node MFR-NODE
Mounting / Power SPLM7 / SP10
Optional SNiP
Microclimate
Extensions:
ICT INTERNATIONAL 35Vegetation Indices & Disease Monitoring
Rain Gauge
PRP-02 pg. 45
ICT
S-NODE
pg. 77
ICT-LWS
Leaf Wetness & Disease Monitoring pg. 36
Leaf wetness refers to the presence of free water on
the canopy, and is caused by intercepted rainfall, dew,
or guttation. The duration of the time period during ATH-2S
which the leaves are wet is generally referred to as Air Temp
Humidity pg. 52
leaf wetness duration (LWD). Leaf wetness is a concern
for the development of disease and the dispersal of
pathogens; LWD is an important input (along with
temperature) in many crop disease models which are
used for determining the appropriate time for the use
of preventative measures, such as fungicide application.
Leaf Wetness SNiP SNiP-LWS
Core Sensor/Device ICT-LWS
Wetness Range 0-100%
Temperature Range -40 to 80°C
UOM mA
Measurement Range 4 to 20 mA
SNiP Node AD-NODE
Tipping Bucket
SNiP Sensor Extensions Rain Gauge
Ambient Temperature
Vineyard Installation - MP406 Sensors Augered
36 ICT INTERNATIONAL Soil 4-17 Plant 18-43 Meteorological 44-55 Hydrological 56-63 Urban & Industrial 64-69You can also read