Natural Resource Stewardship Monitoring and Assessment Report for the Wet'suwet'en Hereditary Territory
←
→
Page content transcription
If your browser does not render page correctly, please read the page content below
Natural Resource Stewardship
Monitoring and Assessment Report for
 the Wet’suwet’en Hereditary Territory

Developed by:   The Ministry of Forests, Lands,
                Natural Resource Operations
                and Rural Development

Reviewed by:    Office of the Wet’suwet’en &
                Wet’suwet’en First Nation         Min
                                                  Natu
                November 2017                     and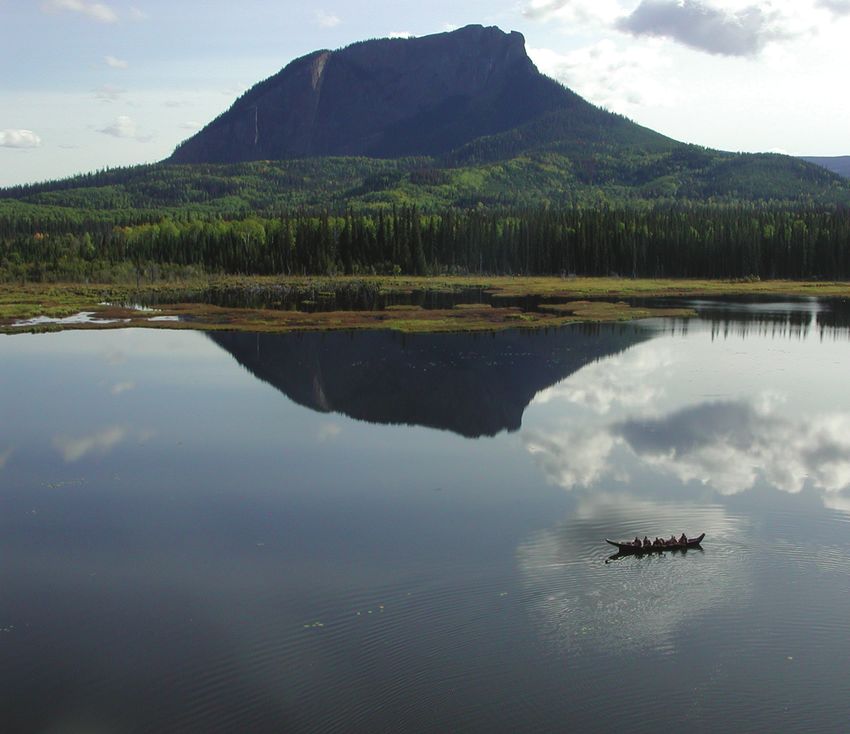
Cover photo credit David Dewit
Table of Contents
Report Context  .  .  .  .  .  .  .  .  .  .  .  .  .  .  .  .  .  .  .  .  .  .  .  .  .  .  .  .  .  .  .  .  .  .  .  .  .  .  .  .  .  .  .  .  .  .  .  .  .  .  .  .  .  .  .  .  .  .  .  .  .  .  .  .  .  .  .  .  .  .  .          1
Sources of Information .  .  .  .  .  .  .  .  .  .  .  .  .  .  .  .  .  .  .  .  .  .  .  .  .  .  .  .  .  .  .  .  .  .  .  .  .  .  .  .  .  .  .  .  .  .  .  .  .  .  .  .  .  .  .  .  .  .  .  .  .  .  .  .  .  .                  2
List of Acronyms .  .  .  .  .  .  .  .  .  .  .  .  .  .  .  .  .  .  .  .  .  .  .  .  .  .  .  .  .  .  .  .  .  .  .  .  .  .  .  .  .  .  .  .  .  .  .  .  .  .  .  .  .  .  .  .  .  .  .  .  .  .  .  .  .  .  .  .  .  .            2
Resource Value Assessment Classifications and Meanings .  .  .  .  .  .  .  .  .  .  .  .  .  .  .  .  .  .  .  .  .  .  .  .  .  .  .  .  .  .  .  .  .  .  .  .  .  .  .  .  .  .  .                                                       3
Wet’suwet’en Context .  .  .  .  .  .  .  .  .  .  .  .  .  .  .  .  .  .  .  .  .  .  .  .  .  .  .  .  .  .  .  .  .  .  .  .  .  .  .  .  .  .  .  .  .  .  .  .  .  .  .  .  .  .  .  .  .  .  .  .  .  .  .  .  .  .  .                 3
Wet’suwet’en Hereditary Territory Environmental and Stewardship Context  .  .  .  .  .  .  .  .  .  .  .  .  .  .  .  .  .  .  .  .  .  .  .  .  .  .  .  .  .  .                                                                            4
Wet’suwet’en Commentary .  .  .  .  .  .  .  .  .  .  .  .  .  .  .  .  .  .  .  .  .  .  .  .  .  .  .  .  .  .  .  .  .  .  .  .  .  .  .  .  .  .  .  .  .  .  .  .  .  .  .  .  .  .  .  .  .  .  .  .  .  .  .  .                       6
Provincial Government Statutory Decision Maker Commentary .  .  .  .  .  .  .  .  .  .  .  .  .  .  .  .  .  .  .  .  .  .  .  .  .  .  .  .  .  .  .  .  .  .  .  .  .  .  .  .                                                             7
Monitoring Results In Brief .  .  .  .  .  .  .  .  .  .  .  .  .  .  .  .  .  .  .  .  .  .  .  .  .  .  .  .  .  .  .  .  .  .  .  .  .  .  .  .  .  .  .  .  .  .  .  .  .  .  .  .  .  .  .  .  .  .  .  .  .  .  .                      9
Monitoring and Assessment Results: Fish and Water .  .  .  .  .  .  .  .  .  .  .  .  .  .  .  .  .  .  .  .  .  .  .  .  .  .  .  .  .  .  .  .  .  .  .  .  .  .  .  .  .  .  .  .  .  .                                                  10
     Riparian (Fish) Habitat Value  .  .  .  .  .  .  .  .  .  .  .  .  .  .  .  .  .  .  .  .  .  .  .  .  .  .  .  .  .  .  .  .  .  .  .  .  .  .  .  .  .  .  .  .  .  .  .  .  .  .  .  .  .  .  .  .  .  .                            10
     Fish Passage Value .  .  .  .  .  .  .  .  .  .  .  .  .  .  .  .  .  .  .  .  .  .  .  .  .  .  .  .  .  .  .  .  .  .  .  .  .  .  .  .  .  .  .  .  .  .  .  .  .  .  .  .  .  .  .  .  .  .  .  .  .  .  .  .  .  .                12
     Water Quality (Sediment) Value .  .  .  .  .  .  .  .  .  .  .  .  .  .  .  .  .  .  .  .  .  .  .  .  .  .  .  .  .  .  .  .  .  .  .  .  .  .  .  .  .  .  .  .  .  .  .  .  .  .  .  .  .  .  .  .  .                               13
     Benthic Invertebrates Value  .  .  .  .  .  .  .  .  .  .  .  .  .  .  .  .  .  .  .  .  .  .  .  .  .  .  .  .  .  .  .  .  .  .  .  .  .  .  .  .  .  .  .  .  .  .  .  .  .  .  .  .  .  .  .  .  .  .  .                           14
     Water Quality Index Value .  .  .  .  .  .  .  .  .  .  .  .  .  .  .  .  .  .  .  .  .  .  .  .  .  .  .  .  .  .  .  .  .  .  .  .  .  .  .  .  .  .  .  .  .  .  .  .  .  .  .  .  .  .  .  .  .  .  .  .  .                        15
     Fisheries Sensitive Watersheds Value  .  .  .  .  .  .  .  .  .  .  .  .  .  .  .  .  .  .  .  .  .  .  .  .  .  .  .  .  .  .  .  .  .  .  .  .  .  .  .  .  .  .  .  .  .  .  .  .  .  .  .  .  .                                    16
     Risk to Fish Habitat (Skeena Salmon) Value .  .  .  .  .  .  .  .  .  .  .  .  .  .  .  .  .  .  .  .  .  .  .  .  .  .  .  .  .  .  .  .  .  .  .  .  .  .  .  .  .  .  .  .  .  .  .  .  .                                           17
Monitoring and Assessments Results: Social and Economic  .  .  .  .  .  .  .  .  .  .  .  .  .  .  .  .  .  .  .  .  .  .  .  .  .  .  .  .  .  .  .  .  .  .  .  .  .  .  .  .  .                                                          18
     Cultural Heritage Value .  .  .  .  .  .  .  .  .  .  .  .  .  .  .  .  .  .  .  .  .  .  .  .  .  .  .  .  .  .  .  .  .  .  .  .  .  .  .  .  .  .  .  .  .  .  .  .  .  .  .  .  .  .  .  .  .  .  .  .  .  .  .                    18
     Timber Value .  .  .  .  .  .  .  .  .  .  .  .  .  .  .  .  .  .  .  .  .  .  .  .  .  .  .  .  .  .  .  .  .  .  .  .  .  .  .  .  .  .  .  .  .  .  .  .  .  .  .  .  .  .  .  .  .  .  .  .  .  .  .  .  .  .  .  .  .  .          19
     Visual Quality Value .  .  .  .  .  .  .  .  .  .  .  .  .  .  .  .  .  .  .  .  .  .  .  .  .  .  .  .  .  .  .  .  .  .  .  .  .  .  .  .  .  .  .  .  .  .  .  .  .  .  .  .  .  .  .  .  .  .  .  .  .  .  .  .  .                 20
Monitoring and Assessments Results: Wildlife  .  .  .  .  .  .  .  .  .  .  .  .  .  .  .  .  .  .  .  .  .  .  .  .  .  .  .  .  .  .  .  .  .  .  .  .  .  .  .  .  .  .  .  .  .  .  .  .  .  .                                          21
     Moose Value .  .  .  .  .  .  .  .  .  .  .  .  .  .  .  .  .  .  .  .  .  .  .  .  .  .  .  .  .  .  .  .  .  .  .  .  .  .  .  .  .  .  .  .  .  .  .  .  .  .  .  .  .  .  .  .  .  .  .  .  .  .  .  .  .  .  .  .  .  .           21
     Mountain Goat Value .  .  .  .  .  .  .  .  .  .  .  .  .  .  .  .  .  .  .  .  .  .  .  .  .  .  .  .  .  .  .  .  .  .  .  .  .  .  .  .  .  .  .  .  .  .  .  .  .  .  .  .  .  .  .  .  .  .  .  .  .  .  .  .                     23
     Grizzly Bear Value .  .  .  .  .  .  .  .  .  .  .  .  .  .  .  .  .  .  .  .  .  .  .  .  .  .  .  .  .  .  .  .  .  .  .  .  .  .  .  .  .  .  .  .  .  .  .  .  .  .  .  .  .  .  .  .  .  .  .  .  .  .  .  .  .  .                24
     Northern Goshawk Value .  .  .  .  .  .  .  .  .  .  .  .  .  .  .  .  .  .  .  .  .  .  .  .  .  .  .  .  .  .  .  .  .  .  .  .  .  .  .  .  .  .  .  .  .  .  .  .  .  .  .  .  .  .  .  .  .  .  .  .  .  .                        26
Monitoring and Assessments Results: Forest, Biodiversity and Air Quality  .  .  .  .  .  .  .  .  .  .  .  .  .  .  .  .  .  .  .  .  .  .  .  .  .  .  .  .  .  .  .                                                                       27
     Stand-level Biodiversity Value .  .  .  .  .  .  .  .  .  .  .  .  .  .  .  .  .  .  .  .  .  .  .  .  .  .  .  .  .  .  .  .  .  .  .  .  .  .  .  .  .  .  .  .  .  .  .  .  .  .  .  .  .  .  .  .  .  .                            27
     Soils Value .  .  .  .  .  .  .  .  .  .  .  .  .  .  .  .  .  .  .  .  .  .  .  .  .  .  .  .  .  .  .  .  .  .  .  .  .  .  .  .  .  .  .  .  .  .  .  .  .  .  .  .  .  .  .  .  .  .  .  .  .  .  .  .  .  .  .  .  .  .  .        28
     Air Quality Value .  .  .  .  .  .  .  .  .  .  .  .  .  .  .  .  .  .  .  .  .  .  .  .  .  .  .  .  .  .  .  .  .  .  .  .  .  .  .  .  .  .  .  .  .  .  .  .  .  .  .  .  .  .  .  .  .  .  .  .  .  .  .  .  .  .  .              29
     Forest Practices Board Compliance Audits Value .  .  .  .  .  .  .  .  .  .  .  .  .  .  .  .  .  .  .  .  .  .  .  .  .  .  .  .  .  .  .  .  .  .  .  .  .  .  .  .  .  .  .  .  .  .                                                31
     Landscape-Level Biodiversity Value  .  .  .  .  .  .  .  .  .  .  .  .  .  .  .  .  .  .  .  .  .  .  .  .  .  .  .  .  .  .  .  .  .  .  .  .  .  .  .  .  .  .  .  .  .  .  .  .  .  .  .  .  .  .                                   32
Resource Stewardship Effectiveness Results Comparison  .  .  .  .  .  .  .  .  .  .  .  .  .  .  .  .  .  .  .  .  .  .  .  .  .  .  .  .  .  .  .  .  .  .  .  .  .  .  .  .  .  .  .                                                      34
Appendix 1 – Summary Description of Resource Development Impact Rating Criteria .  .  .  .  .  .  .  .  .  .  .  .  .  .  .  .  .  .  .  .  .  .  .  .                                                                                      35
Appendix 2 – Comparative FREP Results by Resource Value for other AREAS .  .  .  .  .  .  .  .  .  .  .  .  .  .  .  .  .  .  .  .  .  .  .  .  .  .  .  .  .  .                                                                            44
Appendix 3 – Information Source Details  .  .  .  .  .  .  .  .  .  .  .  .  .  .  .  .  .  .  .  .  .  .  .  .  .  .  .  .  .  .  .  .  .  .  .  .  .  .  .  .  .  .  .  .  .  .  .  .  .  .  .  .  .                                      45
Appendix 4 – Locations of FREP Samples  .  .  .  .  .  .  .  .  .  .  .  .  .  .  .  .  .  .  .  .  .  .  .  .  .  .  .  .  .  .  .  .  .  .  .  .  .  .  .  .  .  .  .  .  .  .  .  .  .  .  .  .  .                                       46
Appendix 5 – Stream Crossing Locations Assessed and Impact Ratings Within the Wet’suwet’en Territories .  .  .  .  .  .  .  .  .                                                                                                            47
Appendix 6 – CABIN Sample Sites Within the Wet’suwet’en Territories .  .  .  .  .  .  .  .  .  .  .  .  .  .  .  .  .  .  .  .  .  .  .  .  .  .  .  .  .  .  .  .  .  .                                                                    48
Appendix 7 – Fish Sensitive Watershed Samples .  .  .  .  .  .  .  .  .  .  .  .  .  .  .  .  .  .  .  .  .  .  .  .  .  .  .  .  .  .  .  .  .  .  .  .  .  .  .  .  .  .  .  .  .  .  .  .  .                                             49
Appendix 8 – Fish Habitat Risk Ratings for Skeena River watersheds in the Wet’suwet’en Territories .  .  .  .  .  .  .  .  .  .  .  .  .  .                                                                                                 50
Appendix 9 – Key to British Columbia Riparian Stream Classification .  .  .  .  .  .  .  .  .  .  .  .  .  .  .  .  .  .  .  .  .  .  .  .  .  .  .  .  .  .  .  .  .  .  .                                                                 51
Appendix 10 – Proposed Air Management Threshold Values  .  .  .  .  .  .  .  .  .  .  .  .  .  .  .  .  .  .  .  .  .  .  .  .  .  .  .  .  .  .  .  .  .  .  .  .  .  .  .  .  .                                                           52
Appendix 11 – Data used in the Landscape-Level Biodiversity Account .  .  .  .  .  .  .  .  .  .  .  .  .  .  .  .  .  .  .  .  .  .  .  .  .  .  .  .  .  .  .  .  .                                                                       53
Endnotes  .  .  .  .  .  .  .  .  .  .  .  .  .  .  .  .  .  .  .  .  .  .  .  .  .  .  .  .  .  .  .  .  .  .  .  .  .  .  .  .  .  .  .  .  .  .  .  .  .  .  .  .  .  .  .  .  .  .  .  .  .  .  .  .  .  .  .  .  .  .  .  .  .  .  .   54
References .  .  .  .  .  .  .  .  .  .  .  .  .  .  .  .  .  .  .  .  .  .  .  .  .  .  .  .  .  .  .  .  .  .  .  .  .  .  .  .  .  .  .  .  .  .  .  .  .  .  .  .  .  .  .  .  .  .  .  .  .  .  .  .  .  .  .  .  .  .  .  .  .  .     56

Natural Resource Values Monitoring and Assessment Report for the Wet’suwet’en Hereditary Territory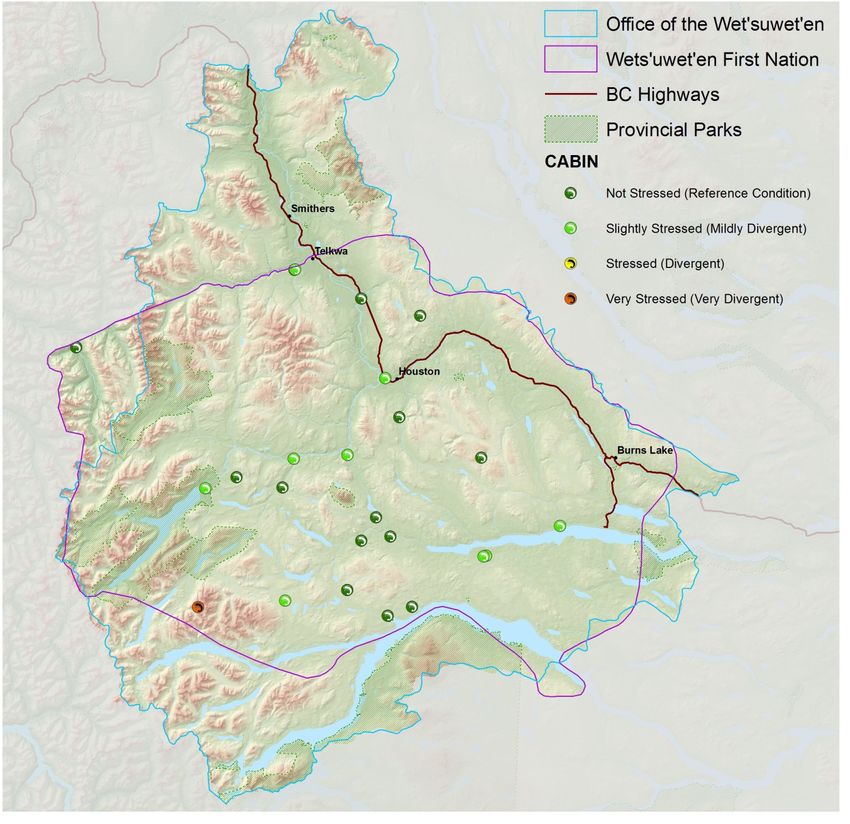
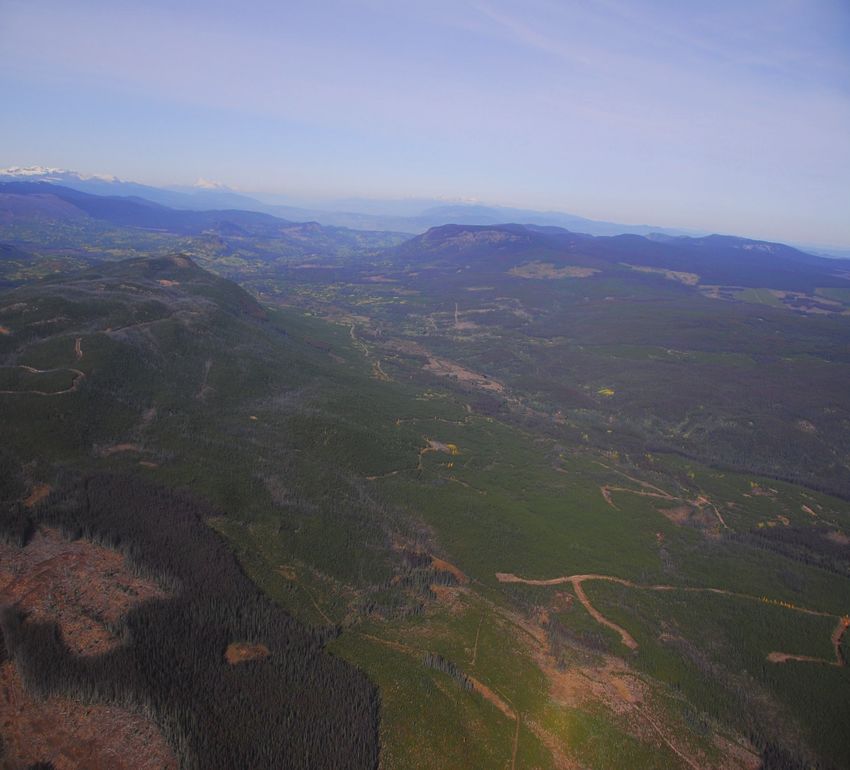
Figure 1: Wet’suwet’en Hereditary Territories context map.

                                      Natural Resource Values Monitoring and Assessment Report for the Wet’suwet’en Hereditary Territory
Report Context
Natural Resource Stewardship Monitoring and Assessment                         There are two levels of results presented in this report –
Reports are a summary of existing resource value                               site level and landscape/watershed level. Site-level
monitoring and assessment information for a given                              assessments are generally “boots on the ground”
geographic area such as a Natural Resource District or First                   assessments that observe impacts at localized sites, such
Nation hereditary territory. For each resource value, or                       as where a road crosses a stream, an individual forestry
source of information, there is a one-two page summary                         cutblock, or other industrial development. Landscape or
of status, trends, causal factors, and opportunities for                       watershed-level assessments are usually an office-based
improvement. In addition, each report contains a Provincial                    GIS analysis. Site-level assessments are often used to
government statutory decision maker commentary on                              validate landscape-level assessments.
government expectations for the management of those
natural resource values. In the case of First Nation’s                         Data has been arranged in the following categories:
territory reports, there is also a First Nation’s commentary.                  Fish and Water
Each source of information is referenced in a way that                         •    Riparian (Fish) Habitat (FREP)
describes the data age, sample design, and where more
detailed information can be found.                                             •    Fish Passage (FLNRORD/MOE)
                                                                               •    Water Quality (Sediment) (FREP)
The purpose of these reports is to present available
monitoring and assessment information in a single                              •    Benthic Invertebrates (MOE)
document to help inform multiple levels of decision making                     •    Water Quality Index (MOE)
and facilitate resource stewardship dialogue based on a
                                                                               •    Fisheries Sensitive Watersheds (FREP)
common understanding of the status, trends and causal
factors associated with resource values. The primary target                    •    Risk to Fish Habitat (Skeena Salmon)
audience is government decision makers, First Nations, and
                                                                               Social and Economic
resource industries.
                                                                               •    Cultural Heritage (FREP)
Specifically, this document is intended to:
                                                                               •    Timber (FREP)
•    Provide transparency and accountability for the
                                                                               •    Visual Quality (FREP)
     management of public resources;
•    Provide information to help inform balanced decision                      Wildlife
     making in consideration of environmental, social, and                     •    Moose (MOE)
     economic factors; and
                                                                               •    Mountain Goat (MOE)
•    Guide ongoing improvement of resource management
                                                                               •    Grizzly Bear (MOE)
     practices, policies and legislation.
                                                                               •    Northern Goshawk (Consultant)
All natural resource development affects ecosystem
conditions. The role of natural resource monitoring                            Forests, Biodiversity and Air Quality
and assessments is to assess the impacts of resource                           •    Stand-level Biodiversity (FREP)
development and or natural factors, identify the status
                                                                               •    Soils (FREP)
and trends of British Columbia’s natural resource values,
and identify related causal factors and opportunities for                      •    Air Quality (MOE)
ongoing resource management improvement.                                       •    Forest Practices Board Compliance Audits
                                                                               •    Landscape-Level Biodiversity

Natural Resource Values Monitoring and Assessment Report for the Wet’suwet’en Hereditary Territory                                          1
This report summarizes monitoring results for the                   results that meets these interests. The Provincial
Wet’suwet’en Hereditary Territory as defined by the asserted        government statutory decision maker commentary in
traditional boundaries of the Office of the Wet’suwet’en            this report is intended to clarify government’s resource
(Hereditary Chiefs) and the Wet’suwet’en First Nation1. The         stewardship expectations, and promote the open and
Wet’suwet’en context and commentary sections assist in              transparent discussion needed to achieve short- and long-
identifying the Aboriginal interests of the Wet’suwet’en            term sustainable resource management in British Columbia.
people and the success of resource managers in achieving

Sources of Information
This report contains monitoring information from a variety          will be further improved and other reliable monitoring data
of sources within the Wet’suwet’en Hereditary Territories.          will become available for future reports.
Not all data have the same level of scientific rigour and
this is noted in each data summary and in Figure 2 on               A brief description of the data source is provided with the
page 9. Over time, it is expected that these data sources           results for each resource value. Appendix 3 details the
                                                                    original data source, reports, web links, and contact names.

List of Acronyms
AQHI      Air Quality Health Index                                  GIS         Geographic Information System
BEAST     Benthic Assessment of Sediment                            GMZ         Game Management Zone
BEC       Biogeoclimatic Ecosystem Classification                   H60         the elevation above which 60% of a watershed lies
BVLD      Bulkley Valley/Lakes District                             LBIS        Land Based Investment Strategy
CABIN     Canadian Aquatic Biomonitoring Network                    LRMP        Land and Resource Management Plan
CCME      Canadian Conference on Medical Education                  MPB         Mountain Pine Beetle
CHR       Cultural Heritage Resource                                MRVA        Multiple Resource Value Assessment
CMT       Culturally Modified Tree                                  MU          Management Unit
ECA       Equivalent Clearcut Area                                  NO2         Nitrogen Dioxide
FDP       Forest Development Plan                                   O3          Ozone
FLNRORD Ministry of Forests, Lands, Natural Resource                PM2.5       Fine Particulate Matter
        Operations and Rural Development                            SDM         Stand Development Monitoring
FPB       Forest Practices Board                                    SP          Site Plan
FPC       Forest Practice Code                                      THLB        Timber Harvesting Land Base
FPPR      Forest Planning and Practices Regulation                  TSA         Timber Supply Area
FREP      Forest and Range Evaluation Program                       TSS         Target Stocking Standard
FRPA      Forest and Range Practices Act                            VQO         Visual Quality Objective
FSR       Forest Service Road                                       VRI         Vegetation Resources Inventory
FSW       Fisheries Sensitive Watershed                             WQI         Water Quality Index

2                                           Natural Resource Values Monitoring and Assessment Report for the Wet’suwet’en Hereditary Territory
Resource Value Assessment Classifications and Meanings
Much of the information in this report summarizes site-                        and monitoring activities. Some of the key cultural values
level field-based assessments that inform us of the                            that support aboriginal rights have not been incorporated
ecological condition of resource values. The results of                        into this report; however, the intent is to incorporate
site-level assessments are confined to the working landbase                    such values, as identified by the Wet’suwet’en, in future
and do not include the ecological contribution of parks and                    reports. With additional data collection, the scale at which
other protected areas. The landscape-level assessments in                      monitoring information is reported can be further enhanced
this report include the entire forested landbase including                     to better reflect local information and decision making
parks and commercial forest. The “natural cause and                            needs. For a description of the criteria used for determining
resource development impact ratings “indicate the effect                       resource development and natural causes impact ratings,
of resource development (e.g., forest harvesting) and                          see Appendix 1.
natural impacts (e.g., forest health and flood events) on
individual resource values. The “very low” and “low” impact                    The presentation style used in this report includes an
ratings are considered consistent with the Province’s goal                     “Impact Ratings” diagram illustrating the effect of resource
of sustainable resource management. Through the use                            development and natural impacts on the resource value,
of impact ratings, resource managers/decision makers                           from “very low” to “high” impact. The “Summary” presents
can apply the “consequence” lens (social, economic,                            a descriptive outline of the monitoring results. The “Causal
environmental) to better understand and be able to make                        Factors” for the impact ratings are derived from field-based
decisions based on defining overall acceptable risk levels                     data and/or an interpretation of potential reasons for the
to each of the resource values.                                                state of the value. The “Opportunities for Improvement” are
                                                                               based on practices that resulted in the best outcomes and
The information presented in this report that is focused                       (or) expert knowledge.
on the ecological state of the values provides useful
information to resource managers and other professionals                       Where sufficient2 data is available, the “Overall Stewardship
on the outcomes of plans and practices. Additional                             Trend” shows trends between time periods. A chi-squared
information is provided to enhance the broader context of                      test, which determines a probability value, is used to
the ecological state of the land base for future management                    determine trends between sampling eras for riparian, water
                                                                               quality, stand-level biodiversity, and visual quality results.

Wet’suwet’en Context
The Wet’suwet’en people are a matrilineal society organized                    within the Wet’suwet’en that local populations of moose,
into five clans: Gilseyhu (Big Frog), Laksilyu (Small Frog),                   bear and fish are on the decline and that these declines
Gitdumden (Wolf/Bear), Laksamshu (Fireweed), and Tsayu                         may affect the sustainability of the House territories.
(Beaver Clan). Within each clan are a number of kin-based
groups known as Yikhs or House groups. Each House group                        The Wet’suwet’en are also concerned that risks to
has jurisdiction over one or more House territories. In the                    sustainability can only increase with the cumulative
Wet’suwet’en area, there are 38 House territories managed                      impacts of timber harvest, natural disturbances, proposed
by 13 House groups and 13 Hereditary Chiefs.                                   large-scale linear developments (e.g. oil and gas pipelines),
                                                                               and climate change.
From a Wet’suwet’en perspective, a head Chief’s task is to
ensure the House territory is managed in a responsible,                        Cultural heritage features include seasonal and permanent
sustainable manner so that each House territory will                           village sites, major trade and territorial access trail
always produce enough game, fish, berries and medicines                        networks and associated cache pits and culturally modified
to support the subsistence, trade, and customary needs of                      trees, grave sites, cabins, spiritual sites (pictographs,
house members. The main game animals the Wet’suwet’en                          Nadina Mountain), and footprints (human/grizzly)
hunt for food are moose, deer and bear. There is concern                       embedded into the ground.

Natural Resource Values Monitoring and Assessment Report for the Wet’suwet’en Hereditary Territory                                         3
The Wet’suwet’en Territory is home to a wide variety of               used include fibrous plants, wood, dyes, and pigments.
diverse wildlife and fish populations. Larger game animals            The Wet’suwet’en use about sixty plants for food, mostly
include grizzly and black bear, caribou, mountain goat,               harvested in forest or woodland settings.
moose, deer, wolves, and coyote. Smaller game known to
be of importance to the Wet’suwet’en include marmots,                 The salmon fishery is a central focus of Wet’suwet’en
beaver, snowshoe hares, muskrats, squirrel, marten, weasel,           culture, sustenance, and trade. Wet’suwet’en laws governing
lynx, groundhogs, and grouse. Anadromous fish include                 Wet’suwet’en resources generally (fishing specifically)
chinook, steelhead, coho, pink and sockeye salmon, as well            are based on values founded on thousands of years of
as Pacific lamprey and bull trout. Freshwater fish include            interacting with social, subsistence, and local environment
white sturgeon, kokanee, burbot, lake trout, mountain                 dynamics. Subsistence activities are tightly interwoven
whitefish, suckers, northern pikeminnow, dace, sculpin,               within the social structure of the Wet’suwet’en and their
lake trout, Dolly Varden, chub, and rainbow trout. Morice             territories. The Wet’suwet’en mandate is for sustainable
sockeye are the largest and most important sockeye stock              resource management practices which support cultural
in the Bulkley/Nanika/Atna/Upper Bulkley/McDonnell/                   strengthening, revitalization, and continuity.
Dennis basin.
                                                                      The intent is to provide the maximum amount of security
The Wet’suwet’en use an array of plant species for food,              for sustaining salmon, wildlife, and the natural food
medicine, and cultural purposes. Plant foods include                  supply necessary for the health and well-being of the
green vegetables, fruits and berries, inner bark–cambium,             Wet’suwet’en. The Land (Yintahk) continues to be at
roots and rhizomes, mushrooms, and a few beverages.                   the center of Wet’suwet’en life and culture and must be
Medicines are derived from plant leaves, foliage, roots, and          managed in a way that is adherent of Wet’suwet’en people,
inner barks from a variety of species. Cultural materials             laws, and traditions.

Wet’suwet’en Hereditary Territory Environmental and Stewardship Context
In the 2.2 million hectares included within the                       Landscapes within the Wet’suwet’en Territory are subject
Wet’suwet’en Hereditary Territory, there is a population              to frequent and large fire-related disturbances. The China
of approximately 25,000 people, of which 5000 are                     Nose (3500 ha), Eutsuk Lake (3750 ha), and Atna Lake
Wet’suwet’en. The population resides in rural areas, larger           (2400 ha) wildfires are recent examples. Native burning
communities including Smithers, Telkwa, Houston, and                  was historically practiced to manage plant communities
Burns Lake, and First Nations communities including                   (berries, shrubs, nutritious herbs) and to enhance wildlife
Hagwilget, Moricetown, Wet’suwet’en Village, Broman Lake,             habitats for population management. The majority of
Decker Lake, and Francois Lake.                                       the Bulkley River valley bottom and lower uplands were
                                                                      systematically burned until the 1930s, resulting in expanses
The Wet’suwet’en Territory overlies two Natural Resource              of prairie, open meadows, and berry patches.
Districts: Skeena Stikine District (a portion of Bulkley TSA)
and Nadina District (portions of Morice and Lakes TSAs).              Forests are comprised primarily of subalpine fir-, pine- and
                                                                      spruce-leading stands, with extensive areas of deciduous
The Wet’suwet’en Territory transitions coastal and interior           forest occurring through the Bulkley River valley. The
climates, and is ecologically diverse: the Sub-Boreal Spruce          timber harvesting land base is dominated by pine- and
biogeoclimatic zone dominates, with Engelmann Spruce-                 spruce-leading stands.
Sub-Alpine Fir (ESSF) a distant second in area. Terrain
ranges from flat to mountainous, with numerous coastal                The Wet’suwet’en Territory is found at the northwest extent
outlet valleys present along the western boundary. Interior           of the recent mountain pine beetle (MPB) epidemic. The
plateaus with large lakes predominate. The Bulkley River              epidemic resulted in the mortality of approximately 80% of
and the majority of its tributaries are present, draining             mature pine in the Lakes TSA, 50% in the Morice TSA, and
northwest to the Skeena River. The Nechako River is also              30% in the Bulkley TSA. It is estimated that by 2019, most
present, draining southeast to its confluence with the                of the MPB-killed timber will be unmerchantable, leading
Fraser River near Prince George.                                      to several decades of significant timber supply shortfalls in
                                                                      the Lakes and Morice TSA portions of the Wet’suwet’en area.

4                                             Natural Resource Values Monitoring and Assessment Report for the Wet’suwet’en Hereditary Territory
There is a culture of respect for strategic planning. Local                    Pacific Inland Resources mill in Smithers, the Canadian
planning processes led to the establishment of legal land-                     Forest Products mill in Houston, and the Hampton
use objectives for landscape-level biodiversity, habitat                       Affiliates’ Decker Lake and Babine Forest Products mills. The
connectivity, and wildlife tree retention within two of the                    Huckleberry Mine is a significant mining sector employer.
three TSAs comprising the Wet’suwet’en Territory. In the
late 1990s, the provincial government and the Wet’suwet’en                     There is increased interest in full utilization of mill
also engaged in landscape-level planning, resulting in                         residues, and in utilizing non-traditional fibre sources
valuable dialogue and the identification of specific value                     such as small-diameter, high density stands close to larger
and feature locations (e.g. wildlife wintering and natal                       communities along the Highway 16 corridor. Two Pinnacle-
areas, caribou migration corridors, trail and cultural feature                 owned pellet mills now set up in Houston and Burns Lake
locations, etc.).                                                              are taking advantage of these “new” fibre opportunities.

The agriculture, forestry and mining sectors provide the                       Management of potential forest fire fuels, in particular
majority of employment within the area. Sawmills that                          near the public/private land interface needs careful future
provide significant employment include the West Fraser –                       attention, and is becoming a priority that involves various
                                                                               levels of government.

Natural Resource Values Monitoring and Assessment Report for the Wet’suwet’en Hereditary Territory                                        5
Wet’suwet’en Commentary
It is important to note what the Natural Resource scientific and cultural principles will allow decision makers
Stewardship Monitoring and Assessment Reports are and to adapt to changing social expectations and demands
what they are not. Natural resource values that solely rely on Wet’suwet’en territories. Only then can the realities
on FREP results only evaluate “recently” harvested areas by of reconciliation and cooperative management reflect
random sampling. This method does provide some insight sustainable land-use objectives.
into how modern forest practices are affecting natural
resource values at the site level in recently harvested Wet’suwet’en Hereditary Chiefs want to ensure that their
areas. What this method does not do is provide insight into cultural and traditional interests are understood and
how forestry has affected natural resource values at the managed. This can only be achieved through effective
landscape level, or how resource development as a whole consultation processes that result in awareness and
has affected natural resource values. comprehension of Wet’suwet’en values and principles,
which honor Wet’suwet’en Law (Inuk Nu’at’en “our laws”).
As the Timber Harvesting Land Base declines, it is It must be recognised that the Office of the Wet’suwet’en
important to evaluate, make decisions and enhance does not have a Forest Consultation and Revenue Sharing
management practices based on the condition of the Agreement, yet we are actively engaged and committed to
landscape and the ecological condition. To achieve this, culturally sustainable management of our territory.
the FREP sampling design needs to change or incorporate
sampling results from historic forestry development areas. Key habitat features of traditionally used species, that
are sensitive to anthropogenic impacts, need protection
It is also important to recognise that natural resource values and management practices that support their biological
are provincially selected and do not necessarily represent fitness. Maintaining structural biodiversity that supports
Wet’suwet’en or other First Nations values which support Wet’suwet’en values with supporting data allows for a
their practice of aboriginal rights and title. The Skeena reasonable assessment of impacts on the Wet’suwet’en
Sustainability Assessment Forum is currently developing territories; this is required for consultation purposes. The
protocols to evaluate and assess five First Nation-specific land provides for the people; better management practices
values. It is highly recommended to utilise these protocols will benefit those who rely on these resources.
and values once completed in future Natural Resource
Stewardship Monitoring and Assessment Reports. First Nations depend on their territories for their cultural
needs, and are among the most vulnerable with respect
Our landscape is experiencing noticeable changes from to effects of industrial development. It is imperative
resource development and changes due to climate change. that we work together to make a better future, as not all
Effective monitoring and assessment is required to quantify resources are renewable, and we have a responsibility to
impacts to our ecosystems, as these impacts limit the our children yet to be born. The Wet’suwet’en objective is
ability for First Nations to exercise their aboriginal rights to work within the consultation, monitoring, assessment,
and practices. Management practices need to be modified and restoration processes; however, the processes must
to mitigate these impacts, and restoration activities include Wet’suwet’en interests for collaborative sound
need to be supported by both government and industry. decision making.
As better information becomes available, applying both
6 Natural Resource Values Monitoring and Assessment Report for the Wet’suwet’en Hereditary TerritoryProvincial Government Statutory Decision Maker Commentary 3
This document makes a significant step forward in the (e.g.) future collaborative monitoring projects, and
reporting of natural resource value monitoring. Natural potential environmental mitigation project types and
Resource Stewardship Monitoring and Assessment Reports specific areas.
present an assemblage of monitoring information including
data collected through the Forest and Range Evaluation Decision makers are charged with considering the
Program (FREP) and other sources. FREP monitoring was cumulative effect of activities on environmental, economic
established as one of the foundations of the Forest and and social values prior to reaching new resource decisions.
Range Practices Act (FRPA) oversight framework to assess This is a challenging task with multiple natural resource
the delivery of the resource value objectives established uses occurring simultaneously over the landbase, and
by the Act. The FRPA legislation regulates Forest and increasing environmental and social pressures. Monitoring
Range practices on public lands within the Province and results, considered in combination with objectives set by
establishes 11 resource values with specific objectives4 that government with established indicators/ thresholds can
must be achieved by Forest and Range based activities. assist with this.
This report, includes an expanded suite of values and Notwithstanding its limitations, this report has several
monitoring information. While some of this is strongly key uses: as a vehicle for dialogue with the Wet’suwet’en
linked to the forest sector (FREP), others such as water people regarding the present status of some commonly-held
quality, air quality, and landscape level biodiversity report values within their territory, as a means of communicating
out on broader landscape conditions. with forestry and non-forestry clients on sub-regional
This report has deliberately been assembled in a different values management issues and trends, and as a cumulative
way than previous versions, it uses the identified effects decision support tool for FLNRORD decision makers.
traditional territory of the Wet’suwet’en people as its In the context of the FRPA, results-based model of legal
geographical extent. This has been done as a step forward requirements and professional reliance, more specific
to working with the Wet’suwet’en as partners, in assembling commentary on values known to be of interest to
information on resource values within their territory and on Wet’suwet’en, and on management actions being employed
the indicators of how those values are being influenced by to address them are as follows:
resource development.
• For Cultural Heritage monitoring we acknowledge
Due to a lack of existing data, some of the key cultural the Wet’suwet’en comments regarding the need to
values that support the practices of aboriginal rights broaden the scope of our monitoring to better reflect
have not been incorporated into this report; however, First Nations values. Results collected to date show
the intent is to incorporate such values, as identified by that impact ratings are improving over time, with a
Wet’suwet’en, in future reports. Over time, with additional decrease in “high” and “medium” ratings combined
data, the values being reported on and the scale at which with an increased in “very low” ratings. The best
monitoring information is reported can be refined to best outcomes for cultural heritage were associated with
reflect local information and decision making needs. This exclusion of cultural features from harvest areas
report is a first step towards creation of a reporting tool (modifying block boundaries, wildlife tree patches
that reflects commonly-held values, in a simple format, and riparian reserves), stubbing of CMT’s was
designed to inform resource management decision making effective, as was ribboning features before harvest
and sustainable ecological and cultural values. to facilitate easy avoidance. Poorer outcomes were
associated with lack of communication between
Each monitored value defines data source, summarizes operators and planners and/or First Nations, lack of
monitoring results relative to selected indicators, makes buffers, nonwindfirm buffers and piling of logging
a statement on overall stewardship trend, and discusses debris on top of features. Actions on these results
opportunities for improvement. This information provides will include the setting of clear expectations for
solid grounding for strategic dialogue and could advise Forest licensees to address these issues, and to utilize
Natural Resource Values Monitoring and Assessment Report for the Wet’suwet’en Hereditary Territory 7best practices such as ensuring cultural heritage be prioritized for remediation works as enabled
features are placed on site plans and logging plans, by budgets. This report will also be shared with
and ribboned in the field to ensure avoidance. the administrative entities such as the Ministry of
• Stand-level Biodiversity is connected with other Transportation and Infrastructure who share the
values, including wildlife habitat and landscape-level jurisdiction over many of the identified structures.
biodiversity. This report notes that 30% of blocks • For Fisheries Sensitive Watersheds (FSW’s), this report
sampled in the FRPA era show low post-harvest states there are two designated and three candidate
levels of important stand-level biodiversity attributes FSW’s, and that the designated FSW’s (Cumming Creek
including the amount of wildlife tree retention, and Jonas Creek) are both at high risk of fish habitat
retention quality (tree size), and coarse woody debris degradation based on an analysis of nine GIS-derived
(amount and size). Consequently, Forest licensees variables. As Forest Stewardship Plans make specific
will be expected to leave a range of retention over commitments in these watersheds to mitigate this
many cutblocks and improve retention quality by risk, the effectiveness of these measures will continue
retaining higher densities of large and dead trees to be assessed and reported on in future iterations of
and coarse woody debris. Future data analysis will this assessment. Information gathered through the
provide additional context that reflects both the developing ‘Risk to Fish Habitat” indicator, will also
landscape-level condition and the requirements of help to inform these considerations.
higher-level plans.
Given this is the first report of its kind, a debrief will be
• For Fish Passage, this report notes that of 1193 conducted to ensure future reports incorporate “lessons
assessed stream crossings within the Wet’suwet’en learned” as well as:
traditional territory, 19% (226 crossings) are
considered high impact as they block or impede fish • Address the issues identified in both the Wet’suwet’en
movement. Road types include Highway 16, other and the Provincial Government Statutory Decision
public and private roads, and resource use roads Maker Commentaries;
that are within FLNRORD jurisdiction. Actions being • Add new or more information; and
employed as a result of these findings include the
• Determine where more value can be added for the
scheduling of verification of all FLNRORD administered
stewardship and decision-making purposes of resource
structures. Upon confirmation, these structures will
professionals and land managers
8 Natural Resource Values Monitoring and Assessment Report for the Wet’suwet’en Hereditary TerritoryMonitoring Results In Brief
Effective resource management requires understanding government statutory decision maker commentary.
of the condition of individual resource values and how Some of the data presented below has been labeled as
these values relate to each other. This report provides “developmental”. Developmental values fall into one or
a summary snapshot for monitoring conducted in the more of the following: they have not been reported in this
Wet’suwet’en Hereditary Territory and includes both format before, they are not fully implemented and/or they
a Wet’suwet’en commentary and a and a Provincial do not include an assessment of habitat.
Figure 2: Wet’suwet’en Hereditary Territory impact rating by resource value.
Values Monitored
Fish and Water
2005-2013 (n = 62) 3% 22% 33% 42%
Riparian (Fish) Habitat (FREP) S
1998-2004 (n = 36) 3% 10% 47% 40%
n = 1,193 19% 3% 43% 58% Fish Passage (FLNRO/MOE) S
2012-2015 (n = 112) 9% 32% 37% 22%
Water Quality (Sediment) (FREP) S
2008-2011 (n = 129) 8% 26% 28% 38%
n = 25 4% 36% 60% Benthic Invertebrates (MOE) S
n=5 80% 20% Water Quality Index (MOE) S
n=5 60% 20% 20% Fisheries Sensitive Watersheds (FREP) L
n = 277 43% 26% 31% Risk to Fish Habitat (Skeena Salmon) L (developmental)
0% 10% 20% 30% 40% 50% 60% 70% 80% 90% 100%
Social and Economic
2009-2013 (n = 21) 10% 14% 5% 71%
Cultural Heritage (FREP)
2006-2008 (n = 19) 21% 32% 5% 42%
n = 33 12% 12% 39% 36% Timber (FREP) S (developmental)
FRPA (n = 30) 3% 17% 13% 67%
Visual Quality (FREP) L
FPC (n = 11) 45% 55%
0% 10% 20% 30% 40% 50% 60% 70% 80% 90% 100%
Wildlife
2 populations 50% 50% Moose (MOE) L (developmental)
6 populations 75% 25% Mountain Goat (MOE) L (developmental)
6 populations 17% 33% 50% Grizzly Bear (MOE) L
26 nesting areas 73% 19% 8% Northern Goshawk (Consultant) L/S (report summary)
0% 10% 20% 30% 40% 50% 60% 70% 80% 90% 100%
Forests, Biodiversity and Air Quality
2005-2013 (n = 71) 30% 30% 32% 8% Stand-level Biodiversity (FREP) S
1998-2004 (n = 32) 41% 41% 6% 13%
n = 18 44% 28% 28% Soils (FREP) S
2014-2016 (n = 3) 33% 67% Air Quality (MOE) L
2011-2013 (n = 3) 33% 67%
2005-2013 (n = 7) 29% 71% Forest Practices Board Audits S
1996-2004 (n = 6) 50% 50%
S = Site level assessments
0% 10% 20% 30% 40% 50% 60% 70% 80% 90% 100% (boots on the ground)
% of Samples L = Landscape-level/GIS-based assessment
Natural Resource Values Monitoring and Assessment Report for the Wet’suwet’en Hereditary Territory 9Monitoring and Assessment Results: Fish and Water
Riparian (Fish) Habitat Value
Monitoring the condition of stream channels and their adjacent riparian management areas determines whether resource
management practices are achieving the desired result of protecting fish values by maintaining stream channel integrity
and riparian functions. The fish passage protocol assesses the resource road structures put in place at fish stream crossings
such as culverts and bridges to determine if there are any barriers to fish passage. Unimpeded fish passage is important to
maintaining access to fish habitat and maintaining healthy fish populations.
Riparian: Resource Development and Natural Impacts on Stream Function
Impact Rating
2005-2013 (n = 62) 3% 22% 33% 42%
High
1998-2004 (n = 36) 3% 10% 47% 40% Medium
Low
0% 10% 20% 30% 40% 50% 60% 70% 80% 90% 100% Very Low
% of Samples
Data Source:
Stream riparian data was collected by FLNRORD resource district staff using the FREP riparian monitoring protocol.
Sampling sites consist of randomly selected forestry cutblocks with streams in or adjacent to cutblock boundaries.
Data presented was collected from 2006 through 2015 on cut blocks that were harvested from 1998 to 2013. In the
field, where there is more than one stream in a harvest area, fish streams are selected before non-fish streams, then
larger streams are selected before small streams. Stewardship trends are determined by time period in which the area
was harvested.
Summary: For the 2005-2013 harvest-era, natural events caused
Of the 98 streams sampled, 83% had either “very low” 49% of the stream impacts, with high natural background
or “low” impact ratings. This varied from 75% in the sediment and wind events the main causes. Near-stream
1998-2004 pre-FRPA blocks to 87% in the 2005-2013 human actions (logging, roads, cattle, other) caused 40%
FRPA blocks. of the impacts on streams.
Samples by Stream Class5 and Impact 2005-2013 The two streams with “high” impact in the 2005-2013
harvest time period harvest era were both S6 streams located internal to
block boundaries, both just over one meter channel
Class High Medium Low Very Low Total
width and with zero near stream tree retention.
S1 1 1
Overall stewardship Trend:
S2 1 1
No statistical difference was evident between the two
S3 2 10 10 22 harvest eras.
S4 1 8 2 11
S5 1 2 2 5
S6 2 2 8 10 22
Total 2 6 29 25 62
10 Natural Resource Values Monitoring and Assessment Report for the Wet’suwet’en Hereditary TerritorySamples by Stream Class and Impact 1998-2004 Opportunities for Improvement and/or
harvest time period Continuation of Practices that Protect Stream
and Riparian Conditions:
Class High Medium Low Very Low Total
High natural sediment is a significant issue in this
S2 1 1
area. Minimization of human caused sediment is an
S3 3 4 7 14 important goal.
S4 3 3 • Minimize sediment sources near streams
S5 3 3 • Reduce windthrow by increasing buffer widths if narrow
S6 1 4 5 5 15 buffer strips are a problem, or use more selective
Total 1 8 12 15 36 harvest practices if windthrow-prone timber is an issue
• Increase retention generally on small streams,
especially the wider, perennial small streams that
Factors responsible for stream impacts on 2005-2013
make significant contributions of water, sediments,
cut blocks:
debris, nutrients, etc. to downstream fish habitats and
Most common specific watershed function.
% of total impact in order of A small stream monitoring initiative is currently
frequency being conducted. Morice TSA licensees have increased
Natural events 49% • In-stream sediments retention on small streams as a result of this monitoring
Naturally high sediments increased information. In addition, a number of other activities
& windthrow • Moss levels decreased focused on streams have taken place, including:
• Forest Stewardship Plan expectations letters have
Logging 28% • Windthrow protection
clearly communicated an objective for increased
Windthrow & low decreased
retention on small streams
retention • In-stream sediments
• A series of industry/govt workshops on improving small
increased
stream management were delivered across the Province
Roads 11% • In-stream sediments
• Licensee specific analysis of monitoring results was
Erosion, sediment from increased
conducted using the data presented in this report
roads and crossings and was presented and discussed with licensee
Upstream factors 10% • In-stream sediments representatives and prescribing forest professionals.
increased
Natural events
• Moss levels decreased
Other manmade 1% • Bare erodible ground
increased
Natural Resource Values Monitoring and Assessment Report for the Wet’suwet’en Hereditary Territory 11Fish Passage Value
Fish: Ability of Stream Crossings to Successfully Pass Fish
n = 1,193 19% 3% 43% 58% Impact Rating
High
0% 10% 20% 30% 40% 50% 60% 70% 80% 90% 100% Medium
Low
% of Samples Very Low
Data Source: Fish Passage data was collected using a standardized protocol developed by a federal and provincial Fish
Passage Technical Working Group. The sampling population is a census of all road crossings in a given geographic area.
Potential fish streams are identified based on a combination of historical fish observation points, natural barriers, and
GIS-derived stream gradients less than 30%. Data are collected by government staff and contractors, and made public
through iMap BC and the Provincial Stream Crossing Inventory System.
Summary: 1193 stream crossings were assessed from (were not embedded), constricted the stream channel
2009 to 2013. 19% of these crossings are “high” impact (were too small a diameter for the stream), or were
since they block or impede fish movement upstream to placed at too steep an angle. All new fish stream
372 km of low gradient fish habitat (0-15% gradient), crossings are legally required to maintain fish passage.
representing 21% of the total valuable habitat present This will create a positive trend on new crossings.
(1784 km). The amount of low gradient (high value) Opportunities for Improvement and (or)
fish habitat isolated at road crossings varied from 0.1 to Continuation of Resource Road Management
15.0 km (average 1.6 km per crossing). Road types also Practices that Successfully Pass Fish:
varied, including Highway 16 and many other public, • On new crossings, ensure normal channel width, slope,
private, and resource roads. 10% of the “high” impact bed roughness and stream velocities are maintained.
crossings isolated 44% of the low gradient habitat.
• Remediation of past practices would improve fish
Significant blockages were: Coffin Creek and Helps Creek
access to valuable habitat. Under the land based
on the Walcott Forest Service Road, Vallee Creek on
investment strategy, remediation is being targeted on
Walcott Road, Porphyry Creek and Robin Creek tributaries
high impact crossings that affect the longest lengths
on Highway 16, Tyhee Creek on Tyhee Lake Road, and
of high-value habitat. Since 2006, seven remediation
two unnamed streams on North Road.
projects were reported. These include replacements
3% of crossings are considered “medium” impact of structures that blocked fish passage with open
because they block or impede fish movements to 53 km bottomed structures, and are located in Blunt (2),
of less suitable, steeper gradient fish habitat (15-25%, Kidprice, Owen, Parrott, and Valley (2) landscape units.
depending on stream order). The 20% of crossings with a
• A four-step process is recommended for further
“low” impact were either passable to fish (n= 209, mostly
restoring fish passage. (Funding opportunities for
bridges, but also fords, culverts, pipe arches, wood box
further assessments and restoration plans should be
culverts, and some ovals), or they blocked access to only
pursued to extend sampling to the remainder of the
very steep fish habitat (n=29). Crossings with a “very
Wet’suwet’en Territory).
low” impact (39%) had little or no upstream fish habitat.
1. Confirm the quantity and quality of habitat to be
Causal Factors: Closed bottomed round metal culverts
gained if the site merits remediation.
account for most of the fish passage problems
encountered. Other closed bottom structures with 2. Prioritize structures for remediation.
poor records included oval or square concrete culverts. 3. Commission a site plan and design.
Culverts that blocked or impeded fish did so because 4. Carry out construction to remediate stream crossings
they: lacked natural stream bed roughness (to break and reconnect fish habitat.
up water flow and provide micro-rest areas for fish),
increased stream velocity
12 Natural Resource Values Monitoring and Assessment Report for the Wet’suwet’en Hereditary TerritoryWater Quality (Sediment) Value
Water quality refers to a number of key factors, including chemical, physical, biological, and radiological characteristics
of water. The most common standards used to assess water quality relate to the health of ecosystems, safety of human
contact, and drinking water. The following section shows water quality results from several monitoring initiatives. Forest
Stewardship Plan expectations letters clearly communicated an objective for increased retention on small streams A series
of industry/govt workshops on improving small stream management were delivered across the Province Licensee specific
analysis of monitoring results was conducted using the data presented in this report and was presented and discussed with
licensee representatives and prescribing forest professionals.
Water Quality (fine sediment/turbidity): Resource Development Impacts on Water Quality
2012-2015 (n = 112) 9% 32% 37% 22% Impact Rating
8% 26% 28% 38% High
2008-2011 (n = 129)
Medium
0% 10% 20% 30% 40% 50% 60% 70% 80% 90% 100% Low
Very Low
% of Samples
Data Source: The data for water quality assessments was collected using the Forest and Range Evaluation Program
(FREP) water quality monitoring protocol. The site assessment population for water quality (potential for fine sediment
generation) is roads (and/or mass wasting) connected to fish habitat and/or drinking water sources that originate
at randomly selected recently harvested cutblocks. The data is collected by FLNRORD field staff. Data presented was
collected from 2008 through 2015.
The FREP water quality methodology assesses the potential for a site to generate fine sediment that can enter streams
connected to fish habitat and/or drinking water sources. Fine sediment is the main potential impact to water quality
from forestry (including roads) and a critical component of overall water quality. Water quality impacts other than fine
sediment could also be quantified by the FREP protocol. By identifying the hydrological connection between roads and
streams, fine sediment can be used as a proxy for the potential of other common land surface contaminants to enter
streams, including fecal contamination, oils, fuels and pesticides.
Summary: Overall Stewardship Trend:
Of the 241 road segments assessed from 2008 to 2015, There is a statistical difference (p=0.06) between
63% were rated as “very low” or “low” road-related sampling eras, showing an improvement in more recent
impacts. Site assessments show the range for potential sample years.
sediment generation as 30% “very low” (same as “very Opportunities for Improvement and (or) Continuation
low” impact on water quality), 33% “low” (“low” of Practices that Help Minimize Sediment:
impact), 29% “moderate” (“medium” impact), and 8% The most frequent suggested maintenance or
“high” (“high” impact). construction issues are:
Causal Factors: • Use cross ditches and kickouts to divert water off
See opportunities for improvement for “high” or the road.
“medium” impacted road segments. • Armour, seed and protect bare soil as soon as possible
after disturbance.
• Avoid long gradients approaching streams.
• Prioritize water quality inspections through the
C&E program.
• Report out on these results to road builders, users,
and maintainers.
Natural Resource Values Monitoring and Assessment Report for the Wet’suwet’en Hereditary Territory 13Benthic Invertebrates Value
Water Quality: Resource Development Impacts on Benthic Invertebrates
n = 25 4% 36% 60% Impact Rating
High
0% 10% 20% 30% 40% 50% 60% 70% 80% 90% 100% Medium
Low
% of Samples Very Low
Data Source: Sampling protocols for the collection and analysis of benthic invertebrate data were developed by the
Canadian Aquatic Biomonitoring Network (CABIN), a national aquatic biomonitoring program that uses a reference
condition approach for study design and site assessment. Test sites tend to be targeted at specific developments,
and assessed against reference sites using the bioassessment models. The divergence between benthic invertebrate
communities at reference sites and a test site indicates the extent of stress/impairment. To date, most data in BC
is collected by federal/provincial environmental staff and their contractors, though independent developers are
encouraged to make greater use of the CABIN database to store, manage, analyze and report on their biological
monitoring data.
Because CABIN assessments are not on randomly selected sites, these results apply only to the sites sampled. No
inference can be made to other streams within Wet’suwet’en territory.
Summary and Causal Factors: Opportunities For Improvement:
From 2004 to 2008, benthic invertebrates were sampled For the streams sampled using CABIN, the status of
and analyzed using the CABIN methodology at 25 stream benthic invertebrate communities suggests, with one
sites in the Wet’suwet’en Traditional Territories. Most exception, that there are no concerns over water quality.
sites had varying degrees of logging activity in the The sampling in the area covered for this report was
watersheds; however, one site was located below an limited to a relatively small number of streams and land
old mine entrance. Results indicate that the majority activities. More sampling of different watersheds and
of sites (60%, n=15) were comparable to sites in land activities would provide a fuller picture and track
reference condition (i.e., sites in watersheds with little water quality trends in the Wet’suwet’en area.
to no human disturbance). All but one of the remaining An expansion of the sampling intensity for this protocol
sites (36%, n=9) were only slightly stressed, and not by providing training to current FREP practitioners and
indicative of any significant watershed issues. One site Wet’suwet’en monitoring participants so as to gather this
(4%, n=1) that showed a significant deviation from data as part of riparian sampling.
reference condition (Berg Creek Far Field) is located
downstream of an old mine entrance that discharged
metals-laden mine water. The benthic invertebrate
community at this site was highly divergent from
reference conditions and thus indicative of very poor
water quality.
14 Natural Resource Values Monitoring and Assessment Report for the Wet’suwet’en Hereditary TerritoryWater Quality Index Value
Water Quality: The Water Quality Index for the Skeena River at Usk, 2005-2007 to 2009-2011
n=5 80% 20% Impact Rating
High
0% 10% 20% 30% 40% 50% 60% 70% 80% 90% 100% Medium
Low
% of Samples Very Low
Data Source: The Water Quality Indicator (WQI) is reported nationally on an annual basis and provides an overall
measure of water quality in freshwater bodies. It utilizes water quality guidelines to assess large amounts of water
quality data at a monitoring site to calculate a single index. The indicator is based on the CCME Water Quality Index
and the index is calculated by comparing three years – usually comprised of eight to twelve parameters representing
nutrients, metals and physicochemical parameters – of seasonal data against relevant water quality guidelines.
Information on the WQI in this report was obtained from a 2007 report by Environment Canada, the BC Ministry of
Environment, and the Yukon Department of Environment (British Columbia and Yukon Territory Water Quality Report
(2001-2004), and the Environment Canada website on “Freshwater Quality Monitoring and Surveillance – Online Data”
http://aquatic.pyr.ec.gc.ca/webdataonlinenational/en/Home.
Summary: There is one long-term water quality sampling Overall Stewardship Trend:
station at Usk on the Skeena River, 15 km upstream from There were no environmentally significant changes. There
Terrace and downstream of the Wet’suwet’en Traditional were seasonal exceedances in total cadmium and total
Territories. Water quality at this station was rated fair for phosphorus. These exceedances appear related to spring
the first four reporting periods from 2005 to 2010 (2005- freshet and resulting increases in turbidity.
2007, 2006-2008 and 2007-2009, 2008-2010), and good Fish sensitive watersheds must meet two criteria: they
for the 2009-2011 period. must have significant fisheries values and watershed
Criteria used to assess water quality at this site included: sensitivity. Watersheds which meet these criteria and
cadmium, chromium, copper, lead, nitrogen, phosphorus, that have been designated by way of an order by the
silver, and zinc levels as well as temperature and pH. Minister as Fish Sensitive Watersheds (FSW) require
Causal Factors: From the Environment Canada website, Forest Act agreement holders to establish results and
“The Skeena River at Usk drains 42,200 km2 of the Coast strategies in their Forest Stewardship Plans consistent
Mountains in north central British Columbia and supports with the objective(s) set by the Minister. An FSW
major runs of salmon. Its major tributaries are the order established by the Minister sets out management
Bulkley and Babine Rivers. The main potential influences direction to conserve important watershed level
on water quality are forestry, mining, agriculture, urban attributes protecting fisheries values. These attributes
development, and treated municipal wastewater from include the:
Houston, Telkwa, Smithers and Hazelton. • natural stream bed dynamics;
• stream channel integrity;
• quality, quantity and timing of water flow; and
• natural, watershed level, hydrological conditions
and integrity.
Natural Resource Values Monitoring and Assessment Report for the Wet’suwet’en Hereditary Territory 15Fisheries Sensitive Watersheds Value
Fish: Fisheries Sensitive Watershed Status
n=5 60% 20% 20% Impact Rating
High
0% 10% 20% 30% 40% 50% 60% 70% 80% 90% 100% Medium
Low
% of Samples Very Low
Data Source: The Fisheries Sensitive Watershed Working Group developed a protocol to assess the risk of fish habitat
degradation at the landscape level in fisheries sensitive watersheds (FSWs) in BC. Designated or candidate fisheries
sensitive watersheds have significant fish values and watershed sensitivity. Thresholds corresponding to “low”,
“medium” and “high” risk are assigned to nine GIS-derived variables (e.g., road densities, stream lengths logged, peak
flow index) and tabulated for each watershed. Results for each designated candidate or suspected FSW to date in BC
are summarized in a draft report by ESSA Technologies Ltd. to the BC Ministry of Environment (Porter et al. 2014).
Overall status of each watershed was then determined for the FSWs in this report by averaging the risk rating of each
landscape variable. For further information, please refer to FREP report #396.
Summary: This report is based on a GIS assessment Overall Stewardship Trend: FSW status only reflects
of “potential risk.” Many indicators of high potential current conditions, thus no trending information is
risk are a result of historic practices (pre 1990s) which available. However, while the number of FSWs in the
resulted in direct impacts. Government conducts these Wet’suwet’en Territories is small, there were twice as
assessments and must facilitate awareness and engage many FSWs at high potential risk compared to all FSWs
in stewardship discussions to result in recovery and in BC.
improved practices and FSPs. Results can be used Opportunities For Improvement: Field data has been
to influence resource allocation (e.g., monitoring, collected on Owen Creek and Lamprey Creek in order
restoration). There are two designated (Cumming Creek, to validate the GIS outcomes. Reporting on this field
Jonas Creek) and three candidate FSWs (Lamprey Creek, monitoring data is pending and will be evaluated against
Owen Creek, Pierre Creek) within or impinging on the management practices prescribed through licensee
Wet’suwet’en Territories. conducted watershed assessments and FSPs.
A GIS watershed assessment indicates that three of GIS outcomes indicate improvements will come from
the watersheds (Cumming, Jonas, Lamprey) are at high reducing:
potential risk of fish habitat degradation, while one • Logged stream length (non-fish and fish bearing); and
(Owen) is at moderate risk. Pierre Creek is currently
• The number of stream crossings and road density
assessed as low potential risk.
near streams and above the H60 line. This would
Causal Factors: The most significant risk factors best reduce the high risk ratings for FSWs in the
affecting the watersheds at high risk were road density Wet’suwet’en Territories.
within 100 m of a stream, stream crossing density,
Note that equivalent clearcut area (ECA) was not
portion of streams logged, and portion of fish bearing
always related to FSW status. While two of the high risk
streams logged. Other risk factors in order of importance
watersheds have relatively high ECAs (>30%), the ECA for
were road density above the H60 line7, the peak flow
one watershed (Cumming Creek) was only moderate (16%).
index, and stream banks logged on slopes > 60%. Road
density on unstable slopes (0%) was never identified as
a concern.
16 Natural Resource Values Monitoring and Assessment Report for the Wet’suwet’en Hereditary TerritoryYou can also read