NOVEL APPROACH IN DATA AGGREGATION AND ITS APPLICATION IN AIRLINE SERVICE EVALUATION - LUTPub
←
→
Page content transcription
If your browser does not render page correctly, please read the page content below
Lappeenranta-Lahti University of Technology LUT
School of Business and Management
Strategic Finance and Business Analytics (MSF)

NOVEL APPROACH IN DATA AGGREGATION AND ITS APPLICATION
IN AIRLINE SERVICE EVALUATION

Master’s Thesis

1st Supervisor: Dr. Jan Stoklasa

2nd Supervisor: Professor Pasi Luukka

Hoang Khanh Giang

2020

                                                         1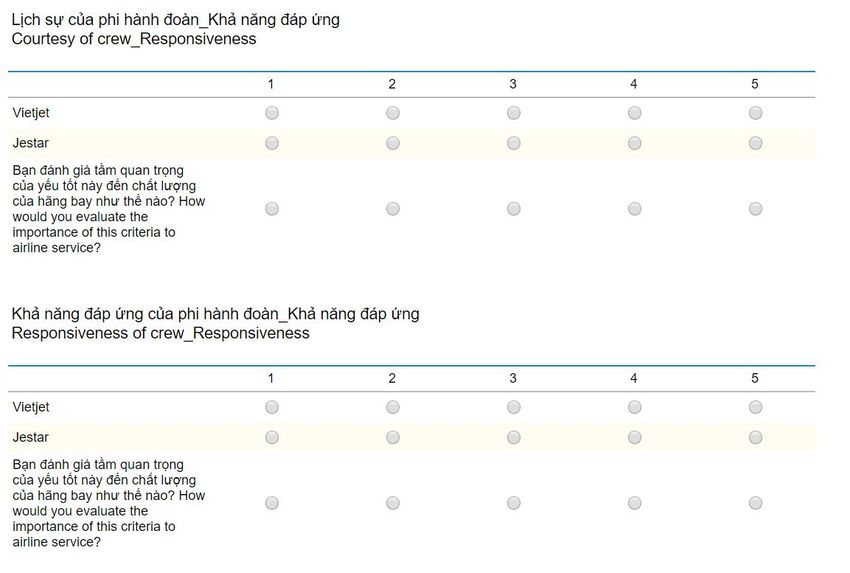
Abstract
Author:                       Hoang, Khanh Giang
Title of thesis:              Novel approach in data aggregation and its application in
                              airline service evaluation
Faculty:                      LUT School of Business and Management
Master’s Programme:           Strategic Finance and Business Analytics
Year:                         2020
Master’s Thesis:              Lappeenranta-Lahti University of Technology LUT
                              70 Pages, 11 Tables, 12 Figures, 1 Appendix
Examiners:                    Dr. Jan Stoklasa
                              Professor Pasi Luukka
Keywords:                     questionnaire, data representation, lossless, histogram,
                              service evaluation

The use of questionnaire data has been a common method to gain more insights from service
or product users, however interpreting this kind of data is never a straight-forward task and
sometimes it can lead to ambiguous or misleading results. This thesis paper suggests a new
approach for the evaluation and analysis of questionnaire data. It suggests a multiple criteria
multi-expert evaluation framework where importance of specific answers from respondents
will be reflected. Likert-scale inputs and aggregated evaluations are represented using
histograms. The concept of histogram weights of criteria for the analysis of questionnaire
data is introduced. The proposed method was empirically tested on the real-world data set,
evaluation of Vietnamese airlines by their customers in 2017. The result shows that we can
obtain a lossless representation of the evaluations of a given alternative by a group of
evaluators overall , get the marketing implications of the lossless representation of
questionnaires and reflect weights of answers specified by the user/buyer of the analysis..
The concept of a 2-dimensional histogram to represent the data with subjective importance of
the partial evaluations as expressed by the experts and propose histogram weights is a useful
tool for the analysis of respondents’ preferences in marketing research.

                                                                                                  2
Acknowledgement
It has been a long journey for me with this thesis paper and I want to thank all my family and
friends who have given me so much motivation during the writing process, your encouraging
words have helped me keep going and not giving up. I’m also grateful for all professors and
teachers I have had the chance to study with at LUT: professor Mikael Collan, Associate
professor Sheraz Ahmed, Professor Eero Pätäri, Dr. Azzurra Morreale and foremost I want
to express my utmost gratitude to my Supervisor – Dr. Jan Stoklasa for your guidance,
encouragement and especially your patience during my study. You have been my motivation
to finish up this thesis paper and also remind me to put responsibility in all the work I take.
MSF program at LUT has opened me the door to my passion, working in data science field;
you all have helped me to widen my perspective in this field. I would definitely recommend
this program to those who got strong passion about finance and data.

09.09.2020
Giang Hoang

                                                                                                  3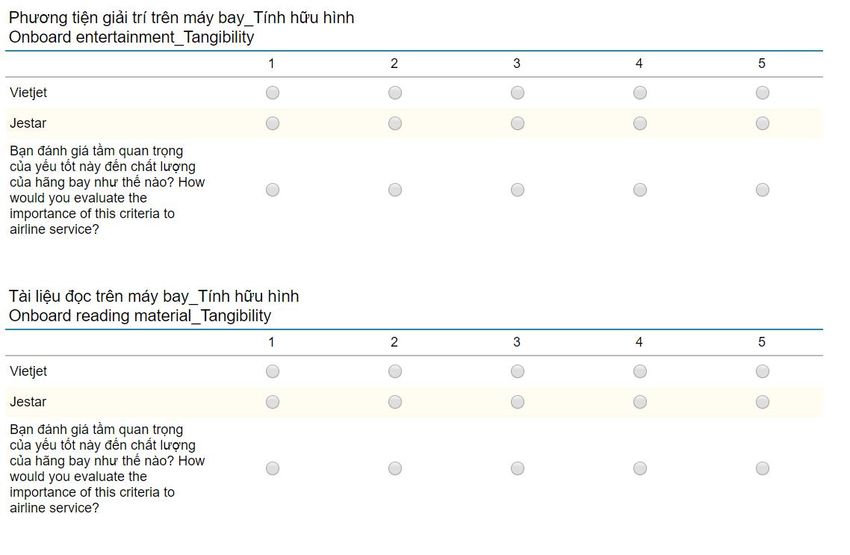
Table of Contents
1. INTRODUCTION.................................................................................................................8
1.1 Background and motivation........................................................................................... 8
1.2 Objective and contribution of the study......................................................................... 9
1.3 Theoretical framework and data collection summary..................................................10
1.4 Structure of the thesis................................................................................................... 11
2. LITERATURE REVIEW....................................................................................................12
2.1 Customer satisfaction..................................................................................................... 12
2.1.1 Customer satisfaction definition.............................................................................. 12
2.1.2 Objective of customer satisfaction...........................................................................13
2.1.3 Factors affecting customer satisfaction....................................................................15
2.2 Traditional models on service quality and customer satisfaction...................................16
2.3 Models on customer satisfaction in airline industry.......................................................18
3. THEORETICAL FRAMEWORK...................................................................................... 22
3.1 Likert scale..................................................................................................................... 22
3.2 Fuzzy logic..................................................................................................................... 23
3.3 Distance from ideal.........................................................................................................26
3.4 Histogram aggregation................................................................................................... 27
4. DOMESTIC AIRLINE MARKETS................................................................................... 28
4.1 Overview of domestic airline markets and airline services in Vietnam....................... 28
4.2 Vietjet Air.....................................................................................................................30
4.3 Jetstar Pacific Airlines..................................................................................................30
5. DATA COLLECTION........................................................................................................32
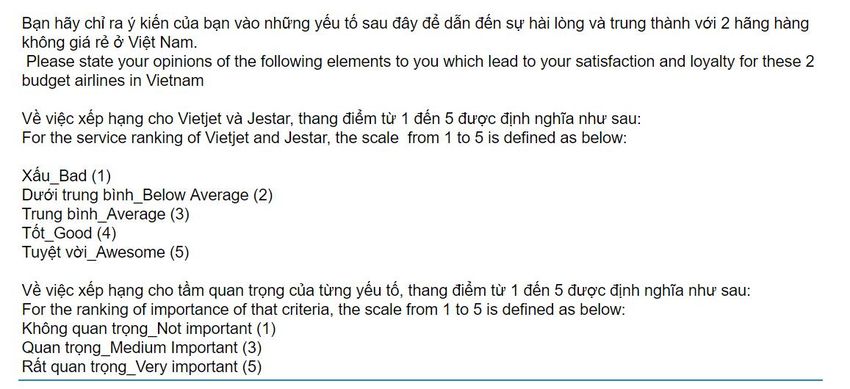
5.1 Questionnaire design...................................................................................................... 32
4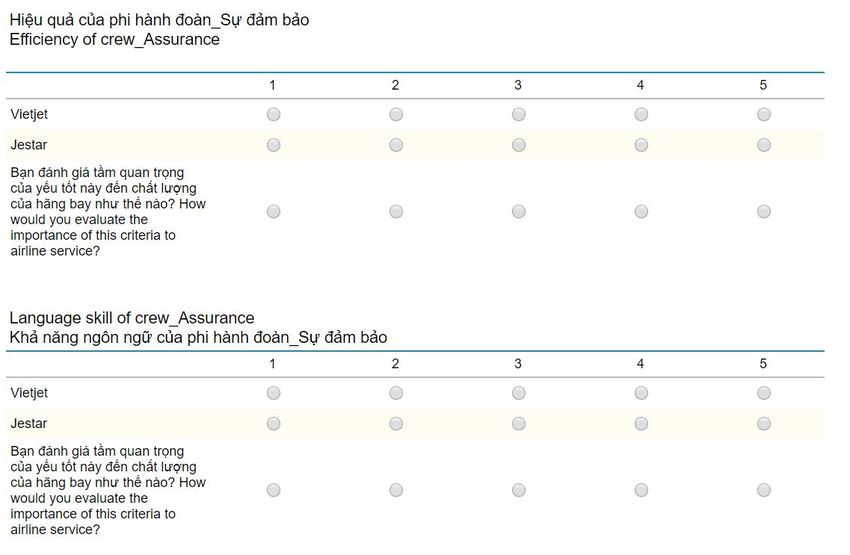
5.2 Data collection................................................................................................................33

6.      EMPIRICAL ANALYSIS AND FINDINGS...................................................................35

     6.1. Demographic Analysis.................................................................................................. 35

     6.2. Dimensions Analysis..................................................................................................... 36

        6.2.1 Dimension measures without weight reflected........................................................36

        6.2.2 Dimensions measures with weights reflected..........................................................41

        6.2.3 Summary and comparison....................................................................................... 49

7.      DISCUSSION AND CONCLUSION.............................................................................. 51

     7.1 Conclusion and Recommendations................................................................................ 51

     7.2 Limitations......................................................................................................................56

     7.3 Future research directions...............................................................................................57

REFERENCES.........................................................................................................................58

APPENDICES..........................................................................................................................67

                                                                                                                                          5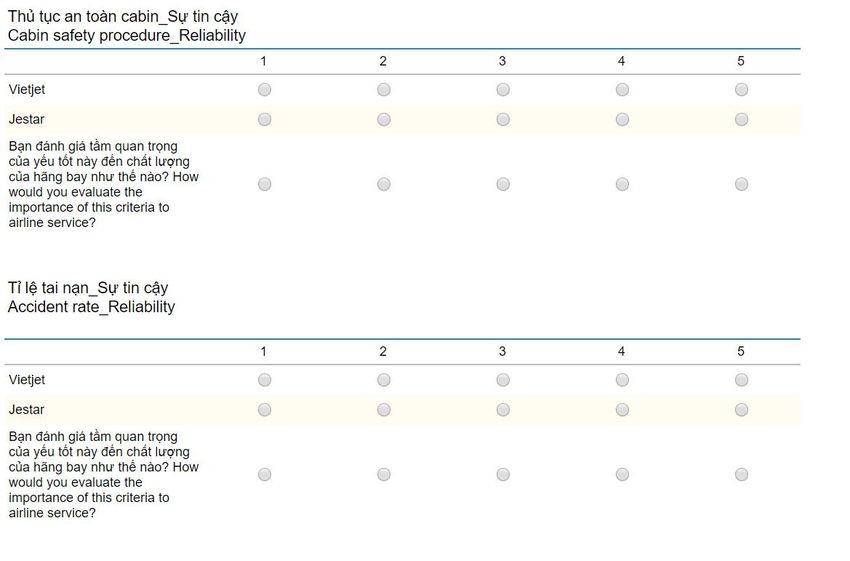
List of Figures

Figure 1 The customer-advocacy pyramid (Complaint management excellence 2012, pp 6-7)

Figure 2 Market shares of domestic airline companies (Vietnamese Dragon Research 2018)

Figure 3.1 Tangibility assessment _Weights not reflected

Figure 3.2 Reliability assessment _Weights not reflected

Figure 3.3 Responsiveness assessment _Weights not reflected

Figure 3.4 Responsiveness assessment _Weights not reflected

Figure 4.1 Tangibility assessment _Weights reflected

Figure 4.2 Reliability assessment _Weights reflected

Figure 4.3 Responsiveness assessment _Weights reflected

Figure 4.4 Responsiveness assessment _Weights reflected

Figure 5 Histogram weights of four dimensions

Figure 6 Overall rates

                                                                                         6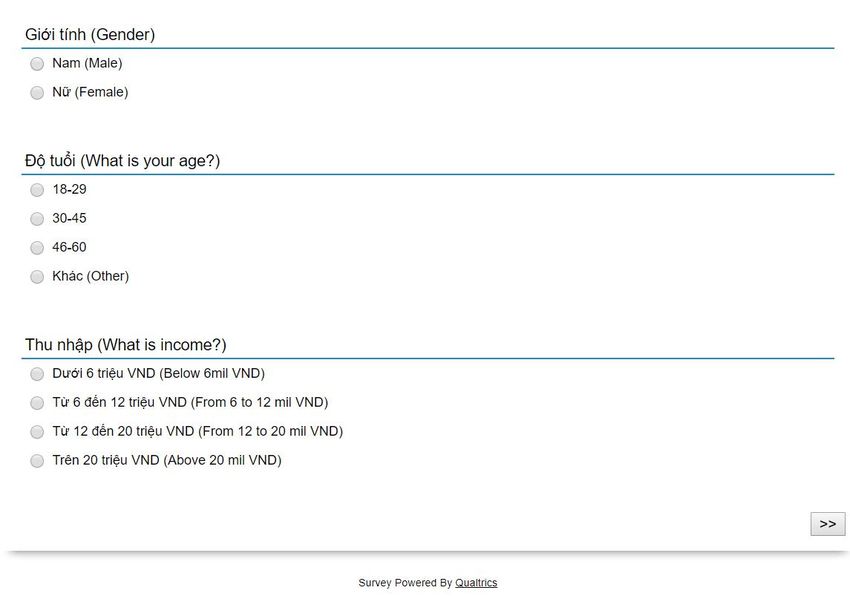
List of Tables

Table 1 Five Broad Dimensions of Service Quality

Table 2 Summary table of main information for Vietjet and Jetstar

Table 3 Descriptive statistics of respondents

Table 4 Summary for distance from ideal of criteria without weights

Table 5 Importance reflection of needs of the analytic/ analysis buyer

Table 6 Data for Tangibility with weights of criteria importance incorporated

Table 7.1 Distance from ideal and ideal fulfillment of Tangibility

Table 7.2 Distance from ideal and ideal fulfillment of Reliability

Table 7.3 Distance from ideal and ideal fulfillment of Responsiveness

Table 7.4 Distance from ideal and ideal fulfillment of Assurance

Table 8 Overall evaluation for the quality service of each airline

                                                                                7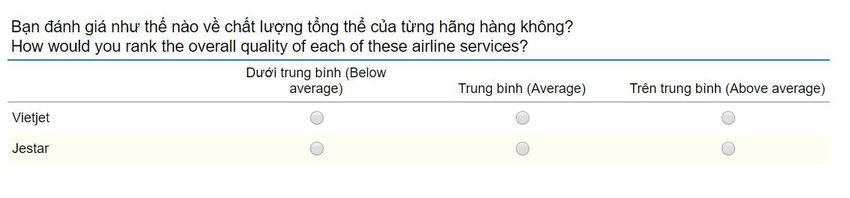
1. INTRODUCTION

1.1 Background and motivation
In a competitive market, customer satisfaction is important for the business’s developing
strategy, and it has been a key value for success or failure of a company on the market
(Trends et al., 2017). Although playing a critical role in the economies of many countries, the
services sector is in the state of tremendous competitive pressure. Hence, the improvement of
service quality and customer satisfaction will help businesses maintain their existing
customers, attract new customers, and improve their ability to compete. Given its ability to
transport passengers to their desired locations all over the globe, aviation is a typical service
industry which plays an important part in the global service sector. In spite of its fast growth,
the aviation industry faces many challenges like oil prices, fuel expenses, high competition,
safety and other operational challenges. Especially during this Coronavirus crisis where
travelling has been restricted to a great extent, measuring customer satisfaction is even more
important for the business to adapt and survive. Understanding customers, particularly how
they feel about the service quality, is one of the core strategies for an airline to sustain their
profitability and development (Neil Patel, 2017).

Airline in Vietnam is becoming a popular means of travelling for Vietnamese during recent
times when the economic development of the country is booming. During the last few years,
many budget airline companies have been founded and gone into operation. However, it is
not easy for an aviation company to keep its stand in the market, and maintain its
competitiveness as well as its share in the industry. Indeed, a couple of companies (like Air
Vietnam, Indochina Airlines and Air Mekong) have stopped operating (Private airlines go
bankrupt leaving big debts behind - News VietNamNet, 2018). In such a highly competitive
world of low-cost airlines, providing sufficient quality services to satisfy customers is
essentially important for airlines to achieve profitable and sustainable development.
According to Lu and Ling (2008), service quality is one of the main keys for corporate
success. It has been pointed out that the cost of attracting new customers is five times higher
than the cost of keeping old ones, and 80% of profit is earned by 20% of old customers
(Chow and Reed 1997; Heskett et al. 1994). Therefore, airline marketers need to create more

                                                                                                     8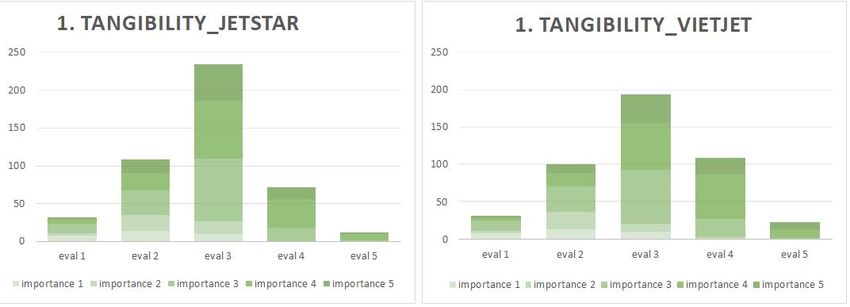
products and services in their marketing offerings and development strategies in order to
sustain their profitability. There are various marketing strategies that boards of management
can employ such as service design, pricing, communication, promotion. Knowing how
customers evaluate airline services will help businesses in this industry understand the
elements affecting customer satisfaction. Then, they can assess the effectiveness of their
business operation and come up with suitable strategies.

Using surveys and questionnaires to measure customers' opinions about airline services is a
challenging task because of the survey’s versatile designs and also the expectation subsequent
quantitative analysis of the data when numerical outputs are expected from the analysis.
Furthermore, there are many intangible factors that can affect customers´ choices. The
qualitative methodological framework (where data is gathered through interviews, focus
groups, observation etc.) can provide interesting and valuable data, but usually in a form that
is difficult to process further using quantitative methods. This limits its use in hypothesis
testing and similar contexts. To improve service quality, there were many researchers and
marketers focusing their attention on customer evaluations of services (Fisk, Brown, & Bitner,
1993). However, majority of the studies used similar methods, for example Clemes et al.’s
(2008) and Aydin and Yildirim (2012) who both employed the SERVQUAL methodology
(Parasuraman et al., 1988) and statistics tests like One-way ANOVA in their papers. This
pure method received quite many critiques, Francis Buttle (1996) in his article "SERVQUAL:
review, critique, research agenda" pointed out that consumer final decisions are taken at a
higher-level of abstraction. Brown, Churchill and Peter (1993) also showed their primary
concern on the difference score (i.e. perception minus expectation) with psychometric
concerns about conceptualization. From those examples, we can see that to fully present all
the insights from a questionnaire data without losing information is not an easy task. This
thesis will present a new approach to deal with the questionnaire data so that its distortion is
minimal by its aggregation and other forms of further processing.

1.2 Objective and contribution of the study
There have not been many researchers studying customer satisfaction in Vietnam aviation
market. For example, a paper conducted by Ha Nam Khanh (2017) used multiple linear
regression analysis, a traditional way to examine service evaluation that cannot aggregate all

                                                                                                   9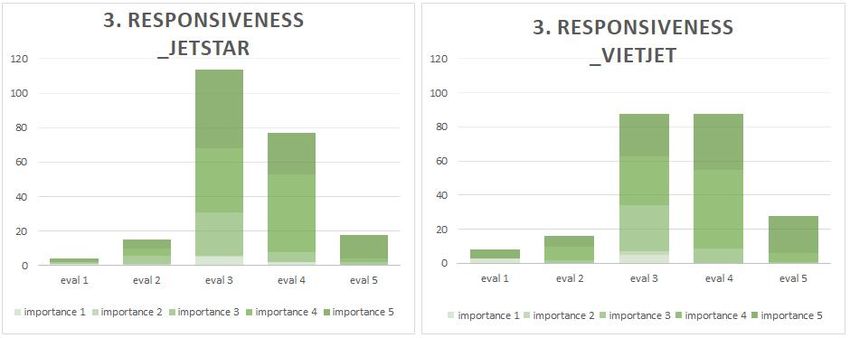
the insights from the questionnaire data. The objective of my thesis paper is to examine
customer perceptions of domestic airline services in Vietnam using a novel approach to
present questionnaire data in a lossless way and also with minimal distortion. This approach
will tackle with the problem of data translation from pure SERVQUAL method mentioned
previously (section 1.1) , in other words, it will capture and translate survey data in the most
complete way. The research will also explore the quality airline services from the customer’s
point of view, among all the suggested service quality dimensions (which will be mentioned
in detail in the Theoretical framework section), which dimension will significantly influence
the satisfaction of airlines passengers.

We will proceed with the assumption that discrete Likert-type scales are used in the
questionnaire to obtain answers (evaluations) from several respondents (experts) concerning
several aspects (criteria) of a given object (alternative). The respondents were asked to
express the perceived importance of the given answer. A general methodology for the
processing of such questionnaire data will be proposed. First, we introduce the problem in
general terms and the necessary notation and also the notation for histograms. Then we
suggest a lossless aggregation procedure for the expert evaluations w.r.t. the criteria and a
visualisation technique of these evaluations. In the end we outline a full multi-expert
multiple-criteria evaluation framework dealing with discrete Likert-scale data and reflecting
expert-defined importances of evaluations as well as the importances of particular evaluations
as perceived by the user of the analysis. In all the steps we try to minimize information loss
and distortion. The resultant findings are expected to help direct the airlines to better
strategies when providing their services. Moreover, some suggestions for further
improvement will be proposed to help the airlines achieve the quality of a good airline
company.

1.3 Theoretical framework and data collection summary
The theoretical part of this research is based on a review of previous studies on customer
satisfaction, traditional models on service evaluation and customer satisfaction, and some
research models on satisfaction of airline clients. The empirical part of the study looks
carefully into the evaluation of the airline services from customers' points of views by using a
combination of the following methods: Likert scale, distance from ideal, histogram

                                                                                                 10
aggregation and fuzzification. An elaboration of this summary can be found in part 2 and 3 of
the paper.
The study data was collected through social network sites using Qualtrics and sent out to
more than 200 people who already used two budget airlines, namely Jetstar Pacific and
Vietjet Air. These two airlines were selected due to fast growing market and its existing
problems when operating in this dynamic industry. The convenience sampling method was
used since reaching whole population is not possible. 114 respondents completed the
questionnaires, incomplete ones were discarded. After the completion, data were analyzed
carefully as presented in the Empirical Analysis and Findings section. An in-depth discussion
of this part will be addressed in part 5 of the thesis.
1.4 Structure of the thesis
The thesis is structured into seven chapters. The first chapter introduces general information
about the background and motivation for the research topic, the thesis objectives and
contributions. Theoretical frameworkand data collection is also briefly mentioned in this
chapter. Chapter 2 provides a literature review of previous research focusing on the
aggregation of questionnaire data, some limitations from these papers will also be discussed.
Chapter 3 introduces an overview of theoretical framework about Likert scale, fuzzy logic,
distance from ideal and histogram aggregation, as well as why a different method is proposed
to solve the problem instead of other traditional ways. Chapter 4 contains background
information of domestic airline market and airline services in Vietnam, and a closer look at
two budget airlines chosen to be analyzed in this thesis. Chapter 5 delves into the
questionnaire design and the discussion on data collection. In chapter 6, empirical analysis
and key findings are presented. First we will look at the dimension measures without weight
reflected, dimensions measures with weights and then the comparison between the two.
General formulas and calculations will also documented in this chapter. Chapter 7 will
concludes the research with the theoretical and managerial implications, limitations and
suggestions for future research.
112. LITERATURE REVIEW
2.1 Customer satisfaction
Customer satisfaction topic has attracted a lot of researchers in the recent past. This part of
the paper will look at approaches and methodologies of some prominent researches and from
there, we will gain a basic understanding and insights about methodologies used for
measuring customer satisfaction.
2.1.1 Customer satisfaction definition
Customer satisfaction is defined as an "evaluation of the perceived discrepancy between prior
expectations and the actual performance of the product" (Tse and Wilton, 1988, Oliver 1999).
In Gustafsson, Johnson and Roos’s paper (2005) customer satisfaction is defined as
customers’ evaluation about the performance of the firm. According to Hennig-Thurau and
Klee (1997), if customers are pleased with the services and products that they received, the
companies can be more successful and competitive in the market. Previous research has
shown that the satisfaction of customers can help brands build strong and profitable
relationships with their clients in the long run even though it is costly to do so (Anderson,
Fornell and Mazvancheryl, 2004). Researchers from the University of Michigan (Keiningham
& Vavra, 2001) showed that for 1% increase in customer satisfaction, there is an average
increase of 2.37% of return on investment. However, poorer services have even larger effects
on customer's perception. Gitomer's research (1998) shows that if the service is particularly
poor, 91% of retail customers will not return to the store, and the cost of acquiring a new
customer is five times greater than the cost of keeping a satisfied customer.
In a research by Cook (2012), he points out that there are four levels of experience that
customers have with service businesses. First, at the lowest level, when the services provided
for customers are poor or below standards, they fail to meet the customer's expectations.
When this happens, customers may choose to complain with the business, express discontent
with other people or do nothing. It is possible that customers may choose to remain with the
business due to the convenience of location or price, but they can also choose to leave. Above
this level is when services are at satisfactory level to customers. In this case, customers can
choose either sticking to the brand or looking for an alternative service. However, they are
12more inclined to the idea of remaining with the business. Move to a higher level, when
customers receive services beyond their expectations, they will feel more emotionally
attached to the firm and be more loyal with that brand. The highest level of customer
experience is the stage when customers persistently feel satisfied with the services. They will
love to promote the brand to their friends, acquaintances, and others. This view on four levels
of experience seems to be correct for most of service sectors. Those levels can be
summarized in the Figure 1.
Figure 1: The customer-advocacy pyramid. Adapted from Complaint management excellence
(Cook, 2012, pp. 6-7)
2.1.2 Objective of customer satisfaction
Customer satisfaction helps businesses gain considerable competitive advantage. According
to Jagdish (2001), customer satisfaction brings a lot of benefits for firms.
First, customer satisfaction results in repeating purchases, which reduce the cost of doing
business. This can be explained by the economy of scales advantage. Due to coming-back
customers, the marketing and management cost is minimized, and the productivity of
marketing activities is improved more significantly thanks to the recommendation of this
coming-back customers to their networks. From another way of looking, dissatisfied
customers increase the cost of sales by delaying their payments, sending complaints to high-
level management, or even using the legal department to fulfill their expectations. It cannot
be denied that precaution is always better than correction.
13Second, customer satisfaction creates price advantage. This is due to satisfied customers will
bring a lot of benefits for company and for the companies to get more customers they should
try to give better price offer. Once customers are satisfied with one brand, they are unlikely to
switch to a different one. Therefore, if a competitor wants to attract those satisfied customers,
they either have to lower the price with the same level of performance or increase
performance level with the same price. This price advantage is considered as differentiation.
Another price advantage of customers satisfaction is brand reputation. When customers can’t
judge or control quality consistency, brand reputation will become a price advantage.
Third, customer satisfaction is likely to reduce corporate crisis because satisfied customers
want the company to survive and support the company financially and morally to ensure that
survival. There are four major sources of crises that are relevant to customer satisfaction: (i)
product tampering, (ii) operational breakdowns, (iii) unfair competition, and (iv) industry
restructuring.
Fourth, having satisfied customers helps the company to have more new customers. If the
customers like the products, through word of mouth, they spread the company’s brands to the
market with the lowest possible cost. There are several reasons for this action. For example, it
is a way to show customers’ appreciation for being treated well. Also, it helps drive out bad
companies from the market.
Fifth, pleased customers tend to shop at one place rather than risk trying other places since
they are familiar with the procedure for ordering, delivery and payments. This makes their
buying easy, convenient and fast. It is quite economical for customers to place multiple
orders from one firm rather than splitting across several vendors. Further more, they can also
have more purchase discounts, better support. With these set loyal customers, company tends
to have a fixed source of revenue and marketing cost can be reduced. In other words, this
allows the company to expand its line of products and generate more growth.
Last but not least, customer satisfaction encourages successful product innovations which are
directly linked to corporate growth opportunities. When customers are satisfied about the
services, they tend to share their experiences and this will help R&D departments interface
more with customers as they are developing new technologies. These input from customers
are precious for innovation process.
142.1.3 Factors affecting customer satisfaction
a. Service quality
Considering that most developed economies are now service-oriented, service quality has
been put in a critical marketing and management role. The service sector made up 58 percent
of worldwide gross national product (Bateson & Hoffman, 1999). Service quality is regarded
as the customer's impression of the quality, and customers usually compare the company’s
services to those of its competitors (Bitner & Hubert, 1994). In this situation, service quality
is one of the most essential elements in deciding brands to go with when there are many
companies in the industry. It is characterized as a network of activities, including customer
support systems, complaint processing, complaint processing speed, complaint reporting
easiness and complaint reporting friendliness. Such programs are meant to meet consumer
needs. For example, if the complaints of customers are not handled or addressed properly,
they will look for other brands (Gustafsson, Johnson and Roos, 2005). In addition, Soderlund
and Rosengren (2008 ) found out that a courteous nature and welcoming disposition of
service employees left a positive impression on the customer, which resulted in greater
customer satisfaction.
The first model to measure service quality was introduced by Gronroos (1984). He used a
two- dimensional model to study the quality of service, which includes technical quality (i.e.,
outcome of the service performance) and functional quality (i.e., consumers' perceptions of
their interactions with the service providers). This model contrasts service efficiency with
customers expectations. Gronroos concludes that each customer has their own perceptions of
the quality of the service.
b. Price
Price plays an significant part in pleasing our customers. Price is the amount of money spent
for a good , service, or sum of the values consumers pay for the benefits of using that service
(Kotler & Armstrong, 2010). According to Kukar-Kinney, Xia and Monroe (2007), there is a
strong relationship between price fairness and customer satisfaction because customers who
pay to use the service assess whether the price is justifiable or acceptable, and if it is,
customer satisfaction and loyalty will be developed. Customers decide to buy the products
only when the they meet minimal quality standards, and they rarely purchase the products
with the highest quality. They see the price as an indicator of service quality.
15The importance of price has been proved in previous literature. For example, Mahmud, Jusoff,
and Muammil (2013) mentioned the importance of prices on the satisfaction and loyalty of
customers in the aviation industry. Research has shown that service quality has a substantial
effect on customer satisfaction with a positive relationship, while price plays an insignificant
role with a negative relationship. This research also suggested the company should maintain a
consistent quality of service and continue to set the price at fair price. In banking industry, a
research paper by Činjarević, M., Tatić, K. and Avdić, A. (2010) investigates an integrated
model of price, service quality, satisfaction and loyalty showed that banks should focus on
delivering the right quality at the right price (price-quality ratio), and on treating the
customers fairly if they want higher customer satisfaction and loyalty. However, in this thesis,
price factor is dropped out because the two airlines under study use very similar price
strategy on the same routes.
c. Other factors
Apart from service quality and price, customer satisfaction is also influenced by other factors
such as customer's mood, emotions, and social interactions. Customer behavioralists and
marketers have researched extensively the essence and role of customer satisfaction in a
number of service settings; in a recent study about the mood on product evaluation by
Sirakaya, Petrick, & Choi (2004) the result suggests that such emotional states indeed bias
research outcomes and associated management responses. In another research done by
Srivastava and Kaul in 2014 showed that social interactions with other customers could have
a positive effect on customer experience and this is quite consistent with the research done by
Lloyd and Luk (2011) with the same topic. Nevertheless, the goal of this study is to present a
new approach to deal with the questionnaire data so that its distortion is minimal by its
aggregation and other forms of further processing, these factors will not be considered in the
scope of study.
2.2 Traditional models of service quality and customer satisfaction
Parasuraman and his colleagues (1988) developed a scale for measuring service quality,
which is popularly known as SERVQUAL. This scale measures the difference between
expectations and perceptions on the five dimensions of service quality known as: tangibility,
reliability, responsiveness, assurance and empathy. The elaboration of these five dimensions
is presented in Table 1. Customer's perception of service quality is a result from the
16comparison between their expectations before using service and their actual service
experience. SERVQUAL-based data analysis can take many forms: item-by-item analysis
(e.g. P1–E1, P2–E2); dimension-by-dimensional analysis (e.g. (P1 + P2 + P3 + P4)/4) – (E1
+ E2 + E3 + E4)/4) where P1 to P4 and E1 to E4 represent interpretation and expectation
statements in a single dimension, respectively (Buttle, 1996). There have been many studies
that use this scale in various contexts such as hospitals (Amin and Zahora Nasharuddin,
2013), banking (Nandi and Debarati Deb, 2011), electricity (Achchuthan, Sivathaasan and
Jayasundara, 2014) . However, this popular scale is also the subject of criticism which
suggests that customization to specific services should be done when applying the scale
(Lapierre et al., 1996).
Table 1: Five Broad Dimensions of Service Quality
Dimension Definition
Tangibles Physical facilities location, supplies, staff and written materials
Reliability Ability to conduct the service offered with reliability and accuracy
Responsiveness Willingness to help customers and deliver timely service
Assurance Awareness and courteousness of employees and their ability to
encourage confidence and trust
Empathy Caring, quick access, good communication, knowledge of customers
and individualized customer service
This validity of (P-E) framework has been criticized because of the conceptualization and
measurement problems of expectation component of the SERVQUAL scale (Jain and Gupta,
2004). This vagueness of expectation concept has asked for the need of a more precise scale,
the SERVPERF model of Cronin and Taylor (1992). This model discarded the expectation
component of SERVQUAL and only used the performance component instead.
The empirical research on SERVPERF model points out that customer's perception is the
best reflection for the service quality. This approach includes gaining an awareness of the
service needs perceived by the target clients. According to this model, service quality is equal
to customer's perception. SERVPERF scale also used 5 factors and 22 perception items as in
17the SERVQUAL model, but it ignores the expectation items. Nevertheless, results from a
multi-industry study suggested that the SERVPERF scale may have problem with
consistency and generalization factor structure (Taylor and Cronin, 1994). The equation for
SERVPERF can be expressed as:
SQi j 1 Pi j
k
Where
SQi = perceived service quality by individual ‘i’
k = Number of attributes/items
Pij = Perception of individual ’i’ with respect to performance of a service firm on
attribute ‘j’
There were many arguments about the superiority of either SERVQUAL or SERVPERF in
measuring service quality. A research of Carrillat and others (2007) shows that both models
are equally valid in predicting overall service quality. Other researchers, however, point out
that SERVQUAL are used to diagnose service issues and measure the variance of dependent
constructs, while SERVPERF is known as a tool to predict outcome variables such as
customer satisfaction and brand loyalty (Cronin, Brady, & Hult, 2000 ).
Skogland and Siguaw (2004) used Expectation-Disconfirmation, Equity Theory, and
Comparison-Level Theory to explain customer satisfaction. Among these theories,
Expectancy Disconfirmation is one of the most influential theories, and it gains increasing
acceptance (Ekinci, Massey, & Dawes, 2008). According to this theory, there was a
comparison between expectations and disconfirmation of those expectations. The
disconfirmation is the result of difference between prior expectation and actual performance.
2.3 Models on customer satisfaction in airline industry
Measuring customer satisfaction is perhaps the most common way of measuring a company's
success and providing critical details for the improvement process. Although there have been
considerable amount of research on service quality over years, studies on this topic in airline
industry are limited compared to other industries. This part will look at few of them.
18Aydina and Yildirim (2012) examined service quality using SERVQUAL model by
Parasuraman’s et al.’s (1988) for different domestic airline firms in Turkey. In this research,
the authors used five service quality dimensions, namely Tangibility, Reliability,
Responsiveness, Assurance and Empathy. Significant differences between expectations and
perceptions were investigated. By using Pearson Chi-square tests, a significant relationship
between preference toward airline firms and preference toward airline services among
passengers was found. The Cronbach's Alpha values were used to test for passengers'
expectations and perceptions. One-way ANOVA test was used to evaluate the significance of
difference between expectations and perceptions. The authors also found out that the most
important dimension in SERVQUAL scale was "Reliability". It was suggested that for the
further research, the demographics of the sample should be varied. The use of SERVQUAL
for this kind of service also showed the difference between Turkish Airlines THY (Türk Hava
Yolları) and other domestic airline firms in Turkey.
In another scenario, Gilbert and Wong's research (2003) looked at the service dimensions that
mattered the most to airline passengers. In this research, data was collected from passengers
departing Hong Kong airport. The paper focused on the link between customer expectations
and service quality. The study demonstrated how an airline can utilize a measure of
passengers' expectations as a tool to manage its service quality. The findings showed major
variations between passengers from different ethnic groups, nationalities and for various
purposes of travel. With regards to the most important service dimension, assurance was
ranked first, which meant that the passengers concerned about safety and securities.
Assessing passenger expectations was not an easy task because the passengers are sensitive to
quality, and all service dimensions are not equally important to them. In this paper, the
authors emphasized on two hypotheses. The first one was: "If passengers are of different
ethnic groups/ nationalities then there will be significant difference in their expectations of
desired airline service quality", and the second one was: "If passengers are the decision-
makers in choosing the airline, then their expectations of desired airline service quality will
be significantly different from those of non-decision-makers". The methodology employed
in this research was a combination of the Key Purchase Criteria formulated by Mason (1995)
and the use of SERVQUAL (Parasuraman et al., 1988). Instead of using five dimensions
model, David and Robin (2003) chose seven categories to measure which includes reliability,
assurance, facilities, employees, flight patterns, customization and responsiveness. Findings
revealed that Reliability was not the most important dimension as indicated in the previous
19studies, but Safety took that role. Consequently, more measures in security gave passengers
more confidence. The authors also pointed out that Customization (loyalty and frequent flyer
programs) and Facilities (in-flight entertainment; waiting lounges and in-flight internet)
should be re-examined and targeted to the right audience.
The application of SERVQUAL in airline industry was also seen in another research of Chau
& Kao (2009) conducted in an Eastern (Taiwan) and a Western (UK) country to examine the
differences in expectations of service quality between the two areas. The Gap-5 values
between perceived and expected service quality from respondents were also recorded. The
Gap-5 depends on the size direction of the four disconfirmations relevant to the marketer's
delivery of service quality. The study results showed that there was a statistically significant
difference between the level of service quality perceived and expected, and these differences
were affected by demographic factors such as education, occupation and income levels.
However, the examination of Gap-5 values also indicated that there seemed to be no
statistically significant difference for respondents in the two locations under study. To
examine whether these Gap-5 values for each of the measure are statistically significant,
paired sample t-tests were performed for each of the five pairs, the mean differences were
shown as large enough to be statistically significant.
Suhartanto and Noor's study(2012) worked on the hypothesis of whether the service quality
and price together substantially influenced customer satisfaction in full-service and low-cost
airlines. There were seven variables examined in this research, including tangible, empathy,
reliability, responsibility, assurance, price and customer satisfaction. The authors ran the
regression test of service quality and price on customer satisfaction. Regression test indicated
that changes in service quality and price explained 46.4% of changes in customer satisfaction.
The findings also showed that respondents using full-service airlines received better service
quality than low-cost airlines respondents on all service quality dimensions. The largest
difference in service quality between full-service and low-cost airlines occurred in the
Empathy dimension, and the smallest one was the Tangible dimension. In summary, the study
shows that customers of full-service airlines were more satisfied than those who used low-
cost airlines. It was suggested by the researchers that attitude of employees in delivering
services and the price factor should also be taken into consideration to improve customer
satisfaction for both types of airlines.
20Clemes et al.’s (2008) analyzed customer satisfaction in international air travel by looking at
seven dimensions, namely: timeliness, assurance, convenience, helpfulness, comfort, meals,
and safety and security. The findings revealed that these dimensions were positively related
to perceived service quality in international travel. Among these, safety and security were the
most important dimension. This finding might be partly explained by the time of the research,
which was after the incidents of global terrorism, SARS outbreak and the bird flu. The scope
of research was broadened to customers who traveled all over the world, and not restricted
within any single country. In terms of methods, this study used a range of statistical analyses.
For example, exploratory factor analysis resulted in seven factors corresponding to the seven
theoretical dimensions. Multiple regression analysis was used to test hypothesis. ANOVA
and t-tests were carried out to determine whether passengers with different socio-
demographic characteristics had different impressions of the quality of service.
As can be seen, not many researches have been done in the Vietnam airline market and the
methodology used were quite similar. A new approach will be conducted in this paper to to
process such questionnaire data and show how this lossless aggregation can help in improve
development strategies for Vietnam aviation industry.
213. THEORETICAL FRAMEWORK
This chapter discusses research methods used in this thesis by explaining why certain
methods were chosen over others, and describing how the empirical parts of this study were
conducted. There are many empirical studies on customers' evaluation of service quality.
Some methods used in previous studies include a combination of qualitative and quantitative
methods in longitudinal research designs (Arnould & Price, 1993), case studies (Frow &
Payne, 2007), and scale development (Klaus & Maklan, 2009). The methodological
challenges of measuring customer evaluation of service quality are usually due to the
complexity of the service quality concept.
3.1 Likert scale
Likert scale is one of the most popular instruments used to collect data on variables which
normally cannot be directly observed, so-called latent traits (such as feelings, behaviors,
expressions, and opinions). It was first introduced by Likert in 1932. Typically, each question
has a five-response scale. For example, the response can go from 1 = strongly disagree to 5=
strongly agree. Depending on what is measured, the labels of responses on the scale can be
worded differently. Many studies have been using this scale in various fields, such as patient
advocacy in hospital (Seal, 2007), organizational behavior in learning organization
(Kiedrowski, 2006), customer attitudes towards labeling in nutrition (Lindhorst, Corby,
Roberts, & Zeiler, 2007) or student perspectives of engineering education (Li, McCoach,
Swaminathan, & Tang, 2008).
However, the Likert scale has some disadvantages. The response categories have a rank order,
but the intervals of values between the categories cannot be considered the same. Blaikie
(2003) showed that researchers usually assume equal intervals between the responses in
Likert scales. It is not logical to think that the intensity of feeling between the categories in
the five-point scale is equal. Thinking in this way could lead to a wrong assumption about the
significance of the research. A Likert scale is basically an ordinal scale measure, and the idea
of whether arithmetic operations can be applied to this scale is still very controversial.
Jamieson (2004) pointed out that assigning the labels such as “strongly agree”, “agree”,
22“neutral”, “disagree” and “strongly disagree” to numerical values such as 1 to 5 violated the
basic assumption of ordinal measures.
Furthermore, researchers often combine the scores from each item to measure the variables.
Sukasem and Prasitratsin (2007) argue that this practice is not appropriate as the weight of
each item may be not equal. Another downside of the Likert scale is rooted from its closed
response format. As pointed out by Hodge and Gillespie (2003), answers from people who
are forced to choose from a set of ready-made answers may be not the same as their true
thinking, and somehow the responses collected may just reflect an acceptable preciseness.
For the above reasons, the data computed from the Likert scale with conventional methods
could be unreliable and distorted. Some studies have attempted to improve the Likert scale.
For example, Chang (1994) pointed out that adding more levels to the scale could obtain
better details. Russell and Bobko (1992) also suggested that the information captured would
be more accurate if there were more scale points. However, Chang (1994) realized that the
more scale points increased the chance of errors occurring because respondents might be
mistaken or confused by too many response categories. Moreover, too detailed responses
which can result in long questionnaires may discourage respondents’ participation.
The methodology in this thesis will look at alternative way to deal with the interval-level of
Likert scale by using fuzzy logic to develop a more suitable case. This new approach permits
partial agreement on the scale points and overcomes the problem of information lost arising
from the ordinal nature of the traditional Likert method.
3.2 Fuzzy logic
The fuzzy logic is proposed by Lotfi Zadeh, who dealt with approximate answers rather than
precise ones in 1965. Zadeh points out two principal rationales for fuzzy logic (FL)
generalization in his paper. First, FL-generalization helps to build models that take into
account the reality. The second rationale relates to the exploitation of tolerance for
imprecision. This property of fuzzy logic is widely utilized because it opens the door for
simplifying design and lowering costs. As the critics of fuzzy theory argued, in most cases,
classical mathematical theories or bivalent logic might have ability to build the same product
or result without the aid of fuzzy theory. However, fuzzy has its strength to solve problem in
a simplified and cost-effective way (Zadeh, 2015).
23Our daily language often involves imprecise and fuzzy information, hence fuzzy logic is
normally seen in social science research. For example, when we say: “The way to school is
far”, it is hard to measure as the definition of the “far” concept cannot be easily defined.
Different people will have different opinions or views about being “far”. In other words,
fuzzy logic can handle relative importance of precision. This perspective is related to the
question: “How important is it to be exactly correct when a rough answer will do?”. Look at
the earlier example when applying a traditional sets theory with crisp numbers. The distance
will either belong to a set (denoted as 1) or does not belong to the set (denoted as 0). For
instance, the distance to school can be considered as “far” when it is more than 15km away
from home (set 1), while the distances within 15km and below belong to the other set (set 0).
However, this convention can be misleading as 14 or 15km can be thought as “far” for many
people. When the logic of fuzzy set is adopted, it allows the membership of a variable to
operate over the range from 0 to 1. Values between 0 and 1 represent a partial or fuzzy
membership of the variable in a set.
Fuzzification is a process by which input variables are translated into fuzzy values identified
by membership degrees and their associated membership functions. This method results in a
set of combined fuzzy values and then we evaluate the fuzzy values using the theories of
social science in combination with fuzzy set laws.
Development of fuzzy logic can potentially be incorporated into decision making in multiple
areas. Various applications of fuzzy set theory have been created over time, expanding
benefits of fuzzy logic in tackling management problems. Nowadays, artificial intelligence is
widely discussed along with neural networks, which are adaptive and hence efficient in
learning process. Intelligent systems are rapidly improving and getting faster by their ability
of learning through experience. Applications of fuzzy vary greatly and can be found in
various fields (Singh et al., 2013): financial area (e.g. stock market prediction, fraud detection,
economic indicator forecasts), medical area (e.g. medical diagnosis, treatment cost
estimation), sales and marketing (e.g. sales forecasting, usage forecasting), chemical industry
(e.g. control of distillation processes) and other industries. This section mostly covers
application examples in decision-making contexts such as disaster management, human
resources management and finance (pricing of new products).
Stoklasa (2011) evaluated the performance of academic faculties to identify the staffs’
strengths and weaknesses, which could be used for bonus allocations and task assignments.
24The evaluation process was defined linguistically using a linguistic fuzzy rule base for
aggregating partial evaluations into two key areas of interest-Pedagogical Activities (PA) and
R&D. The input data for this study’s model included the information of all activities
performed by current staff members on a yearly basis. In the model, partial evaluations were
determined simply as multiples of standard scores for the current work position and areas of
interest, but the aggregation of these partial evaluations was performed by a fuzzy-rule-based
system. Staff were asked to fill out a questionnaire in which they earned scores for different
tasks according to their value and time requirements. Three areas were taken into
consideration for PA evaluation. They were: (i) lecturing, (ii) the supervision of students, and
(iii) works associated with the development of fields of study. The RD evaluation was based
on the methodology validated in the Czech Republic. This involved highly graded activities
(papers in influential journals , books, patents, etc.) and other significant activities (project
management awards, memberships in the editorial board, etc.). Both PA and RD areas were
assigned standard scores. The author pointed out weaknesses in the use of traditional methods
such as Weighted Average (WA), Ordered Weighted Average (OWA), on the normalized
partial evaluations. Specifically, these methods did not appreciate excellent performance and
penalize unsatisfactory performance. It was unfair to use fixed weights to evaluate staff
members according to their own strengths because it made people concentrate on the areas
with higher weights. In order to avoid the disadvantages of balanced results, it is better to use
fuzzy linguistic modeling in which the relationships between inputs and outputs are
linguistically represented. It is advisable that partial evaluations for PA and RD should be
determined in terms of standard score multiples. While the PA evaluation is based mainly on
the time spent on the activities (such as number of lectures, seminars, and examined students),
the RD area is scored according to the importance of the final work (such as paper, book,
invited lecture at a conference, etc.)
Cret and Laurence (1993) proposed a decision-making model based on fuzzy set theory for
emergency shut-off of city gas networks in earthquake. The estimation of earthquake damage
is used for various purposes such as planning repair work, calculating economic loss and so
on. It can even be more critical for gas networks because wrong decision making in this case
can lead to secondary disasters due to gas leakage. If heavily damaged area is detected, gas
supply should be suspended. It implies that emergency shut-off decision is critical and
earthquake damage estimation should be efficiently utilized for more credible shut-off
decision-making. The system proposed by Cret and his colleague (1993) was based on fuzzy
25set theory. It formulated knowledge obtained from experiences and experts, and then
estimated earthquake damage from characteristics of ground motions and conditions. The
results were a fuzzy damage index. Finally, fuzzy decision analysis was performed to
transform the fuzzy index into clear bound decision on whether to shut-off the gas network in
a given area or not (Cret and Laurence 1993). The model suggested by Cret and Laurence
(1993) is basically a decision-making system based on fuzzy expert system. During the
disaster incidents, responsiveness might be more weighted than precision due to the time and
resources limitation. Therefore, fuzzy decision support model can be considered as more
practical than rigorous mathematical models. Cret and Laurence’s research (1993) can be
considered as exploiting strengths of fuzzy logic-based models.
As can be seen, all the researches mentioned above showed that this logic of fuzziness will be
useful when one wants to incorporate the weights of importance into our analysis as it helps
translate the rate range into a more reasonable range, in other words, from a general Likert
scale to concrete membership function. Further discussion of how this method can be applied
can be found in section 6.2.2 of the paper.
3.3 Distance from ideal
The Likert scale is often used to measure attitudes, beliefs and opinions, and it is one of the
most popular measurements for survey design. It allows respondents to answer the questions
based on degrees of their agreement or disagreement. The 5-point Likert scale is chosen for
this thesis because it requires less ability from respondents to define their correct feeling or
experience. If the 7-point scale is used in a survey, respondents may choose their answers at
random, and thus the data collected will be random. The 5-point scale is also easier for
researchers to analyze data, and for survey respondents to stay focused on the questionnaire.
Furthermore, the 5-point scale is strongly recommended from previous studies (Fink,1995).
The scale with the odd number of points includes a clear mid-point which can be considered
as indifferent point because it does not show any preference to either directions. In this scale,
the linguistic labels are assigned with the numerical levels. The values obtained from this
scale should be considered to originate from an ordinal scale. Then we can apply aggregation
methods on the converted Likert scale values.
26The introduction of distance from ideal can be defined as how far the measured sample is
away from the ideal, with the ideal as the best or desired evaluation on the scale. In this
situation, the degree of fulfillment of a given target can be calculated. It seems illogical to
characterize the ideal as extreme answers in the sense of a potential central-tendency bias,
since such an production might not be attainable. It is noted that defining unachievable ideal
evaluations can seriously bias the absolute type of evaluation procedure. The degree to which
the ultimate target is achieved can be defined as normalized similarity of the group evaluation
to the ideal assessment.
3.4 Histogram aggregation
In market research, getting full information from the perceived importance of criteria can
provide lots of meaningful insight into the answers of the respondents. Visual representation
of quantitative data helps to translate and explain those information in an effective way. Data
is normally presented in various forms such as bar graph, histogram, pie chart and line graph.
Whereas the bar charts are good to represent categorical data, histograms are good for
representing a continuous variable on the horizontal axis. Histograms also help to give
knowledge about the data distribution, whether it skews to the left or to the right, or clumps
in the middle. This thesis uses histogram to aggregate answers collected after the survey.
Moreover, it takes into account multiple criteria obtained by multiple experts into one overall
evaluation. In other words, it proposes the concept of two-dimensional histogram to represent
data with subjective importance of partial evaluations. With the above explanation, it is fair to
say histogram aggregation is a lossless and novel approach to minimize information loss and
distortion.
27You can also read