Dimethyl sulfide dynamics in first-year sea ice melt ponds in the Canadian Arctic Archipelago
←
→
Page content transcription
If your browser does not render page correctly, please read the page content below
Biogeosciences, 15, 3169–3188, 2018
https://doi.org/10.5194/bg-15-3169-2018
© Author(s) 2018. This work is distributed under
the Creative Commons Attribution 4.0 License.

Dimethyl sulfide dynamics in first-year sea ice melt ponds in the
Canadian Arctic Archipelago
Margaux Gourdal1 , Martine Lizotte1 , Guillaume Massé1 , Michel Gosselin2 , Michel Poulin3 , Michael Scarratt4 ,
Joannie Charette2 , and Maurice Levasseur1
1 Département   de biologie, Québec-Océan and Unité Mixte Internationale 3376 TAKUVIK, CNRS-Université Laval,
1045 Avenue de la Médecine, Ville de Québec, Québec G1V 0A6, Canada
2 Institut des Sciences de la Mer de Rimouski (ISMER), Université du Québec à Rimouski, 310 Allée des Ursulines,

Rimouski, Québec G5L 3A1, Canada
3 Research and Collections, Canadian Museum of Nature, P.O. Box 3443, Station D, Ottawa, Ontario K1P 6P4, Canada
4 Maurice Lamontagne Institute, Fisheries and Oceans Canada, P.O. Box 1000, Mont-Joli, Québec G5H 3Z4, Canada

Correspondence: Margaux Gourdal (margaux.gourdal@takuvik.ulaval.ca)

Received: 15 October 2017 – Discussion started: 21 November 2017
Revised: 4 April 2018 – Accepted: 7 May 2018 – Published: 29 May 2018

Abstract. Melt pond formation is a seasonal pan-Arctic pro-      1   Introduction
cess. During the thawing season, melt ponds may cover up
to 90 % of the Arctic first-year sea ice (FYI) and 15 to 25 %    Melt ponds represent an important but understudied compo-
of the multi-year sea ice (MYI). These pools of water ly-        nent of the Arctic sea ice system. Snow deposited at the sur-
ing at the surface of the sea ice cover are habitats for mi-     face of the sea ice progressively melts during the thawing
croorganisms and represent a potential source of the bio-        season and may accumulate above sea level in depressions
genic gas dimethyl sulfide (DMS) for the atmosphere. Here        at the surface of the ice to form melt ponds (Lüthje et al.,
we report on the concentrations and dynamics of DMS in           2006), likely through a recently identified process of perco-
nine melt ponds sampled in July 2014 in the Canadian Arc-        lation blockage (Polashenski et al., 2017). In the Arctic, melt
tic Archipelago. DMS concentrations were under the detec-        pond fraction over first-year sea ice (FYI) in late spring–
tion limit (< 0.01 nmol L−1 ) in freshwater melt ponds and       summer usually ranges from 50 to 60 %, locally reaching
increased linearly with salinity (rs = 0.84, p ≤ 0.05) from      90 % (Fetterer and Untersteiner, 1998; Eicken et al., 2004;
∼ 3 up to ∼ 6 nmol L−1 (avg. 3.7 ± 1.6 nmol L−1 ) in brackish    Lüthje et al., 2006; Perovich et al., 2011). Rösel et al. (2012)
melt ponds. This relationship suggests that the intrusion of     reported a 15 % increase of the relative melt pond fraction
seawater in melt ponds is a key physical mechanism respon-       for the month of June during the last decade (2001–2011) in
sible for the presence of DMS. Experiments were conducted        the Arctic, most likely attributable to global climate change.
with water from three melt ponds incubated for 24 h with and     This partly reflects the progressive replacement of multi-year
without the addition of two stable isotope-labelled precur-      sea ice (MYI) by FYI observed since the 1980s (National
sors of DMS (dimethylsulfoniopropionate), (D6-DMSP) and          Snow and Ice Data Center, NSIDC, http://nsidc.org, last ac-
dimethylsulfoxide (13 C-DMSO). Results show that de novo         cess: June 2017), favouring the formation of shallow melt
biological production of DMS can take place within brack-        ponds that spread over increasingly large areas (Agarwal et
ish melt ponds through bacterial DMSP uptake and cleav-          al., 2011; Ehn et al., 2011). The importance of melt ponds in
age. Our data suggest that FYI melt ponds could represent        the Arctic, as a water–air interface involved in heat and gas
a reservoir of DMS available for potential flux to the atmo-     exchanges, is thus expected to increase in the future.
sphere. The importance of this ice-related source of DMS for        Dimethyl sulfide (DMS) is the main natural source of re-
the Arctic atmosphere is expected to increase as a response to   duced sulfur for the atmosphere (Bates et al., 1992). Be-
the thinning of sea ice and the areal and temporal expansion     tween 17.6 and 34.4 Tg of sulfur is released annually from
of melt ponds on Arctic FYI.                                     the ocean to the atmosphere (Lana et al., 2011), accounting

Published by Copernicus Publications on behalf of the European Geosciences Union.
3170                                            M. Gourdal et al.: Dimethyl sulfide dynamics in first-year sea ice melt ponds

for 50–60 % of the natural reduced sulfur emitted (Stefels et       viral lysis, and zooplankton grazing. DMSPd is then read-
al., 2007). DMS is also a climate-relevant gas potentially in-      ily available to heterotrophic bacteria as carbon and sulfur
volved in a feedback loop known as the CLAW hypothesis              sources (Kiene et al., 2000; Simó, 2001; Vila-Costa et al.,
(Charlson et al., 1987) linking biology and climate through         2006). The fraction of DMSPd consumed by heterotrophic
the production of DMS-derived sulfate aerosols. According           bacteria and enzymatically cleaved by DMSP lyases into
to CLAW, DMS emissions may affect the global radiation              DMS (DMS yield) may vary depending on the composition
budget directly through the scattering of incoming solar radi-      of microbial communities, their sulfur requirements, and the
ation and indirectly via the production of cloud condensation       availability of other reduced forms of sulfur (Kiene et al.,
nuclei (CCN), leading to the genesis of longer-lived clouds         2000; Stefels et al., 2007). DMSP lyases are also present in
with higher albedo (Twomey, 1974; Albrecht, 1989). Inspir-          several members of the microalgal groups Haptophyceae and
ing three decades of research and hundreds of publications,         Dinophyceae and, to a lesser extent, Chrysophyceae (Niki et
the feedback mechanism proposed by Charlson et al. (1987)           al., 2000). Ultimately, between ∼ 1 and 40 % of the DMSP
remains to be demonstrated in its entirety (e.g. Ayers and          produced by algae reaches the atmosphere as DMS (Stefels et
Cainey, 2008). Although modelling results show that DMS             al., 2007; Simó and Pedros-Alio, 1999a). In addition to the
emissions may have a negative radiative effect (e.g. Bopp et        DMSP enzymatic cleavage pathway, DMS production may
al., 2004; Gunson et al., 2006; Thomas et al., 2010), CCN           arise from dimethylsulfoxide (DMSO) reduction by various
may exhibit a low sensitivity to changes in DMS on a global         groups of marine bacteria including proteobacteria (e.g. Vogt
scale (Woodhouse et al., 2010). Recent studies questioning          et al., 1997), members of the Roseobacter group (González et
the relative importance of DMS in new particle formation            al., 1999), and mat-forming cyanobacteria (van Bergeijk and
have emerged, suggesting that the global CLAW feedback              Stal, 1996). However, the ubiquity of this DMSO-to-DMS re-
may be weak (e.g. Quinn and Bates, 2011; Green and Hatton,          duction pathway amongst bacterial assemblages has not been
2014). On a regional scale, however, the response of CCN            established (Hatton et al., 2012). A limited number of phy-
production to change in DMS may vary by a factor of 20              toplankton species could also be involved in the reduction
(Woodhouse et al., 2010). The impact of DMS emissions on            of DMSO into DMS (e.g. Fuse et al., 1995; Spiese et al.,
cloud properties (through the production of CCN) could be           2009). Increasing evidence suggests that particulate DMSO
particularly important in remote pristine marine areas such         (DMSOp ) may be directly synthesized by a potentially wide
as the polar regions (Carslaw et al., 2013). In the Southern        range of marine phytoplankton and could be involved in os-
Ocean, DMS may have contributed up to 33 % of the increase          moprotection, cryoprotection (Lee and de Mora, 1999), and
in CCN observed south of 65◦ S as a response of increased           antioxidant protective mechanisms (Sunda et al., 2002). As
wind speed since the early 1980s (Korhonen et al., 2010).           for dissolved DMSO (DMSOd ), it is ubiquitous in seawater
The summertime Arctic marine boundary layer (MBL) is                and continuous improvements in analytical techniques sug-
left relatively clean after seasonal wet deposition of particles    gest that DMSOd may be as abundant as DMS in surface wa-
and reduced atmospheric transport of aerosols from anthro-          ters (e.g. Simó et al., 2000). DMSO is also a known sink for
pogenic sources at lower latitudes (Stohl, 2006; Browse et al.,     DMS (Hatton et al., 2004) via bacterial and photo-oxidation
2012; Croft et al., 2016). Such pristine conditions, combined       of DMS to DMSO. Vertical mixing and ventilation are also
with thermally stable MBL, are typical of the Arctic summer-        major removal processes influencing DMS concentrations in
time (e.g. Aliabadi et al., 2016). Clean Arctic air masses al-      surface mixed layers (Bates et al., 1994; Kieber et al., 1996;
low ultrafine (5–20 nm diameter) particle formation (Burkart        Simó and Pedrós-Alió, 1999b; del Valle et al., 2007, 2009).
et al., 2017) and the potential growth of secondary marine or-         Ice-associated environments such as bottom sea ice, brine
ganic aerosols (including DMS-derived particles) into CCN           channels, melt ponds, under-ice surface waters, and leads
(Willis et al., 2016). Hence, the Arctic is a favourable terrain    provide complex and dynamic habitats to diverse microor-
for new particle formation from biogenic DMS (Chang et al.,         ganism communities involved in sulfur cycling (Levasseur,
2011; Rempillo et al., 2011; Collins et al., 2017; Giamarelou       2013). In the Arctic, the highest microalgal biomasses are
et al., 2016; Mungall et al., 2016; Willis et al., 2016).           found in the bottom ∼ 0.1 m of sea ice, with chlorophyll a
   DMS stems mainly from the enzymatic cleavage of                  (Chl a) concentrations several orders of magnitude above
dimethylsulfoniopropionate (DMSP) by algal and bacterial            values for under-ice waters values (e.g. Legendre et al.,
DMSP lyases. DMSP is a cellular metabolite found in several         1992). A similar pattern of DMSP, DMSO and DMS build-
phytoplankton species as particulate DMSP (DMSPp ) (see             up in bottom ice has been reported both in the Arctic and
the review of Green and Hatton, 2014). DMSPp plays vari-            Antarctica (Kirst et al., 1991; Levasseur et al., 1994; Turner
ous roles in phytoplankton, including osmoregulation (Lyon          et al., 1995; DiTullio and Smith Jr., 1995; Lee et al., 2001;
et al., 2016), cryoprotection (Karsten et al., 1996), and pre-      Trevena et al., 2003; Trevena and Jones, 2006; Delille et al.,
vention of cellular oxidation (Sunda et al., 2002). Part of the     2007; Tison et al., 2010; Asher et al., 2011; Nomura et al.,
DMSPp produced by algae is released in the water column             2012; Galindo et al., 2015). For example, DMSPp concen-
as dissolved DMSP (DMSPd ) via several pathways reviewed            trations up to 15 000 nmol L−1 have been documented dur-
in Stefels et al. (2007), including active exudation, cell lysis,   ing spring in bottom FYI of the eastern Arctic (Galindo et

Biogeosciences, 15, 3169–3188, 2018                                                     www.biogeosciences.net/15/3169/2018/
M. Gourdal et al.: Dimethyl sulfide dynamics in first-year sea ice melt ponds                                               3171

al., 2014) while surface water concentrations generally range       may originate from algal and bacterial metabolism. How-
between 1 ± 0.2 and 50 nmol L−1 (Vila-Costa et al., 2008;           ever, in situ DMS production had never been measured nor
Matrai and Vernet, 1997). DMSP, DMSO, and DMS are also              had key mechanisms been identified. Here, we report on the
present throughout the ice column within the brine network          DMS concentrations in nine melt ponds located in the eastern
(Levasseur et al., 1994; Trevena and Jones, 2006; Asher et          Canadian Arctic Archipelago (CAA) and on the prerequisites
al., 2011). Given that primary producers are the sole source        and processes responsible for the presence of this climate-
of DMSP, very high ice concentrations of Chl a can be cor-          active gas. This is the first attempt to assess the dynamics
related with DMSP through a first-order relationship (Lev-          of DMS in Arctic melt ponds. We identified sea ice perme-
asseur, 2013). This Chl a to DMSP relationship may not hold         ability as a major control of DMS production in melt ponds,
for lower biomass concentrations (Tison et al., 2010). In ad-       mediating the transport of both DMS and DMS-producing
dition to the variability induced by inter-specific differences     communities toward the surface of sea ice. We also provide
in DMSP cellular contents (e.g. Keller et al., 1989; Stefels,       the first evidence for direct in situ DMS production in Arc-
2000), environmental forcing are known to control DMSP,             tic melt ponds. We propose that seasonally melting sea ice
DMSO, and DMS concentrations. In ice-associated environ-            might become increasingly prone to DMS production as FYI
ments, brine volume fraction might also be key in explaining        become largely predominant on the regional scale.
DMS cycling variability via the control of ice permeability
(Carnat et al., 2014). Structural changes within sea ice dur-
ing the melt season, namely increases in brine volume frac-         2     Materials and methods
tion and ice desalination, result in increased connectivity and
permeability in the warming sea ice (Willis et al., 2016; Po-       2.1    Study sites and environmental measurements
lashenski et al., 2012) and influence DMSP and DMS cycling
(Tison et al., 2010; Carnat et al., 2014). Also, phytoplankton      Nine melt ponds distributed between four stations located
blooms developing under the ice during the melting period           in Navy Board Inlet (Ice1–MP1 and MP2–18 July), Bar-
have been shown to produce large quantities of DMSPp , po-          row Strait (Ice2–MP1 to MP3–20 July and Ice3–MP1 and
tentially leading to a build-up of DMS concentrations (Lev-         MP2–21 July), and Resolute Passage (Ice4–MP1 and MP2–
asseur et al., 1994). In spite of the spatial importance of melt    23 July) were sampled during the joint NETCARE/ArcticNet
ponds, only a few studies have investigated their role as a         research cruise conducted in 2014 on board the Canadian
source of DMS for the Arctic atmosphere (e.g. Levasseur,            Coast Guard Ship (CCGS) Amundsen (Fig. 1).
2013).                                                                 At each station except for Ice2 (logistical constraints as-
   Considerable efforts have been dedicated to the under-           sociated with ship time line), measurements of sea ice thick-
standing of underlying process controlling the physics of           ness, snow depth, and sea ice freeboard (the height of sea ice
melt ponds and their feedbacks on climate through the con-          above the ocean surface) were conducted within a 3 m dis-
trol of surface energy balance of the ice (Lüthje et al., 2006;     tance of the melt ponds using a gauge (Kovacs Enterprise,
Polashenski et al., 2017). However, little is known about their     Roseburg, OR, USA) (Table 1). The 3 m distance was a com-
biogeochemistry. Four studies have specifically reported on         promise between maximizing the proximity of ice and melt
DMS in melt ponds so far. They reveal negligible DMS                pond samples and minimizing melt pond disturbance during
concentrations in MYI ice melt ponds in the central Arctic          sampling operations. Ice and freeboard thickness presented
Ocean and concentrations up to 2.2 nmol L−1 in the High             in Table 1 are averaged values of the seven (Ice1) to eight
Arctic (Leck and Persson, 1996; Sharma et al., 1999). In            (Ice3 and Ice4) ice cores sampled at each station between
Antarctica, DMS concentrations ranging between 1.1 and              the team members for their respective projects. In order to
3.7 nmol L−1 and between below the detection limit (d.l.) and       estimate the permeability of the ponded ice, sea ice tem-
250 nmol L−1 were measured in two studies (Nomura et al.,           perature and bulk salinity were measured following Miller
2012, and Asher et al., 2011, respectively). In the latter study,   et al. (2015) at stations Ice1, Ice3, and Ice4. Two ice cores
bacterial DMSO reduction was suggested as a possible mech-          for sea ice temperature and salinity measurements were ex-
anism responsible for the high DMS concentrations observed          tracted using a 0.09 m core barrel (Kovacs Mark II, Kovacs
although no actual rates of DMS production, either from             Enterprise, Roseburg, OR, USA). In situ sea ice tempera-
DMSO or DMSP, were measured. High DMS concentrations                ture profiles were measured directly, at 0.1 m intervals, us-
reported in the Antarctic are most likely related to the devel-     ing a high-precision thermometer (Testo® 720; precision of
opment of a surface ice community following flooding, a pro-        ±0.1 ◦ C). Corresponding sea ice salinity profiles were also
cess whereby heavy snow load pushes the ice below the water         determined at 0.1 m intervals. Each 0.1 m section was cut
level. Flooding is common in the Antarctic and results in the       with a handsaw, stored in a plastic container, and allowed
formation of snow ice (Hunke et al., 2011). Several studies         to melt at room temperature. Bulk salinity of the melted ice
document melt pond colonization by micro-, nano-, and pico-         section was determined using a conductivity probe (Cond
sized algae as well as bacteria (Bursa, 1963; Gradinger et al.,     330i, WTW™ ; precision of ±0.1 %). Permeability to fluid
2005; Elliott et al., 2015), suggesting that DMS in melt ponds      transport was assessed with brine volume profile calcula-

www.biogeosciences.net/15/3169/2018/                                                      Biogeosciences, 15, 3169–3188, 2018
3172 M. Gourdal et al.: Dimethyl sulfide dynamics in first-year sea ice melt ponds
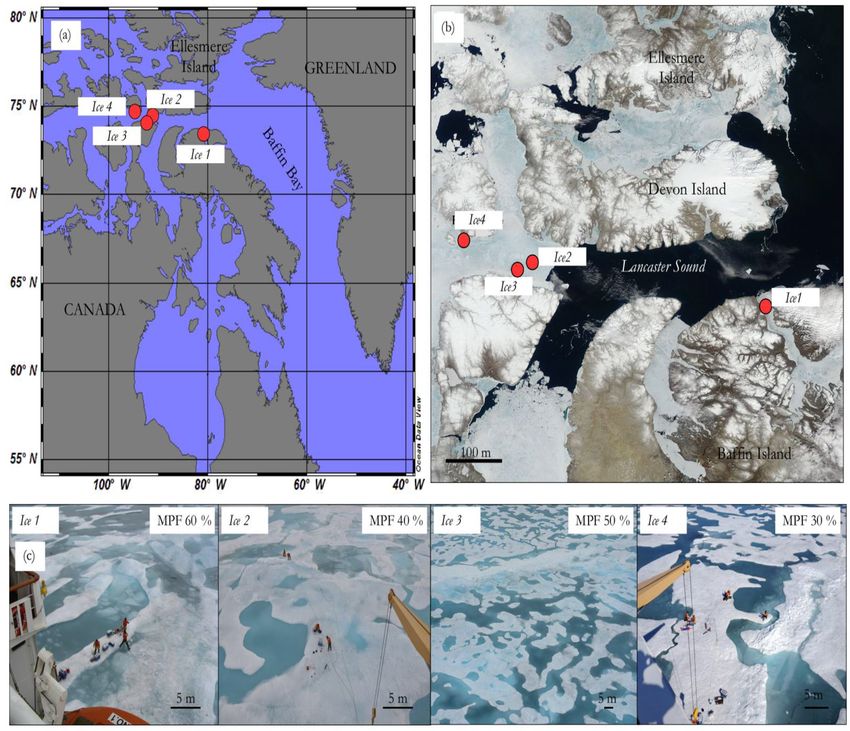
Figure 1. (a) Regional map showing the location of the four sampling stations (Ice1 to Ice4) (red circles) during the NETCARE/ArcticNet
2014 campaign. (b) MODIS imagery above the four sampling station (red circles) showing the ice conditions on 18 July 2014 in the sampling
area. (c) Left to right, pictures of stations Ice1, Ice2, Ice3 and Ice4 with size scale. MPF stands for the melt pond fraction visually estimated
from the bridge for stations Ice1, Ice2, Ice3, and Ice4.
tions from bulk salinities and sea ice temperatures following the extracted pigments was measured on board with a Turner
equations from Leppäranta and Manninen (1988) for sea ice Designs fluorometer (model 10-005R; Turner Designs, Inc.)
temperatures > −2 ◦ C (Fig. 3). Due to logistical constraints before and after acidification with 5 % HCl. The fluorome-
mentioned above, neither ice nor snow measurements were ter was calibrated with a commercially available Chl a stan-
conducted at station Ice2. dard (Anacystis nidulans, Sigma). Chl a concentrations were
Melt pond depth, length, and width were determined us- calculated using the equation provided by Holm-Hansen et
ing a graduated stick and a tape ruler. Melt pond water tem- al. (1965).
perature was measured using a high-precision thermometer Microscopic identification and enumeration of eukaryotic
(61220-601 digital data logger, VWR) and water salinity was cells > 2 µm were conducted in each melt pond. Samples of
measured using the conductivity probe mentioned in the pre- 250 mL were collected and preserved with acidic Lugol so-
vious paragraph (Table 2). For each sampling location, two lution (0.4 % final concentration; Parsons et al., 1984), then
to three members of the research team visually assessed the stored in the dark at 4 ◦ C until analysis was conducted by in-
pond fraction based on pictures taken from the bridge (see verted microscopy (Lund et al., 1958; Parsons et al., 1984).
Fig. 1c for examples) and a mean value was calculated. For each sample, a minimum of 400 cells (accuracy ±10 %)
and three transects of 20 mm were counted at a magnifica-
2.2 Phytoplankton biomass and enumeration, tion of 400 ×. The main taxonomic references used to iden-
bacterial count tify the eukaryotic cells are Tomas and Hasle (1997), Bérard-
Therriault et al. (1999), and Throndsen et al. (2003).
For Chl a quantification, 1000 to 1500 mL duplicates of in The abundance of bacteria was determined by flow cytom-
situ pond water were filtered onto Whatman® GF/F 25 mm etry (Marie et al., 2005). Duplicate 4 mL subsamples were
filters. Pigments were extracted in 90 % acetone for 18 to fixed with 20 µL of 25 % glutaraldehyde Grade I (0.1 % fi-
24 h in the dark at 4 ◦ C (Parsons et al., 1984). Fluorescence of
Biogeosciences, 15, 3169–3188, 2018 www.biogeosciences.net/15/3169/2018/M. Gourdal et al.: Dimethyl sulfide dynamics in first-year sea ice melt ponds 3173
Table 1. Physical characteristics of the sea ice surrounding the melt Table 2. Physical characteristics of the melt pond water. For melt
ponds. Note that only melt pond sampling (i.e. no ice sampling) was pond depth, mean ± standard deviation values are presented.
conducted at station Ice2 due to ship-related logistical constraints.
A negative freeboard height indicates that the ice surface was lo- Station Melt pond no. Melt pond Melt pond Melt pond
cally below the mean sea level. NA stands for non-available data. depth (m) salinity Temperature (◦ C)
Ice thickness and freeboard values are averages of 7 (Ice1) to 8 (Ice3 Ice1 MP1 0.18 ± 0.01 5.2 1.9
and Ice4) ice cores sampled at each station. Ice1 MP2 0.18 ± 0.04 4.1 1.8
Ice2 MP1 0.29 ± 0.05 0.7 0.4
Ice2 MP2 0.19 ± 0.03 0.4 0.3
Station Sampling Snow and Ice Freeboard
Ice2 MP3 0.12 ± 0.01 0.2 0.2
date frozen snow thickness (m)
Ice3 MP1 0.07 ± 0.01 1.1 0.2
depth (m) (m) Ice3 MP2 0.10 ± 0.00 0.9 0.2
Ice1 18 Jul 2014 0 1.21 ± 0.02 −0.01 ± 0.01 Ice4 MP1 0.12 ± 0.01 8.1 0.2
Ice2 20 Jul 2014 0 NA NA Ice4 MP2 0.11 ± 0.02 8.5 0.3
Ice3 21 Jul 2014 0 + 0.07∗ 1.13 ± 0.07 0.10 ± 0.02
Ice4 23 Jul 2014 0 1.27 ± 0.01 0.07 ± 0.04
al. (2012). Briefly, DMS was stripped from liquid samples
using helium gas (Praxair™ He, purity 99.999 %) flowing at
nal concentration; Sigma-Aldrich G5882), then subjected to 50 ± 5 mL min−1 in the PnT system. One to 5 mL of sample
quick-freeze in liquid nitrogen for 24 h, and finally stored was injected in the PnT. Five mL of Milli-Q™ water (Milli-
at −80 ◦ C until analysis. Samples were analyzed using a pore filter system, Millipore Co., Bedford, MA, USA) was
FACS Calibur FCB3 flow cytometer (Becton Dickinson). subsequently pushed into the system to completely flush the
Heterotrophic bacteria samples were stained with SYBR sample into the glass bubbling chamber. The outer walls of
Green I and measured at 525 nm to quantify bacteria with the bubbling chamber were heated at 70 ◦ C with a circu-
low nucleic acid (LNA; potentially less active) and high nu- lating bath. Humidity in the gas sample downstream of the
cleic acid (HNA; potentially more active) content (Gasol and bubbling step was minimized using a 4 ◦ C circulating bath
del Giorgio, 2000; Lebaron et al., 2001). Analysis were per- to trigger condensation. A Nafion® membrane separated the
formed on an Epics Altra flow cytometer (Beckman Coul- gas sample and He-carrier gas from a drying He counter-
ter), fitted with a 488 nm laser (15 mW output; blue), using flow set at 100 mL min−1 to further desiccate the gas sample.
Expo32 v1.2b software (Beckman Coulter). Fluxes in the PnT system were monitored using a flowmeter
(Varian™ ).
2.3 DMS(P) sampling, conservation and analysis For DMSPt samples, 3.5 mL of melt pond water was col-
lected in duplicate into a 5 mL Falcon™ tube. DMSPd sam-
Duplicate samples for total DMSP (DMSPt ), dissolved ples were obtained using the less disruptive small-volume
DMSP (DMSPd ) and DMS measurements were collected gravity drip filtration (SVDF) method (Kiene and Slezak,
from the melt ponds using a submersible pump (Cyclone – 2006). Particulate DMSP (DMSPp ) concentrations were cal-
Aquameric™ ) connected to a sealed lead–acid battery and culated by subtracting DMSPd from DMSPt . DMSP samples
fitted with LDPE tubing. The pump was placed close to the were preserved with 50 µL of 50 % sulfuric acid (H2 SO4 )
pond bottom, without touching the ice. Stratification was re- to prevent DMSP transformation and remove pre-existing
ported in open melt ponds (i.e. melt ponds that have melted DMS. Samples were analyzed using the same methods as
all the way to the sea surface) in Arctic FYI (Jung et al., described above for DMS samples, following mole-to-mole
2015). However, closed FYI melt pond, such as those sam- conversion of DMSP into DMS via NaOH (5 M) hydrolysis
pled during this study, are not prone to vertical stratification (Dacey and Blough, 1987).
due to convective- and wind-driven mixing (Skyllingstad and
Paulson, 2007). Given their shallow depths (less than 0.3 m), 2.4 Process studies
melt pond stratification was most probably inexistent or min-
imal during our study. Glass serum bottles were filled with In order to examine the pathways of in situ DMS production
sampled water, temporarily sealed with a butyl cap and an in melt ponds, three 24 h incubation experiments were con-
aluminum lid, and kept in the dark in a cooler until analy- ducted with water from the MP1 sampled at stations Ice1,
sis upon return to the ship. Analysis were performed using a Ice3, and Ice4. Water from the melt ponds was collected us-
purge and trap (PnT) system coupled to a Varian™ 3800 gas ing the pump described in Sect. 2.3, pooled in clean 19 L
chromatograph (GC), equipped with a pulsed flame photo- Coleman™ cooler jugs on site, and then transferred into gas-
metric detector (PFPD). Analytical precision of the method tight 3 L polyvinyl fluoride Tedlar® bags. Light transmittance
was better than 5 %. Analytical d.l. was 0.01 nmol L−1 for through the incubation bag material diminished with decreas-
all sulfur compounds. The protocol is a modified version ing light wavelength. Between 99 and 92 % of the photosyn-
of the method of Leck and Bågander (1988) as described thetically active radiations (PAR, 400–700 nm) were trans-
in Scarratt et al. (2000) and further revised in Lizotte et mitted through the bag material. Transmittances of ultravi-
www.biogeosciences.net/15/3169/2018/ Biogeosciences, 15, 3169–3188, 20183174 M. Gourdal et al.: Dimethyl sulfide dynamics in first-year sea ice melt ponds olet A radiations (UVA, 315–400 nm) and ultraviolet B ra- DMS versus time in the controls; (3) net potential DMSPd diations (UVB, 290–315 nm) ranged between 92 and 82 and changes in natural light and in the dark derived from the re- between 82 and 38 %, respectively. The incubation bags were gression slope of DMSPd versus time in L-DMSP/O and D- rinsed once with ∼ 10 % HCl, three times with Milli-Q™ wa- DMSP/O; (4) net potential DMS production rate in natural ter, and twice with melt pond water to avoid contamination. light and in the dark derived from the regression slope of The bags were custom-built and pre-closed on three sides DMS versus time in L-DMSP/O and D-DMSP/O. The daily (Dalian Delin Gas Packaging Co., Ltd.). After the addition rates were obtained from the slopes between final and ini- of the melt pond water, the bags were sealed with Clip-n- tial concentrations over 24 h. Our experimental setup also al- seal™ Teflon closure devices. A valve was fitted to each bag lows the estimation of the relative contribution of DMSP and to allow the removal of any remaining bubbles. DMSO to the production of DMS, using the discrimination The samples were subjected to three duplicate treatments of the different isotopes of DMS (see Sect. 2.5). (total of six bags): (1) two bags of unaltered melt pond water incubated under natural light (control), (2) two bags 2.5 DMS isotopic signatures amended with D6-DMSP and 13 C-DMSO (100 nmol L−1 , fi- nal concentration each) incubated under natural light (light- The discrimination of the different isotopic forms of DMS, DMSP/O or L-DMSP/O), and (3) two bags amended with including D6-DMS and 13 C-DMS stemming from D6- D6-DMSP and 13 C-DMSO (100 nmol L−1 , final concen- DMSP cleavage and 13 C-DMSO reduction, respectively, was tration each) incubated in the dark (dark-DMSP/O or D- performed using GC-MS analysis following purging as de- DMSP/O). L- and D-DMSP/O bags were amended with scribed hereafter. Two sets of DMS sample duplicates were ∼ 100 µL of freshly thawed aliquots of two D6-DMSP and taken for the incubation experiments. The first set of du- 13 C-DMSO stock solutions (high purity > 99 %, Sigma- plicates was measured directly on board using the Varian™ Aldrich® ). The high concentrations of isotopes added aimed 3800 GC described in Sect. 2.2. The second set of DMS du- to trigger a rapid and clear biological response (i.e. potential plicates was preserved through cryo-trapping. Cryo-trapping DMS production rates) measurable during our 24 h incuba- of DMS was conducted using glass GC liners filled with tions. DMSP and DMSO uptake are not expected to be mu- Tenax-TA polymer (high sulfur affinity) (Pio et al., 1996; tually exclusive and have been observed concomitantly both Zemmelink et al., 2002; Pandey and Kim, 2009) kept at in live cultures (Spiese et al., 2009) and in situ (Asher et al., −80 ◦ C prior to their use and maintained below −10 ◦ C dur- 2011). ing the 5 min purging and trapping process. The Tenax-filled Bags were incubated on the foredeck of the ship. The tem- deactivated liners were mounted downstream of the PnT sys- perature was kept as near to in situ water temperature as pos- tem described earlier. After gas extraction from the liquid sible by continuously flowing surface seawater in the incuba- samples, Tenax liners and their DMS content were wrapped tor. The temperatures of the incubation water for Ice1-MP1, individually in aluminum foil, placed in a Pyrex™ glass tube Ice3-MP1, and Ice4-MP1 were 1.29 ± 1.75, −0.28 ± 0.26, sealed with a Teflon lid, and returned to the −80 ◦ C freezer and −0.73 ± 0.09 ◦ C, respectively. These mean values were for several weeks until analysis on a land-based GC-MS. within 1 ◦ C of the in situ melt pond water temperatures (Ta- Quantification of D6-DMS and 13 C-DMS was conducted ble 2). via GC-MS analysis (6978 GC coupled to a 7000B Triple- DMSPt , DMSPd , and DMS concentrations were mea- Quad MS from Agilent). Mass spectra were collected both sured in duplicate every 6 h during the incubation period in full scan (m/z 45–100) and in selected ion monitoring as described above. DMS production from DMSP cleav- (m/z 62, 63, and 68) modes. Final concentrations were cal- age and DMSO reduction were determined through gas culated from standard curves using known concentrations of chromatograph–mass spectrometry (GC-MS) analysis as an both unlabelled DMS and labelled DMS carrying the D6- increase of D6-DMS and 13 C-DMS, respectively, in the L- DMS and 13 C-DMS signatures. The comparison between DMSP/O and D-DMSP/O treatments. Discrimination by the fresh DMS samples measured directly on board during the microorganisms toward lighter (natural) isotopes of DMSP NETCARE/ArcticNet campaign and cryo-preserved DMS and DMSO is expected to be minimal (< 10 %) according to samples shows excellent agreement between the two meth- Elizabeth Colleen Asher (unpublished data). The observed ods (r 2 = 0.96, Fig. 2). rates of change in the concentration of DMS stable isotopes are thus assumed to be representative of the potential for 2.6 Satellite data DMS cycling in these melt ponds. This experimental setup allows the measurement of the Distances between each stations and the open ocean were as- following rates over 6 and 24 h: (1) net changes of in situ sessed using scaled NASA’s Earth Observing System Data DMSPd and DMSPp in natural light derived from the differ- and Information System (EOSDIS) imagery. Maps of the ice ence of DMSPd and DMSPp concentrations versus time in cover were accessed for the sampling dates in July 2014 the controls, respectively; (2) net in situ microbial DMS pro- through the MODIS (Terra/Aqua) Corrected Reflectance duction in natural light derived from the regression slope of (True Color) layer combined with MODIS (Terra) Cor- Biogeosciences, 15, 3169–3188, 2018 www.biogeosciences.net/15/3169/2018/
M. Gourdal et al.: Dimethyl sulfide dynamics in first-year sea ice melt ponds 3175
each treatment L-DMSP/O and D-DMSP/O and (2) assess
the potential effect of light on the concentrations and change
rates of the reduced-sulfur compounds under study (DMS,
DMSPd , and DMSPp ) by comparing paired dependent sam-
ples (repeated measures) from L-DMSP/O and D-DMSP/O.
3 Results
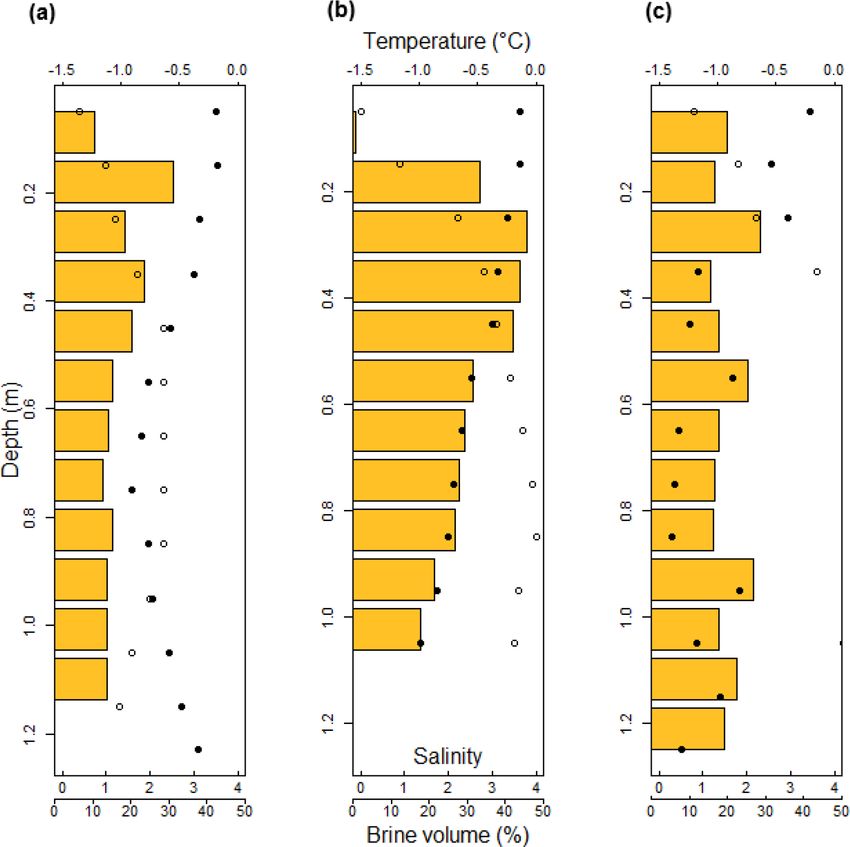
3.1 Ponded sea ice and snow properties
The physical characteristics of the sea ice surrounding the
melt ponds are presented in Table 1 and in Fig. 3. All the
sampling sites were characterized by FYI, which was the pre-
dominant ice type throughout the region under study. Aver-
aged sea ice thickness around the melt ponds were relatively
Figure 2. Relationship between the concentrations of fresh DMS
uniform, varying between 1.13 ± 0.07 and 1.27 ± 0.01 m at
samples measured on board the ship via gas chromatography during
the campaign and the concentrations of the corresponding preserved
the different sites. Average freeboard values were relatively
duplicate samples measured via coupled gas chromatography and more variable. Station Ice1 was characterized by low ice free-
mass spectrometry in a laboratory setting. The concentrations of the boards −0.01 ± 0.01 m. Station Ice3 had the highest posi-
preserved DMS samples plotted are the sum of the three isotopes of tive freeboards with 0.10 ± 0.02 m. Station Ice4 freeboards
DMS investigated in this study (m/z of 62, 63, and 68; see Materials were also positive and showed the greatest variability, with
and Methods). 0.07 ± 0.04 m.
Brine volume fraction was calculated using sea ice salin-
ity and temperature values and used as a proxy of sea ice
rected Reflectance (bands 3, 6, 7). These open-source data permeability (Fig. 3). Averaged values for bulk sea ice salin-
are accessible through the Global Imagery Browse Ser- ity over the full thickness of the ice were 1.73, 2.83, and 3.75
vices (GIBS) (https://worldview.earthdata.nasa.gov, last ac- at stations Ice1, Ice3, and Ice4, respectively. Maximum bulk
cess: August 2017). The imagery had a resolution of 250 m salinity never exceeded 5.00 (Ice4, 1.2–1.3 m section). In
on a daily scale. situ temperatures, averaged over the full thickness of the ice,
were −0.54, −0.52, and −0.98 ◦ C at stations Ice1, Ice3, and
2.7 Statistical analysis Ice4, respectively, and reached a minimum value of −1.39 ◦ C
(Ice4, 0.8–0.9 m section). Brine volume fraction constantly
Normality of the data was assessed using the Shapiro–Wilk exceeded 10 % in the ice profiles except in the upper 0.1 m
test with a 0.05 significance level (R statistical software, R section of the Ice3 station, where we likely observed the ef-
Core Team, 2016), which revealed that most variables were fects of refreezing metamorphosis of snow and/or sea ice re-
non-normally distributed (n = 9, df = 8, α = 0.05). Non- crystallization. Snow meltwater percolation and refreezing
parametric Spearman’s rank correlation test (rs ) with a 0.05 can form such superimposed ice layers as observed at sta-
significance level was used to assess correlation between key tion Ice3. The resulting impermeable layer at the top of the
variables since normality could not be achieved uniformly ice contributed to the high freeboard (0.1 m) measured at this
through standard normalization methods. Model I linear re- station, representing 6 % of the total ice thickness. Visual es-
gressions (r 2 ) were used to determine biological rates during timates of the pond fraction ranged from 30 to 60 % (see
the incubation experiments (Sokal and Rohlf, 1995). Fig. 1c) and the remaining surface of sea ice was bare ice
A non-parametric Mann–Whitney U test was used to de- at stations Ice1, Ice2, and Ice4.
termine whether the distributions of reduced-sulfur com-
pounds (i.e. DMS, DMSPp , and DMSPd ) in the Ice1-MP1 3.2 Physical, chemical, and biological characteristics of
and Ice4-MP1 incubations experiments were statistically dif- the melt pond water
ferent from one another. The difference in reduced-sulfur
compound concentrations between the two incubation exper- The physical and chemical characteristics of the melt ponds
iments was not found to be statistically significant (n = 45, are presented in Table 2. All melt ponds were closed melt
df = 16, α = 0.05). ponds, i.e. not directly connected with the water column (Lee
Based on the results of the Mann–Whitney U test, a se- et al., 2012). The mean depth of the individual melt ponds
ries of Wilcoxon signed-rank tests with a significance level ranged from 0.07 to 0.29 m, with length and width varying
α = 0.05 were conducted on the combined data sets of sta- between 1.00 and 25.00 m (Fig. 1). Melt pond water tem-
tions Ice1-MP1 and Ice4-MP1 in order to (1) assess the peratures and salinities varied between 0.21 and 1.86 ◦ C and
presence of statistical differences between the controls and between 0.2 and 8.5, respectively. Chl a concentrations were
www.biogeosciences.net/15/3169/2018/ Biogeosciences, 15, 3169–3188, 20183176 M. Gourdal et al.: Dimethyl sulfide dynamics in first-year sea ice melt ponds
Figure 3. In situ temperature (•) and bulk ice salinity (◦) profiles of the sea ice surrounding the melt ponds sampled at stations Ice1 (a),
Ice3 (b), and Ice4 (c). Temperature and salinity values of each 0.1 m sea ice section were used to calculate brine volumes (orange bars), an
indicator of sea ice permeability, throughout the full depth of sea ice (Cox and Weeks, 1983; Petrich and Eicken, 2010).
variable, ranging from 0.03 to 0.48 µg L−1 with a mean of 3.3 Dynamics and cycling of reduced-sulfur
0.20 µg L−1 (Table 3). The composition of the algal assem- compounds in Arctic melt ponds
blage present in the melt ponds will be described in detail in a
companion paper (Charette et al., 2018) but is summarized in
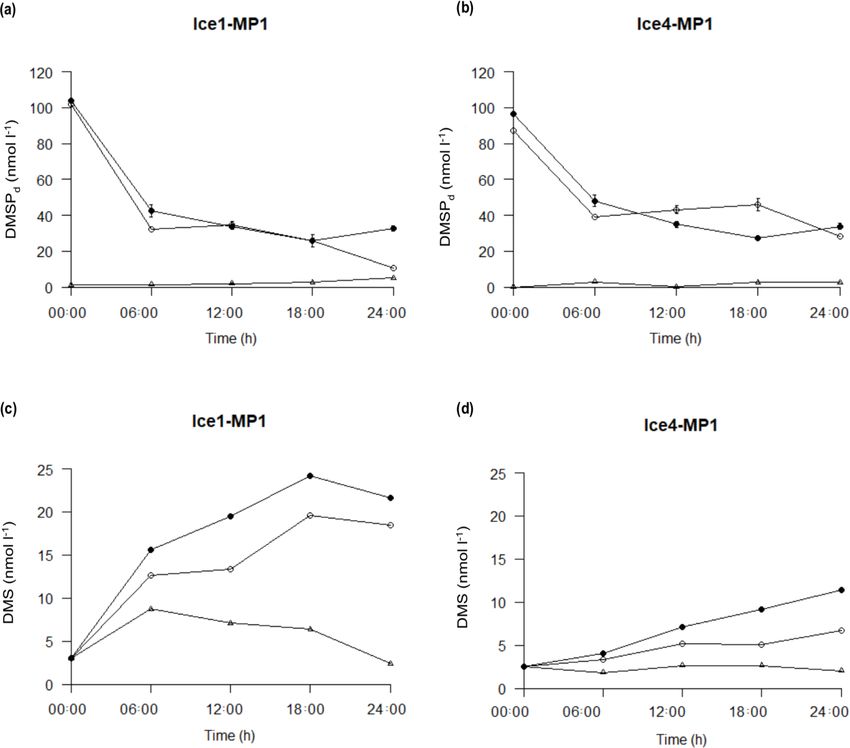
Results from the Ice1-MP1 and Ice4-MP1 incubation ex-
Table 3. The algal assemblages were dominated by uniden-
periments are presented in Fig. 4 (panels a and c, and pan-
tified flagellates, ice-associated pennate diatoms, and chrys-
els b and d, respectively). Results from the Ice3-MP1 exper-
ophytes. Empty diatom frustules were abundant in all melt
iments are not presented since DMSPd and DMS concentra-
ponds. Abundance of heterotrophic bacteria with HNA con-
tions showed no variation during the 24 h incubation period
tent varied between 0.02 and 0.24 × 10⁹ cells L−1 (Table 3).
in the controls and in the amended treatments. This will be
In situ DMSPp and DMSPd concentrations ranged from
discussed in Sect. 4.2.2.
1.8 to 4.0 nmol L−1 and from below d.l. (< 0.01 nmol L−1 )
During the Ice1-MP1 incubation, initial DMSPd con-
to 1.4 nmol L−1 , respectively. Melt pond DMS concentra-
centration was 1.30 nmol L−1 in the control and slightly
tions ranged from below d.l. to 6.1 nmol L−1 (Table 3).
increased to reach 5.3 nmol L−1 during the 24 h incuba-
Spearman’s rank correlation coefficients between key in situ
tion period (Fig. 4a). In the light (L-DMSP/O) and dark
variables measured in the melt ponds are presented in Ta-
(D-DMSP/O) amended treatments, DMSPd concentrations
ble 4. DMS concentrations significantly co-varied with salin-
started at 102 nmol L−1 , decreased to ∼ 35 nmol L−1 at
ity (rs = 0.84, p < 0.05) and Chl a (rs = 0.84, p < 0.05).
T6 , and remained stable (dark treatments) or decreased to
None of the other variables measured displayed significant
10 nmol L−1 (light treatments) until T24 (Fig. 4a). Con-
relationships between each other (not shown).
centrations of DMS in the control of Ice1-MP1 started at
3.0 nmol L−1 , increased to 8.8 nmol L−1 between T0 and T6 ,
and then decreased regularly to 4.2 nmol L−1 at T24 (Fig. 4c).
The addition of labelled DMSP and DMSO stimulated DMS
production. In the L-DMSP/O treatment, DMS concentra-
tions increased to 12.6 nmol L−1 at T6 , remained at this level
Biogeosciences, 15, 3169–3188, 2018 www.biogeosciences.net/15/3169/2018/M. Gourdal et al.: Dimethyl sulfide dynamics in first-year sea ice melt ponds 3177 Figure 4. Temporal variations in DMSPd (a, b) and DMS (c, d) concentrations during the Ice1-MP1 and Ice4-MP1 incubation experiments. Both light (◦) and dark (•) treatments were initially amended with 100 nmol L−1 of both D6-DMSP and 13 C-DMSO. Control treatments (4) mimic natural concentration changes over time. In panels (a, b), vertical bars represent standard errors of mean values between duplicate samples. between T6 and T12 , increased again between T12 and T18 , ment, and a maximal value of 11.5 nmol L−1 was reached at and remained stable at ∼ 19 nmol L−1 between T18 and T24 T24 . (Fig. 4c). DMS concentrations were consistently higher in In situ and potential change rates of the sulfur compounds the D-DMSP/O treatment than in L-DMSP/O (Fig. 4c). They during the incubation experiments are presented in Tables 5 first reached 15.6 nmol L−1 at T6 , increased gradually to and 6, respectively. Changes in DMSPd , and to a lesser ex- reach a peak value of 24.2 nmol L−1 at T18 , and decreased tent DMS concentrations, were generally not linear over the slightly to 21.6 nmol L−1 at T24 . Note that dissolved DMSO 24 h incubation period, with more pronounced variations dur- was not measured during this study due to methodological ing the first 6 h. To take into account this non-linearity, both issues. hourly rates measured between T0 and T6 and between T6 and In the Ice4-MP1 incubation, DMSPd concentrations T24 , as well as daily rates (T0 –T24 ), are presented in these ta- started at 3.0 nmol L−1 in the control and remained close to bles. this value during the whole experiment (Fig. 4b). In the L- In Ice1-MP1, the concentrations of DMSPp in the con- DMSP/O and D-DMSP/O amended treatments, DMSPd con- trol decreased at a rate of 2.2 nmol L−1 d−1 (Table 5). We centrations started at 87 and 96 nmol L−1 , respectively. As measured no change in DMSPd during the first 6 h, but a observed in the previous melt pond, the concentrations de- positive net increase of 4.0 nmol L−1 over the full 24 h in- creased to ∼ 45 nmol L−1 at T6 and then slowly decreased to cubation period was observed. In situ DMS changes in- a value of ∼ 30 nmol L−1 at T24 (Fig. 4b). DMS concentra- creased by 1.0 nmol L−1 h−1 during the first 6 h and by tions in the control of Ice1-MP1 started at 2.6 nmol L−1 and 1.2 nmol L−1 d−1 over 24 h. Potential net DMSPd change remained at this level during the 24 h experiment (Fig. 4d). rates of −11.6 and −10.2 nmol L−1 h−1 were measured dur- In the L-DMSP/O treatment, DMS concentrations increased ing the first 6 h of incubation in L- and D-DMSP/O treat- more or less linearly from 2.6 nmol L−1 at T0 to 6.7 nmol L−1 ments, respectively (Table 6). These rates became −1.2 at T24 . In the D-DMSP/O treatment, the increase in DMS and −0.6 nmol L−1 h−1 between T6 and T24 in L- and D- concentrations was more pronounced than in the light treat- DMSP/O, respectively. Over 24 h, negative potential net www.biogeosciences.net/15/3169/2018/ Biogeosciences, 15, 3169–3188, 2018
3178                                                          M. Gourdal et al.: Dimethyl sulfide dynamics in first-year sea ice melt ponds

Table 3. Reduced-sulfur compound concentrations measured in situ in the melt ponds and the associated biological characteristics (abundance
of high nucleic acid (HNA) bacteria, Chl a concentrations, and relative abundances of major taxonomic groups) of the melt pond water.

  Station     Melt          In situ              In situ       In situ       Abundance of       Total abundance         Chl a    Dominant algal
              pond         DMSPp                DMSPd           DMS         bacteria (HNA)              of algae     (µg L−1 )   group (%)
                        (nmol L−1 )          (nmol L−1 )   (nmol L−1 )    (× 109 cells L−1 )   (× 106 cells L−1 )
  Ice1        MP1                  2.2               1.3            3.0                0.24                 2.00         0.48    Unidentified flagellates (50 %)
                                                                                                                                 Prasinophytes (ca. 25 %)
              MP2                  2.0               1.4            3.1                                                  0.40    Unidentified flagellates (55 %)
                                                                                                                                 Prasinophytes (ca. 25 %)
  Ice2        MP1                  1.8              d.l.            0.0                0.04                 0.50         0.03    Unidentified flagellates (90 %)
                                                                                                                                 Pennate diatoms (ca. 28 %)
              MP2                  2.4              d.l.            0.0                                                  0.09    Unidentified flagellates (50 %)
                                                                                                                                 Pennate diatoms (ca. 28 %)
              MP3                  2.3              d.l.            0.0                                                  0.06    Unidentified flagellates (70 %)
                                                                                                                                 Pennate diatoms (ca. 28 %)
  Ice3        MP1                  2.0              d.l.            0.0                0.02                 0.30         0.05    Unidentified flagellates (45 %)
                                                                                                                                 Chrysophytes (29 %)
              MP2                  2.3              d.l.            0.0                                                  0.04    Unidentified flagellates (55 %)
                                                                                                                                 Chrysophytes (23 %)
  Ice4        MP1                  4.0              d.l.            2.6                0.15                 1.00         0.18    Unidentified flagellates (50 %)
                                                                                                                                 Pennate diatoms (20 %)
              MP2                  3.7               1.1            6.1                                                  0.20    Unidentified flagellates (60 %)
                                                                                                                                 Pennate diatoms (25 %)

Table 4. Spearman’s rank correlation coefficients between key in                        ments. Potential net DMS change rates remained low in
situ variables measured in the melt ponds.                                              both L-DMSP/O and D-DMSP/O treatments during the first
                                                                                        6 h of incubation with values at 0.1 and 0.3 nmol L−1 h−1 ,
                          DMS         Salinity       Temperature      Chl a             respectively. For the complete 24 h incubation, potential
     DMS                                    0.84∗            0.51     0.84∗             net DMS change rates in light and dark reached 4.2 and
     Salinity                                                0.40      0.56             8.9 nmol L−1 d−1 , respectively.
     Temperature                                                       0.60                During both Ice1-MP1 and Ice4-MP1 incubation exper-
                                                                                        iments, the light versus dark treatment had no effect on
   ∗ indicates a 0.05 significance level.
                                                                                        the net changes in DMSPd concentrations between the L-
                                                                                        DMSP/O and D-DMSP/O treatments (Wilcoxon signed-
                                                                                        rank test; n = 8, df = 3, α = 0.05), but significantly impacted
DMSPd change rates of ∼ −91 nmol L−1 and −71 nmol L−1                                   the rates of net accumulation of DMS (Wilcoxon signed-
for the L-DMSP/O and D-DMSP/O treatments were cal-                                      rank test; n = 12, df = 5, α = 0.05). The accumulation of
culated. Positive potential net DMS change rates of 1.6                                 DMS over 24 h in the L-DMSP/O treatments were con-
and 2.1 nmol L−1 h−1 were measured during the first 6 h                                 sistently and significantly lower than in the corresponding
of incubation in L-DMSP/O and D-DMSP/O, respectively.                                   D-DMSP/O treatments (Wilcoxon signed-rank test; n = 8,
For the complete 24 h incubation, potential net DMS                                     df = 3, α = 0.05). Based on the difference between the L-
change rates reached 15.4 nmol L−1 d−1 in the light and                                 and D-DMSP/O treatments after 24 h, we estimated the light-
18.6 nmol L−1 d−1 in the dark.                                                          associated DMS sinks at 3.2 nmol L−1 d−1 in Ice1-MP1 and
   In Ice4-MP1, in situ DMSPp decreased at a rate of                                    at 4.7 nmol L−1 d−1 in Ice4-MP1 (Table 6).
1.9 nmol L−1 d−1 over the course of the incubation (Ta-
ble 5). Meanwhile, in situ DMSPd changes rates were be-                                 3.4    Isotopic discrimination of DMS sources
low the d.l. during the first 6 h and almost null over 24 h
(Table 5). In situ DMS change rates were close to zero af-                              Table 7 shows the concentrations of DMS isotopes (m/z 62)
ter 6 h and below d.l. after 24 h. Potential net DMSPd change                           and (m/z 68) after 24 h incubation in the three treatments and
rates of −8.1 nmol L−1 h−1 were measured during the first                               their relative contribution (%) to the total DMS measured at
6 h of incubation in both L- and D-DMSP/O (Table 6).                                    T24 . As expected, 100 % of the total DMS in the controls of
These rates slowed down to −0.5 and −0.9 nmol L−1 h−1 be-                               the two experiments (3.0 and 2.3 nmol L−1 ) showed the iso-
tween T6 and T24 , respectively. Over one day, average poten-                           topic signature of natural DMS (m/z 62). In the L-DMSP/O
tial net DMSPd change rates of ∼ −59 and −62 nmol L−1                                   treatment of the Ice1-MP1 incubation, 78 % (14.4 nmol L−1 )
were calculated for the L-DMSP/O and D-DMSP/O treat-                                    of the DMS measured at T24 derived from D6-DMSP addi-

Biogeosciences, 15, 3169–3188, 2018                                                                                 www.biogeosciences.net/15/3169/2018/
M. Gourdal et al.: Dimethyl sulfide dynamics in first-year sea ice melt ponds 3179
Table 5. In situ DMSPp , DMSPd , and DMS change rates measured during the incubation experiments conducted in melt ponds Ice1-MP1
and Ice4-MP1. Hourly rates for DMSPd and DMS net changes measured between T0 and T6 are derived from the slope of DMSPd and
DMS concentrations vs. time, respectively. Daily DMSPd change rates are calculated as the difference between the DMSPd concentrations
measured at T24 and T0 . Daily DMS change rates are calculated as the difference between the DMS concentrations measured at T24 and T0 .
Rates measured over the first 6 h are expressed in nmol L−1 h−1 . Other rates are expressed in nmol L−1 d−1 .
Station In situ DMSPp In situ DMSPd In situ DMS
change rates change rates change rates
(nmol L−1 d−1 ) (nmol L−1 h−1 ) (6 h) (nmol L−1 d−1 ) (nmol L−1 h−1 ) (6 h) (nmol L−1 d−1 )
Ice1 – MP1 −2.2 0.0 4.0 1.0 1.2
Ice 4 – MP1 −1.9 0.0 −0.1 −0.1 0.0
Table 6. Potential net DMSPd change rates, potential net DMS change rates and light-associated DMS sinks measured during the incubation
experiments conducted in melt ponds Ice1-MP1 and Ice4-MP1. Regular and bold font types regroup the rates measured under natural light
(L-DMSP/O) and in the dark (D-DMSP/O), respectively. Hourly rates for potential DMSPd and DMS net changes between T0 and T6 as
well as T6 and T24 are derived from the slope of DMSPd and DMS concentrations vs. time, respectively. Daily potential net DMSPd change
rates are calculated as the difference between the DMSPd concentrations measured at T24 and T0 . Daily potential net DMS change rates are
calculated as the difference between the DMS concentrations measured at T24 and T0 . Rates of light-associated DMS sink were measured
as the difference of DMS accumulation between L-DMSP/O and D-DMSP/O after the 24 h incubation. Rates measured over the first 6 h and
between T6 and T24 are expressed in nmol L−1 h−1 . Other rates are expressed in nmol L−1 d−1 .
Station Potential net DMSPd change rates Potential net DMS change rates Light-associated DMS sinks
(nmol L−1 h−1 ) (nmol L−1 h−1 ) (nmol L−1 d−1 ) (nmol L−1 h−1 ) (nmol L−1 d−1 ) (nmol L−1 d−1 )
(T0 –T6 ) (T6 –T24 ) (T0 –T6 )
Ice1 – MP1 −11.6 −1.2 −91.5 1.6 15.4 3.2
−10.2 −0.6 −71.3 2.1 18.6 −
Ice4-MP1 −8.1 −0.5 −59.2 0.1 4.2 4.7
−8.1 −0.9 −62.6 0.3 8.9 −
tions (m/z 68), with the remaining 22 % (4.1 nmol L−1 ) be- 4 Discussion
ing natural DMS (Table 5). Similarly, 73 % (18.2 nmol L−1 )
of the DMS measured at T24 derived from D6-DMSP addi- Research on DMS dynamics in melt ponds is in its infancy.
tions in the D-DMSP/O treatment, with the remaining 27 % Before this study, only four publications reported DMS mea-
(6.6 nmol L−1 ) carrying the signature of natural DMS. surements in melt ponds, two in the Arctic (Leck and Pers-
In Ice4-MP1, 80 % (5.1 nmol L−1 ) of the DMS measured son, 1996; Sharma et al., 1999) and the two others in the
at T24 in the L-DMSP/O treatment derived from the added Antarctic (Asher et al., 2011; Nomura et al., 2012). In the
D6-DMSP, with the remaining 20 % (1.3 nmol L−1 ) carrying Arctic, Leck and Persson (1996) reported negligible levels
the signature of natural DMS. For the D-DMSP/O treatment, of DMS in MYI melt ponds while Sharma et al. (1999) mea-
65 % (7.9 nmol L−1 ) of the DMS at T24 derived from the D6- sured concentrations reaching 2.2 nmol L−1 . In the Antarctic,
DMSP addition with 35 % (4.2 nmol L−1 ) originating from Nomura et al. (2012) reported DMS concentrations inferior
natural DMS. The absence of (m/z 63) DMS, regardless of to 3.7 nmol L−1 while Asher et al. (2011) measured levels
the treatment, indicates that 13 C-DMSO reduction was not up to 250 nmol L−1 . Our results show that DMS concentra-
contributing to the production of DMS during these two ex- tions in Arctic melt ponds may be at least 3 times higher (up
periments (m/z 63 not shown in Table 7). The match between to ∼ 6 nmol L−1 ) than the first Arctic measurements and that
the sum of DMS isotopes (m/z 62 and m/z 68) and the total both physical and biological processes can contribute to the
fresh DMS concentration measured on board (Fig. 2) also accumulation of this climate-active gas in these transient en-
confirms the absence of DMSO-to-DMS reduction during vironments. As discussed hereafter, evidences suggest that
our experiments. different ice cover dynamics and microbial communities are
the two probable leading causes for the reported variability
in DMS concentrations between melt ponds.
www.biogeosciences.net/15/3169/2018/ Biogeosciences, 15, 3169–3188, 20183180 M. Gourdal et al.: Dimethyl sulfide dynamics in first-year sea ice melt ponds
Table 7. (m/z 62) and (m/z 68) DMS concentrations after 24 h incubation in the control, L-DMSP/O, and D-DMSP/O treatments. Relative
contribution (%) of natural DMS and D6-DMSP to the total DMS measured at T24 in the control, L-DMSP/O, and D-DMSP/O treatments
during the incubation experiments with water from Ice1-MP1 and Ice4-MP1. The natural DMS signature is m/z 62; the signature of DMS
derived from D6-DMSP is m/z 68. No (m/z 63), which represents the signature of DMS derived from 13 C-DMSO, was retrieved either after
12 h (not shown) or 24 h.
Incubation Treatment (m/z 62) DMS (m/z 68) DMS (m/z 62) % of (m/z 68) % of
(nmol L−1 ) (nmol L−1 ) total DMS total DMS
Ice1 – MP1 Control 3.0 0.0 100 0
L-DMSP/O 4.1 14.4 22 78
D-DMSP/O 6.6 18.2 27 73
Ice4 – MP1 Control 2.3 0.0 100 0
L-DMSP/O 1.3 5.1 20 80
D-DMSP/O 4.2 7.9 35 65
4.1 Physical controls of DMS concentrations ice salinity was low (under 5) and locally did not exceed 2
in melt ponds (top 0.2 m). It is also known that most of the hyper-saline
brine characterizing consolidated cold FYI in winter are lost
in spring through full depth brine convection well before melt
The strong relationship observed between DMS concentra- ponds start to form (Jardon et al., 2013). Residual salts are fi-
tions and salinity in the melt ponds sampled (rs = 0.84, nally lost through meltwater flushing during the summer sea-
p ≤ 0.05, Table 4) suggests that salinization processes may son (Weeks and Ackley, 1986; Eicken et al., 2002; Vancop-
play a crucial role in the initial seeding of DMS (and prob- penolle et al., 2007). At the time of our sampling, low bulk
ably DMS-producing microbial assemblages) and the result- salinity values, combined with calculated brine volume frac-
ing cycling of DMS within melt ponds. Three main mech- tion constantly exceeding 10 % in the entire sea ice profiles
anisms could be involved in the salinization of closed melt (except in the upper 0.1 m section of the Ice3 station), sug-
ponds: (1) deposition of sea spray from the ice margin or gest that full depth flushing had already occurred. We thus
leads, (2) brine intrusion, and (3) seawater intrusion through exclude sea ice brine enrichment of melt ponds as their main
porous or low freeboard sea ice. For the reasons explained salinization mechanism.
below, seawater intrusion through porous or low freeboard Rather, we suggest that melt ponds salinization originated
sea ice appears to be the most likely mechanism responsible mostly from the intrusion of seawater through the ice. Al-
for the salinization of the melt ponds during our study. though closed melt ponds are not visibly connected to seawa-
Sea spray probably did not contribute significantly to the ter, exchanges with the underlying seawater can take place.
salinization of the melt ponds during our study. The salin- The extent of these exchanges is dependent on the sea ice
ization of melt ponds could occur through sea spray depo- freeboard and micro-structure, i.e. the amount, size, and
sition or seawater overflow during stormy events. Sea spray shape of brine inclusions (Carnat et al., 2013), that control
can transport salts over distances ranging from a few metres sea ice permeability. Above a critical brine volume ranging
for the largest particles to a maximum distance of ∼ 30 km between 5 % (for columnar sea ice) and 10 % (for granular
for finer aerosols, depending on wind speed (McArdle and sea ice), brine inclusions become interconnected. During the
Liss, 1995). This requires favourable wind direction, a rela- melting season, the decrease in sea ice thickness is enhanced
tive proximity of the melt ponds with open water areas, and by the formation of the melt pond and leads to a loss of free-
as demonstrated hereafter regarding the melt ponds studied board. As melt ponds become closely levelled with seawa-
here, unrealistic volumes of sea spray. During our study, the ter, small changes in ice temperature oscillating around the
average volume of the melt ponds was 8 m3 . We conserva- freezing temperature may result in episodic intrusion of sea-
tively estimated that 19 to 367 L of sea spay (assuming an water mixed with meltwater through the porous ice. Seawater
average sea surface salinity of 33) was required to increase mixed with meltwater entering the brine channels of perme-
melt pond salinity from zero to 0.2 or 8.5, as measured during able sea ice may bring salts, nutrients, and microorganisms
our study. Considering both the relatively large volume of sea (Jardon et al., 2013; Vancoppenolle et al., 2010), potentially
spray required and the far-reaching distances (> 15 km, esti- reaching surface melt ponds. This mechanism most proba-
mated from MODIS data) of the sampled melt ponds from bly explains the salinity and biochemical characteristics of
open water at the time of sampling, sea spray was unlikely Ice1 and Ice4 melt ponds. Station Ice3 represents a differ-
the main source of salt in the melt ponds studied. ent case. Here, the low melt pond salinity (and absence of
Ice brine intrusion is also unlikely to have contributed sig- biological activity) may be explained by the presence of an
nificantly to melt pond salinization since the averaged bulk
Biogeosciences, 15, 3169–3188, 2018 www.biogeosciences.net/15/3169/2018/You can also read