The 2019-2021 extreme drought episode in La Plata Basin
←
→
Page content transcription
If your browser does not render page correctly, please read the page content below
The 2019-2021 extreme drought episode
in La Plata Basin
                                                      A Joint Report from EC-JRC,
                                                      CEMADEN, SISSA and WMO

  Naumann, G., Podestá, G., Marengo, J., Luterbacher, J., Bavera, D., Arias Muñoz, C., Barbosa,
  P., Cammalleri, C., Chamorro, L., Cuartas, A., de Jager, A., Escobar, C., Hidalgo, C., Leal de
  Moraes, O., McCormick N., Maetens, W., Magni, D., Masante, D., Mazzeschi, M., Seluchi, M.,
  Skansi, M. M., Spinoni, J., Toreti., A.

                                                                                                     2021

                                                                                                   EUR 30833 EN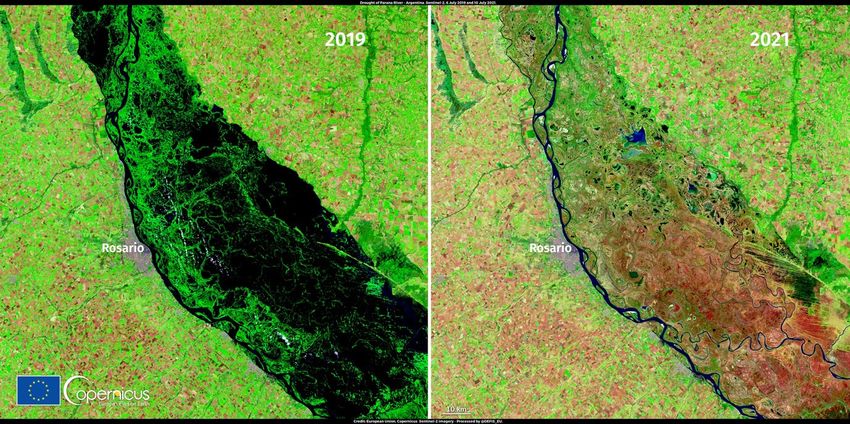
This publication is a report by the Joint Research Centre (JRC), the European Commission’s science and knowledge service.
It aims to provide evidence-based scientific support to the European policymaking process. The scientific output expressed
does not imply a policy position of the European Commission. Neither the European Commission nor any person acting on
behalf of the Commission is responsible for the use that might be made of this publication. For information on the
methodology and quality underlying the data used in this publication for which the source is neither Eurostat nor other
Commission services, users should contact the referenced source. The designations employed and the presentation of
material on the maps do not imply the expression of any opinion whatsoever on the part of the European Union concerning
the legal status of any country, territory, city or area or of its authorities, or concerning the delimitation of its frontiers or
boundaries.

Contact information
Name: Andrea Toreti
Address: Via E. Fermi 2749, I-21027 ISPRA (VA), Italy
Email : Andrea.TORETI@ec.europa.eu

EU Science Hub
https://ec.europa.eu/jrc

JRC126508
EUR 30833 EN

   PDF         ISBN 978-92-76-41898-6            ISSN 1831-9424           doi:10.2760/773

Luxembourg: Publications Office of the European Union, 2021
© European Union 2021

The reuse policy of the European Commission is implemented by the Commission Decision 2011/833/EU of 12 December
2011 on the reuse of Commission documents (OJ L 330, 14.12.2011, p. 39). Except otherwise noted, the reuse of this
document is authorised under the Creative Commons Attribution 4.0 International (CC BY 4.0) licence
(https://creativecommons.org/licenses/by/4.0/). This means that reuse is allowed provided appropriate credit is given and any
changes are indicated. The European Commission shall not be liable for any consequence stemming from the reuse. For any
use or reproduction of photos or other material that is not owned by the EU, permission must be sought directly from the
copyright holders.

All content © European Union 2021, unless otherwise specified. Cover page: Pair of images acquired by one of the
Copernicus Sentinel-2 satellites on 6 July 2019 (left panel) and 10 July 2021 (right panel). The images provide evidence of
the drought affecting the Paraná River in Argentina, near the port of Rosario. Exposed sandbars and dried wetlands are
apparent in the left image. Credit: European Union, Copernicus Sentinel-2 imagery.

How to cite this report: Naumann, G., Podesta, G., Marengo, J., Luterbacher, J., Bavera, D., Arias Muñoz, C., Barbosa, P.,
Cammalleri, C., Chamorro, L., Cuartas, A., de Jager, A., Escobar, C., Hidalgo, C., Leal de Moraes, O., McCormick N., Maetens, W.,
Magni, D., Masante, D., Mazzeschi, M., Seluchi, M., Skansi, M. M., Spinoni, J., Toreti., A. The 2019-2021 extreme drought
episode in La Plata Basin, EUR 30833 EN, Publications Office of the European Union, Luxembourg, 2021, ISBN 978-92-76-
41898-6 (online), doi:10.2760/773 (online), JRC126508.
Contents

Acknowledgements ....................................................................................................................................................................................................2
Abstract ............................................................................................................................................................................................................................3
1 Introduction ............................................................................................................................................................................................................4
2 Evolution and status of the 2019-ongoing drought in the LPB ................................................................................................ 6
       2.1 Total precipitation and cumulative anomalies since September 2016..................................................................... 7
       2.2 Standardised Precipitation Index (SPI) ......................................................................................................................................... 8
       2.3 Evolution of the area under different drought categories based on CHIRPS precipitation estimates..... 9
       2.4 Hydrological variables ........................................................................................................................................................................11
       2.5 Vegetation response ...........................................................................................................................................................................14
3 Causes of the recent drought....................................................................................................................................................................16
       3.1 El Niño-Southern Oscillation phenomenon (ENSO) ............................................................................................................ 16
       3.2 Land use change and deforestation .......................................................................................................................................... 17
4 Historical drought events in the LPB ..................................................................................................................................................... 20
5 Reported impacts of the ongoing drought ......................................................................................................................................... 23
       5.1 Drought emergency declaration ................................................................................................................................................... 23
       5.2 Ecosystems – Wetlands ....................................................................................................................................................................23
       5.3 Fires ..............................................................................................................................................................................................................25
       5.4 Crops, Livestock and Economy ...................................................................................................................................................... 27
       5.5 Waterway Transportation ................................................................................................................................................................28
       5.6 Hydroelectricity generation and other energy impacts ................................................................................................... 31
       5.7 Water supply for human consumption ..................................................................................................................................... 32
       5.8 Human health .........................................................................................................................................................................................33
6 Conclusions ..........................................................................................................................................................................................................34
References ...................................................................................................................................................................................................................35
List of abbreviations and definitions ............................................................................................................................................................ 38
List of figures.............................................................................................................................................................................................................39
List of tables...............................................................................................................................................................................................................41
Annexes .........................................................................................................................................................................................................................42
       Annex 1. Description of drought indicators used in this report .............................................................................................. 42

                                                                                                                   i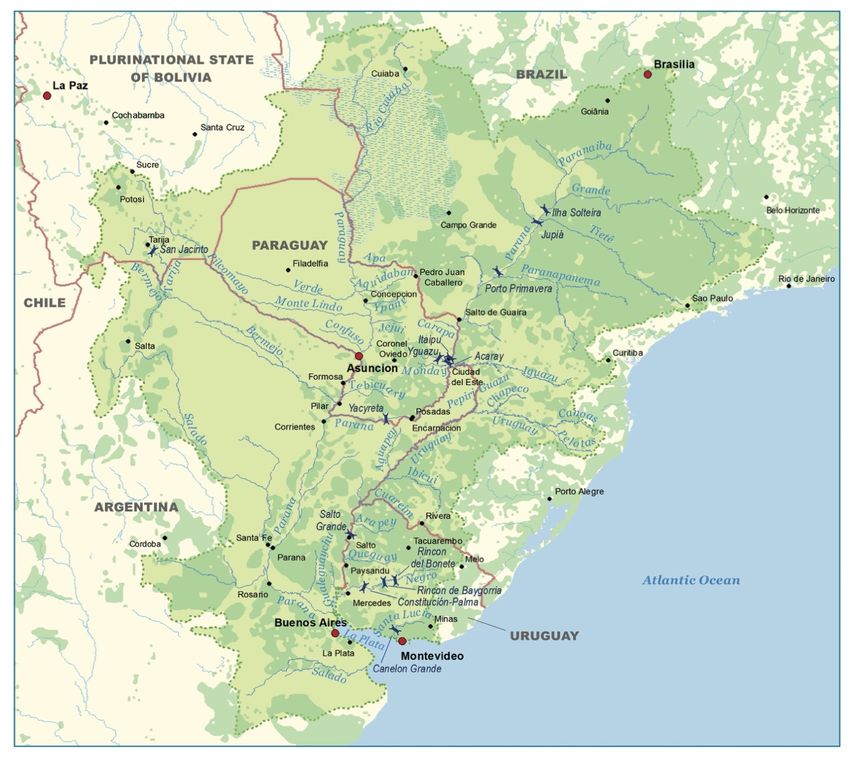
Acknowledgements

Research at “Centro Nacional de Monitoramento e Alertas de Desastres Naturais” (CEMADEN) was
partly funded by the INCT-Climate Change Phase two project (Conselho Nacional de Desenvolvimento
Científico e Tecnologico, Grant/Award Number: 465501/2014-1; Coordenação de Aperfeiçoamento de
Pessoal de Nível Superior, Grant/Award Number: 88887.136402/2017-; Fundação de Amparo à
Pesquisa do Estado de São Paulo, Grant/Award Number: 2014/50848-9; CNPq, Grant/Award Number:
301397/2019-8).

The “Sistema de Información sobre Sequías para el Sur de Sudamérica” (SISSA) is a component of the
Regional Climate Center for southern South America, a six-nation collaboration to produce and
disseminate timely, relevant and actionable climate information and services to support decision-
making in societal sectors sensitive to climate variability and change. Main support for SISSA activities
is provided by the Regional Public Goods program of the Inter-American Development Bank and by
the Euroclima+ program funded by the European Union through the Spanish Agency for International
Development.

Authors

Gustavo Naumann, European Commission, Joint Research Centre, Italy
Guillermo Podestá, SISSA, Argentina
Jose Antonio Marengo, CEMADEN, Brazil
Jürg Luterbacher, Director Science and Innovation Department and Chief Scientist, World
Meteorological Organization, Geneva, Switzerland
Davide Bavera, Arcadia SIT, Vigevano, Italy
Arias Muñoz, Carolina, Arhs Development, Milan, Italy
Paulo Barbosa, European Commission, Joint Research Centre, Italy
Carmelo Cammalleri, European Commission, Joint Research Centre, Italy
Lucas Chamorro, Entidad Binacional Yaciretá, Paraguay - Argentina
Luz Adriana Cuartas, CEMADEN, Brazil
Alfred de Jager, European Commission, Joint Research Centre, Italy
Cristián Escobar, World Meteorological Organization, Regional Office for South America, Paraguay
Cecilia Hidalgo, SISSA, Argentina
Marco Mazzeschi, UniSystems Luxembourg Sàrl, Luxembourg
Osvaldo Luiz Leal de Moraes, CEMADEN, Brazil
Niall McCormick, European Commission, Joint Research Centre, Italy
Willem Maetens, European Commission, Joint Research Centre, Italy
Diego Magni, Arcadia SIT, Vigevano, Italy
Dario Masante, European Commission, Joint Research Centre, Italy
Marcelo Enrique Seluchi, CEMADEN, Brazil
Maria de los Milagros Skansi, National Weather Service, Argentina
Jonathan Spinoni, European Commission, Joint Research Centre, Italy
Andrea Toreti, European Commission, Joint Research Centre, Italy

                                                   2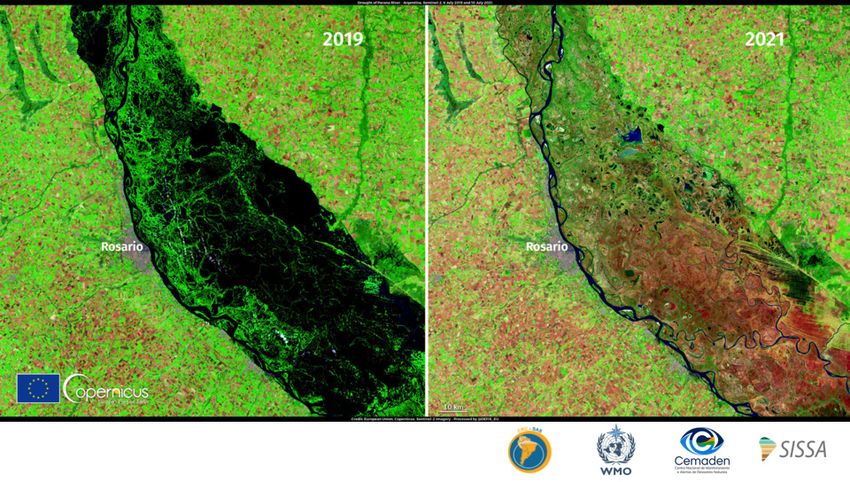
Abstract

A persistent and extreme drought started in 2019 is still ongoing and has been affecting the La Plata
Basin, the second largest river basin in South America and the fifth in the world. Here we provide an
overview of the event, its climatological background, its spatio-temporal evolution, its causes and
characteristics, as well as its impacts on natural and human systems.

The 2019-2021 drought started with below normal precipitation in the upper part of the basin in mid-
2019 and due to its persistence has spread through the hydrological cycle affecting soil moisture,
flows, groundwater and vegetation. Severe, extreme, and exceptional drought conditions began to
appear in the upper basins of the Paraguay and Paraná rivers in south-central Brazil. By the end of
2019 drought conditions were already affecting the Brazilian states of Mato Grosso, Goias, Sao Paulo
and Paraná, and in Paraguay and central Argentina. This situation continued during 2020 and became
most spatially extended by the end of 2020, when northern Argentina and the Pampas of central-
eastern Argentina suffered widespread drought as well.

The ongoing 2019-2021 La Plata Basin dry event can be already ranked among the top five events
in South-Eastern South America since the 1950s. Most of the parameters included in the present
classification (severity, intensity, and peak) show that the ongoing drought falls behind the 1968-
1971 event because of its shorter duration.

In most parts of the La Plata Basin, La Niña is often accompanied by drought, leading to particularly
negative impacts in southern Brazil, north-eastern Argentina, Paraguay and Uruguay. Recent
observations and seasonal forecasts suggest that La Niña conditions may be back again in October-
November 2021 and lasting till 2022 spring, thus delaying the return to normal conditions in the La
Plata Basin, including river flows. This is in line with most seasonal precipitation forecasts from global
model ensembles, which indicate a precipitation deficit scenario in the middle and lower part of the
La Plata Basin.

According to the impacts reported and attributed to this event, many sectors including agriculture,
inland water navigation, energy production, water supply and several ecosystems have been suffering
from the ongoing drought. However, total damage estimates and characterisation of all affected
sectors can be performed only once the event will be over.

                                                    3
1    Introduction
The La Plata Basin (hereafter, LPB) encompasses southern Brazil, south-eastern Bolivia, Paraguay,
most of Uruguay, and north-eastern Argentina. With an area of 3.1 million km², the LPB is the second
largest river basin in South America and the fifth in the world, covering about 17% of the land surface
of the South American continent. The region relies mostly on rainfall to sustain a large agricultural
production, hydropower, transportation of goods along its rivers, and to satisfy household, industrial
and environmental water needs. The LPB includes three major river systems: the Paraná, the Paraguay
and the Uruguay rivers all of them converging into the Río de La Plata estuary that drains into the
Atlantic. Each of these water basins has unique socio-economic characteristics that reflect its source
water and the associated flow pattern variability (Figure 1). The Paraguay-Paraná river system, for
instance, is a 3,500 km long, free flowing fluvial corridor that, due to the absence of dams and other
major interventions, still preserves its hydrological and ecological functions (Baigún and Minotti,
2021).

Figure 1. Map of the La Plata Basin including the main hydroelectric dams. Dark green areas represent zones of irrigation
development. Source: FAO, (2016).

                                                           4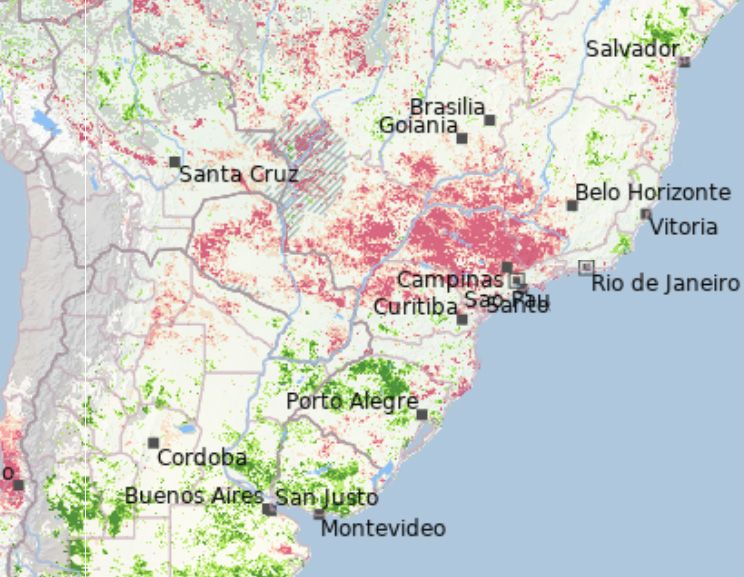
The total population living in the LPB is about 100 million people, nearly half of the population of the
basin-countries. Within the LPB, about 70% of the aggregate GDP of the basin-countries is produced
(Barros et al., 2006). Currently the rivers of the LPB are exposed to factors that modify the quantity
and the quality of their waters. These pressures are exacerbated by the extraordinary variability in
the hydrological regime linked in part to climate variability and climate change, with recurrent
droughts and/or floods. Additional important drivers are associated with changes in: land use,
population growth, urbanisation, agricultural, industrial, and infrastructure development.
Understanding the impacts of current and recent past climatic and environmental conditions, and
assessing future scenarios (including, e.g., an increased frequency and intensity of drought events)
is crucial to support governmental policies and decisions, as well as to foster progress towards low-
carbon economies, high resilience and more equitable societies in this region (Coelho et al., 2016).

Since 2019, the LPB region has suffered from a long, exceptional and devastating event that has
started as a meteorological drought 1 (precipitation deficits), but because of its persistence has spread
through the hydrological cycle affecting the entire hydrology (soil moisture, rivers, superficial and
groundwater storage) and ecosystems of the region. It is considered as “the most severe since 1944”
(INA, 2021), and caused severe impacts on the regional societies, ecosystems and economy. Here,
we provide an overview of the drought development and the associated impacts on ecosystems and
key socio-economic sectors. The main features and the climate drivers are described in the following
sections, together with an overview of the main drought-sensitive sectors.

1
    Droughts are a recurring feature of all climates and are generally defined with respect to the long-term average climate of a given region.
       The Intergovernmental Panel on Climate Change (IPCC) defines drought as “a period of abnormally dry weather long enough to cause
       a serious hydrological imbalance” (IPCC, 2021). It results from a shortfall of precipitation over a certain period, from the inadequate
       timing or the ineffectiveness of the precipitation, and/or from a negative water balance due to an increased atmospheric water
       demand following high temperatures or strong winds (UNDRR, 2021).

                                                                       5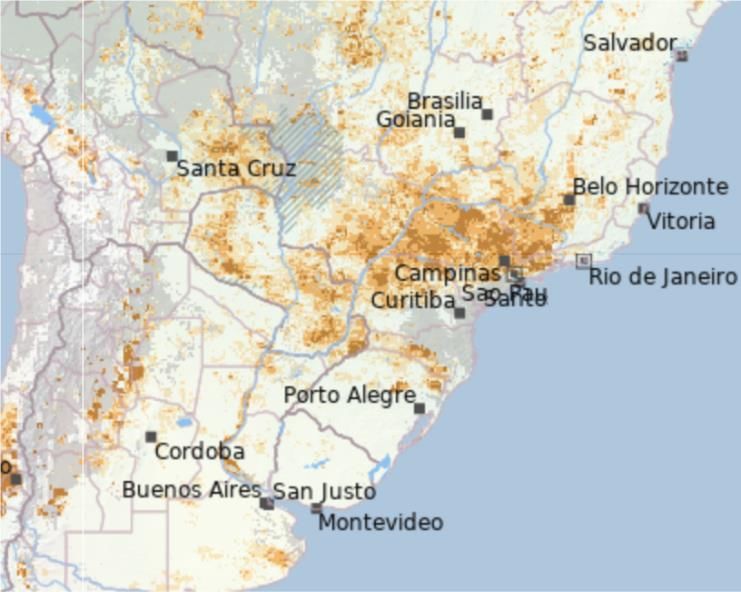
2 Evolution and status of the 2019-ongoing drought in the LPB
Several reports (GDO 2, CEMADEN 3, INA 4 and WMO 5,6) have analysed the early stages of this drought
that began approximately in mid-2019 in the north of the LPB and has recently spread spatially,
affecting almost the entire basin. Recent observations 7 and monitoring by CEMADEN, hydrological
agencies and meteorological services in the region have confirmed a worsening of precipitation and
streamflow deficit.
Different drought stages require different indicators for their characterization (see box 1).
Precipitation anomalies and the standardized precipitation index are often used for meteorological
drought analysis. Soil moisture indicators such as the soil moisture-based drought severity index
characterize drought impacts in terms of plant water stress (Vogt et al., 2018). Hydrological indicators,
such as flow percentiles and deficits are used to quantify the volume of water deficit in rivers and
reservoirs or to monitor whether a required ecological flow or a minimum flow regime is maintained.
Remote-sensing-based indicators such as the fraction of absorbed photosynthetically active radiation
are used to monitor drought stress on the vegetation canopy (UNDRR, 2021).
Box 1. Drought types
Depending on the effect in the hydrological cycle and the impacts on society and environment,
different drought types are commonly distinguished:
Meteorological drought is a period of months to years with a deficit in precipitation or
climatological water balance (i.e. precipitation minus potential evapotranspiration) over a
given region. The deficit is defined with respect to the long-term climatology. A
meteorological drought is often accompanied by above-normal temperatures and
precedes and causes other types of droughts. Meteorological drought is caused by
persistent anomalies in large-scale atmospheric circulation patterns, which are often
triggered by anomalous tropical sea surface temperatures or other remote conditions.
Local feedbacks such as reduced evaporation and humidity associated with dry soils and
high temperatures often enhance the atmospheric anomalies.
Agricultural and ecological drought is a period with abnormal soil moisture deficit, which
results from combined shortage of precipitation and excess evapotranspiration, and
during the growing season impinges on crop production or ecosystem function in general.
Hydrological drought occurs when river stream flow and water storages in aquifers, lakes,
or reservoirs fall below long-term mean levels. Hydrological drought develops more
slowly because it involves stored water that is depleted but not replenished. Time-series
of these variables are used to analyse the occurrence, duration and severity of
hydrological droughts.
Source: adapted from Vogt et al. (2018); IPCC (2021)
2 GDO, 2021. GDO Analytical report. Drought in centre-south Brazil – June 2021. JRC Global Drought Observatory (GDO) of the Copernicus
Emergency Management Service (CEMS). Available at: https://edo.jrc.ec.europa.eu/gdo/php/index.php?id=2050
3 CEMADEN, 2021. Monitoramento De Secas E Impactos No Brasil – Julho/2021. Available at: https://www.gov.br/mcti/pt-br/rede-
mcti/cemaden/conteudo/monitoramento/monitoramento-de-seca-para-o-brasil/monitoramento-de-secas-e-impactos-no-brasil-
2013-julho-2021
4 INA, 2021. Posibles escenarios hidrológicos en la cuenca del plata Durante el período septiembre-octubre-noviembre 2021. Available at:
https://www.ina.gob.ar/alerta/index.php?seccion=6
5 WMO, 2021a: State of the Global Climate 2020, WMO-No. 1264
6 WMO, 2021b: State of the Climate in Latin America and the Caribbean 2020, WMO-No. 1272
7 https://www.ina.gob.ar/archivos/alerta/Tabprono_2021sep29.pdf
6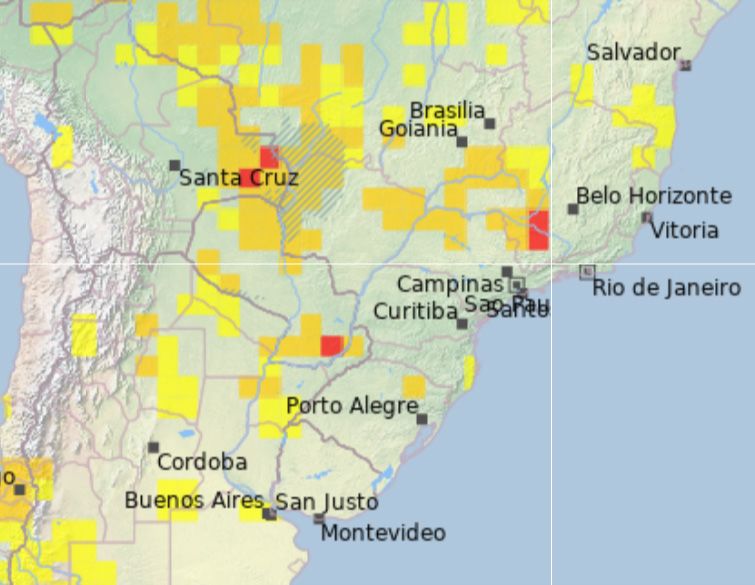
Here, we describe the evolution of the different meteorological, hydrological, and vegetation-related
drought indicators. A detailed description of the drought indicators used in this section can be found
in Annex 1.

2.1     Total precipitation and cumulative anomalies since September 2016

Figure 2 shows the temporal evolution of monthly precipitation and cumulative precipitation
anomalies for the last 5 years (September 2016 – September 2021). The time series are shown for
two locations: (a) one near Santa Fe do Sul in the state of São Paulo to describe conditions at the
Cantareira water supply system providing water to the megacity of Sao Paulo (left panels) and (b) the
Pantanal in the state of Mato Grosso, one of the largest wetlands in the world (right panels).

It is evident that during the last 5 years, precipitation has always been below the 1981-2010 average
at both locations, therefore it has not contributed significantly to alleviating the antecedent drought
conditions. The latest 12 months, nevertheless, stand out with very low values. Over the last 5-year
period a strong precipitation deficit of more than 25% has been accumulated (with respect to 1981-
2010). In the last the two years, total precipitation has been about 50% the average.

 (a)                                                     (b)

 Figure 2. Time series of monthly total precipitation (blue bars) and cumulative precipitation anomalies (red
 bars) for the last 5 years (September 2016 – September 2021). Series are shown for: (a) a region near Santa
 Fe do Sul (20.3°S, 51°W) in the state of São Paulo to illustrate conditions near the Cantareira water supply
 system; (b) the Pantanal wetland in the states of Mato Grosso and Mato Grosso do Sul (16.7°S, 57.5°W).
 Both panels also show the 1981-2010 monthly average of total precipitation (solid lines) and the estimated
 range of variability given by the standard deviation (dashed lines). The lower panels show the 1981-2010
 monthly average (solid lines) and the estimated range of variability given by the standard deviation (dashed
 lines) of cumulative precipitation anomalies over the last 5-year.

                                                     7
2.2     Standardised Precipitation Index (SPI)

This section focuses on the time series of the Standardised Precipitation Index (SPI, an indicator of
meteorological drought, see Annex for details) for the two locations described in the previous section
(the Cantareira water supply system and the Pantanal wetland). SPI series are shown in Figure 3 and
Figure 4 for three temporal scales: 3, 6 and 12 months.

The analysis of the SPI time series shows that since 1981 SPI-03 has reached very dry or extremely
dry values between 20 and 30 times. Remarkably, however, 2/3 of these events have occurred in the
last 4 years. In the last 6 months, SPI-12 shown negative values, suggesting a strong hydrological
deficit. This information confirms that the current drought represents one of the driest and longest
periods of below-normal rainfall in the upper LPB in the last 40 years.

The SPI time series of the long-term (12 months) accumulation period explains the impact of the lack
of precipitation on the hydrology of the region. The severe SPI-12 deficit covers practically the entire
northern part of the La Plata Basin (not shown). The severity of the long-term precipitation deficit is
extremely strong over most of central and south Brazil, south-eastern Bolivia and north of Paraguay,
north-eastern Argentina, and eastern Uruguay.

 Figure 3. Time-series of SPI (January 1981 – September 2021) for three different temporal scales: 3, 6
 and 12 months (from top to bottom) for a location near Santa Fe do Sul (20.3°S, 51°W) in the state of
 São Paulo to illustrate the conditions of the Cantareira water supply system.

                                                    8
Figure 4. Time-series of SPI (January 1981 – September 2021) for three different temporal scales: 3, 6
and 12 months (from top to bottom) for a location in the Pantanal wetland in the states of Mato Grosso
and Mato Grosso do Sul (16.7°S, 57.5°W).
2.3 Evolution of the area under different drought categories based on CHIRPS
precipitation estimates
To monitor the temporal evolution of recent drought conditions in the Plata Basin we also use maps
of drought categories calculated from CHIRPS (Climate Hazards InfraRed Precipitation with Station
data) precipitation estimates (Funk et al., 2015). CHIRPS fields are derived from both satellite data
and in situ observations; they are produced every pentad (periods of 5 days) and are available since
1981 on approximately a 5 x 5 km grid. The CHIRPS dataset has been validated worldwide, including
some Brazilian regions and it was found to perform better than other precipitation datasets in central
Brazil (Marengo et al., 2021b).
Here, CHIRPS precipitation estimates are aggregated over 6-month periods ending on the dates shown
at the top-right corner of each map in Figure 5. For instance, the map in the upper left labelled “2019-
03-15” includes values over the period between 16 September 2018 and 15 March 2019. A non-
parametric approach (Kooperberg and Stone, 1991) is then used for each cell and end date/year to
estimate the percentiles for each precipitation time series. These percentiles are used to assign each
grid cell and end date/year combination to one of the six drought categories following the U.S. Drought
Monitor system (Svoboda et al., 2002). The drought categories range from “no-dry conditions”
(percentile values > 30) to “exceptional drought” (percentiles ≤ 2).
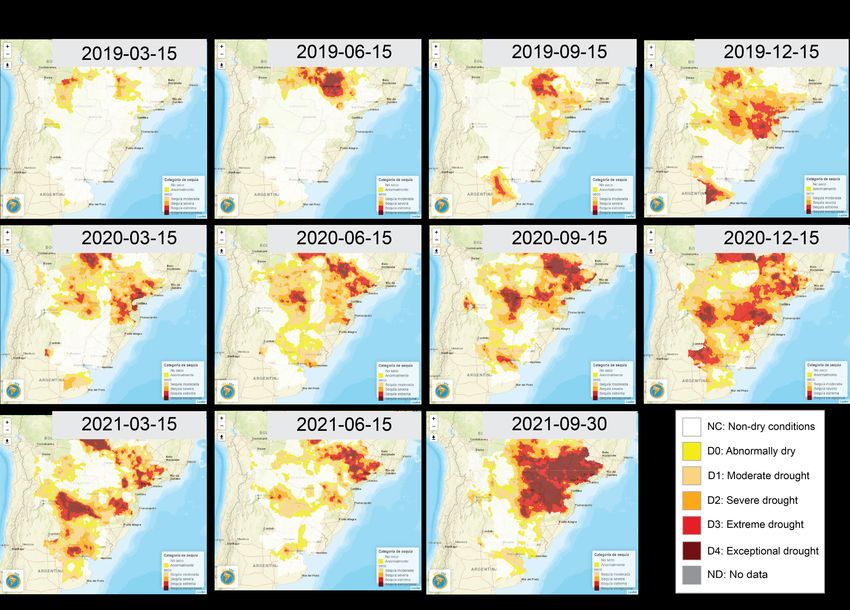
9Figure 5. Drought categories for the Plata Basin derived from SPI-6 CHIRPS precipitation anomalies from
15 March 2019 to 30 September 2021. Source: SISSA
The spatio-temporal evolution of this drought, as given by the estimated percentile-based drought
categories (approximately every three months – except for the bottom right panel that shows the
most recently available data ending on 30 September 2021, i.e. three months after the previous map),
is shown in Figure 5. As for the 6-month period ending in March 2019 (Fig. 5, upper left panel), most
of the LPB was under no drought conditions. Severe, extreme, and exceptional drought conditions
began to appear in the period ending on mid-June 2019 in the upper basins of the Paraguay and
Paraná rivers in south-central Brazil. By the end of 2019 (Fig. 5, upper right panel), drought conditions
were fairly extended in the Brazilian states of Mato Grosso, Goias, Sao Paulo and Paraná, and in
Paraguay and central Argentina. As of autumn 2020, the drought persisted (Barbosa et al., 2021) and
was aggravated by an intense heat wave that affected most of central South America between
September and October (Marengo et al., 2021a). This situation continued and has reached its
maximum extension at the end of 2020, when northern Argentina and the Pampas of central-eastern
Argentina showed widespread drought.
Critical conditions were somewhat alleviated in Paraguay and southern central Brazil by March 2021,
but severe-to-extreme drought continued to affect both the regions north and south of that non-dry
area. This non-dry area expanded through mid-2021, except for southern central Brazil. Finally, by
looking at the 6-month period ending on September 2021 (Fig. 5, bottom right panel), the area
affected by severe-to-exceptional drought has expanded considerably, encompassing southern
central Brazil, Paraguay, most of Uruguay, and northern and central Argentina.
10Figure 6. Percentage of area in the LPB under each of the five drought categories used in Fig. 5, according
to the SPI-6 from March 2019 to September 2021. The areas were derived from CHIRPS precipitation
anomalies. For scale and colours please see Fig. 5. Source: SISSA
The area affected by drought and consequently the population and the assets exposed has more than
doubled since mid-2019. The time series of the proportion of area under each of the five drought
categories (Fig. 5) for the LPB is shown in Figure 6. The figure shows that the La Plata Basin has had
over half of its area under some drought category (from abnormally dry to exceptional drought) from
October 2019 to September 2021. This means that the extended dry conditions have lasted for about
two years. The largest spatial extent of dry conditions was reached during the last quarter of 2020,
when about three quarters of the large La Plata Basin were under drought (Figure 6).
2.4 Hydrological variables
Precipitation in the LPB in both 2019 and 2020 was among the lowest on record. Precipitation
shortage has had significant impacts on the hydrological cycle of the Basin, affecting, e.g., soil
moisture and groundwater storage as well as river flows. As for the latter one, precipitation anomalies
appear to be amplified: that is, the response to decrease in precipitation translates into a more than
proportionally reduced surface and subsurface water flow.
The long-lasting precipitation deficit in the LPB directly translates into soil moisture and total water
storage anomalies. The Global Drought Observatory (GDO) soil moisture indicator estimates the root
zone water content, which is a direct measure of drought conditions, specifically regarding the
difficulty for plants to extract water - which, in turn, limits their ability to produce biomass. The impact
of the ongoing LPB drought on soil moisture has been intermittently mitigated by sporadic
precipitation during 2020, but being not sufficient to restore the total (ground)water storage, causing
the build-up of a clear and persistent negative total water storage anomaly.
11Figure 7. Soil Moisture Anomaly for the first ten-day period of September 2021 (upper panel) and Gravity
Recovery and Climate Experiment (GRACE) Total Water Storage (TWS) Anomaly, July 2021 (lower panel).
Soil moisture anomalies at the end of the first 10-day of September 2021 reflect the drier conditions
(Figure 7, top panel) in the northern part of the LPB (spreading over Paraguay and Southern Brazil),
approximately in the same regions where SPI-6 reached the lowest values (Figure 5). This reinforces
the assumption that the main trigger of this drought event is, to a large extent, a mild but persistent
lack of precipitation over a prolonged period.
The Total Water Storage (TWS) Anomaly indicator (Figure 7, bottom panel) is used to detect the
occurrence of long-term hydrological drought conditions; it is often used as a proxy of groundwater
drought. The TWS Anomaly is computed in terms of anomalies of TWS estimated from data collected
12by the GRACE satellite mission (Landerer and Swenson, 2012). TWS is strongly correlated with the
long-term SPI, i.e. 12, 24 and 48 months (Cammalleri et al., 2019). The TWS anomaly represents a
reliable indicator of anomalies in groundwater availability and therefore is a useful proxy for
anomalies in river flow levels. The TWS anomalies in July 2021 reflect the driest conditions in the
northern part of the LPB, at roughly the same areas where the SPI-6 and soil moisture anomalies
reached the lowest values.
The Low Flow Index (LFI) exploits the simulated daily river water discharge outputs of the LISFLOOD 8
hydrological model, in order to capture consecutive periods of unusually low streamflow, and
compares the consequent water deficit during those periods with the historical climatological
conditions, in order to derive the severity of the events. During the first 10 days of September 2021,
the LFI is largely following the trend in soil moisture and groundwater conditions in the LPB, as
expected (Figure 8). There are strong deficits in the upper eastern part of the basin, and close to the
outlet 9 of the LPB. Areas where the low-flow index cannot be reliably computed (mainly in the central
part of the LPB) due to inconsistencies between near-real time and historical data are masked in grey
(Cammalleri et al., 2020).
Other local information sources, however, point to large deficit in the central part of the LPB. A report
by Argentine “Instituto Nacional del Agua” (INA) 10 describes the conditions during the first week of
September 2021. This report highlights that low streamflow values for the Paraná and Paraguay
rivers confirm the drought condition affecting the northern and middle half of the LPB. In the Paraná-
Paraguay confluence section, river levels remained in gradual decline during the first half of August
2021. The Paraná flow off Corrientes and Rosario in August 2021 was less than half the average
value for that month calculated by using the last 25 years.
Figure 8. Low-Flow Index (LFI) for the first ten-day period of September 2021. A Low Flow Index of 0
corresponds to no drought and a value of 1 to the highest drought hazard.
Discharge of the Paraná River has been impacted, with values far below average. According to the
Standardized Streamflow Index (SSFI) at time scales of 12- and 24-months, the Emborcação
(Paranaíba River Basin) and Furnas (Grande River Basin) hydropower plants (HPP), located in the
Northeast of the Parana River Basin (Figure 9) have been facing a hydrological drought since 2014,
8 https://publications.jrc.ec.europa.eu/repository/handle/JRC78917
9 A river mouth or outlet is the part of a river where the river debouches into a larger body of water, such as another river, a lake or
reservoir, a sea, or an ocean
10 https://www.ina.gob.ar/archivos/alerta/Escenario2021_Septiembre.pdf
13classified as severe (SSFI < -1.3) and exceptional (SSFI < -2.0). Since February 2019, the Jurumirim
(Paranapanema River Basin) and Foz do Areia (Iguazu River Basin) HPPs have been under hydrological
drought condition, classified between severe and exceptional. Currently, the HPP Jurumirim remains
in the most critical conditions (SSFI-12 = -2.7 and SSFI-24=-3.1). The inflow at the Itaipu HPP has
been facing a hydrological drought since April 2019 and has been in “exceptional” drought conditions
since December 2020 (SSFI < -2.0). Overall, the current hydrological drought is the most severe since
at least January 1981.
Figure 9. Standardized Streamflow Index (SSFI) at time scales of 12- (left panel) and 24-months (right
panel), for the HPP sub-basins of Emborcação, Furnas, Jurumirim, Foz do Areia and Itaipu. (Source:
CEMADEN).
In the Paraná river basin outlet section, the extreme value of the low flow index clearly illustrates the
severe drought condition of the whole basin and gives the magnitude of the event 11. The flow into
the Paraná Delta (near its entry to the Río de la Plata Estuary) has recorded a downward trend
throughout the whole month of August 2021. The flow observed in this section has been 7,000 m3
s-1, well below pre 2019 conditions. Given the low Paraná levels, the whole Delta is highly dependent
on the oscillations coming from the estuary.
2.5 Vegetation response
The fraction of Absorbed Photosynthetically Active Radiation (fAPAR, a satellite-based GDO indicator)
is an indicator of anomaly, used to detect and monitor the impacts on vegetation growth and
11 This index is officially provided and distribute at present only for Europe (European Drought Observatory https://edo.jrc.ec.europa.eu),
but, in principle, it is based on the same algorithm and it is going to be implemented at a global scale.
14productivity from environmental stress factors, especially plant water stress due to drought. This
indicator represents the fraction of the solar energy absorbed by vegetation. fAPAR anomalies,
specifically the negative deviations from the long-term average over the same period, are a good
indicator of drought impact on vegetation. During the second 10 days of September 2021 and in
accordance with the other drought indicators, a significant impact on vegetation photosynthetic
activity is detected in the upper LPB (Figure 10).
Figure 10. Fraction of Absorbed Photosynthetically Active Radiation (fAPAR) anomalies for the second 10-
day period of September 2021. fAPAR anomalies represent the impact on vegetation growth and
productivity of environmental stress, especially plant water stress due to the ongoing drought.
153 Causes of the recent drought
3.1 El Niño-Southern Oscillation phenomenon (ENSO)
The El Niño-Southern Oscillation phenomenon (ENSO) is the major single source of interannual
climate fluctuations in many parts of the world (Cai et al., 2020; Davey et al., 2014). The climate of
most of South America is closely linked with El Niño/La Niña – the extreme phases of the ENSO
phenomenon, which is historically described as anomalous sea surface temperatures in the equatorial
Pacific (Cai et al., 2020). ENSO-related changes in the atmospheric circulation over South America
influence transport of tropical moisture into the extra-tropics. This modulation of the low-level jet
east of the Andes either favours or suppresses the occurrence of extreme precipitation events (Mo
and Berbery, 2011). Consequently, there are clear links between ENSO and precipitation in the LPB
during spring/summer (a critical period for rainfed summer crops). El Niño events generally are
associated with higher median precipitation in the LPB, whereas La Niña events show markedly lower
median rainfall and a narrower dispersion of anomalies (Cai et al., 2020; Davey et al., 2014; Prieto,
2007). ENSO also influences the frequency of extreme precipitation events that had dramatic socio-
economic impacts in the past (Grimm and Tedeschi, 2009; Prieto, 2007). Other processes influencing
the climate of the LPB include: humidity transport from the Amazon Forest towards the east, from
the Atlantic Ocean; the displacement of the Inter-Tropical Convergence Zone (ITCZ); the South
American Low-Level Jets; the strength and the variability of the subtropical Bolivian High; the
Antarctic circulation variability.
Throughout South America, precipitation and temperature show a substantial, but regionally diverse,
association with the ENSO. In the upper LPB, the ENSO signal in the interannual variability is not as
well defined as in the lower basin, as this region lies in the transition band between opposing impacts
of ENSO (Coelho et al., 2002). Nevertheless, a recent study of the Paraná Basin by (Santos et al.,
2021) found that most events considered as extremely dry in the upper portion of the basin were
associated with La Niña events. In most parts of the LPB, La Niña is often accompanied by drought,
leading to particularly negative impacts in southern Brazil, north-eastern Argentina, Paraguay and
Uruguay. The close association between La Niña events and dry conditions throughout the LPB is of
high concern, as recent observations and seasonal forecasts suggest that La Niña conditions may be
back again in October-November and lasting till the southern hemisphere autumn of 2022, thus
potentially delaying the return to normal conditions, including river flows, in the LPB (Figure 11 and
Box 2).
Due to its spatial extent, especially towards the south, the LPB has different climatic regimes. The
upper-basin region, located in tropical latitudes in central Brazil, has a monsoon climate with a marked
rainy season that spans from November to March and a dry season that occurs from May to
September. In general, this region has been experiencing a gradual decrease in rainfall during recent
decades (Cunha et al., 2019). Such decrease has affected the level of reservoirs in the region,
especially in the last decade.
In addition to the interannual signal, the LPB also has shown marked decadal climate variability
(Boulanger et al., 2016; Cavalcanti et al., 2015; Seager et al., 2010). Precipitation trends in this region
have been among the largest observed in the 20th century (Cavalcanti et al., 2015). An increase in
annual precipitation (particularly in spring-summer) has been observed since the 1970s over most of
central-eastern Argentina (Haylock et al., 2006; Jacques-Coper and Garreaud, 2015). However, in this
area there is evidence of reversals in trends in the drought-affected area around the 1990s, from
decreasing trends during the early period to increasing trends during the recent years (Rivera and
Penalba, 2014). A comprehensive analysis of the variability at decadal scale. encompassing multiple
rainfall regimes of the LPB (Grimm, 2011) and over the entire year is needed, especially in the light
of the forthcoming climate services focusing on multi-annual climate predictions.
16Figure 11. Sea surface temperature (SST) anomaly plume issued on 6 October 2021. The black solid line shows the
recent observed anomalies, and the red and blue lines show the GFS.V2 ensemble model-predicted SST anomalies in
the regions of the NIÑO3.4 region (5N-5S, 170W-120W). The dashed black line shows the ensemble mean. The
anomalies are shown with respect to the 1991-2020 climate. Source: NOAA.
The influence of the Southern Meridional Mode (SAM) in the drought events affecting the Parana River
in Argentina has been observed with the severe events during the ’40s, ’60s, late ’80s and the recent
ones in 2011 and 2013 (Díaz et al., 2018). The SAM also known as the Antarctic Oscillation (AAO)
describes the north-south movement of the westerly wind belt that circles Antarctica, dominating the
middle to higher latitudes of the southern hemisphere. The influence of La Niña has been observed
in drought events during the ‘50s and ‘60s (severe due to their long duration), and during 1988-1989,
1993-1995, 2002-2004 and 2011-2013. The influence of the sea surface temperatures over the
Tropical South Atlantic has been noted during drought events occurring in 1962-1971 and precede
the 1988-1990 and 2005-2010 droughts. Since 1950, these droughts were the longest identified to
date (Díaz et al., 2018).
3.2 Land use change and deforestation
Earlier rainfall-runoff studies in LPB found that climate has a more dominant effect on streamflow
that land use (Collischonn et al., 2001; Tucci, 2003). At the sub-basin scales climate is also the main
driver of streamflow variations, however also, land use has effects on the hydrological response of
the basins (Saurral et al., 2008). Studies conducted in the Upper Grande River Basin, Minas Gerais
State, Brazil, showed that conversion of forest into pasture led to an increase in total runoff and peak
flow and a decrease in the base flow and evapotranspiration (Oliveira et al., 2018).
17Box 2. Precipitation Outlook
On average, the rainy cycle in the LPB starts gradually, with precipitation first being observed in the second half
of September. Nevertheless, the transition to the rainy season occurs in mid-October. At present, it is difficult to
forecast the onset and intensity of the rainy season. The behaviour of convection in north-western South America
does not present a clear signal and it is not possible to predict with high certainty the onset of the seasonal
precipitation beyond climatological information. However, it should be noted that there is no clear association
between the start date of the rainy season and the total rainfall recorded during the wettest months.
At present, most seasonal precipitation forecasts from global model ensembles and the WMO regional CRC-SAS
consensus outlook indicate a scenario of deficit rainfall in the middle and lower portion of the LPB (Figure below).
In summary, in the headwater areas of the Paraná River basin, under normal conditions the most abundant rainfall
should only occur after mid-October. However, due to the low soil moisture resulting from the dry season and
lower than average rainfall during the rainy season in recent years, rainfall will take a while to make significant
contribution to river flow and reservoir storage. Furthermore, the likelihood of a La Niña event developing during
the last months of 2021, may affect rainfall in the middle and lower portions of the LPB. As a result, the most
likely scenario for the next three months is the continuation of the drought situation, both from a rainfall and
hydrological points of view.
Climate forecasts for October-December 2021 precipitation in South America from various sources. (a)
ECMWF, (b) NCEP, (c) Met Office, (d) DWD, (e) JMA and (f) C3S Multisystem seasonal forecast. In all panels
brown/yellow (green) areas correspond to below (above) normal precipitation. Probabilities are estimated by
comparing the forecast probability density function (PDF) with the corresponding model climate PDF, estimated from
the hindcast set. The probabilities are stratified according to: the median, the lower/upper/middle third, and
lowest/highest 20% of the model climate distribution. As an overview to the seasonal forecast, a summary plot is
presented for tercile categories, which shows in a single figure the areas which have an increased probability (exceeding
40%) of being either below the lower tercile or above the upper tercile.
Sources: C3S, https://climate.copernicus.eu/charts/c3s_seasonal/ and CRC-SAS https://www.crc-sas.org/en/perspectivas_climaticas.php.
18Effects of land use on streamflow however are well known at global level, increasing peak flows and
decreasing base flows. The role of vegetation cover, floodplains and wetlands is to store and retard
runoff, an effect that, to a certain extent, counteracts the consequences of droughts. Therefore, the
effect of the current drought is exacerbated with land use changes, such as deforestation and
intensive agriculture, which are most likely happening in LPB.
These land use changes have characterised the three major sub-basins of the LPB: Paraguay, Paraná
and Uruguay in the last decades. Agricultural expansion from 1960 onwards, particularly in Brazil,
has left some areas with only 5% of its original forest cover (FAO, 2016). In the Brazilian state of São
Paulo, the area of primary forest has decreased from 58% to 8% at the end of the 20th century.
Similarly, in eastern Paraguay the forest area has fallen from 55% in 1945 to only 15% in 1990
(FAO, 2016).
The effects of dams in the river system are also visible in the LPB. In the Upper Paraguay River basin,
the number of dams upstream of the Pantanal have more than doubled over the last twenty years,
significantly affecting the frequency and duration of high and low pulses (Ely et al., 2020). At a larger
scale, data acquired before and after construction of Porto Primavera Dam in the upper Parana River
showed changes in water discharge, bank erosion, flood pulse and other variables (Stevaux et al.,
2009).
194 Historical drought events in the LPB
Since the 1960s, seven droughts (1977, 1984, 1990, 1992, 2001, 2012 and 2014) have reduced
reservoir storage supplies for São Paulo state in Brazil (Coelho et al., 2016). In some parts of the LPB,
such as the Upper Paraná River Basin, severe-to-exceptional hydrological drought conditions have
been present since 2014. Nevertheless, in the last two years this situation has worsened.
As shown by the Standardized Precipitation Index (SPI) at both 12- and 24-month scales (Figure 12),
precipitation in the Paraná River basin has been below average in recent years. The SPI time series
show several dry and rainy cycles over since the early 1900s, with the most severe drought recorded
from December 1968 to September 1971, peaking in March 1969. However, it is important to note
that, at that time the water demand throughout the Paraná River basin was much lower than at
present. By looking at the SPI-24 in the last 22 years, below-average conditions have predominated,
with short exceptions in 2010 and 2015. Since the end of 2019, drought conditions have intensified,
ranging from severe (SPI < -1.3) to exceptional (SPI < -2.0).
Figure 12. Time series of SPI-12 and SPI-24 calculated using rainfall estimated by the Global
Precipitation Climatology Center for the Paraná River basin from 1900 to 2021. (Source: CEMADEN)
The long-term SPI analysis outlines a severe worsening of the dry conditions in the last two-three
years which confirms that this drought event has been slowly building up since at least 2019 and its
long duration is the main reason of its severity (Cunha et al., 2019; Leal Filho et al., 2021; Libonati et
al., 2020).
20Figure 13 shows the hydrometric level of the Paraná River off Corrientes for some selected years
during the 20th century, upstream of the important Greater Rosario grain processing and shipping
cluster. The temporal evolution of the daily Paraná hydrometric level update until August 2021
(dashed black line) and for the five years having the lowest historical levels (solid lines) is shown in
Figure 13. The severity of the current low-level event is evident, and its evolution is comparable to
the one experienced during the two most severe low-level events in recorded history, i.e. 1934 and
1944. Furthermore, the previous patterns show that the minimum levels off Corrientes historically
have occurred between September and November, therefore a few weeks remain from the time of
writing (early October 2021) until Paraná levels may start recovering.
Figure 13. Comparative annual evolution of the daily hydrometric levels of the Parana river off Corrientes,
Argentina. Time series are shown for 2021 (dashed black line) and for the five most intense low-flow events
in the recorded history. Source: INA (2021), published 13 August 2021.
A drought in the southern part of the LPB was identified by Abelen et al., (2015) and Lovino et al.,
(2018) during the strong La Niña event of 2008/2009. This drought has been considered as the worst
over the past century in Argentina, as it hit the most agriculturally productive region causing a sharp
reduction in grain and meat output. According to the Argentine agricultural research institute (INTA),
the 2008/09 drought caused a major drop in wheat production, from 16 million tons in the preceding
harvest to around eight million after the dry event.
A much stronger La Niña event occurred in 1999/2000 that was associated with a major drought in
the LPB. However, the magnitude of this event (at least in the lower LPB) appears to be less significant
than the ongoing drought as suggested by precipitation data. This indicates that other factors (besides
La Niña) played an important role (Chen et al., 2010). The severe drought in 2011–2012 caused
economic losses of USD 2.5 billion in the production of soybean and corn in Argentina (Naumann et
al., 2019).
Another major drought occurred in late 2017-early 2018 in the Pampas of central-eastern Argentina,
the southern portion of the LPB. This drought was linked to a weak La Niña event, as well as to other
intraseasonal modes of atmospheric variability (Bert et al., 2021). Several locations in the Pampas
21showed historical minimum precipitation values during this event. Lack of rainfall was compounded
by high temperatures and heat waves during early 2018. This drought had large impacts on
production of summer crops such as maize and soybean. When propagated throughout Argentine
economy, crop losses (about 1550 M USD) had an overall impact three times higher (about 4600 M
USD). Conservative estimates suggest that Argentine GNP decreased at least 0.8% due to this drought
(Bert et al., 2021).
To compare the ongoing drought with previous events occurring in the same region, historical time
series of two well-known drought indicators, i.e., the SPI and the SPEI (which also makes indirectly
use of temperature and thus includes the effects of warming) were examined. Both indicators were
computed at 3-month and 12-month accumulation scales. We used the same approach described in
Spinoni et al., (2019) which resulted in the creation of the global meteorological database of drought
events hosted by the European Commission’s Global Drought Observatory 12. This database had been
updated through 2016 and it classifies drought events which can be considered to have finished from
a meteorological point of view. We have performed new analyses that now extend the database to
2021 and adapted the classification system in order to fit events that have not concluded yet.
Regarding the extension of the approach, we used both GPCC and ERA5 data 13.
The Paraná River Basin encompasses more than one country but, according to the new macro-regions
officially included in the latest IPCC-AR6 report (IPCC, 2021; Iturbide et al., 2020), we selected the
South-Eastern South America as the target of our retrospective analyses. As mentioned before, one
historical drought event stands out when considering both precipitation (SPI) and temperature (SPEI)
as indicators, namely the event that began in the late 1960s (1967 or 1968) and lasted until 1971
(or 1972 in some areas). This was the only event in the region that can be classified as “exceptional”
from 1950 until 2016. By refining the classification score – now ranging of 1 to 100 instead from 1
to 25 as in the published version of the historical database – the 1967-1972 event shows a value of
60, therefore it can be considered among the twenty most severe events at global scale since 1950.
The ongoing 2019-2021 LPB drought has not yet reached the status of exceptional (score above 58),
but it is very close (score: 55) to that status and can be already ranked among the top five dry events
in South-Eastern South America since the 1950s. Most of the parameters included in the classification
(severity, intensity, peak) show that the ongoing drought falls behind the 1968-1971 event because
of its shorter duration. Nevertheless, the ongoing event is likely to evolve from “very severe” to
“exceptional” if the precipitation stays below the normal values for another three to six months and
if the temperature does increase above normal during that period.
Over Paraguay, three historical meteorological drought events stand out the one in 1968-1971 and
two later events, namely one in 1978-1979 and one in 2008-2010. The latter peaking in 2009, when
an extreme drought also hit Argentina and southern Brazil. Looking at the ongoing drought event, the
country-based score for Paraguay is now around 50 (very severe), in the same range of the 2009
event (score: 49) and behind the 1968-1971 (score: 53). Furthermore, high scores are also found in
Uruguay, thus confirming that the event in the Paraná River basin discussed in this report can be
taken already as one of the most severe in the last seventy years also at country scale.
12 https://edo.jrc.ec.europa.eu/gdo/php/index.php?id=2020
13 https://www.ecmwf.int/en/forecasts/dataset/ecmwf-reanalysis-v5
225 Reported impacts of the ongoing drought
Prolonged drought events can affect large areas and population, with wide-ranging impacts on
society, economic activities, and the environment. These impacts can be direct and indirect in nature
and are often difficult to quantify in economic terms. The ongoing drought in the LPB has already had
considerable impacts on the structure and functioning of natural ecosystems and has compromised
the well-being of important sectors of society. This section presents a collection of the impacts
reported and attributed to this event to date. Most of the reports come from recognised media outlets,
governmental reports and scientific publications. Since the event is still in progress at the time of
writing, total damage estimates and characterisation of all affected sectors can be performed only
once the event will be over.
5.1 Drought emergency declaration
Argentina 14, Brazil 15 and Paraguay 16 have declared formal drought emergencies during 2021. On 24
July 2021, the Argentine Government declared a state of water emergency valid for 180 days and
encompassing seven provinces with coastlines on the Paraná, Paraguay and Iguazu Rivers. On 8 July
2021, the Government of Paraguay declared a state of emergency for navigation on the Paraná,
Paraguay and Apa rivers.
5.2 Ecosystems – Wetlands
As the availability of water in wetlands is reduced during droughts, wet corridors that connect sections
of open waters decrease in area and dry, resulting in loss of habitat, soil structure and erosion, organic
soil oxidation and carbon release into the atmosphere (Dollar et al., 2013). The extension of wetlands
ecosystems in LPB is considerable, covering a continuous area from the Pantanal in the north, to the
La Plata Estuary in the south.
The very wide regions of Great Chaco, Pantanal and Paraná basin (northern Argentina, Bolivia,
Paraguay, Mato Grosso and Mato Grosso do Sul in Brazil) had intense dryness since austral summer
of 2018 (Marengo et al., 2021b), with wide ranging impacts on natural ecosystems, agriculture,
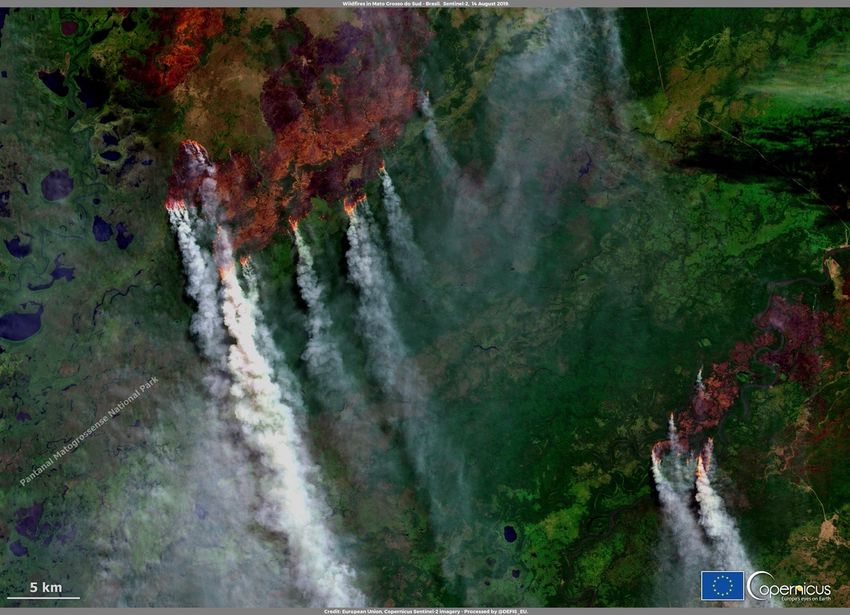
transportation and power generation. Since 2019, the Pantanal is suffering a prolonged drought that
has spelled disaster for the region, and subsequent fires have engulfed hundreds of thousands of
hectares (Marengo et al., 2021b). By December 2020, extreme drought in the Brazilian states of Mato
Grosso and Mato Grosso do Sul had affected 4.17 million people (76% of the population of both
states). A total of 218 municipalities in this area (almost 100%) were affected by drought..
Further north, the drought has also affected the Pantanal Matogrossense National Park (Mato Grosso,
Mato Grosso do Sul, 135,000 ha wide), that is part of the largest, permanent freshwater wetland in
the Western Hemisphere. It is situated in a large depression functioning as an inland delta and is
probably the most important wetland in South America.
In Argentina, environmental organizations have warned about significant changes in the ecosystems
associated with Paraná River shores, with places where the aquatic or marsh vegetation is no longer
present. Exposed sandbars and dried wetlands off Rosario emerge from satellite imagery (Figure 14).
By May 2021, Argentine authorities announced measures to safeguard river's biodiversity and protect
14 https://www.boletinoficial.gob.ar/detalleAviso/primera/247302/20210726
15 https://www.gov.br/ana/pt-br/assuntos/monitoramento-e-eventos-criticos/eventos-criticos/salas-
deacompanhamento/Paraná/ResolucaoANA771junho2021.pdf
16 https://www.bacn.gov.py/archivos/9613/LEY%206767.pdf
23You can also read