Are sirens effective tools to alert the population in France?
←
→
Page content transcription
If your browser does not render page correctly, please read the page content below
Nat. Hazards Earth Syst. Sci., 21, 2899–2920, 2021
https://doi.org/10.5194/nhess-21-2899-2021
© Author(s) 2021. This work is distributed under
the Creative Commons Attribution 4.0 License.

Are sirens effective tools to alert the population in France?
Johnny Douvinet1,2 , Anna Serra-Llobet3,4 , Esteban Bopp1 , and G. Mathias Kondolf5
1 UMR    ESPACE 7300 CNRS, University of Avignon, Avignon, 84000, France
2 FR  2625 CNRS, Agorantic (Culture, numerical societies and landscape), Avignon, 84000, France
3 Institute of International Studies, University of California Berkeley, 215 Moses Hall, Berkeley, CA 94720, USA
4 Center for Catastrophic Risk Management, University of California Berkeley, 820 Social Sciences Building,

Berkeley, CA 94720, USA
5 Department of Landscape Architecture & Environmental Planning, University of California Berkeley,

202 Wurster Hall, Berkeley, CA 94720, USA

Correspondence: Johnny Douvinet (johnny.douvinet@univ-avignon.fr)

Received: 20 November 2019 – Discussion started: 14 January 2020
Revised: 4 August 2021 – Accepted: 1 September 2021 – Published: 30 September 2021

Abstract. In France, sirens have been the principal tool des-      1   Introduction
ignated to alert the population in the case of danger. However,
their efficacity has not been objectively tested. Using a geo-
graphical information system, questionnaires, and surveys,         Sirens are among the most widespread tools to alert a pop-
we analyzed (1) the spatial distribution of the siren network      ulation to danger (Sorensen, 2000; Bean et al., 2016; Sät-
in relation to the covered population, the hazards threatening     tele et al., 2016; Stokoe, 2016; Mathews et al., 2017; Goto
different areas, and the actual number of disasters that have      and Murray, 2020; Bopp and Douvinet, 2020). Sirens are in-
occurred in the past, (2) the political dilemma of activating      tended to adequately warn citizens of threats or dangers to
sirens, and (3) the population’s trust in sirens, as well as its   life or property, such as sudden mass hazards (earthquake,
understanding of expected behavior in the case of an emer-         tsunami), rapidly occurring natural hazards (wildfire, flash
gency. Results show that, with a few exceptions, siren cover-      flood), industrial accidents (toxic gas releases, explosions),
age in France is primarily determined by population density,       or terrorist attacks, and can be implemented at the scale of
not by the expected hazards or the cumulative number of past       entire cities (Singapore, Bombay, or Mexico City) or coun-
disasters. Sirens are also rarely used by the authorities. How-    tries (e.g., Japan, France). Sirens theoretically present several
ever, surveyed members of the population identify sirens as        advantages. They produce collective as well as individual re-
the most effective alert system over other alternatives such       actions (Creton-Cazanave, 2010). They should allow author-
as cell-phone-based alerting tools. In a “mock” emergency          ities to quickly advise people and to implement countermea-
most members of the public did not know how to respond             sures in a short response time (Douvinet, 2020). They are ef-
in the case of an emergency, and even most of those who            fective in alerting an entire population, day or night (Zunkel,
correctly identified the appropriate response prior to the ex-     2015; Mathews et al., 2017; Landry et al., 2019), provided
ercise did not react upon later hearing the siren. To improve      that the distribution of sirens is dense enough to be heard
the effectiveness of the French siren network, we recommend        by all. Sirens leave no time for hesitation and require imme-
(1) relocating sirens to optimize their efficiency, (2) comple-    diate reactions (Reed et al., 2010; Cain et al., 2021; Fekete
menting the sound of sirens with a clear and unified message,      et al., 2021). But their effectiveness is based on the implicit
(3) reorganizing the competencies to activate siren alerts, and    assumption that the population understands what is expected
finally (4) improving public education on different alert tools    from them during the alarm (Sorensen, 2000; Linsday, 2011).
and expected behavior during an emergency.                         For example, in regions of North America prone to torna-
                                                                   does, a siren during tornado season is understood to indi-
                                                                   cate an impending event, and it is assumed that the alerted
                                                                   population knows the need to take shelter (Mathews et al.,

Published by Copernicus Publications on behalf of the European Geosciences Union.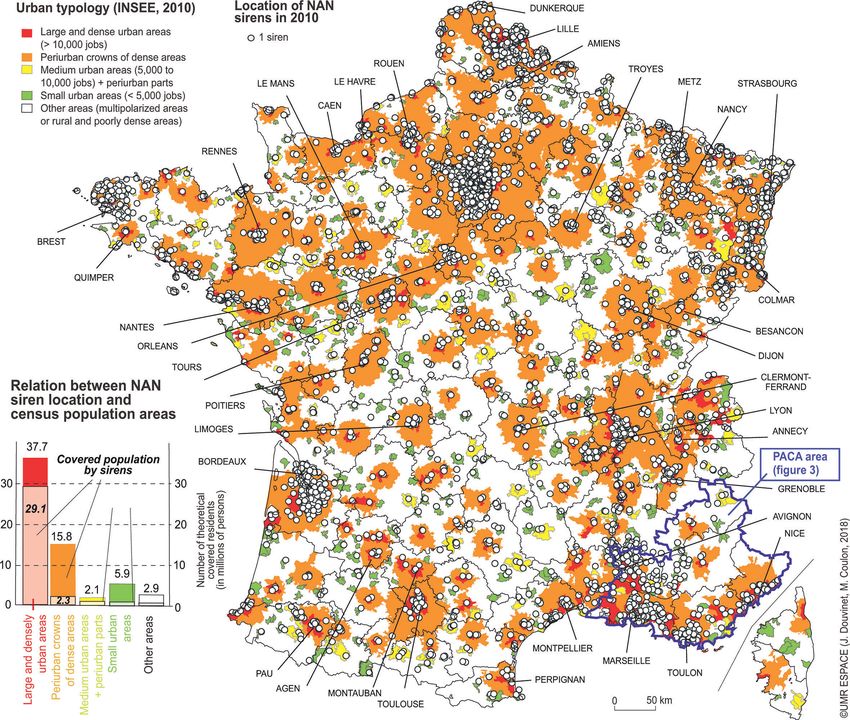
2900                                            J. Douvinet et al.: Are sirens effective tools to alert the population in France?

2017). Mexico City has used sirens emitting a characteristic         lation recognized the sound of alert sirens well enough to
sound to alert residents when earthquake shaking is immi-            guide behavior (Deloitte, 2014). While sirens continue to re-
nent (Coleman et al., 2011). These outdoor sirens are then           ceive new funding (EUR 83 million in 2010), the protocol
a relevant part of the warning dissemination process since           for activating them remains largely unapplied (Vogel, 2017).
one siren may alert thousands of people even if they are not         Over the period 1959–2020, sirens were activated only five
watching or listening to any type of mass media broadcast.           times: (1) during the 2014 Vidourle flash floods (3 casual-
However, where the population is less informed about risks           ties); (2) during the 2017 wildfires around Vitrolles, near
(e.g., from flash flooding) or where sirens can be activated         Marseille (no victims but 2400 ha burned area and a cost ex-
for different risks, they may be less effective, and the behav-      ceeding EUR 1.3 million); (3) during the industrial fire in Lu-
ior expected from the people (to stay, to shelter, to leave, etc.)   brizol, near Rouen, on 26 September 2019 (there were only
might be more ambiguous (Douvinet, 2018).                            two sirens located less than 500 m around the fire); (4) dur-
   In France, despite changes at the head of the Ministry of         ing flash floods near Cannes, on 23 and 30 October 2019
Interior over the past 60 years, since the end of World War II       (5 casualties). Nevertheless, many disasters did not result in
the priority remains allocated to the sirens for alerting peo-       sirens being activated, for example during the 1969 dam fail-
ple (DGSCGC, 2013). A first network of sirens, the National          ure in Malpasset (421 victims) or in the situation of numer-
Alert Network (NAN), was designed, as attested by an or-             ous flash floods, such as in Nîmes in 1988 (9 casualties), in
der signed in 1954 by General de Gaulle. Electronic sirens           Vaison-la-Romaine in 1992 (31 casualties), in Draguignan in
were foremost deployed to alert people to aerial threats, and        2010 (25 casualties), in Cannes in 2015 (20 casualties), in
a few years later, the order of 7 January 1959 defined respon-       Trèbes in 2018 (5 casualties), and near Nice in 2020 (13 ca-
sibilities of the authorities responsible for the NAN activation     sualties). Siren activation is also limited when we consider
(mayors, prefects, and the Ministry of Interior). The decree         all the dangerous situations that could require it (i.e., 3226
of 8 May 1973 expanded NAN use in the event of nuclear,              municipalities have been the subject of a natural disaster de-
bacteriological, and chemical risks, in relation to the devel-       cree per year for floods over the period 1982–2018 for exam-
opment of the nuclear program in France in the 1970s. In             ple; CCR, 2019). In part, this may reflect a reluctance to use
2010, 4189 NAN sirens were deployed in 2568 municipali-              sirens because of liability that may arise from a false alarm
ties across France (Deloitte, 2014). But due to their age and        (such as occurred in Bastia in 2005, in the situation of a pos-
failures in the activation, the French Ministry of Interior de-      sible tsunami) and the related administrative penalties to offi-
cided in 2010 to create a new network, presented as “more            cials who incorrectly sound the alarm (2 years imprisonment
modern” and “more responsive”: the so-called SAIP (Sys-              and a fine of EUR 30 000).
tème d’Alerte et d’Information des Populations), with a final           Underlying the reliance on sirens also makes the assump-
target date of 2022. The distribution of the future SAIP sirens      tion that people are able to identify, recognize, and deal with
is based on the concept of risk area, “taking into account the       hazards or threats, whatever their origins or how quickly
population density, the speed of the process-creating hazards,       they occur (e.g., flash floods). Other studies have demon-
the nature of risk, and specific circumstances (concentration        strated that few individuals are able to identify and under-
of chemical industries for example)”, but no maps and statis-        stand dangers only by hearing sirens in France (Jagtman,
tics are available to confirm how these concepts were ap-            2010; Lutoff et al., 2016; Daupras et al., 2015). The sound
plied to develop the distribution of sirens. The distribution        of the siren is “one sound on top of others” (Dedieu, 2009)
of the 5531 SAIP sirens was planned according to two pri-            and is added to the ambient noise, particularly in urban ar-
ority levels (Vogel, 2017). A total of 640 high-priority areas       eas. Decision-making becomes complex under stress because
are covered by 2832 sirens, and 1103 lower-priority areas            it involves cognitive and perception barriers (Becerra et al.,
are covered by 2699 sirens (Table 1). The siting of new SAIP         2013; Créton-Cazanave, 2010; Daupras et al., 2015). The in-
sirens was guided by three objectives: (1) to connect sirens         terpretation of sounds depends on the knowledge and past ex-
together, (2) to create a unique software, and (3) to improve        periences of each person, as well as the knowledge of those
the siren locations to reach a maximum number of people.             responsible for deciding to activate the alarm (Cain et al.,
But the areas and populations covered by the sirens is not           2021). In addition, these elements play a key role in the de-
publicly available information.                                      cision time before the reaction time (Colbeau-Justin, 2002;
   Several studies have raised doubts about the effective-           Daupras et al., 2015). It is impossible to produce a signal
ness of sirens and criticized the heavy investment in this           that triggers automatic behaviors (Roux, 2006), and the train-
technology in France (Hirel, 2002; Vinet, 2010; Garcia and           ing of reflex takes time. A strong difference also remains in
Fearnley, 2012; Beccerra et al., 2013; Pappenberger et al.,          behavioral skills, between “I know what to do if something
2015; Daupras et al., 2015; Vogel, 2017; Douvinet, 2018;             happens” and “I really apply the safety instructions when a
Courteau, 2019). Monthly testing of sirens (e.g., in France,         danger occurs” (Weiss et al., 2011), and these lags prevail,
the first Wednesday of each month) has served to remind res-         independently of the type of the risk involved and of the types
idents of the existence of sirens (Créton-Cazanave, 2010),           of alert messages (Cain et al., 2021).
but a national study indicated that only 22 % of the popu-

Nat. Hazards Earth Syst. Sci., 21, 2899–2920, 2021                                  https://doi.org/10.5194/nhess-21-2899-2021
J. Douvinet et al.: Are sirens effective tools to alert the population in France?                                              2901

Table 1. Number of sirens in the NAN network and in the SAIP project expected in 2022 (data from Vogel, 2017).

              Priority level         Number of risk areas                Number of sirens in the SAIP project
                                                              NAN      New       Municipalities’   Chemical risk     Total
                                                             sirens   sirens             sirens      area sirens   number
              Level 1 (2017–2020)                     640     1286      932                 614               0      2832
              Level 2 (2020–2022)                    1103      191      854                 533            1121      2699
              Total (after 2022)                     1743     1477    1786                 1147            1121      5531

   In light of the limitations mentioned above our main re-           evaluate the functionality and usability of sirens for author-
search question is as follows: are sirens effective tools to          ities in charge of “turning them on” (prefects and mayors).
alert people in France? To answer this question, we have an-          Third, to assess if the population trusts sirens and to evalu-
alyzed (1) technical aspects related to the spatial distribution      ate the effectiveness of the alarms in relation to perception
of sirens (Where are the sirens located? Do they cover the            and behavioral aspects, we created an online survey and ob-
targeted population?), (2) the institutional context of using         served applications of safety guidelines during an emergency
sirens in France (What is the role of sirens in emergency man-        exercise.
agement in France? How are they used? Are they used?), and
(3) cognitive and behavioral aspects related to the sirens (Do        2.1      Spatial distribution of sirens in France
people trust sirens? Do people understand what is expected
from a siren alert? Do people adopt appropriate behaviors
                                                                      2.1.1     Where are sirens located in France?
after a siren alert?). To gain insights into these questions, we
conducted a review of relevant literature in multiple fields,
created a geographical information system (GIS) to analyze            The location of the 4189 NAN sirens was provided by the
the spatial distribution of sirens in relation to population den-     French Ministry of Interior in a shapefile format in 2017.
sities and location of potential hazards, and conducted sur-          Then, we located the 2568 equipped municipalities, and we
veys (Fig. 1).                                                        used the municipal population census of 2010 to obtain a
                                                                      first estimation of the population living in equipped or un-
                                                                      equipped cities. Such figures are not an ideal choice as nei-
2   Data and methods                                                  ther the patterns of location of people at finer scale, the in-
                                                                      fluence of environmental factors in the sound propagation
Data and methods developed in this article draw upon re-              (Mathews et al., 2017), nor mobility of residents are con-
search conducted since 2016. However, all tables and figures          sidered. But with these first estimates, we wanted to identify
in this article are original. In previous research, the method to     which kinds of areas were equipped (urban cities? rural ar-
calculate the number of residents living around sirens (Dou-          eas?) and which were not to detect over- or under-endowed
vinet, 2018) and the questionnaire addressed to prefects and          cities and to calculate at national scale the part of residents
mayors (Bopp et al., 2021) were not yet addressed at a lo-            theoretically covered. We compared the number of natural
cal scale, while this article coupled new results obtained at         disasters and the number of risks, both provided by the Min-
the national scale. Combining quantitative research and dis-          istry of Environment (for 2014), for the equipped and un-
playing results in new tables and figures allowed us to have          equipped cities to evaluate the influence of risks or past dis-
a more comprehensive assessment of the situation of siren             asters on the distribution of sirens. The number of natural
alerts in France.                                                     disasters, registered in the national CatNat database (1983–
   First, to assess the spatial coverage, we applied tools that       2010), is a potentially relevant variable because a munici-
combine data collected using a GIS with information col-              pality that has suffered significant damage as a result of a
lected for each municipality (the number of inhabitants in            natural phenomenon may request classification of the event
2014, the number of natural disasters over the period 1983–           as a “natural disaster” in France (Vinet, 2010; Douvinet and
2019, and the number of registered risks). We created a geo-          Janet, 2017). The number of risks, registered in the DDRM
database to provide an overview of the siren coverage and             (Dossier Départemental des Risques Majeurs, Major Risk
to assess various factors that could explain the location of          Synthesis) database (available in each prefecture), refers to
the current and the future siren system. This allowed us to           the idea that a municipality needs to map and to inform the
identify areas equipped and unequipped with sirens and es-            population about risks in the living zone. We used the Spear-
timated populations covered. Second, to analyze the politi-           man correlation coefficient as a measure of a positive or a
cal dilemma (activating the siren or not), we analyzed op-            monotonic relation. This is the first time that such an analy-
erational reports and created an in-person questionnaire to           sis using this spatial information has been reported in France.

https://doi.org/10.5194/nhess-21-2899-2021                                      Nat. Hazards Earth Syst. Sci., 21, 2899–2920, 2021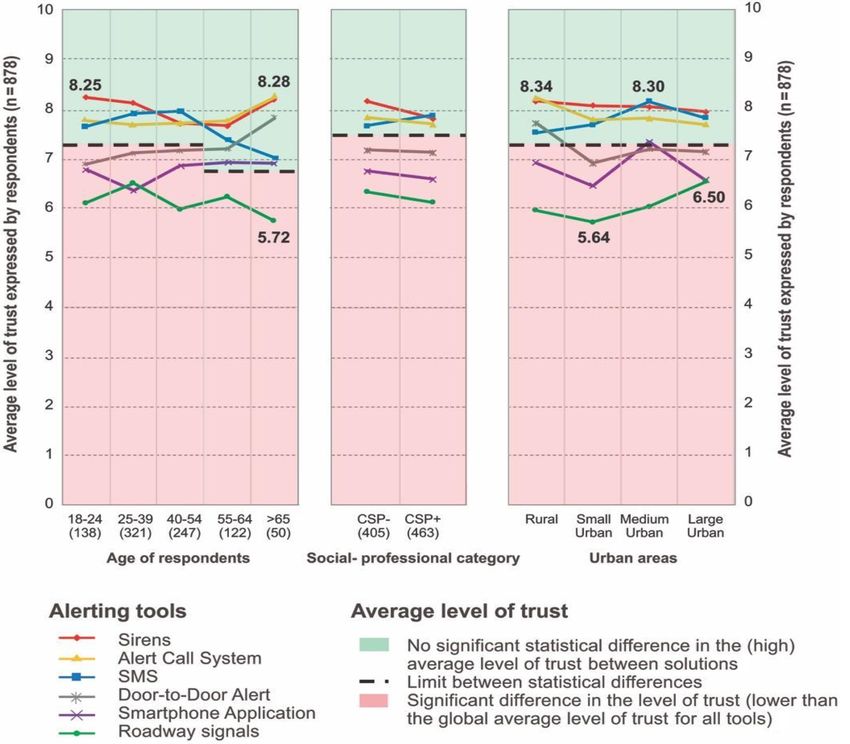
2902                                          J. Douvinet et al.: Are sirens effective tools to alert the population in France?

Figure 1. Research questions and methods.

   Due to the confidential nature of databases, we can-            2.1.2   Do sirens cover the targeted population?
not present maps expected for the future SAIP network
over all of France. However, we have the consent of the
French Ministry of Interior to address this analysis in the        Sirens may broadcast a similar sound in France but with var-
PACA (Provence–Alpes–Côte d’Azur) region, in southern              ious intensities (from 114 dB to a maximum of 126 dB), var-
France, covering 31 400 km2 with an estimated population           ious frequencies, and various powers (from 1 up to 7 kW).
of 5 029 214 inhabitants in 2016 (INSEE, 2018). The pop-           Siren locations were available in a shapefile, but the power
ulation has doubled since the 1960s (2 414 958 inhabitants         of the sirens was indicated for only 32 % of sirens, and the
in 1954) mainly due to tourism and immigration from else-          date of installation was available for only 28 %. According
where in France and abroad. Two thirds of residents live in        to the manufacturers, sirens should be audible in all direc-
four major urban cities (Marseille, Nice, Toulon, and Avi-         tions (360◦ ) over a distance of 4.5 km with a power of 7 kW,
gnon). Eighty percent of the population is located in coastal      but our field tests indicated that the siren sounds could not
areas, while mountainous and rural areas in the Alpine re-         be heard beyond 1 km (Douvinet, 2018). The actual radius of
gions are sparsely populated. The precise location of the fu-      audibility around sirens is a function of sound propagation,
ture SAIP sirens was provided by the French Ministry of In-        which besides strength of the emitted sound also depends on
terior in a shapefile format in 2019. Then, we located the fu-     factors like the strength and direction of winds, temperature,
ture 254 SAIP sirens and compared them with the older 304          air density, nature of materials used for construction, and the
NAN sirens. We thus analyzed the previously NAN-equipped           ambient sound (Zunkel, 2015; Mathews et al., 2017). While
municipalities (without SAIP sirens), the newly equipped           the audibility distance for a siren with a power of 7 kW is
sites (with SAIP), and areas where NAN sirens will be in-          considered to be up to 3 km, sirens may also be inaudible be-
cluded in the future SAIP network, and we estimated the evo-       yond a distance of 800 m from the source point even under
lution in covered population. One indicator, the Gini index        ideal conditions. Audibility would be much less for weaker
(Atkinson, 1970), was estimated to detect levels of inequal-       (1 kW) sirens. Energies between two sirens can be disturbed
ity between municipal estimates. These Gini values may vary        if they are not far enough apart: for example, for a 4 kW siren
between 0 (a perfect equality with identical values for the        the spatial distance needed to be respected is 2.1 km in a calm
overall population) and 1 (extreme inequality, with values         urban environment and 0.57 km in a densely urban area (De-
equal to 0, except for one individual); between 0 and 1, the       loitte, 2014). In selecting a constant radius of audibility to use
higher the Gini index is, the greater the inequality is. In ad-    in our spatial modeling, we chose a 1.4 km radius based on
dition, the Moran index was also calculated (Moran, 1950).         prior studies (Bopp, 2021; Reed et al., 2010; Zunkel, 2015;
Negative Moran indexes indicate a negative spatial autocor-        Mathews et al., 2017), assuming a 7 kW siren and accounting
relation, and values range from −1 (indicating perfect spatial     for attenuation and ambient sound volume (Aumond et al.,
dispersion) to 1 (perfect correlation). A zero value is signifi-   2017). Using the population density with a square mesh with
cant for a perfectly random spatial pattern.                       tiles of 200 m sides, we calculated the population covered in
                                                                   the 1.4 km optimized radius. The population included in the
                                                                   radius of a siren was proportional to the area of the related

Nat. Hazards Earth Syst. Sci., 21, 2899–2920, 2021                                 https://doi.org/10.5194/nhess-21-2899-2021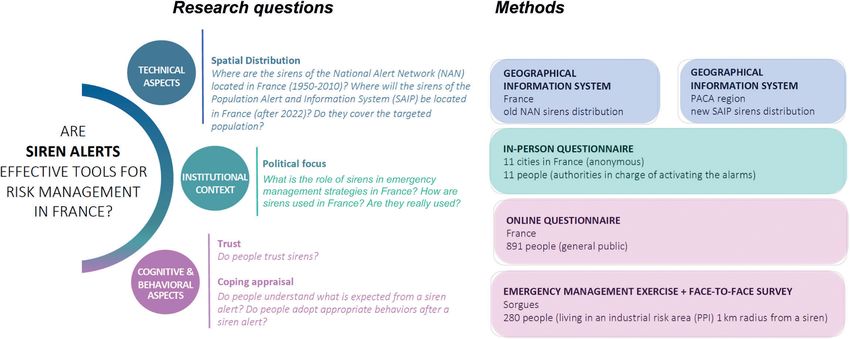
J. Douvinet et al.: Are sirens effective tools to alert the population in France?                                           2903

circle (Mathews et al., 2017). This new estimate of popula-       what factors led to the activation?). Indeed, we wanted to
tion covered could be compared to the total population living     collect their opinions on the place of sirens in their emer-
in the cities equipped with sirens.                               gency alert strategies and to compare them with the opera-
                                                                  tional review we carried out in the first step. This qualitative
2.2     Institutional context: assessing the siren activation     analysis was mainly focused on further exploration of unique
        dilemma                                                   and specific findings in relation to the roles, functions, and
                                                                  contributions of actors during the alerting process, but the
2.2.1    What is the role of sirens in emergency                  small sample size did not lend itself to statistical analysis.
         management in France?
                                                                  2.3     Behavioral aspects: measuring awareness and trust
We compiled and reviewed literature (including operational                in sirens for citizens
reports) on major disasters in France over the period 2000–
2020, especially after the flash floods occurring in 2010,        2.3.1    Do people trust sirens?
2015, 2018, and 2019 and the industrial accident in Lubri-
zol in 2019, to ascertain why sirens were used (or not) dur-      A second sample (S2) involved 891 respondents (441
ing such events. We took into account political legacy, so-       women; 434 men), aged 18–80 years old (mean M = 39.90,
cial practice, the nature of the risks, and how well sirens       SD = 14.81), who completed an online questionnaire in 2019
were adapted to their environment (Donaldson, 1996). Many         (see Appendix B). We created this questionnaire to pre-
studies have shown that use of sirens is contingent on politi-    dict whether the location-based alert system (LBAS, like
cal, economic, social, and environmental factors (IBZ, 2017;      cell broadcast or location-based SMS) could be useful in
Bopp et al., 2021). But what about organizational aspects         France (Bopp and Douvinet, 2020). Relevant to the present
such as procedures, type, number of actors or responsibili-       paper, the questionnaire asked respondents to rate a range
ties to disseminate the alert, hazard-detection modes, com-       of warning devices (including sirens) from 1 (not effec-
munications modes, and interactions with crisis (Bopp et al.,     tive) to 10 (very effective). We analyzed results according to
2021)? To answer this, we studied two ideas: (1) the siren ac-    respondents’ social characteristics (age, socio-professional
tivation depends on the structure and inherited political gov-    category, having experienced a disaster or not) and territo-
ernance more than the nature of risks or the impacts of disas-    rial factors (type of urban area) using an ANOVA (para-
ters; (2) the location of SAIP sirens (in progress since 2010)    metric data). All the 891 persons gave their prior consent
still depends on political choice more than risk awareness        to take part in this research, respecting the GDPR pro-
and type of disasters.                                            tocol. The profile of the respondents indicates an over-
                                                                  representation of those with a higher-graduate (with mas-
2.2.2    Governance: how are sirens used in France? Do            ter’s degree) diploma (+29.5 %), students (+11.0 %), and
         authorities really use them?                             individuals aged from 25 and 54 years old (+13.4 %), ac-
                                                                  cording to data currently available in France, and an under-
In addition, to complete the responses to the previous hy-        representation of retired people (−18.6 %), those with a
potheses, in 2020 we conducted semi-directive interviews          lower-graduate diploma (−10.6 %), and people without pro-
(N = 11), by phone (due to the COVID-19 context), with            fessional activities (−9.2 %), which could be attributed (at
prefects (4) and with actors (7) representing mayors in           least in part) to the use of the Internet for such a survey (Di-
France. The four prefects were selected with the support of       vard, 2009). The age distribution of participants presented
the French Ministry of Interior and the other actors via scien-   (138 were 18–24 years old, 321 were 25–39 years old, 247
tific and operational relations. All of them gave their consent   were 40–54 years old, 122 were 55–64 years old, and 50 were
to participate in the study, on a basis of anonymity, following   > 65 years old) is similar to the age distribution of the coun-
the requirements of the French GDPR (General Data Protec-         try as a whole. The largest group of respondents (508, 61 %)
tion Regulation) adopted in 2016. Interestingly, these actors     lived in large urban areas, while 124 were from medium ur-
play different roles in accordance with the level of govern-      ban areas, 128 were from small urban areas, and 118 were
ment administration at the national, departmental, regional,      from rural areas. We used the Gini index to indicate the level
and even at the municipal level. The sample (so-called S1,        of inequality in the distribution of values.
see worksheet in Appendix A) focused on the same topics
identified in our review of literature and operational reports:   2.3.2    Do people understand what is expected and adopt
the organizational objectives (what were the objectives of                 appropriate behaviors after a siren alert?
sirens and which steps must be undertaken for their use?), the
alerting structure (how does the approval process work and        To answer this question, we followed a civil security exer-
who triggers the siren?), the tools actually used (for which      cise in December 2016 in Sorgues, a small city immediately
hazards are sirens used and did the authorities use them?),       north of Avignon (Fig. 2) (see worksheet in Appendix C). We
and the operational culture (how efficient are the sirens and     administered a questionnaire to assess the perception and the

https://doi.org/10.5194/nhess-21-2899-2021                                 Nat. Hazards Earth Syst. Sci., 21, 2899–2920, 2021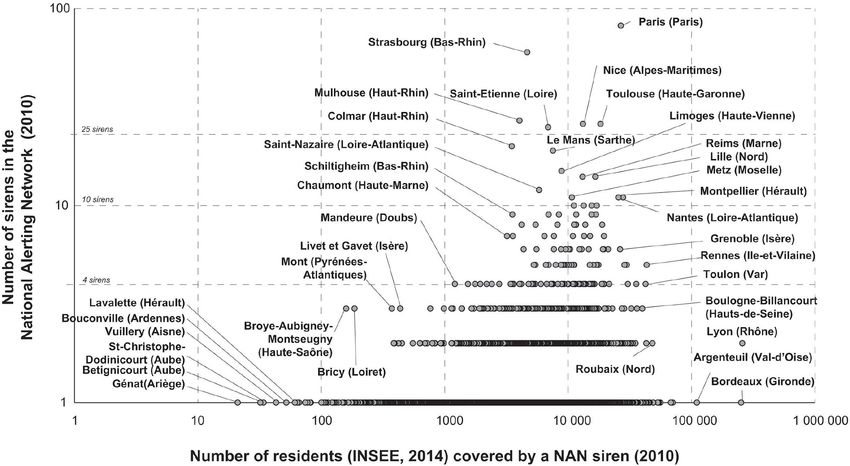
2904 J. Douvinet et al.: Are sirens effective tools to alert the population in France?
understanding of the alert to 280 persons (147 women and and numerous sirens were located in the Île-de-France region
133 men) aged 19–81 years old (M = 55.67, SD = 12.25) (Paris), equipped with 82 sirens, in Strasbourg (60 sirens),
who were present in this risky area (so-called the Plan Par- Marseille (57), Lyon (28), Toulouse (27) or Nice (26). A to-
ticulier d’Intervention perimeter in French) during the civil tal of 15 cities (out of 22) with more than 100 000 residents
exercise. All the participants gave their written consent prior were equipped with more than 10 sirens. The percentage of
to taking part in this exercise. We asked each participant equipped rural cities with sirens was the smallest (1.4 %),
“What do they think to do in the case of an industrial ac- and the rate in small urban areas (4.7 %) was likewise low.
cident” (Q1), and just a few minutes later, we asked them The small number of NAN sirens in peri-urban areas (4.1 %)
“What they had just done after hearing the siren sound at probably reflects the proliferation of such areas in France,
09:00 CET that morning?”. Some students (12) observed the but this suggests that the NAN siren coverage was poorly
exercise and addressed the questionnaire in some places (10) adapted to the evolution of urbanization as it sprawled over
located around the industrial site, in less than 1 km radius of the last 60 years. Sirens were mounted on top of town halls
the sirens, which were activated at 08:45 and 09:15 CET. We (26 %, 67 % in densely urban areas), on roofs of churches
analyzed responses quantitatively and estimated the correla- (14 %, 5 % in rural areas), on other administrative buildings
tions between signal detection and reaction variables using (28 %), and on poles placed along streets or buildings (32 %).
bivariate analysis. This sample (S3) was not conducted to as- Consequently, the NAN coverage was spatially unequal:
sess a representative survey on behaviors during sirens, but it 7.4 % of the total number of municipalities are equipped
enabled us to quantify the differences between knowledge of (Table 2). Of the 52.6 % of the French population living
appropriate behaviors (“I know what I have to do”) and the in an equipped municipality, most were located in large,
real reactions people have a few minutes after the activation densely urban areas: 77.3 % of this urban population (30 mil-
of alerts (“I do what I really understand about the situation”). lion people) was covered. Of the French population living
in medium-sized urban areas, only 54.4 % was covered by
2.4 Methodological limitations sirens, while only 20.4 % of those in small rural areas were
covered, and only 4 % of the population registered in rural ar-
Methodologically, the techniques for collecting surveys by eas really lives within sound of a siren (Table 2). The low per-
teleconference (due to the COVID-19 context) and in-depth centage of coverage in peri-urban areas around major cities
interviews created opportunities for data bias. While respon- (14.7 %) reflects the difference between the NAN location,
dents described their perception of sirens, the interpretations and the progressive evolution of urban settlement over the
are collected after events and not before, so this may intro- last 60 years. Unfortunately, other statistical analyses are im-
duce bias. It was also impossible to seek a demographically possible as the date of siren installation is only known for
representative sample of the population using online and 32 % of NAN sirens.
face-to-face questionnaires. Moreover, wording and order of When studying the relationship between the number of
questions play a role in the way individuals respond (Budd, NAN sirens and the part of the population covered by a siren,
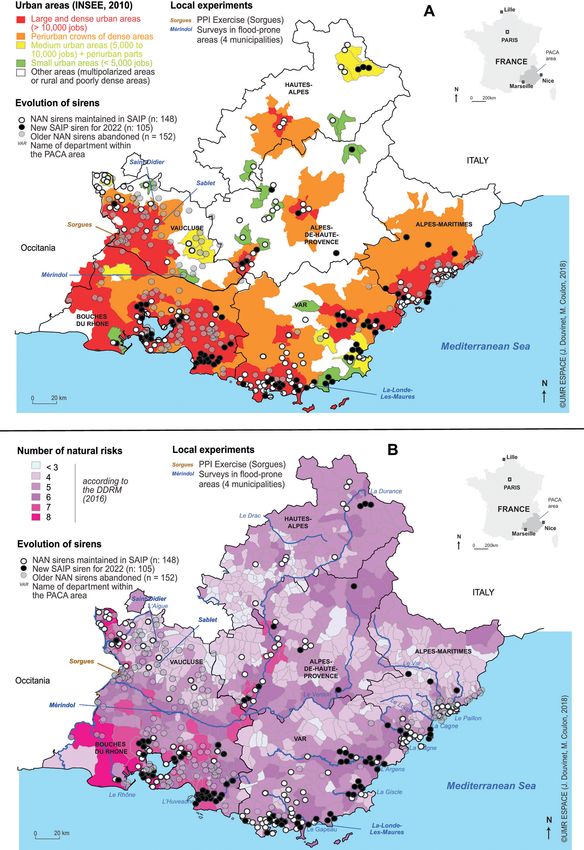
1987; Davis and Venkatesh, 1996). Furthermore, there is a few medium-sized cities appear over-equipped (27 sirens in
commonly a bias between what individuals report and the Mulhouse, 26 in Saint-Étienne, 20 in Colmar, etc.), as well
reality. We have already proven a recurring mismatch (Dou- as several small rural cities (Fig. 3). Among the small mu-
vinet, 2018, 2020) between behavioral duties (what individ- nicipalities equipped, 64 present a population of less than
uals declare they know how to do) and the behaviors actually 500 persons. Three sirens were located in Broye-Aubigney
observed in times of crisis, agreeing with other work con- (Haute-Saône), a village with only 477 inhabitants but ex-
ducted in psychology (Weiss et al., 2011). In addition, this posed to earthquake and flood risk, and at Bricy (Loiret), a
study focused on the spatial location of sirens but fine-scale village with 557 inhabitants, exposed only to flood risk (lo-
studies of responses to siren activation for recent events was cated in Fig. 3). In these villages, the low population would
precluded by ongoing judicial procedures. not normally justify the presence of alert sirens, but the grav-
ity of risks was evidently the basis for locating sirens there. In
contrast, several densely populated cities, for example Lyon
3 Results
(two sirens for 515 685 inhabitants), Bordeaux (one siren for
3.1 Prioritizing densely populated cities a city of 252 040 inhabitants), or Argenteuil (one siren for
110 468 residents), appear to have been inadequately pro-
3.1.1 Spatial inequalities in the current NAN sirens vided with sirens (Fig. 3). Thus, while the NAN spatial cov-
coverage erage was influenced first by population density with a prior-
ity to larger urban areas, this was not the only consideration
The mapping of the 4189 NAN sirens (Fig. 2) showed a accounted for. Other factors influenced the NAN coverage,
strong relationship between the siren location and densely such as proximity to strategic military sites (explaining the
populated cities. 41 % of large, densely urban areas were cov- high number of sirens near Brest and Toulon for example;
ered by at least one siren (1299 municipalities over 3171) Fig. 3), proximity to frontiers (near Germany or Belgium,
Nat. Hazards Earth Syst. Sci., 21, 2899–2920, 2021 https://doi.org/10.5194/nhess-21-2899-2021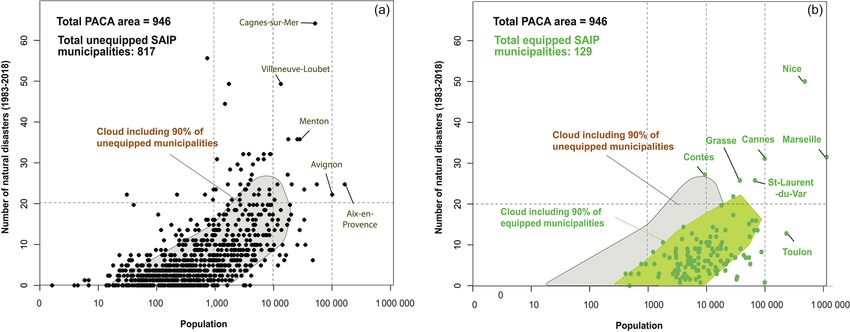
J. Douvinet et al.: Are sirens effective tools to alert the population in France?                                               2905

Figure 2. Distribution of the 4291 sirens of the National Alert Network (NAN) in France related to the urban areas.

with sirens first deployed after World War II), and concen-             Interestingly, the number of residents living in equipped
tration of industrial areas in several valleys (along the Rhine         cities will not significantly decrease: the SAIP sirens will
and the Rhone valleys for example). Locally, or for small               cover 58.54 % of the population, with 254 sirens, against
villages, the existence of sirens is identified as a result of          59.54 % covered with the 304 older NAN sirens. The 101
choices that are not very explicit (Kuligoswki and Dooston,             new SAIP sirens will benefit the two most populated depart-
2018; Matthews and Ellis, 2016).                                        ments in the PACA region: Bouches-du-Rhône (+44) and
                                                                        Var (+40). However, the decreasing number of NAN sirens
3.1.2   Spatial inequalities reinforced in the PACA                     appears important in several outlying urban areas, especially
        region with the new SAIP network                                in the hinterlands of the Marseille and Nice regions and in
                                                                        the Vaucluse region (−58, against +1 new SAIP siren). In
Mapping the spatial evolution induced between the NAN                   this department, the previous NAN network, composed of
sirens (304) and the future SAIP sirens (254) in the PACA               85 sirens (which covered about 386 100 residents within a
region confirms that the relocation of sirens is evolving even          3 km radius), will be replaced by only 27 SAIP sirens, cov-
more in favor of densely populated, large cities. The num-              ering 285 000 residents in the 3 km radius. The grey-colored
ber of sirens decreases in some urban areas, but at the same            circles (Fig. 4) localize the removed NAN sirens that will
time, they have been relocated to even more populated cities            not be incorporated in the SAIP network, and municipalities
(Fig. 4a), around Marseille (+12 sirens), Toulon (+6 sirens),           shall maintain or remove these sirens or recover them on their
Étang-de-Berre (+13 sirens), and Saint-Tropez (+5 sirens).              own behalf, with funding provided from their own resources.

https://doi.org/10.5194/nhess-21-2899-2021                                     Nat. Hazards Earth Syst. Sci., 21, 2899–2920, 2021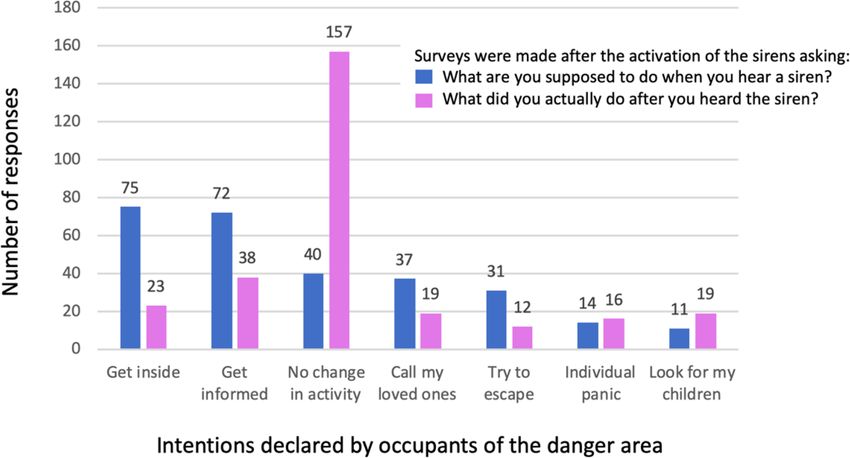
2906                                           J. Douvinet et al.: Are sirens effective tools to alert the population in France?

Figure 3. Number of NAN sirens by municipalities and average number of inhabitants served by each siren.

In addition, the correlation coefficient (Spearman) is higher        the NAN sirens), as well as the number of equipped areas
between the SAIP sirens and the population (ρ = 0.59) than           (82 in the SAIP network against 164 in that of the NAN).
between the NAN sirens and population (ρ = 0.46).                    Many municipalities with five (305 − 22 = 283) or six risks
                                                                     (320 − 33 = 287) are still unequipped. The correlation coef-
3.1.3   Siren location is not related to the number of               ficient between the number of SAIP sirens and the number
        risks, past disasters, or prevention plans                   of risks (ρ = 0.32) remains low and is not really better than
                                                                     those obtained with NAN sirens (ρ = 0.31).
Studying the number of natural risks in equipped or un-                 The weak correlation between the number of recent natu-
equipped municipalities in the PACA region (Fig. 4b) in-             ral disasters (1983–2020) and location of sirens in the PACA
dicates that number of risks or past disasters does not in-          region may have negative consequences for risk manage-
fluence the location of sirens. The contrary could be ex-            ment. Even if equipped areas have an average number of
pected given that the 304 NAN sirens were located by pri-            natural disasters (10.3 over 37 years) higher than for those
ority within municipalities presenting five (103) or six (61)        unequipped (5.12), no significant differences are observed
risks and that several SAIP sirens will cover a further num-         (Fig. 5). The correlation coefficients with the number of
ber of people living in cities characterized by seven natural        SAIP (ρ = 0.32) and NAN (ρ = 0.29) sirens are also lim-
risks (1.04 million people compared to 0.43 with the NAN             ited due to the scattering of values. This trend is similar at
network; Fig. 5). New SAIP sirens will also exist in sev-            national scale with the NAN sirens (ρ = 0.21) but remains
eral cities recently affected by flash floods, along the Argens      unknown for the future SAIP network. Moreover, a relevant
River (+11 sirens; 25 victims, 15 June 2010), and around             correlation between the number of inhabitants and the num-
Cannes (affected by two flash floods; 20 victims, 3 October          ber of natural disasters exists (ρ = 0.67 in the PACA region
2015; 7 victims, 23 November 2019) for example. However,             and ρ = 0.78 in France), as well as a relation between dam-
the increasing number of covered populations in municipali-          age and the creation of risk prevention plans (Vinet, 2010)
ties presenting seven risks (+0.59 million people with SAIP)         or with the Municipal Response Plan (Pottier et al., 2004).
and eight risks (+0.20 million people) is mainly due to the          Thus, the statistical correlations between risk parameters are
fact that new sirens will be planned in highly populated ar-         not related to the location of sirens. This trend is reinforced
eas. While 38 NAN sirens covered 0.43 million people, the            by a recent study in the Vaucluse department, which showed
future SAIP system will only exist in 18 cities, including 15        that 100 % of small basins (of less than 5 km2 ) sensitive to
cities with more than 20 000 inhabitants (Fig. 5). The cov-          flash floods were excluded in the 3 km radius of sirens (Dou-
ered population in municipalities where five or six risks exist      vinet, 2020).
decreases (1.43 million people with SAIP against 1.98 with

Nat. Hazards Earth Syst. Sci., 21, 2899–2920, 2021                                   https://doi.org/10.5194/nhess-21-2899-2021
J. Douvinet et al.: Are sirens effective tools to alert the population in France? 2907 Figure 4. Evolution between the NAN and SAIP networks in the PACA region (Provence–Alpes–Côte d’Azur), related to (a) the urban typology and (b) the number of natural risks indicated by the French Ministry of Environment. https://doi.org/10.5194/nhess-21-2899-2021 Nat. Hazards Earth Syst. Sci., 21, 2899–2920, 2021
2908 J. Douvinet et al.: Are sirens effective tools to alert the population in France?
Figure 5. Covered municipalities and number of risks for the NAN (a) and the SAIP (b) sirens, according to the DDRM (2016) in the PACA
region.
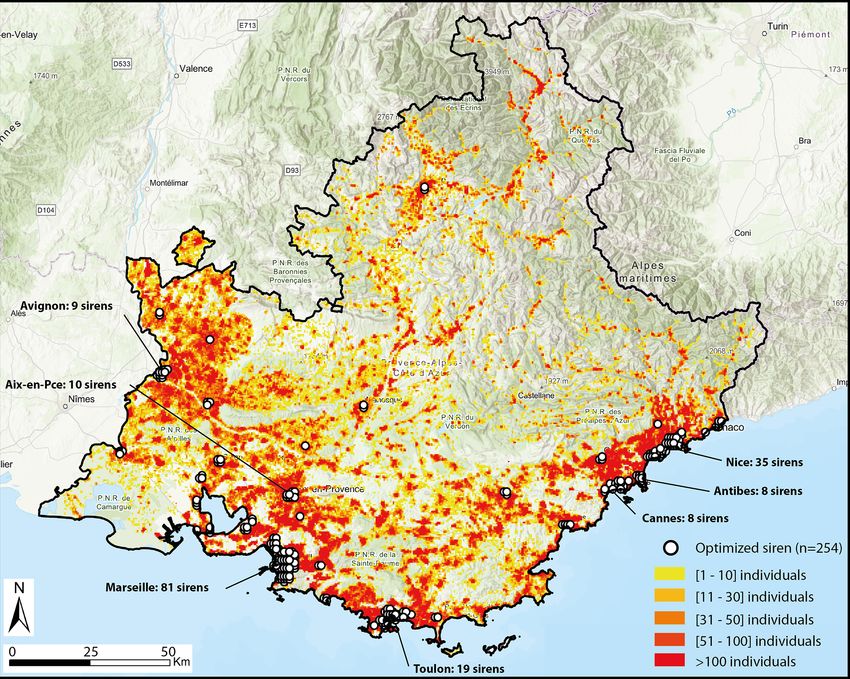
3.1.4 Relocating sirens to optimize their efficiency? (35 sirens), Toulon (19 sirens), Aix-en-Provence (10 sirens),
Avignon (9 sirens), Cannes (8 sirens), and Antibes (8 sirens)
Regarding the spatial location of the sirens, we developed an (Fig. 7). However, this option makes the siren placement ex-
alternative placement strategy for sirens to cover the maxi- clusively urban, thereby ignoring less densely populated ar-
mum population at a communal scale. With GIS tools, we eas that are also exposed to risks. So authorities would have
created a regular grid in which each square has a length a more complicated choice to make.
and width of 1060 m; i.e., it is circumscribed within a cir-
cle of an audible radius of r = 1413 m. We counted the num- 3.1.5 Lower rates of coverage at finer scales
ber of individuals in each square and selected the 254 most
densely populated squares in the PACA region (correspond- Estimating the number of people living in the 1.4 km opti-
ing to the number of future SAIP sirens planned). With this mized radius around sirens showed additional “holes in the
method, 47.88 % of the population would be alerted in the racket” because coverage rates are lower than the first esti-
South PACA region, 9.69 % more than with the current lo- mates. In the PACA region, the older NAN sirens covered
cation of the SAIP sirens. Another option would be to have 32.4 % of residents in the 1.4 km radius (whereas 58.54 % of
1000 sirens distributed over the highest density urban areas. the population lived in equipped cities), and this estimation
In that case 74.53 % of the population could be alerted. How- increases to 38.2 % with SAIP sirens (while 59.54 % of the
ever, this option would accentuate the location of the sirens in population is living in equipped cities). We calculated cover-
densely populated cities such as Marseille (81 sirens), Nice age values for 1 km (24.6 % of residents), 2 km (40.5 %), and
Nat. Hazards Earth Syst. Sci., 21, 2899–2920, 2021 https://doi.org/10.5194/nhess-21-2899-2021J. Douvinet et al.: Are sirens effective tools to alert the population in France? 2909
Figure 6. The number of times that CatNat post-disaster funds have been granted to cities of the PACA region, equipped (b) and un-
equipped (a) with SAIP sirens, ordered by the population log size.
3 km (48.5 %) buffers. Thus, the statistic “number of people sion that the practitioners can have during the crisis. Ear-
living in equipped cities” overestimated the real siren cover- lier in the morning, at 02:40 CET, a violent fire was reported
age. In addition, more than 3.1 million inhabitants cannot be on the site, and a crisis center was quickly put in place (at
alerted by SAIP sirens in the PACA region, and the average 03:30 CET). The prefect of Seine-Maritime informed peo-
coverage rate for the equipped municipalities is 58.1 %. The ple of the situation on social networks (at 04:50 CET) and
first quartile is 29.8 %, the third 83.8 %, and only two mu- through press releases (06:15 and 06:45 CET). But two sirens
nicipalities have 100 % of their population included in this located less than 500 m around the site were not activated
1.4 km optimized radius (with respectively 428 and 5766 in- until 07:45 CET, more than 5 h after the accident began. As
habitants) out of the 129 equipped cities. Then, if we trans- explained by the prefect, the delay resulted from (1) fear of
late these figures differently, this means that a quarter of the creating a panic reaction if the sirens had sounded during the
cities equipped with SAIP sirens can alert less than 30 % of middle of the night; and (2) fear of having to manage an an-
the resident population. The strong spatial inequality is sup- archic evacuation when the issue was to avoid the slightest
ported by the Gini index of the rates of individuals covered, congestion on the road network to facilitate access for rescue
equal to 0.87. Moreover, the Moran autocorrelation index is and emergency services. Sirens were then activated to sup-
0.22, which means that the number of individuals covered port containment instructions (to be sent out previously by
by sirens tends to be close between neighboring sites. This press briefing). However, sirens were not intended to reveal
inequality becomes all the more significant when we clas- the fire that had already been identified and communicated
sify the municipalities according to the type of urban area to by the authorities, and such a point of view is currently ob-
which they belong. Only 6.9 % of people living in communes served in the other operational reports analyzed. The siren’s
outside urban areas can be alerted, whereas 46.8 % of people activation indicates to the population that the situation has
living in small urban areas, with less than 50 000 inhabitants, been taken into account by the authorities but is not used
can be alerted. The difference equals 39.9 %, and this is due as a means of alert (similar to their role during the Cannes
to the greater sprawl of housing and the scale effect played flash flood in 2015). The “fear of panic” was already put for-
by the size of the dispersed cities. ward in discourses on the non-use of sirens (Vogel, 2017).
However, researchers have discredited this “myth” for many
3.2 Activating sirens: the political dilemma years (Sorensen, 2000), pointing out that in the face of dan-
ger, mutual aid and the search for proximity to familiar peo-
3.2.1 The industrial accident in Lubrizol (2019): an ple and places predominate rather than chaotic and unreason-
iconic example able movements (Liu et al., 2015).
This accident occurred on 26 September 2019 in the Lu- 3.2.2 An activation only justified by political decisions
brizol site (near Rouen, Fig. 1), and it is the most recent
event that has led to several public reports in 2020 (Bonfanti- A second problem, recurring in the reports and question-
Dossat and Bonnefoy, 2020). But this first revealed the vi- naires (S1), is that actors involved in issuing sirens have had
https://doi.org/10.5194/nhess-21-2899-2021 Nat. Hazards Earth Syst. Sci., 21, 2899–2920, 20212910 J. Douvinet et al.: Are sirens effective tools to alert the population in France? Figure 7. Relocation of the sirens in the PACA region taking into account the most densely populated cities (the current location of the 254 SAIP sirens can be viewed in Fig. 4). DEM layer (public data) was only reused as the background map. the same reference systems for decades (Courteaux, 2019). “technological fetishism” for sirens led to the abandonment We could expect that the siren activation is influenced by the in 2018 of the so-called SAIP mobile application, set up by national context or crises that have occurred in the past, in the the French Ministry of the Interior in 2016. While similar last months and also in the last years, which may contribute mobile phone applications have been successfully employed to either the transformation or the improvement of the na- in other countries, its performance in France was disappoint- tional alerting system. But the siren activation is still vertical, ing. For example, it was not activated during terrorist at- “top-down” marked, and although a longitudinal approach tacks in Nice in July 2016 nor in Saint-Étienne-du-Rouvray is challenging, the pyramid approach remains predominant. in 2017, though it was activated for a false alert in the Louvre During the reported flash floods, no sirens were activated in Paris. Other technical devices exist and are well suited to due to lack of anticipation (2003, 2008, 2010, 2015) or lack end users, for example “kidnap alert” (inspired by the amber of electricity (2018, 2019) despite the existence of several alert system set up in the USA in 1996) or motorway warning sirens in areas impacted by the flash floods. No lessons were systems that combine technical and social dimensions. The learned from the past. Moreover, the procedure itself is not technical references prevent any organizational change. In- “apolitical”: the French government advocates for sirens to deed, one may wonder about the efficiency of sirens in com- justify the funding allocated to them (Matveeva, 2006), and parison to a system that could send thousands of messages they present them as a “good tool (We did the best we could)”, in a few seconds, if sirens are not adapted to the kinetics of while they were only used three times since the beginning the event or if they are not understood by those who receive of the 2000s (during a fire in 2014; a flood in 2017; an in- the alert, or if it takes hours for the authorities to make the dustrial accident in 2019). Second, what might be termed a decision to send the alert. France has made a bold choice, but Nat. Hazards Earth Syst. Sci., 21, 2899–2920, 2021 https://doi.org/10.5194/nhess-21-2899-2021
Table 2. Overview of equipped and unequipped municipalities and populations living in equipped areas by the 3171 National Alert Network (NAN) sirens in France in 2010 in relation
to different urban density areas (INSEE, 2014).
Urban typology (INSEE) Municipalities The NAN siren coverage Municipal population
Total in NAN equipped NAN equipped Total in Average number of Total People covered People covered
France (n) (n) (%) France (n) sirens per municipality (in millions) (in millions) (%)
Large, densely urban areasa 3171 1299 41.0 % 2461 1.89 37.7 29.1 77.3 %
Peri-urban areas around major citiesb 15 519 644 4.1 % 968 1.50 15.8 2.3 14.7 %
Medium urban area + peri-urban partsc 1181 151 12.8 % 219 1.45 2.1 1.2 54.4 %
Small urban areasd 7990 373 4.7 % 453 1.21 5.9 1.2 20.4 %
Rural arease 6980 100 1.4 % 118 1.18 2.9 0.1 4.0 %
Total 34 842 2568 7.4 % 4189 1.55 64.5 33.9 52.6 %
https://doi.org/10.5194/nhess-21-2899-2021
a A group of municipalities, in a single block, consisting of an urban unit center with more than 10 000 jobs. b Peri-urban municipalities in which at least 40 % of the employed residents work in large and densely urban areas. c Urban units
with 5000 to 10 000 jobs and rural urban areas in which at least 40 % of the residents with a job work in urban areas. d A group of municipalities, in a single block, consisting of urban units with 1500 to 5000 jobs, or rural areas where at least
40 % of the residents work in urban areas. e Municipalities outside urban areas.
Table 3. Overview of the rate of SAIP- and NAN-equipped municipalities and populations living in equipped areas by the 254 future SAIP sirens in the PACA region in relation to
different urban density areas (INSEE, 2014).
J. Douvinet et al.: Are sirens effective tools to alert the population in France?
Urban typology (INSEE) Municipalities The SAIP siren coverage Municipal population
Total in SAIP equipped SAIP equipped Total in Average number of Total in PACA People covered People covered
PACA region (n) (n) (%) PACA region (n) sirens per municipality (in millions) (in millions) (%)
Large and densely urban areasa 220 71 32.3 % 174 2.45 4.028 2.641 65.6 %
Peri-urban crowns of densely areasb 296 22 7.4 % 24 1.09 0.541 0.109 20.2 %
Medium urban area + peri-urban partsc 31 8 25.8 % 17 2.13 0.109 0.067 61.7 %
Small urban areasd 38 12 31.6 % 20 1.67 0.122 0.075 62.2 %
Rural arease 361 16 4.4 % 19 1.19 0.220 0.033 15.2 %
Total 946 129 13.6 % 254 1.97 5.021 2.927 58.3 %
a A group of municipalities, in a single block, consisting of an urban unit center with more than 10 000 jobs. b Peri-urban municipalities in which at least 40 % of the employed residents work in large and densely urban areas. c Urban units with 5000 to
10 000 jobs and rural urban areas in which at least 40 % of the residents with a job work in urban areas. d A group of municipalities, in a single block, consisting of urban units with 1500 to 5000 jobs, or rural areas where at least 40 % of the residents work in
urban areas. e Municipalities outside urban areas.
Nat. Hazards Earth Syst. Sci., 21, 2899–2920, 2021
29112912 J. Douvinet et al.: Are sirens effective tools to alert the population in France?
the resulting choice, based on control-and-hierarchical com- is no significant difference according to the age of partici-
mand, can be questioned in terms of its real capacity to alert pants (P = 0.077), the urban area to which their residence
communities in good time. belongs (P = 0.794), or the individual’s experience facing
disasters (P = 0.921). However, the siren is rated better by
3.2.3 Where sirens exist, authorities also prefer not to individuals belonging to a lower socio-professional cate-
use them gory (SPC) than individuals belonging to a higher socio-
professional category (P = 0.031). Above all, compared to
In addition, in the sample S1, 7 of 11 authorities respond- other means of alerting, the siren remains significantly more
ing to our interview assumed that one of the objectives of accepted, undoubtedly attributable in part to monthly testing.
sirens is only to warn the greatest number of people in the Respondents did not know that only 18 % of cities in France
area threatened by danger or risk so that the population can are equipped with sirens and that many NAN sirens are dis-
be aware of probable impacts. For them, sirens should pro- appearing.
voke the population to seek information in the case of fires,
floods, or bombing. Of the 11 authorities responding to our 3.3.2 Lack of reactions during real siren alert
questions, seven highlighted the importance of prior expe-
rience and feedback to know corrective measures to be im- The last sample (S3) conducted in Sorgues (see location in
plemented and to check coordination among the actors in- Fig. 4) also reveals the difficulty that people have in the case
volved even if this means establishing synergies (by creat- of real siren alert. A total of 72 persons (out of 280) de-
ing “gateways” for example). But six respondents observed clared that they would inform themselves in the situation of
that lessons learned from past events have not been suffi- an alert, 75 reported that they would get inside a building,
ciently shared. Other respondents said that tools should not 37 said they would call their relatives, and 40 do no change
be differentiated according to hazards or the social condi- their activity. However, during the real activation of sirens,
tions, highlighting that sirens would likely be better under- while they heard the sound, most (157) continued their activ-
stood by elderly individuals than social media without evi- ities at the time of the signal (Fig. 9). Only 23 attempted to
dence for whether this would actually be the case. Discus- enquire about why the alert had activated, 38 got informed,
sions with these actors who had actually activated sirens in 16 panicked, and 12 tried to escape without knowing why.
recent years highlight two contradictions in the current pro- These results reveal that behavior is clearly out of step with
cedure: (1) “we activate the alarm to comply with the reg- declarations (Vinet, 2010; Weiss et al., 2011; Gisclard et al.,
ulatory framework, knowing that the sirens will have a lim- 2017; Douvinet, 2020). People face difficulties in making
ited range”. In other words, this strategy is comfortable for decisions in real time, like picking up their children from
authorities who “cover up” to avoid problems later on (dur- school or not or driving (Créton-Cazanave, 2010; Ruin et al.,
ing post-event investigations in particular); (2) “the difficulty 2007; Kuligowski et al., 2014). The question could be asked
is that it is necessary to alert locally with available means, whether it is useful to add an anxiety signal at a time when
while benefiting from a robust architecture at the national individuals are already stressed. Thus, assessing the utility of
level”. Thus, the SAIP network is a positively perceived so- sirens in such cases requires a good knowledge of the nature
lution, while sirens do not exist everywhere. and urgency of the danger, which is not always predictable
(as with terrorist attacks or industrial accidents), and these
3.3 The dichotomy between trust in sirens and reaction limitations will persist with the future SAIP system.
during siren alert
3.3.1 A blind confidence in sirens 4 Discussion and conclusions
The second sample (S2), using an online questionnaire The study of spatial, political, and social aspects related
(2019), allowed us to evaluate the population’s trust in sirens to the siren network to alert the population in the case of
in comparison with other dissemination tools, like cell broad- an emergency shows several challenges that need to be ad-
cast or location-based SMS (CBC/LB-SMS). Sirens remain dressed to increase their real efficiency. Results show that
the most trusted tools for the 891 respondents (Fig. 8), the distribution of sirens in France is related to the popula-
whereas just after violent events, they declared that they tion density, not to the number of hazards or past disasters
do not understand the usefulness of such tools. The siren that have impacted a region. Furthermore, not all the popu-
scored the highest average (8.00/10) ahead of a CBC/LB- lation is covered by the sirens. In France only 7.4 % of cities
SMS solution (7.80/10), the automatic telephone call system were equipped with sirens from the old NAN (National Alert
(7.78/10), door-to-door (7.17/10), and the smartphone mo- Network) system, and, in the PACA region in particular, only
bile application (6.69/10). Scores are homogeneous as the 38.2 % of residents are living in the 1.4 km radius around
Gini index (GI) equals 0.15/1. In addition, social-territorial sirens from the new SAIP (Population Alert and Informa-
factors are not decisive in the notes given to the siren. There tion System). Where sirens exist, they are rarely used either
Nat. Hazards Earth Syst. Sci., 21, 2899–2920, 2021 https://doi.org/10.5194/nhess-21-2899-2021J. Douvinet et al.: Are sirens effective tools to alert the population in France? 2913 Figure 8. Average level of trust expressed by respondents for different means of communicating alerts. Figure 9. Differences between the people’s knowledge of safety measures (in blue) and their real behavior (pink) after hearing sirens during an emergency exercise in Sorgues (Vaucluse). https://doi.org/10.5194/nhess-21-2899-2021 Nat. Hazards Earth Syst. Sci., 21, 2899–2920, 2021
2914                                          J. Douvinet et al.: Are sirens effective tools to alert the population in France?

due to the lack of reaction time during sudden events or the       not to activate alerts, in part because they have misgivings
reluctance of the authorities to activate them to avoid chaotic    about the likely behavior of the alerted population, whereas
reactions from the population or liability issues in the case of   with better population education and training in response, the
a false alarm. Sirens have only been used three times since        sirens could have a real utility.
2000 (and six times since 1954) in all of France, leading             It would also be logical to create a single platform to im-
some to question the budgets allocated (more than EUR 50           prove the coordination between different services with their
million were allocated for the SAIP in 2010). Nonetheless,         unique competencies but without multiplying the number
citizens, accustomed to hearing the siren test on the first        of services and of actors involved in issuing alerts, oper-
Wednesday of every month, express marginally greater confi-        ating differently and separately. At present, CENALT (Na-
dence in sirens as a tool to alert the population over other op-   tional Tsunami Warning Center) issues tsunami forecasts, the
tions such as smart-phone applications. However, the lack of       CSEM (Euro-Mediterranean Seismological Center) monitors
a specific message linked to the sound of the siren can create     earthquakes, and the SCHAPI (Central Service of Hydrom-
confusion and unpredictability in the behavior of residents        eteorology and Flood Forecasting) is responsible for flood
during an emergency, and our research demonstrates that in         warning and vigilance. Several emergency call centers are in-
the case of a real crisis, very few people react when they         creasingly shared, like those centralizing the 15, 17, and 18
hear it. In light of these limitations, we recommend changes       calls within greater Paris. Therefore, we suggest going much
(technical, organizational, and cognitive) in the implementa-      further in this inter-service logic and promulgating the sin-
tion of the new SAIP siren system, expected in June 2022           gle 112 call number at the European scale (currently being
across France.                                                     debated in the National Assembly).
   The sound of sirens should be complemented with a clear            Finally, citizens should be better informed about the dif-
unified message so that members of the population under-           ferent alert tools available and their expected behavior in the
stand the expected behavior (Reed et al., 2010; Cvetkovića        case of an emergency. Year-long population education, not
et al., 2019; Cain et al., 2021). The December 2018 directive      only just before an emergency, is a critical last step to in-
establishing the European Electronic Communications Code           crease the effectiveness of the current siren system in France.
requires member states to establish a national SMS alerting        But populations are rarely trained or involved during safety
system by June 2022 (Vogel, 2017; Bopp et al., 2021). Coun-        and security exercises. To conclude, there are serious tech-
tries such as Italy, Norway, Germany, and Romania are using        nical, organizational, and cognitive problems related to the
the Common Alerting Protocol (CAP) to increase the alert           efficiency of the current siren system in France. However,
effectiveness as the protocol allows an alert message to be        the implementation of the new SAIP system in 2022 has cre-
consistently disseminated simultaneously over many warn-           ated a momentum to tackle these challenges and improve the
ing systems to many applications, such as cell phone broad-        efficiency of this alerting tool.
cast (Bean et al., 2016; Landewr et al., 2016; Leo et al., 2015;
Mileti and Sorensen, 1990; Vinet et al., 2011). This can al-
low the integration of sirens with other tools. This path is
promising, but at the time of writing, it is unclear whether
France will adopt the CAP.
   However, for France to be able to use CAP, authorities in
charge of activating the sirens’ alert and the hazard forecast
community need to work together (Fajardo and Oppus, 2009;
Huang et al., 2010). An organizational change is then needed
to make this happen. The current services in charge of fore-
casting hazards do not alert people in France (whereas it is
the case in Australia, Belgium, and the USA; Bopp et al.,
2021). The delay of siren activation depends on the risks in-
volved but also on the detection period for the hazards, the
availability of tools, and the time before the first impacts
on threatened people (Péroche, 2016). Schematically, earth-
quakes require automated systems since the alerting time is
limited to a few seconds, or even a few hundredths of a sec-
ond, whereas tornadoes or flash floods occur in a few min-
utes or hours. When the latter are forecast, various services
can anticipate the event, and it would be appropriate to acti-
vate the alert from the moment the triggering thresholds are
exceeded. This solution should give time for protective mea-
sures to be implemented, but currently, the authorities prefer

Nat. Hazards Earth Syst. Sci., 21, 2899–2920, 2021                                https://doi.org/10.5194/nhess-21-2899-2021
You can also read