Spatio-temporal genetic tagging of a cosmopolitan planktivorous shark provides insight to gene flow, temporal variation and site-specific re...
←
→
Page content transcription
If your browser does not render page correctly, please read the page content below
Spatio-temporal genetic tagging of a cosmopolitan planktivorous shark
provides insight to gene flow, temporal variation and site-specific re-
encounters
Lieber, L., Hall, G., Hall, J., Berrow, S., Johnston, E., Gubili, C., Sarginson, J., Francis, M., Duffy, C., Wintner, S.
P., Doherty, P. D., Godley, B. J., Hawkes, L. A., Witt, M. J., Henderson, S. M., de Sabata, E., Shivji, M. S.,
Dawson, D. A., Sims, D. W., ... Noble, L. R. (2020). Spatio-temporal genetic tagging of a cosmopolitan
planktivorous shark provides insight to gene flow, temporal variation and site-specific re-encounters. Scientific
Reports, 10, [1661]. https://doi.org/10.1038/s41598-020-58086-4
Published in:
Scientific Reports

Document Version:
Publisher's PDF, also known as Version of record

Queen's University Belfast - Research Portal:
Link to publication record in Queen's University Belfast Research Portal

Publisher rights
Copyright 2020 the authors.
This is an open access article published under a Creative Commons Attribution License (https://creativecommons.org/licenses/by/4.0/),
which permits unrestricted use, distribution and reproduction in any medium, provided the author and source are cited.

General rights
Copyright for the publications made accessible via the Queen's University Belfast Research Portal is retained by the author(s) and / or other
copyright owners and it is a condition of accessing these publications that users recognise and abide by the legal requirements associated
with these rights.

Take down policy
The Research Portal is Queen's institutional repository that provides access to Queen's research output. Every effort has been made to
ensure that content in the Research Portal does not infringe any person's rights, or applicable UK laws. If you discover content in the
Research Portal that you believe breaches copyright or violates any law, please contact openaccess@qub.ac.uk.

Download date:09. Oct. 2021
www.nature.com/scientificreports

            OPEN           Spatio-temporal genetic tagging
                           of a cosmopolitan planktivorous
                           shark provides insight to gene flow,
                           temporal variation and site-specific
                           re-encounters
                           Lilian Lieber1,20, Graham Hall2, Jackie Hall2, Simon Berrow 3,4, Emmett Johnston3,5,
                           Chrysoula Gubili 1,6, Jane Sarginson1,19, Malcolm Francis 7, Clinton Duffy 8,
                           Sabine P. Wintner 9,10, Philip D. Doherty11,12, Brendan J. Godley11,12, Lucy A. Hawkes 11,
                           Matthew J. Witt 11,12, Suzanne M. Henderson13, Eleonora de Sabata14, Mahmood S. Shivji15,
                           Deborah A. Dawson16, David W. Sims 17,18, Catherine S. Jones1,22 & Leslie R. Noble1,21,22*
                           Migratory movements in response to seasonal resources often influence population structure and
                           dynamics. Yet in mobile marine predators, population genetic consequences of such repetitious
                           behaviour remain inaccessible without comprehensive sampling strategies. Temporal genetic sampling
                           of seasonally recurring aggregations of planktivorous basking sharks, Cetorhinus maximus, in the
                           Northeast Atlantic (NEA) affords an opportunity to resolve individual re-encounters at key sites with
                           population connectivity and patterns of relatedness. Genetic tagging (19 microsatellites) revealed 18%
                           of re-sampled individuals in the NEA demonstrated inter/multi-annual site-specific re-encounters. High
                           genetic connectivity and migration between aggregation sites indicate the Irish Sea as an important
                           movement corridor, with a contemporary effective population estimate (Ne) of 382 (CI = 241–830).
                           We contrast the prevailing view of high gene flow across oceanic regions with evidence of population
                           structure within the NEA, with early-season sharks off southwest Ireland possibly representing
                           genetically distinct migrants. Finally, we found basking sharks surfacing together in the NEA are on

                           1
                            School of Biological Sciences, University of Aberdeen, Zoology Building, Tillydrone Avenue, Aberdeen, AB24 2TZ,
                           Scotland, UK. 2Manx Basking Shark Watch and Manx Wildlife Trust, Peel, Isle of Man, IM9 5PJ, UK. 3Irish Basking
                           Shark Study Group, Merchants Quay, Kilrush, County Clare, UK. 4Marine and Freshwater Research Centre, Galway-
                           Mayo Institute of Technology, Dublin Road, Galway, Ireland. 5School of Biological Sciences, Queen´s University
                           Belfast, Belfast, Northern Ireland, UK. 6Hellenic Agricultural Organisation, Fisheries Research Institute, Nea
                           Peramos, Kavala, Macedonia, 64007, Greece. 7National Institute of Water and Atmospheric Research, Private
                           Bag 14901, Kilbirnie, Wellington, 6241, New Zealand. 8Department of Conservation, Private Bag 68908, Wellesley
                           Street, Auckland 1141, New Zealand. 9KwaZulu-Natal Sharks Board, Private Bag 2, Umhlanga Rocks, 4320, South
                           Africa. 10School of Life Sciences, University of KwaZulu-Natal, Durban, 4000, South Africa. 11Centre for Ecology
                           and Conservation, University of Exeter, Cornwall Campus, Penryn, TR10 9FE, UK. 12Environment and Sustainability
                           Institute, University of Exeter, Cornwall Campus, Penryn, TR10 9FE, UK. 13Scottish Natural Heritage Great Glen
                           House, Inverness, IV3 8NW, Scotland, UK. 14MedSharks, via Ruggero Fauro 82, 00197, Rome, Italy. 15Save Our Seas
                           Shark Research Center and Guy Harvey Research Institute, Nova Southeastern University, 8000 North Ocean Drive,
                           Dania Beach, FL, 33004, USA. 16NERC Biomolecular Analysis Facility, Department of Animal and Plant Sciences,
                           University of Sheffield, Sheffield, S10 2TN, South Yorkshire, UK. 17Marine Biological Association of the United
                           Kingdom, The Laboratory, Citadel Hill, Plymouth, PL1 2PB, UK. 18Ocean and Earth Science, National Oceanography
                           Centre Southampton, University of Southampton, Waterfront Campus, Southampton, SO14 3ZH, UK. 19Faculty of
                           Science and Engineering, John Dalton Building, Manchester Metropolitan University, Chester Street, Manchester,
                           M1 5GD, UK. 20School of Chemistry and Chemical Engineering, Queen´s University Belfast, Marine Laboratory,
                           Portaferry, BT22 1PF, Northern Ireland, UK. 21Faculty of Biosciences and Aquaculture, Nord University, Postboks
                           1490, 8049, Bodø, Norway. 22These authors jointly supervised this work: Catherine S. Jones and Leslie R. Noble.
                           *email: leslie.r.noble@nord.no

Scientific Reports |   (2020) 10:1661 | https://doi.org/10.1038/s41598-020-58086-4                                                       1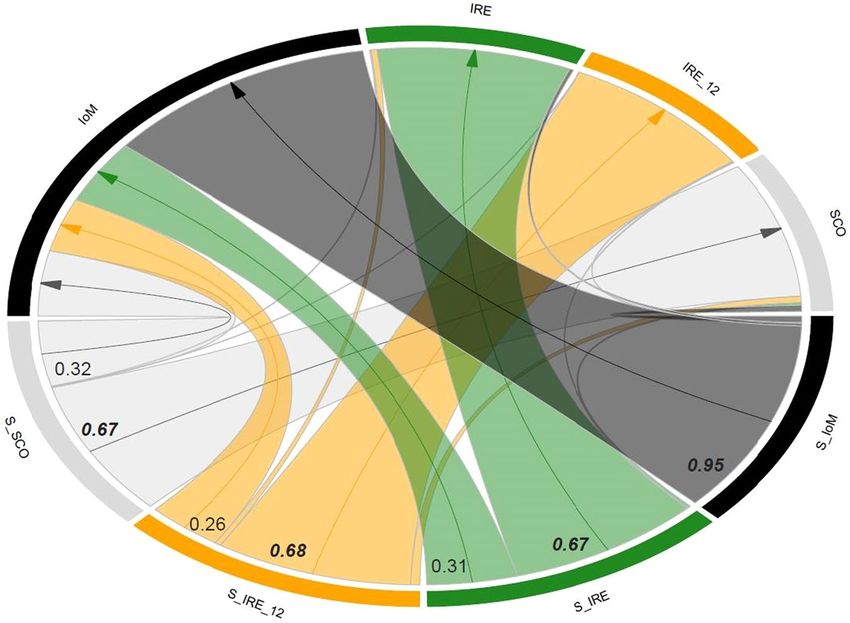
www.nature.com/scientificreports/                                                               www.nature.com/scientificreports

                           average more related than expected by chance, suggesting a genetic consequence of, or a potential
                           mechanism maintaining, site-specific re-encounters. Long-term temporal genetic monitoring is
                           paramount in determining future viability of cosmopolitan marine species, identifying genetic units for
                           conservation management, and for understanding aggregation structure and dynamics.

                           The movement and spatio-temporal patterns of large, mobile marine predators can be highly dynamic with fre-
                           quent, ocean-scale movements prevalent among cetaceans, seabirds, turtles, teleost fish, and sharks1. Gaining
                           insight into repeated long-distance movement, its drivers and evolutionary consequences, is fundamental to
                           understanding the ecology of these species. It is also central in evaluating current environmental concerns during
                           an era of rapid climate change and extensive marine habitat modification, to inform the management and design
                           of effective networks of marine protected areas (MPAs).
                               Chondrichthyan (sharks, skates, chimaeras) extinction risk is substantially higher than for most other ver-
                           tebrates, particularly for large–bodied sharks frequenting coastal waters2. The filter-feeding basking shark,
                           Cetorhinus maximus, and the whale shark, Rhincodon typus, are the world’s largest fish. Their horizontal move-
                           ment is primarily driven by zooplankton dynamics and typically exceeds thousands of kilometres, precluding
                           knowledge of natal origins and the potential existence of mating and breeding areas for either of these plank-
                           tivores3,4. Identifying recurring spatial patterns, such as seasonal migration between distinct habitats or behav-
                           ioural fidelity to ecologically important sites (feeding, breeding or mating areas) therefore remains a challenge.
                               While site fidelity, returning to an area over time, has been noted in more than 30 elasmobranch species5,
                           only a few telemetry studies have achieved multi-year tracks to detect migratory behaviour6. Migration, typi-
                           cally defined as the more persistent, seasonal movement of animals from one place to another, is often driven by
                           transitory availability of resources7 and may play an especially important role in shaping the spatial ecology of
                           planktivores given their dependence on such highly heterogeneous prey distributions.
                               The basking shark is circumglobally distributed in temperate seas, but the western European shelf provides
                           key habitats supporting relatively predictable, seasonal coastal aggregations between April and September off
                           Southwest England, Ireland, Northwest Scotland and the Isle of Man (Irish Sea)8–11. There is some evidence
                           of courtship within aggregations11, but general timing and areas for breeding or pupping have yet to be deter-
                           mined, with the possibility that these life history events are less structured in time and space compared with other
                           sharks12. Basking sharks forage selectively on zooplankton13, and within the Northeast Atlantic (NEA) generally
                           use deeper waters near shelf edges during winter, forming surface/temporal aggregations in shallower coastal
                           waters during summer14.
                               In addition to extensive basking shark movement across the European shelf, there is evidence for ocean-scale
                           transits, both trans-Atlantic15 and trans-equatorial16. Increasingly, satellite telemetry suggests that these latitudi-
                           nal, long-range movements are less likely to be random (i.e. dispersal), but instead represent seasonal movement
                           patterns, characteristic of migration14,17. In the NEA, most documented return migrations are to the general
                           vicinity of the Exclusive Economic Zone (EEZ) of UK and Irish waters17, with two tagged sharks returning to
                           within 30 km of the previous centre of activity, within the area encompassing a proposed Scottish MPA18. As
                           an adaptation to the seasonal, temperate habitat of the NEA, basking sharks may exhibit seasonal migration
                           patterns where inter-annual site-fidelity to aggregation sites with elevated zooplankton densities17,19 (‘hotspots’
                           hereafter) could have genetic consequences, such as spatial patterning in genetic connectivity. Investigating the
                           existence, extent and persistence of such patterns is fundamental to understanding the consequences of migratory
                           behaviour.
                               Contrasting with the temporary attachment of satellite tags, the permanence of genetic identity enables life-
                           long “tracking” of individuals, resampling of which can indicate site fidelity20. Through repeated genetic sampling
                           of basking sharks at key sites, questions pertaining to multiannual site fidelity and genetic connectivity can be
                           addressed in the context of species management measures, such as assessing the spatial adequacy of MPAs.
                               While temporary aggregations may constitute an appreciable proportion of a NEA population, it has not been
                           established if they represent genetically distinct management units, or a random genetic assemblage of a wider,
                           global population, spatially drawn together by prey availability. Nonetheless, the prevailing perspective is that
                           basking sharks lack global population structure and display low worldwide genetic variability21. However, this
                           earlier study was limited by a small number of opportunistic samples and the use of a single, maternally-inherited
                           genetic marker (mtDNA). In contrast, the use of bi-parentally inherited markers, such as microsatellites, allows
                           a more contemporary genetic assessment of connectivity and population structure. Although evaluating demo-
                           graphic independence among marine populations using genetic markers remains challenging22, it can assist in
                           the identification of conservation management units23. With analyses of genetic structure influenced by marker
                           properties, models of mutation, selection and sample size, finding a lack of structure can seldom be regarded as
                           definitive24. For instance, in the whale shark, the assumption of global panmixia using mtDNA was revised when
                           microsatellite markers indicated genetic differentiation between Indo-Pacific and Atlantic populations25.
                               Further, genetic monitoring can identify temporal changes in population genetic metrics affecting population
                           viability26, including effective population size (Ne), the number of breeding individuals within a population; an
                           evolutionary analogue of adult census size27. This parameter complements abundance estimates and is critical for
                           informed long-term conservation management. Formerly extensively harvested as a commercial species, basking
                           sharks are classified as ‘Endangered globally’28 (IUCN 2018). In spite of these concerns, no long-term regional
                           population abundance estimates are available in the NEA due to the low number of re-sightings. In an attempt
                           to estimate local abundance through mark-recapture in the NEA, a closed population model (assuming demo-
                           graphic closure) was applied previously, generating an estimate of 985 sharks in a 50 km diameter study area29.

Scientific Reports |   (2020) 10:1661 | https://doi.org/10.1038/s41598-020-58086-4                                                              2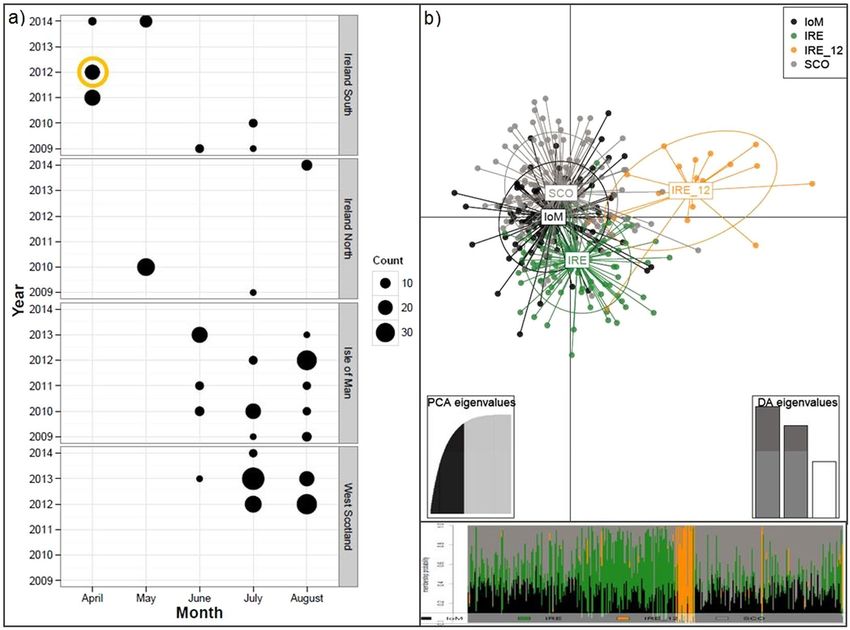
www.nature.com/scientificreports/                                                                www.nature.com/scientificreports

                                                                         Date         # mismatching   Interval   Distance
                            Re-encounter Site     Sample ID   Sex        sampled      loci            (days)     (km)
                                         IoM      IoM09_01    Male       07.08.2009   0               323        4.5
                            1
                                         IoM      IoM10_03    Male       26.06.2010
                                         IoM      IoM09_06    Female     09.08.2009   0               1395       18.2
                            2
                                         IoM      IoM13_02    Unknown    04.06.2013
                                         IoM      IoM11_09    Male       03.08.2011   2               358        2.4
                            3
                                         IoM      IoM12_01    Male       26.07.2012
                                         IoM      IoM10_08    Female     26.06.2010   0               775        12.8
                            4
                                         IoM      IoM12_24    Female     09.08.2012
                                         IoM      IoM10_18    Female     23.07.2010   2               748        5.4
                            5
                                         IoM      IoM12_19    Unknown    09.08.2012
                                         IRE_12   IRE11_21    Unknown    29.04.2011   0               339        1.6
                            6
                                         IRE_12   IRE12_04    Unknown    02.04.2012
                                         SCO      SCO12_08    Unknown    08.08.2012   0               344        3.8
                            7
                                         SCO      SCO13_22    Unknown    18.07.2013

                           Table 1. Inter-annual genetically confirmed re-encounters. Individuals resampled at the same site showing
                           pairings that matched at all or nearly all 19 microsatellite loci, demonstrating exact inter-annual site-fidelity
                           (400 basking shark samples collected
                           worldwide. Secondly, using temporal samples collected at three known NEA aggregation sites from 2009 to 2014
                           inclusive, we assess genetic re-encounters, contemporary gene flow and migration rates between sites to infer
                           regional connectivity, complementing and expanding previous studies using mtDNA21. Further, we provide a
                           preliminary examination of average within-group relatedness to determine if aggregations are on average more
                           related than expected by chance. Finally, we provide the first estimates of effective population size to assess con-
                           temporary Ne at a time when increasing anthropogenic activity (e.g. marine renewable energy installations, fish-
                           ing, shipping, and oil and gas extraction) is rapidly changing the NEA seascape.

                           Results
                           Microsatellite characterisation.             A minimum of 13 out of 22 microsatellite loci were successfully ampli-
                           fied in the 460 DNA samples screened, which included 394 samples from the NEA (divided into IRE = Ireland,
                           IoM = Isle of Man, MF = Moray Firth, SCO = West Scotland, S_ENG = South England) collected over 6
                           years (2009–2014) and 66 samples opportunistically collected over 20 years from elsewhere in the world
                           (MED = Mediterranean, NWA = Northwest Atlantic, PAC = New Zealand, SA = South Africa). Genotypes of
                           individuals sexed at the time of sampling (78 females and 69 males) suggested all 22 microsatellites behaved as
                           autosomal, co-dominant loci. Duplicate individuals (n = 53 comprising of NEA n = 51, SA n = 1, NWA n = 1
                           following matching analysis) were removed, leaving a total of 407 unique individuals to characterise the micro-
                           satellites. Initial and final sample sizes can be found as Supplementary Table S1.
                               None of the loci were out of Hardy Weinberg equilibrium (HWE) overall (across populations). When HWE
                           was assessed within global putative populations based on geographic origins (for putative populations and sample
                           sizes see Supplementary Table S2), significant departures were identified for locus Cmax07 in three out of nine
                           populations. None of the loci showed any evidence for stuttering, large allelic dropout or the presence of null
                           alleles, except for Cmax12. However, Cmax13 and Cmax14 displayed significant linkage disequilibrium with
                           several loci (Cmax06, Cmax07, Cmax17). Therefore, Cmax12–Cmax 14 were removed and all following analyses
                           performed with the 19 validated loci.
                               The genotyping error rate was 0.0097 (i.e. 16 incorrect genotypes/1635 reprocessed genotypes), where the
                           error rate per locus ranged from 0–0.0230 (see Supplementary Table S3). When confirming re-encounters,
                           genetic match #3 (Table 1) included two mismatching loci resulting most likely from large allelic dropout in
                           Cmax04 and a null allele causing a false homozygote in Cmax05, whereas genotyping errors in match #5 were
                           probably due to large allele dropout at loci 1HC2 and 1HF4, where the larger allele failed to amplify in the more
                           degraded sample. In both cases, the more degraded sample (which showed homozygous alleles) was removed fol-
                           lowing matching analyses. Across all 407 individuals, the number of alleles per microsatellite locus ranged from 3
                           to 18 with a mean number of alleles per locus of 8 (mean proportion of individuals typed = 0.98). Observed and
                           expected heterozygosity per microsatellite ranged from 0.22 to 0.87 (mean = 0.66) and 0.24 to 0.87 (mean = 0.66),
                           respectively (see Supplementary Table S3).
                               Two loci possibly under positive selection (Cmax16 and Cmax17) and three loci (Cmax01, Cmax06 &
                           1HF4) under balancing selection were identified. However, the significance of pairwise estimates of population

Scientific Reports |   (2020) 10:1661 | https://doi.org/10.1038/s41598-020-58086-4                                                             3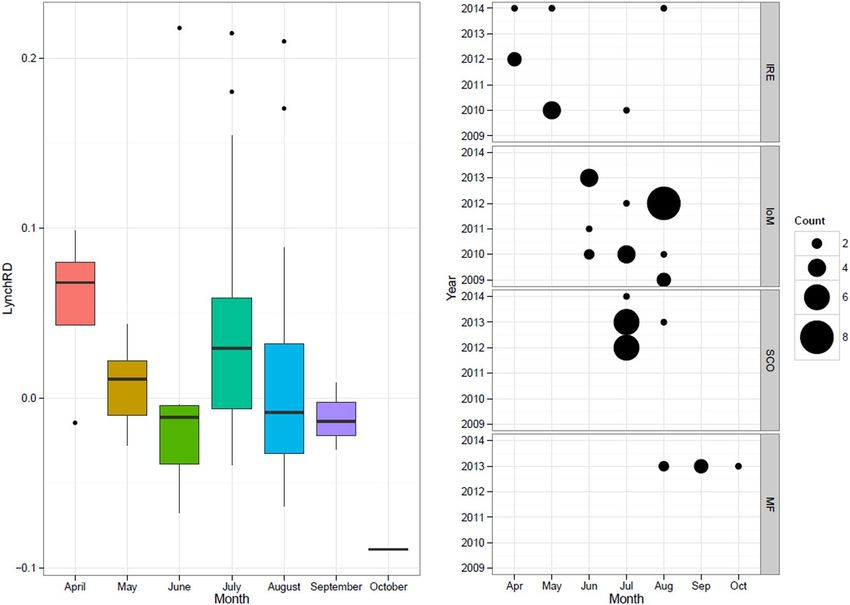
www.nature.com/scientificreports/                                                        www.nature.com/scientificreports

                           Figure 1. Basking shark NEA sampling sites and inter-annual, genetically confirmed re-encounters.
                           Approximate basking shark sampling sites (red circles) from the Northeast Atlantic collected 2009–2014,
                           including the Moray Firth (MF) and common aggregation sites around Ireland (IRE, IRE_12), Scotland (SCO)
                           and the Isle of Man (IoM). (a–c) Locations of the seven inter-annual, genetically-confirmed re-encounters
                           (see Table 1). The map was created in ArcGIS v.10 (http://www.esri.com/arcgis/about-arcgis), bathymetry
                           reproduced from GEODAS (Geophysical Data system) Grid Translator developed by the National Geophysical
                           Data Center, NOAA (National Oceanic & Atmospheric Administration). (d) Image of basking shark mucus
                           sampling off the North Coast of Ireland. Photo credit: S. Berrow.

Scientific Reports |   (2020) 10:1661 | https://doi.org/10.1038/s41598-020-58086-4                                                     4
www.nature.com/scientificreports/                                                               www.nature.com/scientificreports

                           differentiation remained unchanged whether non-neutral loci were either included or excluded, justifying their
                           incorporation in all subsequent analyses to maximize resolution.
                               Based on 407 individuals, the probability of two individuals sharing the same multi-locus genotype across all
                           19 loci was very low with PID(unbiased) = 5.25 × 10⁻¹⁷ and PID(sibs) = 3.11 × 10−07, indicating the high discrim-
                           inatory power of this marker set.

                           Inter-annual returns to northeast Atlantic aggregation sites.                    There were 51 ‘genetically confirmed
                           re-encounters’ (individuals sampled repeatedly) in the NEA region throughout the course of this study. Of these,
                           82% (n = 42) occurred within the same site and year (seasonal residency), mostly within a day or week (max. 31
                           days) of the first sampling (see Supplementary Fig. S1).
                               The remaining 18% (n = 9) were re-sampled in different years at the same or different localities within the
                           NEA. Two of these individuals were re-sampled at locations >100 km distant from their original site and repre-
                           sent inter-annual site fidelity on a regional scale. One individual, first sampled in 2012 on the Scottish West Coast,
                           was re-sampled off Ireland (north) two years later (SCO12_60 & IRE14_06). Another, originally encountered off
                           the Scottish West Coast (SCO12_42) in 2012 (7 m, male), was re-sampled in the Moray Firth in 2013 (MF13_11).
                               The remaining 7 individuals (14%) resampled at the same locality (i.e. within 20 km of the original site)
                           between years, are indicative of inter-annual site-fidelity (Table 1; Fig. 1). They comprise five IoM individuals
                           (out of 118 samples collected 2009–2013), another from SCO (from Gunna Sound) (out of 123 samples collected
                           2012–2014), and one from IRE (out of 124 samples collected 2009–2012, and in 2014). The latter was sampled
                           off Ireland during April of two successive years (2011 & 2012). Of those re-encounters where individuals could
                           be sexed, those identified as males were sampled in successive years (n = 2), whereas those confirmed as females
                           (n = 3) were sampled after an interval of two to four years.

                           Northeast Atlantic population differentiation and gene flow. None of the pairwise comparisons
                           of DST (105 possible pairwise comparisons of 15 temporal populations = 5 putative populations at aggrega-
                           tion sites split by year) remained significant (95% confidence intervals bounded by zero) following bootstrap-
                           ping. All but three GST pairwise values were initially significant, yet only the following comparisons involving
                           IRE_12 (early season samples at the geographic periphery of our NEA sampling range, collected off SW Ireland
                           in 2012) remained significant following bootstrapping, IoM_10 (GST = 0.014, CI = [0.003; 0.030]), IoM_12
                           (GST = 0.010, CI = [2.5 × 10⁻⁵; 0.023]) and SCO_13 (GST = 0.009, CI = [7.6 × 10⁻⁵; 0.020]) (Supplementary
                           Fig. S2). No pairwise FST comparisons remained significant following Bonferroni adjustment of significance lev-
                           els (Supplementary Table S4). However, IRE_12 retained the highest degree of genetic differentiation (FST ranging
                           from 0.0112–0.032).
                               Overall, Irish samples were differentiated from other NEA sites, shown in the Principal Coordinates Analysis
                           (PCoA; Supplementary Fig. S3), with IRE_12 again the most distinct. The majority of IRE samples were col-
                           lected relatively early in the season, in April and May, whereas IoM and SCO samples were obtained in late sum-
                           mer, from June until August (Fig. 2a). Finally, a Discriminant Analysis of Principal Components (DAPC) plot of
                           NEA samples indicated IoM and SCO sharks were genetically similar, whereas IRE sharks, specifically IRE_12,
                           remained genetically more distinct (Fig. 2b).

                           High regional movements in the northeast Atlantic. Analyses of contemporary migration rates (m)
                           suggested relatively high and uni-directional movement into the Irish Sea (see IoM in Fig. 3), with mean migra-
                           tion rates from the three remaining sub-populations ranging from 0.26–0.32 (Supplementary Table S5, also for all
                           mean posterior probabilities of m). The posterior probability of the population inbreeding coefficient, F, was near
                           zero for the Irish Sea (IoM, F = 0.0174), yet relatively high for the remaining sub-populations (0.1614–0.3589).
                           In accordance with discriminant analysis (e.g. Fig. 2b), mean migration rates from the source populations to the
                           Irish Sea (IoM) were highest from SCO, followed by IRE and then IRE_12.

                           Relatedness in northeast Atlantic aggregations.                Relatedness amongst individuals of both IRE_12
                           (r = 0.096) and SCO (r = 0.009) was higher than other ‘population’ samples (Table 2), prompting a more detailed
                           relatedness analysis of 55 documented adult groups within IoM, SCO, and IRE samples (Supplementary Fig. S5).
                           Among-group relatedness was compared and assessed relative to random expectations, computed through
                           iterations based on the re-shuffling of individuals between groups. Both the LynchRD moment-estimator and
                           DyadML dyadic likelihood method indicated individuals within groups were more related than expected by
                           chance. Within group relatedness was relatively high (mean of 0.0228 for LynchRD and 0.1032 for DyadML),
                           with the right-skewed distributions of estimators indicating positive relatedness values exceeding the null dis-
                           tribution (Fig. 4). Within-group relatedness and within-group inbreeding for either estimator were not corre-
                           lated. Monte Carlo simulations suggest the observed average relatedness calculated from LynchRD (R = 0.0228)
                           was significantly (p < 0.005) higher than expected (R = −0.0046), indicating non-random relatedness in basking
                           shark groups. This was supported by DyadML, both with (average observed R = 0.0775 vs expected R = 0.0521,
                           p < 0.008, Supplementary Fig. S6) and without allowing for inbreeding (average observed R = 0.1032 vs expected
                           R = 0.0797, p < 0.039). Comparing range of relatedness values by sampling origin showed groups of sharks sam-
                           pled off Ireland had a higher median relatedness than those sampled elsewhere (Fig. 5a). Although confounded by
                           site and within-group composition, relatedness was highest in April, with animals sampled from Ireland (IRE_12
                           & IRE_14) (Fig. 5b). Relatedness decreased in subsequent months, but another smaller July peak comprised
                           sharks mainly from Scotland and the Isle of Man. In addition to the higher than expected average relatedness,
                           both approaches identified the same five groups, and two different additional ones, suggesting each analysis sup-
                           ports up to seven of the 55 groups (>12%) as significantly more related than expected (Supplementary Fig. S5).

Scientific Reports |   (2020) 10:1661 | https://doi.org/10.1038/s41598-020-58086-4                                                             5
www.nature.com/scientificreports/ www.nature.com/scientificreports
Figure 2. Northeast Atlantic (NEA) basking shark sampling occasions and DAPC results. (a) NEA
sampling sites and numbers per year and month (2009–2014) with an orange circle emphasizing samples
collected relatively early in the season, i.e. IRE_12. (b) Scatterplot from the discriminant analysis of principal
components (DAPC) on NEA samples. Groups are shown as different colours and inertia ellipses, while dots
represent individuals. Groups include temporally merged individuals from SCO = Scotland, IoM = Isle of
Man, IRE = Ireland, and IRE_12 = Irish samples from 2012, respectively. The bottom inset is the DAPC’s
‘compoplot’, a bar plot showing the probabilities of assignment of individuals to the different, pre-defined groups
(individuals are plotted along the x-axis and membership probabilities along the y-axis). Colours in ‘compoplot’
correspond to colours in the DAPC scatterplot.
With the caveat of small sample size, all-female groups (n = 5) showed higher relatedness than all-male (n = 5) or
mixed gender groups (n = 45), suggesting gender-specific differences (Supplementary Fig. S7).
High gene flow and limited global genetic differentiation. Globally, estimates of GST and DST identi-
fied weak genetic structuring among the nine putative populations (Supplementary Fig. S8), where values ranged
from −0.012–0.013 and from −0.024–0.011, respectively. Only GST values remained significant after bootstrap-
ping, including IRE_12 and IoM (GST = 0.010, CI = [0.002; 0.023]), IRE_12 and IRE (GST = 0.008, CI = [0.001;
0.019]), IRE_12 and SCO (GST = 0.009, CI = [0.001;0.020]) and IRE and SCO (GST = 0.002, CI = [1.2 × 10⁻⁵;
0.004]; for FST comparisons see Supplementary Table S7).
Global DAPC cluster analysis showed that throughout all a priori groups, individuals had a higher probability
of assignment to a population other than where they were originally sampled when using the function find.clus-
ters. Consequently, a DAPC of the putative populations showed that none of the global samples clustered tightly
based on their sampling origin, although samples from IRE_12, NWA and the MED were most different from the
NEA or PAC region (Fig. 6).
Similarly, a PCoA of Nei’s genetic distances by population separated IRE_12, SA, NWA and MED on the prin-
cipal axis (53.31%) from the remaining NEA and PAC samples (Supplementary Fig. S9). Throughout all analyses,
it became apparent that individuals sampled in the Pacific were genetically close to the centroid of all samples.
Finally, Bayesian inference using Structure could not detect any clustering in the data set (K = 1), maintained
using locpriors and without a priori information on population origin.
Genetic diversity. Table 2 shows that sample sizes on a global scale were unbalanced and mean number
of alleles per site corresponded with the number of individuals sampled, except for IoM, which showed a lower
number of alleles than IRE (for NEA-specific diversity measures see Supplementary Table S9). Allelic richness,
a measure of genetic diversity adjusted for sample size, ranged from 4.042 (IRE_12) to 4.295 (MED). The MED
and PAC samples showed heterozygote deficit (high FIS), with IRE and PAC samples significantly out of HWE;
probably a consequence of combining temporal samples of opportunistically collected individuals.
Scientific Reports | (2020) 10:1661 | https://doi.org/10.1038/s41598-020-58086-4 6www.nature.com/scientificreports/ www.nature.com/scientificreports
Figure 3. Circular migration plot (chord diagram). Migration rates (m) are plotted between the Isle of Man
(IoM), Ireland (IRE), Scotland (SCO) and the temporal samples from Ireland 2012 (IRE_12), based on the
output matrix from BayesAss. Sampling locations are given on the outside of the circle, where “S” preceding the
location denotes the source population from which individuals migrated. The thickness of the arcs represents
the rate of migration; only migration rates values > 0.10 are listed and indicated with an arrow. Values in bold
and italic are the proportions of individuals derived from the source populations.
Sampling site N NdA NA PA AR NE HO HE HWE FIS r
IoM 97 126 6.632 0.053 4.165 3.587 0.677 0.659 0.623 −0.029 −0.003
IRE 89 133 7.000 0.316 4.211 3.593 0.660 0.664 0.047 0.007 −0.011
IRE_12 18 98 5.158 0.053 4.042 3.117 0.658 0.609 0.106 −0.064 0.096
SCO 133 137 7.211 0.263 4.212 3.626 0.645 0.652 0.172 0.012 0.009
S_ENG 6 69 3.632 0.000 NA 2.844 0.693 0.593 0.998 −0.170 0.029
MED 11 90 4.737 0.053 4.295 3.300 0.639 0.645 0.717 0.027 −0.033
SA 4 64 3.368 0.000 NA 2.799 0.719 0.578 1.000 −0.226 −0.001
PAC 38 124 6.526 0.105 4.260 3.473 0.622 0.649 0.026 0.051 0.005
NWA 11 78 4.105 0.053 NA 3.040 0.722 0.612 0.509 −0.175 0.032
Total mean 45 102.1 5.374 0.099 4.197 3.264 0.671 0.629 −0.063 0.014
SE ±16 ±10 ±0.501 ±0.038 ±0.700 ±0.109 ±0.012 ±0.010 ±0.034 ±0.012
Table 2. Genetic diversity statistics (with means ± standard errors) derived from 19 microsatellite loci across
nine global samples based on 407 unique individuals. Global sampling locations include: IoM = Isle of Man,
IRE = Ireland, IRE_12 = Ireland (from 2012 only) SCO = West Scotland and the Moray Firth, S_ENG = South
England, MED = Mediterranean; SA = South Africa; PAC = New Zealand, NWA = Northwest Atlantic; N,
sample size; NdA, number of different alleles, NA, mean number of alleles across 19 loci; PA, number of private
alleles; AR, allelic richness based on 7 diploid individuals; NE, number of effective alleles; HO, observed
heterozygosity; HE, expected heterozygosity; HWE, p-value for Hardy-Weinberg equilibrium probability test;
FIS, Fixation index (average inbreeding coefficient of subpopulations relative to the total population), r = mean
group relatedness where bold indicates if different across populations determined by 999 permutations.
NA = Non-applicable (samples excluded from allelic richness estimate due to low sample size or missing
genotypes).
Northeast Atlantic effective population size Ne. When computing Ne, rare allele frequencies were
excluded to avoid bias (Pcrit < 0.02), an approach not adversely affecting precision31. Most Ne estimates exceeded
the sample size used in the estimates (Supplementary Table S8). Applying the Ne estimator to all (n = 97) indi-
viduals from the IoM temporal data set gave an estimated Ne (using Pcrit = 0.02) of 382 individuals (parametric
CIs = 241–830). If this point estimate were to be corrected by 0.74–0.86 to account for age-structure, the upwardly
adjusted Ne comes to 516, which would suggest over 800 (Ne:N ratio used = 0.6) individuals frequenting IoM
waters.
Scientific Reports | (2020) 10:1661 | https://doi.org/10.1038/s41598-020-58086-4 7www.nature.com/scientificreports/ www.nature.com/scientificreports
Figure 4. Histogram with kernel density curve of observed within-group relatedness of basking shark groups
(n = 55) based on LynchRD (left; with the mean 0.0228 shown as a red dashed line) and the likelihood method
DyadM (right; with the mean 0.1032 shown as a red dashed line). Groups were sampled around the Isle of Man
(IoM, 2009–2013), Ireland (IRE, 2010–2012, 2014), the Moray Firth, Scotland (MF, 2013) and the West Coast of
Scotland (SCO, 2012–2014).
Figure 5. Boxplots showing the variance in within-group relatedness of basking shark groups (n = 55) per
month (a), with the number of groups shown by site as ‘Count’ (b) based on LynchRD. Median relatedness was
higher in samples from Ireland (a) and in April and July. (b) Sampling sites include the Isle of Man (IoM, 2009–
2013), Ireland (IRE, 2010–2012, 2014), the Moray Firth, Scotland (MF, 2013) and the West Coast of Scotland
(SCO, 2012–2014).
Scientific Reports | (2020) 10:1661 | https://doi.org/10.1038/s41598-020-58086-4 8www.nature.com/scientificreports/ www.nature.com/scientificreports
Figure 6. Global DAPC results and sampling locations. (a) Scatterplot from the discriminant analysis of
principal components (DAPC) on global samples. Groups are shown as different colours and inertia ellipses
(67% of variance), while dots represent individuals. The left inset indicates the number of retained principal
components (60), cumulatively explaining 80% of the variance. The middle inset is the DAPC’s ‘compoplot’, a
bar plot showing the probabilities of assignment of individuals to the different, pre-defined groups (individuals
are plotted along the x-axis and membership probabilities along the y-axis). Colours in ‘compoplot’ correspond
to colours in the DAPC scatterplot. The right bar graph inset indicates the amount of variance explained by
the two discriminant eigenvalues used for plotting. (b) Map of global sampling locations with the Northeast
Atlantic samples as an inset; where IoM = Isle of Man; IRE = Ireland; IRE_12 = Irish samples from 2012;
SCO = Scotland; S_ENG = South England; MED = Mediterranean; SA = South Africa; PAC = New Zealand;
NWA = Northwest Atlantic. Maps were created in ArcGIS v.10 (http://www.esri.com/arcgis/about-arcgis).
For a separate analysis, IoM samples were combined with SCO samples, resulting in no accurate estimates of
Ne (Ne = infinite) and parametric CIs from 3239 – infinity (Pcrit = 0.02). Using the same adjustments as above, a
minimum of Ne = 3239 would suggest at least 4,000 individuals frequenting IoM and SCO waters.
Discussion
Genetic evidence supports inter-annual site-specific re-encounters. Our analyses of the largest
NEA temporal (2009–2014) set of basking shark DNA samples collected to date, provides the first support-
ing genetic evidence for site-specific re-encounters in the basking shark, with 18% of individuals re-sampled
inter/multi-annually at or near the same location. These findings accord with previous evidence from photo-ID
re-sightings within a region32, mark-recapture methods at a localised site29, and more recent satellite tracking18.
Notably, we resampled seven individuals in close proximity (www.nature.com/scientificreports/ www.nature.com/scientificreports
by various migration strategies into more southerly latitudes, showing a displacement range of 455km-2354km
based on archival tags17. Neither study suggests individuals are year-around inshore residents found within a few
kilometres of their tagging location. Rather, corroboration of all available evidence makes a compelling case that
basking sharks leave an area to return on an inter- or perhaps multi-annual basis. Inter-annual returns of two
satellite-tagged sharks to the Scottish MPA18 are concordant with wider genetic re-sampling of individuals from
both Scottish and Manx (Isle of Man) waters within a few kilometres of where they were first encountered, often
after several years. Our complementary evidence from Scottish, Irish and Manx aggregation sites suggests indi-
viduals may exhibit inter-annual site fidelity in the NEA, although data remains insufficient to suggest site fidelity
on a population-level. To determine the scale and frequency of inter-annual basking shark returns at a population
level, the calculated probability of recaptures would need to exceed that of random expectations20, where the
chance of resampling an individual is inversely proportional to population size.
The scale, frequency and nature of return movements in elasmobranchs is complex and has been variously
attributed to gestation12, pupping35, mating36 or feeding37. Seasonality in prey availability is a common driver of
migratory movement, and repeated use of an area for feeding is considered ‘feeding site fidelity’38,39. A strong
association with thermal fronts and chlorophyll a in NEA shelf seas and low inter-annual variability of season-
ally persistent fronts likely encourages basking sharks to return on an inter-annual basis19. Already documented
in large-bodied lamniform sharks returning seasonally to areas supporting abundant prey1,6, this phenomenon
is also observed in other large planktivores, such as the whale shark37 and the giant oceanic manta, Mobula
birostris40.
Confirmation of inter-annual site fidelity can inform seasonal/dynamic protection measures around aggre-
gation sites, particularly in wide-ranging marine predators. Yet, compared with some marine mammals41, there
is little knowledge of the spatial and temporal variation of such events in planktivorous elasmobranchs, and
reacquisition of individuals between years at the same site requires continuous and unambiguous quantification.
Population structure in the NEA. Seasonal affinity to oceanic regions has potential to promote population
structure, but not if there are sufficient migrants to counter genetic drift. It is unclear if documented ocean-scale
movement15,16 of basking sharks is for gestation purposes or a consequence of mating dispersal (involving tem-
porarily/permanently leaving a home range). However, only the latter could lead to effective dispersal and hence
gene flow, as it requires dispersers to reproduce in a ‘new’ location42. Determining the number of migrants
required to homogenize population structure, counteracting drift and selection, is a contentious issue. The bask-
ing shark, like the similarly long-lived whale shark25, would require only a few breeding migrants every 2–4 years
to homogenize population structure.
Our temporal sampling regime in the NEA afforded an opportunity to examine the regional population struc-
ture of this species in unprecedented detail. Subtle but significant temporal structuring of populations in the NEA
was apparent from estimates of GST, with early-season sharks sampled off SW Ireland in 2012 (IRE_12) differen-
tiated from most other temporal samples. Further, IRE12 shows a significantly higher mean group relatedness
than expected, and departure from HWE consistent with the notion of genetically discrete kin groups moving
en masse.
These observations are reminiscent of sympatric subpopulations sharing the same spatially, but not tempo-
rally, defined locations43. Whereas the migratory route of IRE_12 individuals cannot be ‘retraced’, their genetic
similarity to earlier samples of NWA sharks in all analyses of population differentiation (Supplementary Figs. S8,
S9) supports the possibility of trans-Atlantic migration. Such movements of marine fauna44,45 may be facilitated
by the North Atlantic gyre system, following the north-easterly flow of the Gulf Stream and the North Atlantic
Current. Basking sharks may follow a similar route to forage along the highly productive Sub Polar Front. The
lowest conformation to HWE in Scottish waters recorded in 2012 may reflect aggregations of genetically more
discrete migrant groups.
With certain caveats, our analysis of recent genetic migration rates and directionality in the NEA may suggest
an asymmetrical pattern of immigration into the Irish Sea (IoM sampling area). However, as some assumptions
of the inference model were not met (low, constant migration rates and high FST differentiation46), these findings
should be interpreted as a merged Irish Sea (IoM) sample set representing all NEA individuals at one time point,
rather than source-sink population dynamics. That the Irish Sea (IoM), increasingly influenced by anthropogenic
activity, could represent an important transit corridor during seasonal movements within the NEA deserves
further investigation. Concordant with this interpretation is the limited but significant differentiation between
merged temporal samples from Irish (excluding IRE_12) and Scottish waters (Figs. 2 & 6).
Relatedness within NEA aggregations. The distribution of genotypes in time and space, inferred from
analysis of adult group relatedness, suggests basking sharks surfacing together in the NEA are on average more
related than expected by chance. Within-group relatedness was highest in early-season (April) samples, as repre-
sented by IRE_12 and IRE_14. All-female groups had higher kinship than all-male groups or mixed assemblages
(Supplementary Fig. S7); however sample sizes preclude inference about patterns of relatedness and gender.
Following Jacoby et al.47, ‘aggregation’ refers to individuals drawn to the same resource for food or other
habitat requirements in the absence of evidence suggesting social interactions. Spatio-temporal co-occurrence of
individuals, and potential social interactions, may arise through shared behavioural strategies including spatial
segregation during certain life stages12, collective movements48, and aggregation around a resource11,13 or habi-
tat18. Site-attached behaviours, such as aggregations due to patchy resource distribution, characteristic of basking
sharks, periodically bring individuals together.
Understanding the spatial and temporal patterns of aggregations can contribute to long-term conservation
efforts12,49. While inferring relatedness from genotypic data alone remains challenging and should be used with
caution50,51, in species with little opportunity for direct observation52 it provides some insight into the potential
Scientific Reports | (2020) 10:1661 | https://doi.org/10.1038/s41598-020-58086-4 10www.nature.com/scientificreports/ www.nature.com/scientificreports
mechanisms underlying fine-scale behavioural processes with long-term ecological consequences53. Estimates of
relatedness and inbreeding have by definition a large randomly-mating and non-inbred reference population and
should be understood as measures relative to this reference54. Theoretically, when sampling free-ranging animals
from a larger population, individuals are assumed to be drawn at random and are therefore unrelated; making the
mean estimate of relatedness close to zero, suggesting samples contain few or no relatives51. Kin groupings could
be a consequence of inter-annual site fidelity to seasonal foraging opportunities19. Ultimately, a tendency to aggre-
gate seasonally increases the probability of kin encounters, possibly facilitating social interactions or transmission
of information between conspecifics and kin. When individual learning (‘asocial’, i.e. trial and error) is costly,
social learning from conspecifics or kin can be advantageous, particularly in heterogeneous environments55.
Larger, more experienced basking sharks may be more proficient at locating patchy food than juvenile sharks, due
to ontogenetic differences in habitat selection34, as recently demonstrated in other marine predators56. Therefore,
social information transfer and the potential to learn optimal foraging may benefit kin in loose aggregations57.
However, that not all aggregations comprised significant kin groups, and overall exhibit a lack of evidence for
inbreeding, raises the possibility of assortative mating in the basking shark. Differentiating between kin and
unrelated conspecifics might be a mechanism to tolerate or seek kin during foraging, but to avoid breeding with
close relatives. Kin recognition has been shown in salmonids58, and an experimental study demonstrated male
guppies’ reproductive investment (courtship) was reduced when placed with siblings59. Although it is unknown
if basking sharks are similarly capable, olfaction-mediated pairing behaviour has been suggested as a mechanism
in sharks60.
Global connectivity. Long-distance migration is common in mobile, long-lived species occurring at many
spatial and temporal scales7. Our analysis of available samples from outside the NEA suggests lack of popula-
tion differentiation, often interpreted as evidence of global panmixia, which contrasts with subtle but significant
structuring within the NEA. Ocean-scale tracking studies indicate that neither the Mid-Atlantic Ridge nor trop-
ical waters are barriers to migration15,16. Basking sharks appear to have a broad thermal range14 and are there-
fore relatively unrestricted by temperature. Considering their average cruising speed3, individuals could travel a
straight-line distance of over 30,000 km annually. This supports the possibility of ocean-wide dispersal, suggesting
movement among all sample locations is not beyond their known physical/physiological capabilities.
Similar movement analyses of the more thermally restricted whale shark inferred they existed as a global
‘meta-population’4. However, population genetic analyses using microsatellite and mitochondrial DNA found
significant structure between Indo-Pacific and Atlantic populations25. This study emphasised inadequate popu-
lation samples and marker choice had influenced previous interpretations of whale shark population structure61.
Similarly combining our Pacific samples across years could have degraded statistical differentiation of the Pacific
and NEA populations; although the possibility that their apparent genetic similarity has its historic origins in
trans-Arctic migration during an ice-free period62 cannot be refuted. Adequate sampling, by contrast, revealed
weak population structure in both species; the genetically most discrete whale sharks from the isolated Holbox
Island, Gulf of Mexico61, and similar weak differentiation of the temporally discrete IRE_12 sharks.
Consequently, at a larger scale the prevailing view that basking sharks exhibit panmixia, lacking global pop-
ulation structure, cannot be rejected immediately by our microsatellite analysis of combined temporal samples
collected worldwide. However, that these samples, where large enough for analysis to be meaningful, depart sig-
nificantly from HWE suggests they could comprise individuals from genetically discrete temporal populations,
biasing downward estimates of differentiation. This inference is supported by our findings of some temporal
genetic differentiation and unexpectedly high levels of relatedness within basking shark aggregations in the NEA.
Therefore, as in earlier studies of whale sharks61, it remains questionable whether lack of differentiation between
small, unrepresentative and perhaps most importantly, arbitrary ‘population’ samples, collected opportunistically
from strandings and fishery captures over tens of years and across five oceanic regions, really can indicate high
contemporary genetic connectivity and lack of population structure.
Effective population size. Effective population size (Ne) influences long-term evolutionary processes and esti-
mates of Ne are generally lower than census size reflecting reproductive variability27. Most of our estimates for the
NEA were at least three-fold the sample size. Larger sample sizes meant Ne could not be estimated or had infinite
confidence limits, suggesting that the linkage disequilibrium (LD) method could not distinguish larger Ne from
infinity, possibly reflecting a lack of true, independent populations.
Aerial surveys based on the Bay of Fundy, Canada, estimated the total population size of eastern Canada as
6512 (CI: 4040–11886)63. In accordance with Hoelzel et al.21 (Ne of 8200 animals worldwide, calculated from
mitochondrial markers), and based on our microsatellite-derived Ne estimates, the number of basking sharks in
NEA waters are unlikely to exceed 10,000 individuals.
Despite efforts to reduce bias in our estimates, two requisites of the LD model, closed populations and random
mating, were violated. Therefore, our sampling design and adjustments likely reflect a per-generation, local Ne,
rather than number of breeders within the population. Finally, Ne/Nc ratios in large-bodied elasmobranchs are
relatively unexplored, but a suggested ratio similar to those of marine and terrestrial mammals seems appropriate,
considering elasmobranchs share similarly slow life history traits64. Merged Irish Sea samples from four successive
years produced an estimated Ne of 382 (95% CI = 241–830), inferring >800 individuals frequent the Irish Sea
(Ne:N ratio used after correcting point estimate = 0.6), similar to a local abundance estimate from neighbouring
Scottish waters of 985 (95% CI = 494–1683)29.
Implications. We report site-specific re-encounters of individuals, which supports suggestions of
inter-annual site fidelity17,18, and revealed high levels of gene flow among NEA aggregations. However, we have
also found an early-season sample (IRE_12) whose genetic composition was temporally heterogeneous. There
was a tendency for a spatial association of kin groups, perhaps drawn together by prey availability following ocean
Scientific Reports | (2020) 10:1661 | https://doi.org/10.1038/s41598-020-58086-4 11www.nature.com/scientificreports/ www.nature.com/scientificreports
scale migration. Findings which do not contradict the inference of some level of global connectivity. Maintaining
the integrity of these aggregations of related individuals undertaking focused seasonal return movements to feed-
ing sites together, supports the case for area protection; while highlighting the global risks accruing to the basking
shark’s characteristic adherence to sites and transit routes crossing multiple jurisdictions. Our analysis of migra-
tion rates associated with the Irish Sea, an area of intense marine renewable development, exemplifies the prob-
lem of protection during transit between aggregation sites. Nevertheless, knowledge of the spatial ecology and
population connectivity of highly migratory species can inform spatial planning. Identification of aggregation
‘hotspots’, areas associated with the presence of persistent fronts, informed the recent proposal for a basking shark
MPA in Scottish waters10. Its potential importance is underscored by observations of suspected mating activity
within summer aggregations10,11.
Finally, our study suggests an important corollary to the well documented catch rate declines of the 1950s to
1990s associated with area-focused basking shark fisheries3,23. Evidence of relatedness, most marked in early sea-
son samples, suggests kin association may be characteristic. Activities depleting kin groups can erode selectable
genetic variation rapidly; an important consideration in a slowly reproducing long lived species exhibiting limited
genetic diversity.
Material and Methods
Sample collection, DNA extraction and amplification. A total of 460 basking shark samples (skin/
mucus) were collected from five oceanic regions during the last two decades (1994–2014). Tissue samples from
dead, mostly stranded or trawl bycaught specimens were obtained opportunistically from the Northwest Atlantic
(n = 12), South Africa (n = 5), the Mediterranean (n = 11) and New Zealand, representing the South Pacific
(n = 38). The majority (>85%) of samples were collected from the Northeast Atlantic (NEA; n = 394) using
mainly mucus swabs of free-swimming basking sharks65. All mucus sampling methodology was approved by, and
conducted with the knowledge of the Wildlife and Conservation Division of the Isle of Man Government, Scottish
Natural Heritage licence (13921 and 58660) and the UK Home Office ASPA licence (PPL 30/2975; University of
Exeter). Three common aggregation sites within the NEA region were sampled repeatedly between 2009 and
2014 to investigate inter- and intra-annual connectivity within and among the waters of the Isle of Man (n = 118),
Ireland (n = 124), and the West Coast of Scotland (n = 124). In addition, 22 samples were collected from indi-
viduals in the Moray Firth, Scotland, in 2013, representing the only North Sea sampling location. Finally, six
individuals were sampled from Southern England off Cornwall, 1994–2004. Associated data, such as sampling
location, total length, sex and dorsal fin-ID were acquired when possible and samples for DNA extraction were
preserved in Analytical Reagent Grade absolute ethanol. Total genomic DNA was extracted using proteinase K
digestion and standard phenol-chloroform procedures. DNA concentration was quantified using a fluorometer
(Qubit, Invitrogen) and its quality assessed by electrophoresis on a 1% agarose gel stained with ethidium bromide.
All samples were genotyped for 22 dinucleotide microsatellites, including 19 loci from Lieber et al.30
(Cmax01–19) and three loci from Noble et al.66 (1HA5, 1HC2, 1HF4; two of the original five loci showed severe
stuttering), following the multiplex design described in Lieber et al.30. Products were amplified in a 2-µl PCR reac-
tion, including 1 µl (30–80 ng) DNA (air dried), 1 µl primer mix (forward and reverse primer at 0.2 or 0.4 mM)
and 1 µl QIAGEN Multiplex PCR Master Mix (including HotStar Taq DNA polymerase) with the following pro-
file: 95 °C for 15 min, followed by 35 cycles of 94 °C for 30 s, 56 °C for 90 s, 72 °C for 60 s and finally 60 °C for 6 min.
PCR products were diluted (1:160) and separated on an ABI 3730 48-well capillary DNA Analyser using ROX
GS500 size standard (Applied Biosystems Inc.). Genotypes were scored using the GENEMAPPER v3.7 software.
Microsatellite characterisation. To assess genotyping error rates, a random set of 87 individuals (19% of
the entire data set) was re-amplified and re-scored at all 22 loci, producing 1,914 multilocus genotypes (22 loci
× 87 individuals). The mean error rate per locus was calculated as the ratio between the number of single-locus
genotypes including at least one allelic mismatch and the number of replicated single-locus genotypes. Each
microsatellite locus was checked for scoring errors, allelic dropout and null alleles using Microchecker 2.2.367.
Individuals that failed to amplify at more than six loci were removed from the data set.
Observed and expected heterozygosities and mean number of alleles per locus were calculated in GenAlEx
6.568. The probability of randomly drawing two individuals from the population sharing identical multilocus
genotypes was calculated in GenAlEx using both, PID(unbiased) and PID(sibs), to determine the upper and lower
boundaries of probability of identity69. Fisher’s exact tests of Hardy-Weinberg equilibrium (HWE) using a Markov
Chain Monte Carlo (MCMC) approach with 10,000 iterations and tests for linkage disequilibrium (LD) per locus
and putative population were performed in GenePop 4.270. Significant values for multiple comparisons were
adjusted by calculating false discovery rate (FDR) adjusted p-values.
As population genetic assessments require neutral loci, an FST outlier method using the software Lositan71 was
applied to evaluate if all loci were neutral. The method evaluates the relationship between FST and expected hete-
rozygosity (HE) to identify outliers that have disproportionately high or low FST values compared to neutral expec-
tations. The first run estimates the mean neutral FST using all loci, a consecutive run uses only putative neutral loci
to compute neutral FST, and following the simulation, Lositan then reports the estimated selection status (balancing
selection, neutral, positive selection) of each locus. Lositan was run with 100,000 simulations using the infinite allele
model, using the ‘neutral mean FST’ and ‘Force mean FST’ options. In order to assess if the inclusion or exclusion of
suspected non-neutral loci had an effect on estimates of population differentiation, genetic pairwise distances were
generated with and without loci under selection, and with only ‘neutral’ loci as identified by Lositan.
Matching analysis and site fidelity. Due to the non-destructive sampling procedures used on live ani-
mals, there was a possibility that the same individuals were sampled repeatedly. Matching analyses were per-
formed in GenAlEx to assess intra- and inter annual genetically confirmed re-encounters of individuals within
Scientific Reports | (2020) 10:1661 | https://doi.org/10.1038/s41598-020-58086-4 12You can also read