Recent Evolutionary History of Tigers Highlights Contrasting Roles of Genetic Drift and Selection
←
→
Page content transcription
If your browser does not render page correctly, please read the page content below
Recent Evolutionary History of Tigers Highlights Contrasting
Roles of Genetic Drift and Selection
Ellie E. Armstrong ,*,†,1 Anubhab Khan ,†,2 Ryan W. Taylor,1,3 Alexandre Gouy ,4,5
Gili Greenbaum,1,6 Alexandre Thiery,4,5 Jonathan T. Kang,,7 Sergio A. Redondo,1 Stefan Prost ,1 Gregory
Barsh,8,9 Christopher Kaelin,9 Sameer Phalke,10 Anup Chugani,10 Martin Gilbert,11,12
Dale Miquelle,11 Arun Zachariah,13 Udayan Borthakur,14 Anuradha Reddy,15 Edward Louis,16
Oliver A. Ryder,17 Yadvendradev V. Jhala,18 Dmitri Petrov,1 Laurent Excoffier,4,5 Elizabeth Hadly‡,1 and
Uma Ramakrishnan *,‡,2

                                                                                                                                                      Downloaded from https://academic.oup.com/mbe/advance-article/doi/10.1093/molbev/msab032/6133235 by guest on 15 March 2021
1
 Department of Biology, Stanford University, Stanford, CA, USA
2
 National Centre for Biological Sciences, TIFR, Bangalore, India
3
 End2End Genomics, LLC, Davis, CA, USA
4
 Institute of Ecology and Evolution, University of Bern, Bern, Switzerland
5
 Swiss Institute of Bioinformatics, Lausanne, Switzerland
6
 Department of Ecology, Evolution & Behavior, The Hebrew University of Jerusalem, Jerusalem, Israel
7
 Genome Institute of Singapore, A*STAR, Singapore
8
 Hudsonalpha Institute, Hunstville, AL, USA
9
 Department of Genetics, Stanford University, Stanford, CA, USA
10
  Medgenome Labs Limited, Bangalore, India
11
  Wildlife Conservation Society, Russia Program, New York, NY, USA
12
  College of Veterinary Medicine, Cornell University, Ithaca, NY, USA
13
  Kerala Forest Department, Waynad, India
14
  Aranyak, Guwahati, India
15
  Laboratory for Conservation of Endangered Species, CCMB, Hyderabad, India
16
  Department of Genetics, Omaha Zoo, Omaha, NE, USA
17
  San Diego Zoo, Institute for Conservation Research, Escondido, CA, USA
18
  Wildlife Institute of India, Dehradun, India
†
 These authors contributed equally to this work.
‡
 These authors contributed equally to this work.
*Corresponding authors: E-mails: ellieearmstrong@gmail.com; uramakri@ncbs.res.in.

                                                                                                                                                    Article
Associate editor: Anne Yoder

Abstract
Species conservation can be improved by knowledge of evolutionary and genetic history. Tigers are among the most
charismatic of endangered species and garner significant conservation attention. However, their evolutionary history and
genomic variation remain poorly known, especially for Indian tigers. With 70% of the world’s wild tigers living in India,
such knowledge is critical. We re-sequenced 65 individual tiger genomes representing most extant subspecies with a
specific focus on tigers from India. As suggested by earlier studies, we found strong genetic differentiation between the
putative tiger subspecies. Despite high total genomic diversity in India, individual tigers host longer runs of homozygosity,
potentially suggesting recent inbreeding or founding events, possibly due to small and fragmented protected areas. We
suggest the impacts of ongoing connectivity loss on inbreeding and persistence of Indian tigers be closely monitored.
Surprisingly, demographic models suggest recent divergence (within the last 20,000 years) between subspecies and strong
population bottlenecks. Amur tiger genomes revealed the strongest signals of selection related to metabolic adaptation
to cold, whereas Sumatran tigers show evidence of weak selection for genes involved in body size regulation. We
recommend detailed investigation of local adaptation in Amur and Sumatran tigers prior to initiating genetic rescue.
Key words: conservation genomics, carnivores, population decline.

ß The Author(s) 2021. Published by Oxford University Press on behalf of the Society for Molecular Biology and Evolution.
This is an Open Access article distributed under the terms of the Creative Commons Attribution License (http://creativecommons.org/
licenses/by/4.0/), which permits unrestricted reuse, distribution, and reproduction in any medium, provided the original work is
properly cited.                                                                                                                       Open Access
Mol. Biol. Evol. doi:10.1093/molbev/msab032 Advance Access publication February 16, 2021                                                        1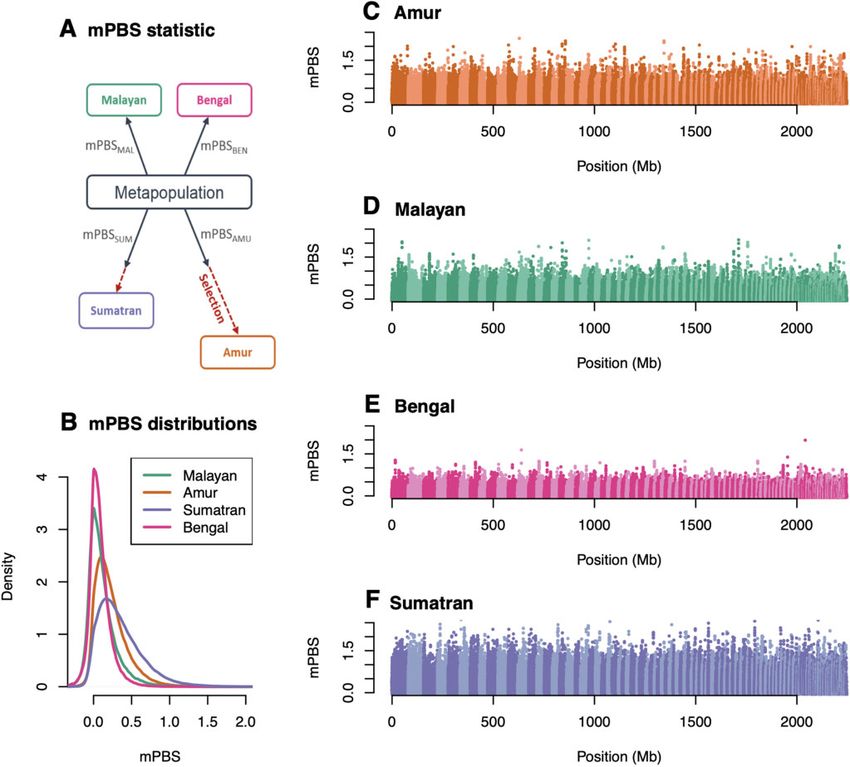
Armstrong et al. . doi:10.1093/molbev/msab032 MBE
Introduction differential selection. Such an approach can provide insights
Empirical, theoretical, and experimental studies suggest that on future evolutionary trajectories of tiger populations.
individual and population survival is contingent on genetic Results and Discussion
variability (e.g., Saccheri et al. 1998). For endangered species
that are characterized by long-term decline, small and frag- We used the 10 Genomics Chromium library preparation
mented populations, and unique selection pressures, popu- and Supernova assembler to de novo assemble a tiger ge-
lations may be characterized by low, but distinct standing nome. Based on Assemblathon2 statistics (Bradnam et al.
2013), this improved assembly corresponded to a 3.5-fold
genetic variation. Such distinct variation could result in dif-
increase in the contig N50 value to 1.8 Mb and a 2.5-fold
ferential probabilities of survival. Recent advances in sequenc-
Downloaded from https://academic.oup.com/mbe/advance-article/doi/10.1093/molbev/msab032/6133235 by guest on 15 March 2021
increase in the scaffold N50 value to 21.3 Mb (as compared
ing technology, development of population genomic models,
with Cho et al. [2013]; supplementary table 2, Supplementary
and improved computing power have revolutionized our
Material online). In addition, the resulting assembly had 1%
ability to read and interpret genomes, allowing quantification fewer ambiguous bases across all scaffolds (supplementary
of the sum total of genetic variation within individuals and table 2, Supplementary Material online). We also looked at
populations. gene completeness using BUSCOv4 (Sim~ao et al. 2015), which
For several endangered species, whole genome re- examines highly conserved orthologs. The new assembly
sequencing has revealed low species-level variation (e.g., resulted in an 8.2% increase in the number of BUSCOs found
Iberian lynx, Abascal et al. 2016), strong signatures of popu- as well as a 3% reduction in the number of fragmented
lation decline (e.g., mountain gorillas: Xue et al. 2015), and BUSCOs and a 5% reduction in the number of missing
recent inbreeding in isolated populations (e.g., wolves: Kardos BUSCOs. Repeat analysis yielded similar percentages of total
et al. 2018). Initial studies typically sequence high-coverage repetitive content (Maltig1.0: 41.71%, Pantig1.0: 40.12%) and a
genomes of a few individuals, often from ex situ collections or slight increase in the number of annotated genes (Maltig1.0:
voucher specimens. Sampling several extant populations and 19,950, Pantig1.0: 19,000). Overall, the new assembly yielded a
larger geographic scales is often challenging (but required) for substantially more contiguous and more complete genome
endangered species whose range spans several countries. assembly as compared with the previous version.
The tiger (Panthera tigris) is an iconic and charismatic en- We sequenced genomes from 65 individuals (fig. 1A, sup-
dangered species that once spanned 70 degrees of latitude plementary table 1, Supplementary Material online) at vary-
across Asia. It is estimated that between 2,154 and 3,159 tigers ing coverage (4.2f–32.9, median 14.4). Our samples
remain, which occupy less than 6% of their 1900 AD range included wild-caught and captive-bred tigers from four puta-
(Goodrich et al. 2015). Despite this recent range collapse, tive extant sub-specific regions (South Asia, Malayan penin-
tigers are present across 11 Asian nations, occupying diverse sula, East Siberia, and Sumatra). Details of samples used for
habitats including estuarine mangrove forests (the various analyses are in supplementary table 3, Supplementary
Sundarbans), dry deciduous forests (parts of India), tropical Material online. We were unable to sample the South China
rainforests (Malay Peninsula), and cold, temperate forests tiger (P. t. amoyensis), considered extinct-in-the-wild.
(Russian Far East). However, the specific adaptations of the Although the South China tiger is thought to be ancestral,
various populations to their habitats remain largely unknown. Liu et al. (2018) suggested uncertainty about the antiquity of
Tigers have been classified into four extant (and four ex- this population, since nuclear genomes were similar to those
tinct) subspecies (Nowell and Jackson 1996). However, ge- of Amur tigers.
netic and other data have suggested six (e.g., Luo et al.
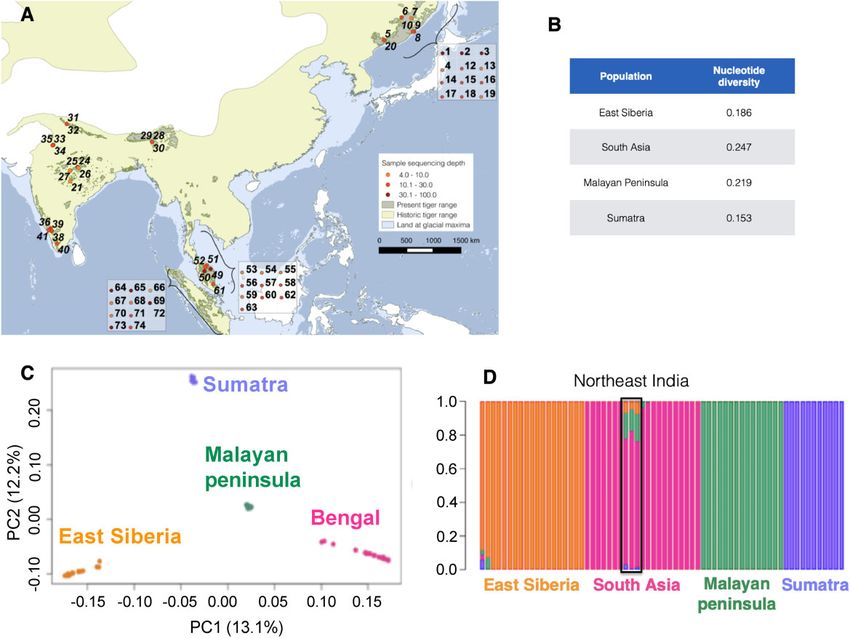
Population Structure
2004) or two (Wilting et al. 2015) subspecies/distinct popu-
Both model-based (ADMIXTURE) and model-independent
lations. Liu et al. (2018) presented the first analyses of
(PCA) analyses suggested that genetically distinct populations
genome-wide variation using voucher specimens across tiger
are concordant with earlier definitions of subspecies (as also
range, and their data and analyses strongly supported the suggested by Luo et al. [2019] and Liu et al. [2018], fig. 1C). We
antiquity and uniqueness of six extant subspecies. They in- find evidence for at least four global populations based on
ferred relatively old divergences (68,000 years ago) between cross-validation statistics (supplementary fig. 2,
subspecies with low subsequent gene flow (1–10%) and sig- Supplementary Material online). Tigers from northeast
natures of selection in Sumatran individuals. However, their India reveal some admixture with Malayan tigers and to a
sampling of the most populous (Jhala et al. 2015) and genet- lesser extent with other subspecies (fig. 1D). Models with
ically diverse tiger subspecies—the Bengal tiger—was limited higher complexities (supplementary fig. 3, Supplementary
across habitats. Material online) reveal substructure within India separating
Here, we emphasize sampling Bengal tigers from various south Indian tigers. However, higher model complexity fits
habitats and geographic locations within India and include the data poorly. In the PCA, PC1 separates the groups in a
three other subspecies found in the wild. We use these north-to-south direction whereas PC2 resolves along the east-
genomes to infer historical and recent evolutionary history to-west direction explaining more than 25% of the data be-
of tigers by investigating 1) population clustering within sam- tween them (PC1: 13.1%; PC2: 12.2%).
pled populations, 2) genomic variation, 3) possible signatures We henceforth refer to the geographic regions by their
of recent inbreeding, and 4) demographic history and sub-specific names (East Siberia: Amur; South Asia: Bengal;
2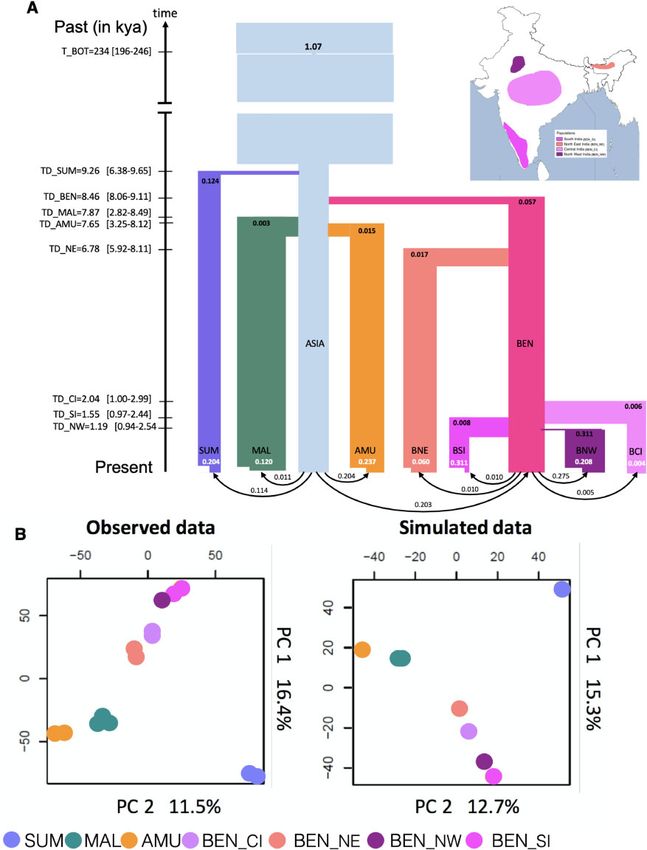
Evolutionary History of Tigers Informs their Conservation . doi:10.1093/molbev/msab032                                                MBE

                                                                                                                                                      Downloaded from https://academic.oup.com/mbe/advance-article/doi/10.1093/molbev/msab032/6133235 by guest on 15 March 2021
FIG. 1. (A) Map of tiger samples used in this study. Each number refers to an individual. Genomic sequence coverage for each sample is color-coded.
Wild samples (n ¼ 32) are represented on the map, whereas captive individuals (n ¼ 34) are in boxes. Sample details presented in supplementary
table 1 in SI, Supplementary material online. Historical and present range map courtesy IUCN (Goodrich et al. 2015), (B) nucleotide diversity (pi)
estimates for tigers from different regions, (C) principal component analyses (PCA) revealing genetic population structure in tigers and (D)
ADMIXTURE (K ¼ 4). Colors in both ADMIXTURE and PCA analyses denote individuals from the different geographical regions.

Malay Peninsula: Malayan; and Sumatra: Sumatran).                           tigers, somewhat reflective of samples originating from the
Additionally, PC1 shows stronger similarity between Bengal                  northern or southern Malayan peninsula (supplementary figs.
and Malayan tigers than Bengal and Sumatran tigers, consis-                 5 and 6, Supplementary Material online). Amur tigers did not
tent with the result from K ¼ 3 ADMIXTURE analyses (sup-                    demonstrate strong signatures of population sub-structuring
plementary fig. 3, Supplementary Material online). PC2 (12.2%               (supplementary figs. 5 and 6, Supplementary Material online).
variation) and PC3 (10.9% variation) further separate the four              Within subspecies, structure was confirmed in the additional
groups and also separated some individuals within popula-                   PC axes for the full data set (supplementary fig. 4,
tions (supplementary figs. 4 and 6, Supplementary Material                  Supplementary Material online). Although PC1, PC2, and
online). In contrast, PCA analysis of non-transcribed regions               PC3 separated putative subspecies (Amur, Bengal,
including only high-coverage individuals (coverage > 20)                   Sumatran, and Malayan), PC1 and PC2 were also used in
within the data set (Sumatran ¼ 3; Bengal ¼ 3, Malayan ¼ 3,                 the supplementary figure 6B, Supplementary Material online,
and Amur ¼ 3, supplementary table 6, Supplementary                          to separate the Bengal populations by geographic location
Material online) suggested that the Amur population is                      clearly (northwest India, south India, and central, north, and
much less differentiated and closer to the Malayan popula-                  northeast Indian tigers comprise three distinct groups).
tion (fig. 3B).                                                                Pairwise FST’s (supplementary table 4, Supplementary
   PCA within subspecies (supplementary fig. 5,                             Material online) were approximately equal between subspe-
Supplementary Material online) suggested that Bengal tigers                 cies and consistent with geographic patterns. The FST be-
cluster into four sub-groups: (1) south India, (2) central and              tween the Malayan and Bengal groups (0.164) was the
north India, (3) northeast India, and (4) northwest India.                  lowest, whereas Amur and Sumatran FST (0.318) were highest,
Some genomic sub-structuring was apparent in Malayan                        consistent with patterns seen in both ADMIXTURE and PCA.
                                                                                                                                                 3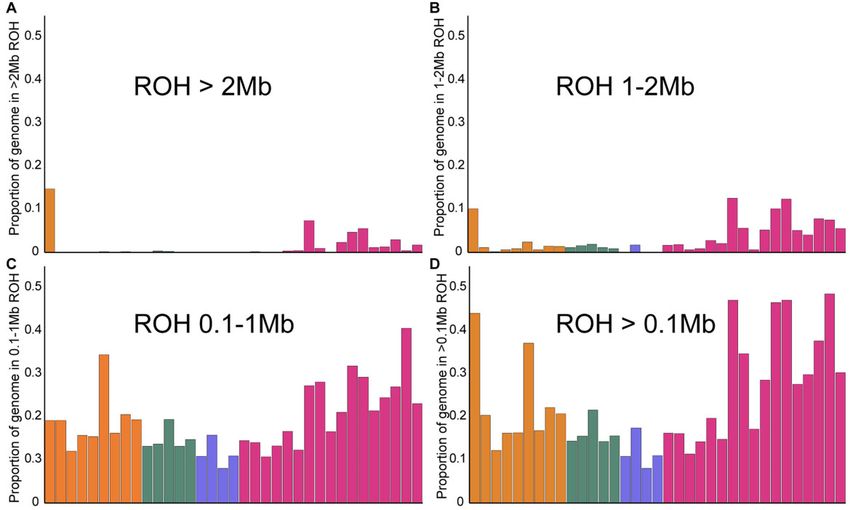
Armstrong et al. . doi:10.1093/molbev/msab032                                                                                     MBE

                                                                                                                                                  Downloaded from https://academic.oup.com/mbe/advance-article/doi/10.1093/molbev/msab032/6133235 by guest on 15 March 2021
FIG. 2. ROH inferred based on different run lengths: (A) > 2 Mb, (B) 1–2 Mb, (C) 100 kb–1 Mb, and (D) total ROH, which includes all run lengths
greater than 100 kb.

FST between putative Bengal tiger subpopulations in India                 online). This suggests that our sampling for these populations
(supplementary table 5 Supplementary Material online)                     is likely representative of the diversity levels, although more
revealed high subdivision.                                                sampling would provide better resolution for some analyses.
   Since we sampled across landscapes within subspecies, we                   Historical demography and recent inbreeding are detect-
were able to compare population structuring within the four               able through runs of homozygosity (ROH) in the genome
subspecies. Population genetic substructure is highest in the             (Kardos et al. 2018; Pemberton et al. 2012). We quantified
Indian subcontinent, whereas other tiger subspecies are ge-               long (>2 Mb) and intermediate (100 kb–1 Mb, 1–2 Mb) ho-
netically uniform (Amur) or less differentiated (Malayan). Our            mozygous stretches as well as the proportion of more than
results contradict suggestions of population structure in wild            100-kb-long ROH in the genome for several individuals (fig. 2).
Amur tigers (Sorokin et al. 2016), substantiate the significance          Somewhat surprisingly, individuals from the demographically
of structure in Bengal tigers, and uncover hitherto unknown               large Indian tiger population revealed a high proportion of
structure in tigers from the Malayan peninsula. Northeast                 their genomes in long ROH, although variation in total ROH is
tigers are the most distinct of Bengal tigers, although closer            high (fig. 2 and supplementary fig. 8, Supplementary Material
to Bengal tigers than to any other subspecies. The northeast              online). Individuals from some populations (e.g., Central
Indian tigers in this study are from the state of Assam and               India) have low ROH, whereas some of the most inbred
sampling other, more eastern populations from this remote                 wild tigers in the world appear to be from India (e.g., from
region might yield interesting insights, as would samples from            Ranthambore tiger reserve, Periyar tiger reserve, and
Indo-Chinese tigers.                                                      Kaziranga tiger reserve). Results were qualitatively similar
                                                                          when a sliding window approach was used to estimate
Genetic Variation and Runs of Homozygosity                                ROH (supplementary fig. 8, Supplementary Material online).
We compared genome-wide variability between tiger subspe-                     Our data and analyses reveal that Bengal tigers have the
cies/subpopulations to other cats (N ¼ 7) and endangered                  highest amount of variation when considering genome-wide
species (N ¼ 8, including endangered cats). Tigers had rela-              diversity estimates. This is to be expected given historical
tively high species-level genetic diversity (supplementary fig. 7,        records of Bengal tiger occupancy (Goodrich et al. 2015)
Supplementary Material online).                                           across a large variety of habitats, where they subsist on a
    Bengal tigers had the highest nucleotide diversity (pi;               wide range of prey species that range from the large rhinoc-
fig. 1B), whereas Sumatran tigers had the lowest.                         eros and gaur to the small hog deer and barking deer. Current
Rarefaction analysis (ADZE; Szpiech et al. 2008) revealed                 population sizes of tigers in India and previous genetic studies
that diversity estimates were approaching saturation for all              based on a limited number of DNA microsatellite markers
populations (supplementary fig. 12, Supplementary Material                (Mondol et al. 2009) are also concordant with high genetic
4
Evolutionary History of Tigers Informs their Conservation . doi:10.1093/molbev/msab032 MBE
diversity in Bengal tigers. In contrast, certain Bengal tiger supplementary fig. 13, Supplementary Material online).
populations reveal signatures of potentially recent inbreed- Demogenetic analyses supported a very strong bottleneck
ing/founder events or indicate population bottlenecks and for the species occurring around 234,000 years ago, with
isolation. High total genetic variation could reflect the large most remaining lineages coalescing rapidly, which is consis-
numbers of tigers prior to intense hunting in India just a tent with a speciation event. This timing was consistent with
century ago (Rangarajan 2006). signatures of population decline in the PSMC analysis (sup-
A comparison among populations revealed Amur tiger plementary fig. 9, Supplementary Material online). The best-
genomes harbor fewer long ROH than Bengal tigers. A closer fit scenario, which supported divergence of the Sumatran
look at landscapes and habitats in India and the Russian Far tiger subspecies, correlates with timing of sea level rise
Downloaded from https://academic.oup.com/mbe/advance-article/doi/10.1093/molbev/msab032/6133235 by guest on 15 March 2021
East reveal strong differences: India is dominated by variable (Heaney, 1991) and separation of the island of Sumatra.
habitats amidst a matrix of extremely high human population Note however that we constrained this divergence to post-
densities, whereas in the Russian Far East, human density is date the last-glacial maximum (18,000 years ago or younger).
low, and habitat is more continuous. Indeed, landscape ge- Recent models of sea level rise suggest isolation from the
netics studies have suggested that high human population mainland no later than 7,000 years ago (Bradley et al. 2016).
density is a barrier for tiger movement (Thatte et al. 2018). However, to be sure that our recent divergence times did not
We suggest that extreme fragmentation and high human depend on this constraint, we estimated parameters of a
population density in India have resulted in isolated popula- model without any upper bound on divergence times, which
tions, where individuals may be more likely to mate with led to overall similar values for most parameters and diver-
relatives. In contrast, despite low Amur tiger population den- gence times less than 11,000 years (supplementary table 8,
sities in the Russian Far East, individual movement is not Supplementary Material online). Although paleohabitat re-
hindered by significant barriers, and the population is more construction suggests the presence of a savannah corridor
panmictic, with little to no sign of geographic population between the Malayan peninsula and the island of Sumatra
substructure. (Bird et al. 2005), overall, our divergence estimates (between
The observation of high variance in long ROH in Bengal tigers in the Malayan peninsula and the island of Sumatra) are
tigers underscores the importance of including genome-wide among the most recent reported for any taxa (see Leonard
sampling across multiple individuals and within regions, as et al. 2015). Husson et al. (2019) suggest that divergence
single representatives may be a poor reflection of inbreeding estimates so far may be potentially upwardly biased because
and variation for any given population and do not provide a they are based on mitochondrial data alone. Estimated mi-
context with which to evaluate significance across subspecies gration rates were very low, with all populations receiving
and populations. In the future, simulations that incorporate fewer than one migrant per generation; populations have
realistic recombination rates could be used to model and been quite isolated since their initial early Holocene divergen-
disentangle the cumulative impacts of recent demographic ces. Additionally, we found that Sumatran and Bengal pop-
history and very recent inbreeding on distributions of ROH in ulations show evidence of a founding event, but Amur and
the genome. Malayan populations do not. Both Sumatran and Amur tigers
showed evidence of strong recent bottlenecks.
Demographic History of Subspecies We further modeled the divergence within Bengal tigers
We first reconstructed the past demographic history of each into four populations: northwest India, central India, south
population with pairwise sequentially Markovian coalescent India, and northeast India. Since PCA suggests that central
(PSMC) (supplementary fig. 9, Supplementary Material on- and north Indian tigers are a single population and north
line), and our results paralleled those in Liu et al. (2018): all Indian tigers were not sequenced at high coverage, we only
populations of tigers exhibit similar evolutionary patterns of included central Indian tigers to represent this cluster in the
population size decline. demographic analyses. We assessed the robustness of the
We expect recent bottlenecks to strongly dominate tiger northeast population being a part of the Bengal subspecies.
evolutionary history. As a result, we chose the site frequency In order to do so, the northeast population was modeled as
spectrum (SFS)-based methods (vs. others, e.g., GPhoCS) be- an independent subspecies and allowed to diverge directly
cause they are better at detecting recent events (Beichman from the Asian metapopulation. However, such a model has a
et al. 2018). We inferred SFS from 259,499 SNP sites in non- poorer fit to the data than if northeast Indian tigers are con-
transcribed regions at least 50 kb away from any known gene. sidered to be part of the Bengal subspecies (log10 Likelihood
These were selected to minimize the effect of background difference between model is 37; fig. 3B). Within Bengal tigers,
selection and GC-biased gene conversion. We investigated divergences are extremely recent (within the last 2,000 years),
subspecies divergence, population size changes, and gene except for the northeast tigers, which diverged early
flow. The best fit scenarios supported a very recent (6,800 years ago) after the separation of Bengal tigers
Holocene divergence (between 7,500 and 9,200 years ago, 8,400 years ago from the ancestral Asian metapopulation.
i.e., 1,500 and 1,840 tiger generations ago) of all tiger subspe- Within India, the northwest population underwent a strong
cies (fig. 3A) from an ancestral population. Pairwise diver- bottleneck at the time of its founding. Recent bottlenecks
gence estimates based on hPSMC (Cahill et al. 2016) were most severe in the northwest and south populations,
supported a relatively recent divergence (between 9,000 whereas the northeast and central populations showed rela-
and 20,000 years ago for different subspecies pairs, tively weaker bottlenecks. These inferences were consistent
5Armstrong et al. . doi:10.1093/molbev/msab032 MBE
Downloaded from https://academic.oup.com/mbe/advance-article/doi/10.1093/molbev/msab032/6133235 by guest on 15 March 2021
FIG. 3. Estimated demographic history of Asian tigers: Sumatra (SUM: lavender), Malayan (MAL: dark green), Amur (AMU: orange) and ancestral
Bengal (BEN: hot pink), ancestral Asian metapopulation (Asia, light blue). The Bengal tigers further differentiated into North East (BEN_NE, salmon
pink), Central (BEN_CI, light pink), South (BEN_SI, dark pink), and North West (BEN_NW, purple) populations. The inset map presents the
geographical locations of these populations. (A) Founder effects are represented as horizontal lines with widths inversely proportional to intensity.
Recent population contractions with intensity inversely proportional to current population size (t/2N) are reported in white text. Population bar
widths are approximately proportional to estimated population sizes. Divergence (T_DIV) and bottleneck times (T_BOT) are reported in ky
(thousand years ago), assuming a mutation rate of 0.35 108 and 5 years per generation. Times 95% CI values are shown within brackets on the
left of the time arrow. Estimated values and associated 95% CI of all parameters are reported in supplementary tables 7 and 9 in SI, Supplementary
material online, and (B) comparison of PCA first two PC axes computed on observed and simulated data. The simulated scenario corresponds to
that shown in (A), with parameter values taken from supplementary tables 7 and 9 in SI, Supplementary material online.
with overall ROH for northwest and some southern individ- and have been isolated from each other for as long as 8,500
uals. Overall, tiger populations from all subspecies revealed to less than 2,000 years (fig. 3A). Genomic divergences may
signals of strong, recent bottlenecks, except central and reflect loss of connectivity due to sea level rise, which has
northeast Bengal tigers. separated the formerly continuous Sahul subcontinent of
The variety of analyses we conducted (model-based infer- southeast Asia into isolated islands, and changing environ-
ence, PCA, FST, demographic modeling) revealed that tigers ments due to human population size increase, including the
from different geographic locations are genetically distinct rise of agriculture and climatic change of the mid-late
6Evolutionary History of Tigers Informs their Conservation . doi:10.1093/molbev/msab032 MBE
Holocene. We caution that small sample sizes and assumed differentiation if mating between members of separate pop-
mutation rate may limit our ability to robustly estimate re- ulations was frequent and successful. However, despite the
cent divergences (such as those between Bengal tiger possibility of long-distance dispersal, our models suggest that
populations). migration rates between tiger populations have been rela-
Beichman et al. (2018) delineate five basic approaches to tively low, emphasizing separate recent evolutionary histories,
inferring demographic history from genomic data, which in- and that individual tiger movements may not represent pop-
clude Approximate Bayesian Computation (the most flexi- ulation histories.
ble), SFS-based approaches, PSMC/MSMC, IBD/IBS, and G-
PhoCS and recommend SFS and ABC-based methods for in- Genome Scans for Selection
Downloaded from https://academic.oup.com/mbe/advance-article/doi/10.1093/molbev/msab032/6133235 by guest on 15 March 2021
ference of recent history. SFS-based methods have been used We investigated how genetic patterns might have been im-
in several endangered species (expected histories of recent pacted by natural selection in the four tiger subspecies
decline), for example, see red pandas (Hu et al. 2020) where (Amur, Bengal, Malayan, and Sumatran). We computed a
sample sizes and effective size are comparable to our study or statistic, mPBS [metapopulation branch statistic, a simple
in ancient DNA-based human studies (e.g., Malaspinas et al. extension of the PBS statistic of Yi et al. (2010), see
2016). Overall, we do not expect our inferences of recent Materials and Methods section], measuring the length of
history to be biased by effective size of the species. the branch leading to a given subspecies since its divergence
Potential biases in the SFS due to our small sample sizes from the others (fig. 4A and Materials and Methods section).
may result in fewer identified singletons, but given histories The genome-wide distributions of the mPBS revealed that
dominated by recent bottlenecks, we do not expect an SFS Bengal and Malayan populations had the lowest average val-
with a large number of singletons. Further, we conducted ues, suggesting short terminal branches subsequent to the
exploratory analyses with and without singletons, and this divergence of these two populations from the hypothetical
did not change our inferences. Finally, theoretical results sug- metapopulation (fig. 4B–F). On the contrary, Amur and
gest that accuracy of the results is affected by the number of Sumatran tigers had high values on average (fig. 4B–F).
sites, but not sample size (Terhorst and Song 2015). We observed little difference between transcribed and
In comparing our demographic history results to Liu et al. non-transcribed regions in mPBS distributions, suggesting
(2018), the striking difference is divergence times (estimates no strong differential impact of background or positive selec-
of effective size are comparable, we cannot compare geneflow tion in tiger coding regions (supplementary fig. 10,
because our model includes an “Asian metapopulation” and Supplementary Material online). Both tails of the distribution
theirs does not). Although Liu et al. (2018) find older diver- are enriched (we did not filter for mutation types), possibly
gence, our results suggest recent divergence. It is possible that caused by biased gene conversion (supplementary fig. 10,
the differences that we observe are because of the methods Supplementary Material online). Note that average mPBS
used, GPhoCS is better at detecting older events, and SFS- values were higher when considering only individuals with
based methods are effective for recent events. We re-iterate average coverage > 10 than when comparing fewer indi-
that our estimates of divergence time are most sensitive to viduals with highest coverage (supplementary fig. 10,
assumptions of mutation rate (not effective size or sample Supplementary Material online).
size), but these are the same as used in Liu et al. (2018). Future Overall, the mPBS distribution obtained under the neutral
research should integrate data sets and compare a variety of demographic model (fig. 4B) fit very well with the observed
demographic inference methods. In the case of tigers, con- distribution (supplementary fig. 11, Supplementary Material
ducting analyses with hundreds of genomes will not be pos- online), implying that most observed differences between
sible from wild individuals alone and will require reliance on populations could be explained by their demographic history.
museum specimens. We predicted high mPBS values in Amur tigers and Sumatran
Although the timing and severity of the events differenti- tigers where small effective sizes would yield high levels of
ating tiger subspecies vary, our data and analyses confirm genetic drift, but the observed values are even higher than
previous inferences (Liu et al. 2018) that the four putative those expected (supplementary fig. 11, Supplementary
subspecies of tiger are valid both geographically and geneti- Material online), suggesting a possible effect of natural selec-
cally. The order of divergence of the subspecies from the tion on genomic diversity in these subspecies. In contrast, we
ancestral tiger metapopulation is partially consistent with observed no apparent deviation of observed mPBS values
previous suggestions of tigers being isolated in Sumatra first, from a purely neutral model in Bengal and Malayan popula-
likely due to sea level rise (consistent in sequence but not in tions. Our ability to detect high mPBS values is contingent on
timing with Liu et al. [2018]), closely followed in time by those the specific genomes that were used in our analyses and
in India, then last by populations in Siberia and Malaysia (not sample size constraints. For example, the number of Amur
consistent with Liu et al. [2018]). and Bengal tigers used in this analysis was larger than the
Theoretical predictions (based on body size: Sutherland numbers of Sumatran and Malayan tigers, which could partly
et al. [2000]) and empirical results (genetics: Joshi et al. explain the additional power to detect outliers. Furthermore,
[2013]; camera trapping: Singh et al. [2013]) suggest that in- varying coverage can have an impact on our results. A lower
dividual tigers can move extraordinary distances (e.g., average coverage in a given population will lead to an under-
300 km), even across human-dominated landscapes. Such estimation of diversity within the population. We would then
long-range movement would result in relatively low genetic overestimate FST and, consequently, mPBS. However, as we
7Armstrong et al. . doi:10.1093/molbev/msab032 MBE
Downloaded from https://academic.oup.com/mbe/advance-article/doi/10.1093/molbev/msab032/6133235 by guest on 15 March 2021
FIG. 4. Genome scan for selection: (A) We present the mPBS statistic with a hypothetical model where the four populations diverge from a
metapopulation, and where selection acts in both the Amur and Sumatra lineages and (B) the global distribution of observed mPBS for each
population. Panels (C–F) correspond to the genome-wide distributions of the statistic for (C) Amur, (D) Bengal, (E) Malayan, and (F) Sumatran
tigers as a function of the genomic position. Alternating light and dark colors indicate different scaffolds.
performed the selection analysis on the 34 samples with > 10 identified in Amur tigers, 4 have an unspecific function and
average coverage only (see ^Materials and Methods sec- the 11 others are involved in lipid processing and metabolism
tion) and filtered genotypes based on depth of coverage and (supplementary table 10, Supplementary Material online).
genotype quality, we expect to limit such biases. The genes responsible for the enrichment in fat
Enrichment tests revealed an excess of moderately high metabolism-related GO terms were all included in the cellular
values in Amur and Sumatran tigers rather than a few very lipid metabolic process (GO: 0044255). These included, for
extreme values, an observation that is compatible with the example, the apolipoprotein B receptor or caveolin-1 that are
effect of polygenic selection rather than hard selective sweeps. involved in the modulation of lipolysis. Fat metabolism
In an attempt to identify biological functions putatively tar- enzymes included phosphatidate phosphatase (LPIN2), phos-
geted by selection, we used functional enrichment tests pholipase B-like 1 (PLBD1), and very-long-chain (3R)-3-
(Daub et al. 2013; Gouy et al. 2017) based on mPBS values hydroxyacyl-CoA dehydratase 2. We also identified genes in-
computed on all individuals (Amur and Sumatran) with av- volved in the mitochondrial respiratory chain: a cytochrome
erage coverage greater than 10. We mapped the top 0.1% P450 subunit (CYP1A2) and the mitochondrial lipoyl syn-
regions with highest mPBS values to annotated genes thase. Cardiolipin synthase is involved in the synthesis of
(650 kb flanking regions). One hundred and nineteen and cardiolipin, an important phospholipid of the mitochondrial
80 genes (in Amur and Sumatran tigers, respectively) were membrane critical to mitochondrial function. Finally,
found within these top 0.1% regions. We identified 15 statis- thromboxane-A synthase is involved in vasoconstriction
tically significant gene ontology (GO) terms in Amur tigers and blood pressure regulation.
and 5 in Sumatran tigers (supplementary table 10, In Sumatran tigers, significant GO terms were related to
Supplementary Material online). Out of the 15 GO categories cell development regulation: regulation of neuron projection
8Evolutionary History of Tigers Informs their Conservation . doi:10.1093/molbev/msab032 MBE
development (GO: 0010975), regulation of anatomical struc- body size, such as the genes found in the Regulation of ana-
ture size (GO: 0090066), and regulation of cell development tomical structure size GO term (supplementary table 10,
(GO: 0060284). These four terms contain the same six genes: Supplementary Material online). We caution that it is difficult
tyrosine-protein kinase (RYK), E3 ubiquitin-protein ligase to truly distinguish among all population genetic processes,
(RNF6), low-density lipoprotein receptor-related protein 1 especially selection, without more data, and assignments of
(LRP1), angiotensin-converting enzyme (ACE), Rap1 GO categories designed from model organisms are only a
GTPase-activating protein 2 (RAP1GAP2), and B2 bradykinin substitute for more definitive tests of selection. Differences
receptor (BDKRB2). These genes are involved in morpholog- between our study and Liu et al. (2018) may be due to the
ical development, and selection targeting these loci may help improved quality of the genome we built and mapped to,
Downloaded from https://academic.oup.com/mbe/advance-article/doi/10.1093/molbev/msab032/6133235 by guest on 15 March 2021
to explain why Sumatran tigers are in general smaller than which generally increases the accuracy of gene finding and
other subspecies. Two other terms related to toxic substance annotation software. Alternatively, Liu et al. (2018) had larger
processing, are response to toxic substance (GO: 0009636) sample sizes for Sumatran tigers, and the differences could be
and organophosphate biosynthetic process (GO: 0090407). due to the use of different data sets. However, the locus
identified as under selection by Liu et al. (2018) had normal
What Evolutionary Processes Dominate the Evolution levels of variation in our Sumatran tiger genomes. Careful
of Tigers and Their Subspecies? sampling of known origin wild individuals, high coverage se-
Our models and analyses suggested relatively recent diver- quencing, and synthetic analyses will be critical to resolve
gence between tiger populations (a maximum of 20,000 or so these differences.
years vs. 68,000 years inferred by Liu et al. [2018]), highlighting We did not detect signatures of selection or extensive gene
the role of drift/stochastic processes in recent tiger evolution. flow into Malayan and Bengal tiger genomes, suggesting that
Our inference is contingent on a mutation rate of 3.5 108 their genomic variation was due primarily to drift. Figure 2
from Liu et al. (2018). Discrepancy between our and Liu et al. (see supplementary tables 7 and 9 for magnitude of recent
(2018) estimates could also be due to differences in filtering bottleneck) suggests that at least some Indian tigers have
criteria (Liu et al. [2018] use min DP ¼ 4, min GQ ¼ 20, experienced intense founder events (e.g., BEN_NW), intense
whereas we have used minDP ¼ 10, and min GQ ¼ 30) or recent bottlenecks and population structuring, and mPBS,
the sites considered for the analyses. We used a restricted set and figure 4 substantiates a relatively stronger role of drift
of sites that were far from coding regions and thus minimally (compared with Malayan tigers) in shaping genome-wide
affected by background selection and biased gene conversion variation.
(about 100 Mb worth of data), whereas Liu et al. (2018) used
about 44 Mb worth of data (for GPhoCS analyses), back- Conservation Implications
ground selection, or biased gene conversion. Our results con- With different individuals and much larger samples size for
sistently underline the genome-wide importance of genetic several subspecies, we show that tigers (from the four sam-
drift. Despite recent divergence, we found significant genetic pled subspecies) have recently differentiated through con-
differentiation between tiger populations, possibly because of trasting histories of drift and selection, making each
the intense bottlenecks these populations have experienced. subspecies evolutionarily unique. For Amur tigers, our results
Our results suggested that Amur tiger genomes demon- from population structure analyses, demographic history-
strate signals of selection, with possible adaptations to colder based divergence, and signatures of possible selection reaffirm
environments. We do not think that the signatures of selec- their unique management status [as suggested by Liu et al.
tion we identify in Amur tigers (while Liu et al. [2018] did not) (2018) and Wilting et al. (2015)]. Increasing population size
is due to our larger sample sizes. Genes and pathways in- and enabling gene flow over the long term might augment
volved in lipid metabolism are under selection in two human the currently low genetic diversity in this population. For
populations that live in cold environments, including Bengal tigers, recent fragmentation and ensuing loss of con-
Greenlandic Inuit (Fumagalli et al. 2015) and Indigenous nectivity appear to result in significant autozygosity. Restoring
Siberians (Hallmark et al. 2018). Polar bear genomes also re- and maintaining gene flow between populations through
veal signatures of selection on lipid metabolism genes (Liu habitat corridors may be more important (along with increas-
et al. 2014). Understanding the distribution of adaptive var- ing population numbers) here. Assisted geneflow could be
iants could be important for future conservation efforts, es- considered as a management strategy, especially when in-
pecially if priority was placed on preserving these cold- breeding is associated with loss of fitness and potentially in-
adapted populations, which may be disadvantaged under breeding depression. Within Bengal tigers, we suggest that the
future warming scenarios. management status of northeast Indian tigers be re-evaluated
Sumatran tigers appear to have experienced strong genetic given their antiquity and potential genetic distinctiveness
drift following vicariance from mainland southeast Asia, (Kolipakam et al. 2019). The surprisingly high (relative) ge-
maintained a smaller effective population size, and have ex- netic variation and population differentiation in Malayan
perienced a strong recent bottleneck. Although Liu et al. tigers bodes well for their future survival. It will be critical
(2018) suggested that selection for body size targeted the for future conservation efforts to prioritize population recov-
ADH7 gene, we did not detect any signature of selection at ery and gene flow through connectivity and to promote pop-
this locus in our Sumatran samples. However, we identify ulation size increases. Critical to such action is a better
alternative candidate genes that are potentially involved in understanding of within population genetic variation using
9Armstrong et al. . doi:10.1093/molbev/msab032 MBE
spatially explicit, non-invasive sampling (e.g., Khan et al. 2020). the standard pipeline. We refer to this assembly as Maltig1.0
Finally, Sumatran tigers should be managed separately be- hereafter.
cause like Liu et al. (2018) and Wilting et al. (2015), our results
re-iterate their uniqueness. Their genomes show signatures of Whole Genome Resequencing and Variant Discovery
selection for genes regulating body size [broadly consistent Details on DNA extraction, library preparation, and variant
with the findings in Liu et al (2018)]. discovery methods can be found in Supplementary Material
In summary, ongoing human impacts like fragmentation online.
will likely continue to disrupt natural evolutionary processes
in wild tigers. Managing local populations to minimize human Population Structure
Downloaded from https://academic.oup.com/mbe/advance-article/doi/10.1093/molbev/msab032/6133235 by guest on 15 March 2021
We first investigated admixture and structure between pop-
impacts maybe the key to species survival and the important
ulations using Plink2 (Chang et al. 2015). We used VCFtools to
conservation strategy for the anthropocene. Additional his-
filter the initial variant call file using “max-missing 0.95” and
torical and genomic sampling may provide an informed road-
“maf 0.025” and removed sites with missing data and rare
map for genetic rescue and augmentation. Considering the
variant calls. We then converted to Plink’s “.ped/.map” format
contrasting results found between our study and those from
using VCFtools and subsequently converted to “.bed/.bim/
Liu et al (2018), it is also a reminder that we need to carefully .fam” format within Plink2 using the flag “–make-bed.” PCA
and critically interpret the results from genomics analyses for was then run on the resulting bed file using the flag “–pca 10”
endangered species with limited sample sizes, especially when that computed the variance-standardized relationship matrix.
they could impact management decisions. It is clear that not PCAs were then plotted using R. For smaller runs, an addi-
all the questions regarding tiger evolution have been defini- tional step was added within Plink2 to first calculate the fre-
tively answered despite two wide-range sampling efforts. quencies using the flag “–freq.” Subsequently, PCA was run
Ongoing method development and increased collaboration using the “–pca” flag and inputting the frequency file using
will help gain better insights into the evolutionary history of the “–read-freq” flag. We used this protocol on the vcf with all
species of conservation concern and better advice for their individuals, and subsequently, we divided the vcf into the
futures. putative subspecies for within subspecies runs.
The program ADMIXTURE was used to infer structure
Materials and Methods between populations and inform clusters that represent pop-
Sample Collection ulations with distinct histories (Alexander et al. 2009).
We obtained tissue, blood, or serum samples from as many ADMIXTURE uses maximum likelihood-based models to in-
geographically distinct tiger populations as possible. This fer underlying ancestry for unrelated individuals. We used the
amounted to 65 samples from four tiger subspecies including filtered data set (VCFtools max-missingness cutoff of 95%,
21 Bengal tigers (P. t. tigris), 19 Amur tigers (P. t. altaica), 15 minor allele frequency cutoff of 0.025) and resulting Plink
Malayan tigers (P. t. jacksoni), and 11 Sumatran tigers (P. t. formatted files for input into the software. In order to infer
sumatrae). A final list of samples sequenced, and their sources the most likely value of K, values of 2–8 were run. We also
are available in supplementary table 1, Supplementary performed K validation in order to compute the cross-
Material online. We also included one already sequenced validation error for each value of K, by using the “–cv” flag
sample, which brought the sample total to 66 (see supple- within the program. The value with the least error is infor-
mentary table 1, Supplementary Material online). mative of the best value of K for the data.
Reference Assembly Sequencing and de Novo Rarefaction Analysis
To ensure that our data were reflective of the diversity within
Assembly
each subspecies/unit as defined by ADMIXTURE, we used the
In order to better understand genome-wide variation and call
program ADZE (Szpiech et al. 2008). ADZE runs a rarefaction
variants reliably, we first built a new tiger genome assembly
analyses on polymorphism data in order to estimate the
using the 10 Genomics Chromium Platform for a wild-
number of alleles private to any given population (not found
caught Malayan individual. We received whole blood from
in any other population), considering equal-sized subsamples
a wild born Malayan tiger (P. t. jacksoni) sampled by the El from each input population. In addition, the program calcu-
Paso zoo, Texas on 7/28/2016, collected as part of a routine lates distinct alleles within each population. We calculated
health check-up. We immediately froze the sample at 80 C the private alleles across the four main populations/sub-
until it was shipped on dry ice to the Barsh lab at species as designated by the ADMXITURE software, in addi-
HudsonAlpha for extraction and delivery to the Genome tion to the distinct alleles within each of the four populations
Services Lab (GSL) at HudsonAlpha Institute for individually.
Biotechnology, Huntsville, Alabama. DNA was extracted
and purified using the Qiagen MagAttract HMW DNA kit. Population Differentiation and Diversity
GSL staff prepared a linked-read sequencing library using the We calculated pairwise FST between each subspecies group as
Chromium controller. The library was sequenced on one lane defined by ADMIXTURE using VCFtools. Variant call data
of a HiSeqX. We assembled the genome using the SuperNova were subdivided into sub-species based on PCA (Bengal,
assembly software (1.1.4) provided by 10 Genomics using Sumatran, Amur, and Malayan as subgroups) and were
10Evolutionary History of Tigers Informs their Conservation . doi:10.1093/molbev/msab032 MBE
used to compute pairwise FST between each group. SUM individuals, three BEN individuals from South India
Nucleotide diversity (pi) was calculated using VCFtools. (BEN_SI), four MAL individuals, and three AMU individuals,
In order to detect the number of single nucleotide variants, which all had >20 coverage on average (see list in supple-
the data were filtered using VCFtools (Danecek et al. 2011) to mentary table 3, Supplementary Material online). We mod-
a minimum base quality of 30, genotype quality (GQ) of 30, eled the four-subspecies as belonging to a large Asian
and depth of 10. Additionally, we filtered for minor allele metapopulation, from which they would have diverged
frequency of 0.025 and allowed a maximum 5% missing some time ago while still receiving some continuous gene
data in any loci. RTG tools (https://www.realtimegenomics. flow from the metapopulation. Note that this continent–is-
com/products/rtg-tools) vcfstats were used to calculate the land population structure amount to modeling a set of pop-
Downloaded from https://academic.oup.com/mbe/advance-article/doi/10.1093/molbev/msab032/6133235 by guest on 15 March 2021
total number of heterozygous SNP sites for each individual. ulations having gone through a range expansion (Excoffier
These values were then plotted alongside comparable esti- 2004). We assumed that each of the four subspecies could
mates for other species reported in Abascal et al. (2016). have gone through two distinct bottlenecks, one that would
have occurred at the time of the separation from the Asian
Ancient Demographic History metapopulation to mimic some initial founder effect and one
PSMC (Li and Durbin, 2011) is a single genome method to that would be recent to mimic habitat deterioration. We also
detect historical effective population size. In order to estimate assumed that the Asian metapopulation could have gone
historical population size changes for the different subspecies, through an ancestral bottleneck sometime in the past.
we removed sex chromosome scaffolds for AMU1, MAL1, The second step used estimated parameters in a more
SUM2, and BEN_SI3 (the highest coverage individual for complex model including the specific demography of four
each subspecies). The procedures for sex chromosome filter- Bengal tiger populations (24 new additional parameters).
ing can be found in the supplementary text (and supplemen- To this aim, as in the previous analysis, we selected individuals
tary fig. 1, Supplementary Material online). Additionally, sites with the highest coverage (>20) from each population (see
with a minimum of half the average sequencing depth or supplementary table 1, Supplementary Material online, sam-
twice the average sequencing depth were filtered out while ples used represented in supplementary table 3,
calling variant sites. The resulting scaffolds were then used to Supplementary Material online). No individuals from
estimate the effective population size across 34 time intervals BEN_NOR were included as their coverage was low, and
as described in Li and Durbin (2011). One hundred rounds of they are part of the same genetic cluster as BEN_CI. To cor-
bootstrap replicates were performed. rectly estimate the relationship between these populations
and the other subspecies, we also included three MAL indi-
Runs of Homozygosity
viduals in this analysis. The new model included all the
To estimate ROH, we used the filtered SNPs from the auto-
parameters from the previous model, fixed at their previously
somal scaffolds. Individuals with more than 10 average cov-
erage were grouped as per subspecies. We used BCFtools/RoH estimated values, except some parameters re-estimated for
(Narasimhan et al. 2016) to estimate ROH. The autozygous the BEN_SI population, which was now assumed to have
runs obtained were classified into various lengths (runs be- diverged from an Indian metapopulation at some time in
tween 10 and 100 kb, runs between 100 kb and 1 Mb, and the past, like the other three BEN tiger populations. We
runs longer than 1 Mb). Proportion of genome in ROH for also estimated the size and the divergence of the BEN meta-
1 Mb was estimated as the total length of the genome in population from the Asian metapopulation. We allowed the
more than 1 Mb runs divided by the total length of autosomal sampled BEN populations to have gone through two bottle-
scaffolds. Similar calculations were made for 100 kb to 1 Mb necks (an initial founder effect and a recent bottleneck). The
runs and for 10–100 kb runs except the length of the genome parameters estimated in these two steps are shown in sup-
longer than 1 Mb and 100 kb were subtracted from total plementary tables 7 and 9, Supplementary Material online,
length of autosomes, respectively. We used an additional slid- and the resulting demography is sketched in figure 3. Details
ing window approach, details of which can be found in the of parameter estimation are in the supplementary method,
supplementary methods. Supplementary Material online.
Demographic History with SFS and Coalescent Models Genome Scan for Selection
Demographic Models To detect the footprints of natural selection in different tiger
Data filtering procedures for the demographic models can be subspecies, we analyzed individuals with coverage > 10
found in the supplementary text. Using the program fastsim- from four subspecies (n ¼ 34). We filtered out genotypes
coal 2 (Excoffier et al. 2013), we performed demographic with depth of coverage < 10 (DP) and GQ < 30]. We ex-
estimations of the model shown in figure 3A on two data cluded scaffolds shorter than 1 Mb. We kept sites with no
sets in two consecutive steps such as to reduce the number of missing data among the 34 individuals.
parameters to estimate simultaneously. The first step con- We considered the four subspecies as four populations and
sisted in estimating the demography (24 parameters) of four computed pairwise FST values along the genome over 50-kb
tiger subspecies (Malaysia—MAL, Sumatra—SUM, Bengal— sliding windows (with a step of 10 kb) using the R package
BEN, and Amur—AMU) using the individuals of each sub- PopGenome (Pfeifer et al. 2014). FST are computed with the
species that had the highest coverage. We thus selected three estimator described in Hudson et al. (1992). We then
11Armstrong et al. . doi:10.1093/molbev/msab032 MBE
computed a measure of selection similar to the PBS (Yi et al. Acknowledgments
2010). The PBS statistic is based on a three-population com- We thank the American Association for Zoos and Aquariums
parison and measures the length of the branch leading to a for endorsing our research and collection of samples from
given population since its divergence from the two other captive tigers, Tara Harris (then Minnesota Zoo) and Kathy
populations. This statistic is not able to accommodate Traylor-Holzer (Tiger Species survival program) for help with
more than three populations and relies on a tree-based model captive tiger studbooks. We thank San Francisco Zoo, San
that does not correspond to tigers’ demographic history. Diego Zoo (BR2016035; Leona Chemnick for assistance with
Therefore, we extended this statistic to the case of four pop- DNA extraction and sample transport), El Paso Zoo, Omaha
ulations under a more suitable model than a tree-based one. Zoological Society, WCS Bronx Zoo (IC2016-0464 WCS; Dee
Downloaded from https://academic.oup.com/mbe/advance-article/doi/10.1093/molbev/msab032/6133235 by guest on 15 March 2021
Furthermore, using all four populations allows to better char- McAloose and Jean Pare for assistance with sample trans-
acterize the differences that are exclusive to specific branch. port), Gopala Battu for assistance with sequencing and sam-
We define: ple preparation at Hudson Alpha. Zachary Szpiech for
2ðTab þ Tac þ Tad Þ ðTbc þ Tbd þ Tcd Þ assistance with ADZE. U Ramakrishnan thanks National
mPBSa ¼ ; Tiger Conservation Authority and R Gopal for samples
6
from Ranthambore. U Borthakur thanks Assam Forest
where Tij is the divergence time, in generations, between Department. YV Jhala thanks the Chief Wildlife Wardens of
population i and j (Nei 1972): Uttarakhand, Madhya Pradesh and Rajasthan, and the min-
ij istry of Environment and Forests for permissions to radio-
Tij ¼ logð1 FST Þ:
collar tigers and collect blood samples. We thank Atul
This statistic assumes that each population diverged from Upadhayay for bioinformatics support and the computing
a metapopulation independently and that no migration oc- facility at NCBS. We thank M. Alyward and three anonymous
curred following divergence. It measures the length of the reviewers for their detailed comments on the manuscript.
branch leading to a given lineage since its divergence from Infosys Travel Award to A.K., SciGenome Research
the metapopulation. Selection in a given lineage will lead to a Foundation Grant to A.K., Fulbright Nehru Academic ex-
much longer terminal branch than under neutrality. This change fellowship to U.R., CEHG, Stanford University funding
would translate to extreme mPBS values. to U.R., Wellcome Trust-DBT Indian Alliance Senior fellow-
To compare observed mPBS values to expectations under ship to U.R. (IA/S/16/2/502714), and Genomics Facility of
the tigers’ demographic history, we simulated one million CCAMP. NCBS data cluster used is supported under project
genomic windows using the demographic model inferred no. 12-R&D-TFR-5.04-0900, Department of Atomic Energy,
previously. Window size and sample size for each population Government of India. A.G. and L.E. were partially supported
are the same as in the observed data set. Parameter values are by a Swiss NSF grant (10030B-166605).
fixed and correspond to the maximum likelihood estimates
(supplementary tables 7 and 9, Supplementary Material on- Author Contributions
line). Then, we computed the mPBS statistic for each popu- E.E.A., A.K., R.W.T., U.R., D.P. and E.A.H. designed the study.
lation to generate a null distribution. Observed and simulated E.E.A., A.K., R.W.T., A.G., G.G., A.T., J.T.L.K., S.R., S.P., G.B., C.K.,
distributions were then represented to see whether observed S.P., A.C., and L.E. conducted lab work and analyses. G.B., C.K.,
values deviated from neutral expectations. M.G., D.M., A.Z., U.B., A.R., E.L., O.A.R., Y.V.J., E.A.H., D.P. and
Enrichment tests were used to detect the targets of selec- U.R. provided samples and funding. E.E.A., A.K., R.W.T., A.G.,
tion. These tests are a conservative approach to detect selec- G.G., A.T., J.T.L.K., S.R., S.P., G.B., C.K., S.P., A.C., M.G., D.M., A.Z.,
tion because they are less susceptible to the influence of non- U.B., A.R., E.L., O.A.R., Y.V.J., D.P., L.E., E.A.H., and U.R. wrote
selective forces. To identify putative genes under selection, we and edited the paper.
considered predicted genic regions of the tiger genome for
which a homolog has been annotated using Exonerate (pro- Data Availability
tein2genome model). To avoid spurious enrichment signals All data generated for this paper are part of two bioprojects,
due to the presence of multiple homologs for a single gene, with accession numbers PRJNA548814 and PRJNA693788 on
we kept only one homolog for each predicted gene. If differ- the SRA database (https://www.ncbi.nlm.nih.gov/sra).
ent homologs on the same strand overlap, we pick the first
one and ignore the others. We retained a total of 12,771 genes References
after filtering.
Abascal F, Corvelo A, Cruz F, Villanueva-Ca~ nas JL, Vlasova A, Marcet-
We also checked whether some GO terms (Ashburner Houben M, Martınez-Cruz B, Cheng JY, Prieto P, Quesada V, et al.
et al. 2000; Mi et al. 2016) were enriched across candidate 2016. Extreme genomic erosion after recurrent demographic bottle-
genes (Fisher’s exact test performed on human GO terms). necks in the highly endangered Iberian lynx. Genome Biol.
Genes (650 kilobases flanking regions) were considered as 17(1):1–19.
candidates if they overlapped with a window that was in the Alexander DH, Novembre J, Lange K. 2009. Fast model-based estimation
of ancestry in unrelated individuals. Genome Res. 19(9):1655–1664.
top 0.1% of mPBS value of a given population. The reference Beichman AC, Huerta-Sanchez E, Lohmueller KE. 2018. Using genomic
list of genes for the enrichment test is set as the list of genes data to infer historic population dynamics of nonmodel organisms.
after filtering (12,771 genes). Annu Rev Ecol Evol Syst. 49(1):433–456.
12You can also read