Effects of domestication on the gut microbiota parallel those of human industrialization - eLife
←
→
Page content transcription
If your browser does not render page correctly, please read the page content below
RESEARCH ARTICLE

                                   Effects of domestication on the gut
                                   microbiota parallel those of human
                                   industrialization
                                   Aspen T Reese1,2†*, Katia S Chadaideh1, Caroline E Diggins1, Laura D Schell1,
                                   Mark Beckel3, Peggy Callahan3, Roberta Ryan3, Melissa Emery Thompson4,
                                   Rachel N Carmody1*
                                   1
                                    Department of Human Evolutionary Biology, Harvard University, Cambridge, MA,
                                   United States; 2Society of Fellows, Harvard University, Cambridge, MA, United
                                   States; 3Wildlife Science Center, Stacy, MN, United States; 4Department of
                                   Anthropology, University of New Mexico, Albuquerque, NM, United States

                                   Abstract Domesticated animals experienced profound changes in diet, environment, and social
                                   interactions that likely shaped their gut microbiota and were potentially analogous to ecological
                                   changes experienced by humans during industrialization. Comparing the gut microbiota of wild and
                                   domesticated mammals plus chimpanzees and humans, we found a strong signal of domestication
                                   in overall gut microbial community composition and similar changes in composition with
                                   domestication and industrialization. Reciprocal diet switches within mouse and canid dyads
                                   demonstrated the critical role of diet in shaping the domesticated gut microbiota. Notably, we
                                   succeeded in recovering wild-like microbiota in domesticated mice through experimental
*For correspondence:
                                   colonization. Although fundamentally different processes, we conclude that domestication and
areese@ucsd.edu (ATR);             industrialization have impacted the gut microbiota in related ways, likely through shared ecological
carmody@fas.harvard.edu (RNC)      change. Our findings highlight the utility, and limitations, of domesticated animal models for human
                                   research and the importance of studying wild animals and non-industrialized humans for
Present address: †Ecology
                                   interrogating signals of host–microbial coevolution.
Behavior & Evolution Section,
University of California San
Diego, La Jolla, United States
Competing interests: The
authors declare that no
competing interests exist.
                                   Introduction
                                   Industrialized, agrarian, and foraging human populations differ along numerous ecological dimen-
Funding: See page 22               sions, including diet, physical activity, the size and nature of social networks, pathogen exposure,
Received: 19 June 2020             types and intensities of medical intervention, and reproductive patterns. Such changes have resulted
Accepted: 12 February 2021         in large shifts in the gut microbiota in industrialized populations relative to non-industrialized popu-
Published: 23 March 2021           lations or closely related primates (De Filippo et al., 2010; Moeller et al., 2014; Moeller, 2017;
                                   Smits et al., 2017), including reductions in alpha-diversity and changes in composition that have
Reviewing editor: Marı́a
Mercedes Zambrano, CorpoGen,
                                   been implicated in the rise of various metabolic and immunological diseases (Ley et al., 2006;
Colombia                           Cox et al., 2014; Kamada et al., 2013). Many aspects of ecology that now differ between industrial-
                                   ized and non-industrialized human populations were similarly altered during the process of animal
   Copyright Reese et al. This
                                   domestication (Zeder, 2012). For example, domestic animals often consume less diverse, more eas-
article is distributed under the
                                   ily digestible diets than their wild relatives, expend less energy to achieve adequate (or excess) calo-
terms of the Creative Commons
Attribution License, which         ric intake, live in comparatively static and high-density groups, and can be subject to modern
permits unrestricted use and       medical interventions including antibiotic treatment (McClure, 2013). Although industrialization and
redistribution provided that the   domestication are fundamentally different processes, the ecological parallels between human indus-
original author and source are     trialization and animal domestication suggest that the gut microbiota of diverse domesticated ani-
credited.                          mals may differ in consistent ways from those of their wild progenitors, and further, that their

Reese et al. eLife 2021;10:e60197. DOI: https://doi.org/10.7554/eLife.60197                                                         1 of 27
Research article                                                                                   Ecology Evolutionary Biology

                                   eLife digest Living inside our gastrointestinal tracts is a large and diverse community of bacteria
                                   called the gut microbiota that plays an active role in basic body processes like metabolism and
                                   immunity. Much of our current understanding of the gut microbiota has come from laboratory
                                   animals like mice, which have very different gut bacteria to mice living in the wild. However, it was
                                   unclear whether this difference in microbes was due to domestication, and if it could also be seen in
                                   other domesticated-wild pairs, like pigs and wild boars or dogs and wolves.
                                      A few existing studies have compared the gut bacteria of two species in a domesticated-wild
                                   pair. But, studies of isolated pairs cannot distinguish which factors are responsible for altering the
                                   microbiota of domesticated animals. To overcome this barrier, Reese et al. sequenced microbial
                                   DNA taken from fecal samples of 18 species of wild and related domesticated mammals.
                                      The results showed that while domesticated animals have different sets of bacteria in their guts,
                                   leaving the wild has changed the gut microbiota of these diverse animals in similar ways. To explore
                                   what causes these shared patterns, Reese et al. swapped the diets of two domesticated-wild pairs:
                                   laboratory and wild mice, and dogs and wolves. They found this change in diet shifted the gut
                                   bacteria of the domesticated species to be more similar to that of their wild counterparts, and vice
                                   versa. This suggests that altered eating habits helped drive the changes domestication has had on
                                   the gut microbiota.
                                      To find out whether these differences also occur in humans, Reese et al. compared the gut
                                   microbes of chimpanzees with the microbiota of people living in different environments. The gut
                                   microbial communities of individuals from industrialized populations had more in common with
                                   those of domesticated animals than did the microbes found in chimpanzees or humans from non-
                                   industrialized populations. This suggests that industrialization and domestication have had similar
                                   effects on the gut microbiota, likely due to similar kinds of environmental change.
                                      Domesticated animals are critical for the economy and health, and understanding the central role
                                   gut microbes play in their biology could help improve their well-being. Given the parallels between
                                   domestication and industrialization, knowledge gained from animal pairs could also shed light on
                                   the human gut microbiota. In the future, these insights could help identify new ways to alter the gut
                                   microbiota to improve animal or human health.

                                   differences may resemble those observed between industrialized and non-industrialized human
                                   populations.
                                       Many of the altered ecological features experienced by industrialized humans and domesticated
                                   animals have been independently observed to impact the gut microbiota, including diet
                                   (David et al., 2014; Carmody et al., 2015), physical activity (Allen et al., 2018; Lamoureux et al.,
                                   2017), the size and nature of social networks (Dill-McFarland et al., 2019; Antwis et al., 2018), anti-
                                   biotic use (Bokulich et al., 2016; Cho et al., 2012), and changes in birthing and lactation practices
                                   (Bokulich et al., 2016; Li et al., 2018). The effects of these features on gut microbiota composition
                                   are often found to match or exceed the effects of genetic variation (Carmody et al.,
                                   2015; Rothschild et al., 2018), which is also routinely modified by domestication. As such, ecologi-
                                   cal shifts under domestication might be expected to lead to gut microbial differentiation between
                                   domesticated animals and their wild counterparts. To this end, wild mice have been shown to differ
                                   from laboratory mice in gut microbial composition (Kreisinger et al., 2014; Rosshart et al., 2017).
                                   Similarly, a comparison of domesticated horses and wild Przewalski’s horses in adjacent Mongolian
                                   grasslands found that the wild animals harbored compositionally distinct, and overall more diverse,
                                   gut microbial communities (Metcalf et al., 2017). However, to date, no general survey has been
                                   conducted to characterize the global effects of domestication on the gut microbiota.
                                       Apart from the pressures of ecological change that domestic animals experience in human envi-
                                   ronments, animal domestication has also entailed strong artificial selection for phenotypes desirable
                                   to humans, such as rapid growth and docility in agricultural animals, reliable reproduction and stress
                                   resistance in laboratory animals, and unique physical and/or behavioral attributes in companion ani-
                                   mals. Although targeted phenotypes differ based on the species under domestication,
                                   all domesticated mammals share the legacy of having been intentionally or indirectly selected for

Reese et al. eLife 2021;10:e60197. DOI: https://doi.org/10.7554/eLife.60197                                                        2 of 27
Research article Ecology Evolutionary Biology
tameness (Wilkins et al., 2014). This selection has been argued to have resulted in convergent mor-
phological and physiological features across domesticated mammals that are collectively referred to
as ‘domestication syndrome’ – including, for instance, reductions in brain size and tooth size, depig-
mentation, altered production of hormones and neurotransmitters, and retention of juvenile behav-
iors into adulthood – with the pleiotropic nature of these effects thought to be mediated by
changes in neural crest cells (Wilkins et al., 2014). Therefore, to the extent that gut microbiota is
dependent on host biology, we might additionally expect domestication to have shaped the gut
microbiome in similar, potentially convergent, ways across diverse mammalian lineages. Such micro-
biota-structuring contributions ascribable to evolutionary rather than ecological forces have the
potential to be much greater in and/or unique to domesticated animals relative to industrialized
human populations since the process of domestication has been advancing for much longer than
industrialization.
Here, we assess the effects of domestication on the mammalian gut microbiota, perform con-
trolled dietary experiments that attempt to distinguish between the relative roles of ecology and
genetics in driving these patterns, and compare the effects of domestication to those of human
industrialization. While we focus primarily on the impacts of domestication on the mammalian gut
microbiota, we include analyses of industrialized and non-industrialized human populations because
much is known about the effects of industrialization on the gut microbiota and as such it can serve
as a benchmark ecological process for domestication. In addition, to explore the extent to which
deeper evolutionary history affects these patterns, we also compare humans to chimpanzees (Pan
troglodytes), one of our two closest living relatives and arguably the better referential model for the
last common ancestor between Pan and Homo (Muller et al., 2017). Early Homo sapiens is thought
to have undergone a form of self-domestication as a result of selection against aggression (Wrang-
ham, 2018; Theofanopoulou et al., 2017), suggesting that there could likewise be parallels
between the gut microbial signatures of animal domestication and Pan–Homo speciation.
We predict that (i) gut microbial communities will differ between domesticated animals and their
wild counterparts, (ii) gut microbial communities of diverse domesticated animals may exhibit con-
vergent characteristics in a microbial counterpart to the physiological domestication syndrome
(Wilkins et al., 2014), and (iii) gut microbial changes observed with domestication may parallel con-
trasts observed between chimpanzees and humans. In addition, to the extent that domestication
effects are driven by ecology rather than host phylogenetic distance, we should expect (iv) experi-
mental manipulation of ecology to overcome differences in the gut microbiota between closely
related hosts, and (v) the gut microbiota of domesticated animals will share more features with
industrialized human populations than with non-industrialized human populations.
Identifying the factors shaping the gut microbiota of domesticated animals will provide insights
into the ecology of host-associated microbial communities and their impact on health. Domesticated
animals serve as reservoirs for zoonotic diseases (Morand et al., 2014; Wolfe et al., 2007;
Cleaveland et al., 2001; Han et al., 2016) and carriers of antibiotic-resistant bacteria (Sayah et al.,
2005; EFFORT Group et al., 2018). Furthermore, the ecological impacts of domestication on the
gut microbiota could conceivably contribute to the unique health problems experienced by captive
(Hosey et al., 2009) and domesticated animals (Timoney et al., 1988). Differences between domes-
ticated and wild animal microbiota may also manifest in poor translatability between laboratory stud-
ies and the real world (Leung et al., 2018; Beura et al., 2016). Finally, the convergent nature of
many ecological shifts experienced by domesticated animals and industrialized human populations
suggests that domesticated animals may provide a uniquely useful model for studying the
microbially mediated health impacts of rapid environmental change that results in mismatch
between host, microbiota, and/or environment, a situation thought to apply to humans in industrial-
ized settings (Sonnenburg and Sonnenburg, 2019). Understanding what shapes the domesticated
microbiota may therefore identify routes to improve experimental models, animal condition, and
human health.
Reese et al. eLife 2021;10:e60197. DOI: https://doi.org/10.7554/eLife.60197 3 of 27Research article Ecology Evolutionary Biology
Results
Cross-species comparison of gut microbial composition
First, we characterized the fecal microbiota of wild and domesticated populations of nine pairs of
artiodactyl, carnivore, lagomorph, and rodent species (Figure 1A) using 16S rRNA gene amplicon
sequencing and quantitative PCR (qPCR). Despite observing no single convergent ‘domesticated
microbiota’ profile, our analysis detected a global signal of domestication status on gut microbiota
composition. Across the combined dataset, the factor that explained the largest proportion of varia-
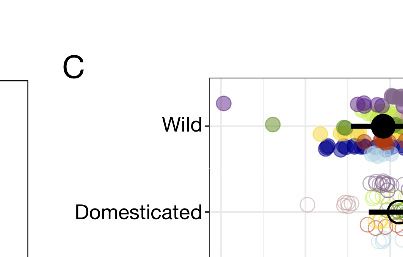
tion was the host dyad (e.g., pig/boar; pResearch article Ecology Evolutionary Biology
correcting for host dyad and retaining information on the directionality of changes. We found that
domesticated individuals were typically further right relative to the average of their host dyad
(p=0.006, Mann–Whitney U test; Figure 1C) and that this difference was significant regardless of the
distance metric analyzed (Supplementary file 1). Most domesticated species displayed similar
trends in these ordination shifts (Figure 1—figure supplement 2) with laboratory and companion
animals showing significant differences when analyzed collectively (pResearch article Ecology Evolutionary Biology
A C E
Host taxon 3.5
* * *
Distance at endpoint to mean
0.6
Baseline Shannon index
of diet control at baseline
3.0
Diet
0.4
2.5
0.2
DomH/DomD DomH/WildD WildH/DomD WildH/WildD 2.0
N=10 N=10 N=3 N=3
0.0
B Domesticated DomH/WildD
Wild WildH/DomD
Day 0
Day 28
D
0.4
0.2
NMDS2
Mouse ID
0.0
0.2
0.4
Day 0
Day 28
0.4 0.2 0.0 0.2 0.4 0.6
DomH/DomD DomH/WildD WildH/DomD WildH/WildD 0.2 0.0 0.2 0.4 0.6
NMDS1
NMDS1 NMDS1
Figure 2. Gut microbial differences between wild and domesticated mice can be partially overcome by diet swap. (A) Design scheme for fully factorial
host taxon by diet mouse experiment (N = 10 laboratory mice or three wild mice per diet group). (B) Nonmetric multidimensional scaling (NMDS)
ordination of Bray–Curtis dissimilarities showing changes for mice from day 0 (open circle) to day 28 (filled circle) by experimental groups (color).
Composition varied by host taxon (pResearch article Ecology Evolutionary Biology
(DomH/DomD), the microbiota of domesticated mice fed a wild diet (DomH/WildD) moved in the
opposite direction, and those of control wild or domesticated mice consuming their habitual diets
(WildH/WildD and DomH/DomD) did not shift (Figure 2B). Over the course of the experiment, alpha-
diversity as measured by Shannon index also changed significantly across treatment groups
(p=0.025, Kruskal–Wallis test; Figure 2—figure supplement 2), with DomH/WildD mice becoming
significantly more diverse (p=0.004, one-sample Wilcoxon test) despite lower baseline levels of
alpha-diversity in domesticated versus wild mice (p=0.011, Mann–Whitney U test; Figure 2C).
Neither host taxon nor diet was associated with differences in gut microbial density over the
experiment (p=0.272, Kruskal–Wallis test; Figure 2—figure supplement 2), but it is notable that the
total amount of feces produced, and thus likely the total number of bacteria, was lower in both host
taxon groups when consuming the wild diet (pResearch article Ecology Evolutionary Biology
A B
Day 0
Day 8
0.4
Host taxon (Dom)
0.2
Colonization
NMDS2
0.0
Diet
0.2
PBSC/WildC WildC/WildD
N=9 WildC /DomD N=10
0.6 0.4 0.2 0.0 0.2 0.4
N=10
Wild Donor PBSC/WildD NMDS1 WildC/DomD WildC/WildD
C 1.00
D
* * Day 0
Day 8
PBSC/WildD
Distance to donor
0.75
Diet/Gavage
0.50 WildC/DomD
0.25
Day 0 WildC/WildD
Day 8
Wild_PBS Chow_Wild Wild_Wild 0.6 0.4 0.2 0.0 0.2 0.4
PBS C/WildD Wild C/WildD NMDS1
WildC/DomD NMDS1
Figure 3. Laboratory mice can be re-wilded through colonization with a wild gut microbial community. (A) Design scheme for colonization/diet mouse
experiment (N = 9–10 mice per treatment group). (B) Nonmetric multidimensional scaling (NMDS) ordination of Bray–Curtis dissimilarities showing
changes for mice from day 0 (open circles) to day 8 (filled circles) by experimental groups (color). (C, D) At the end of the experiment (filled circle),
distance to the wild community donor decreased most in animals colonized with wild communities (p=0.004 WildC/DomD and p=0.002 WildC/WildD,
Mann–Whitney U test; C), but all experimental groups exhibited change along Bray–Curtis ordination NMDS axis 1 (p=0.002 PBSC/WildD, p=0.004
WildC/DomD, and p=0.002 WildC/WildD, one-sample Wilcoxon tests; D) during the course of the experiment. * in (C) indicates pResearch article Ecology Evolutionary Biology
Diet versus host taxon effects on domesticated gut microbial
composition in canids
To test if our findings were generalizable beyond mice, we conducted an analogous reciprocal diet
experiment in captive sympatric populations of wolves and dogs (Figure 4A). We tracked gut micro-
bial dynamics in these canids for 1 week on their standard diet (raw carcasses or commercial dog
food, respectively) and 1 week on the reciprocal diet. As in the mouse experiment, we found that
host taxon (wild or domesticated) explained the largest amount of variation in gut microbiota com-
position (pResearch article Ecology Evolutionary Biology
A C E 0.5
Host taxon
* *
Distance at endpoint to mean
3.5
Baseline Shannon index
of diet control at baseline
0.4
3.0
Diet 0.3
2.5
0.2
DomH/DomD WildH/DomD
2.0
0.1
N=9 Dom H /WildD N=10 WildH/WildD
N=9 N=10
B Domesticated DomH/WildD
0.4
Wild WildH/DomD
Day 0
Day 7 D Day 0
Day 7
0.2
NMDS2
0.0
Canid ID
0.2
0.4
0.6 0.4 0.2 0.0 0.2 0.4
DomH/DomD DomH/WildD WildH/DomD WildH/WildD 0.50 0.25 0.00 0.25
NMDS1
NMDS1 NMDS1
Figure 4. Microbial differences between wild and domesticated canids can be partially overcome by diet shifts. (A) Design scheme for fully factorial
host taxon by diet canid experiment (N = 9 dogs or N = 10 wolves per diet group). (B) Nonmetric multidimensional scaling (NMDS) ordination of Bray–
Curtis dissimilarities showing changes for canids from day 0 (open circle) to day 7 (filled circle) by experimental groups (color). Composition varied by
host taxon (pResearch article Ecology Evolutionary Biology
A
0.4
0.2
0.0
NMDS2
0.2
0.4
0.4 0.2 0.0 0.2 0.4
Chimpanzee
Chimp Human (Hadza)
HumanT
Domestic NMDS1 Alpaca
Alpaca Mouse
Mouse
Chimpanzee (Zoo)
ChimpZ Human (Chepang)
HumanN CO
Cow Pig
Pig
Human (US)
HumanU Human (Raji)
HumanNr
Dog
Dog Ra
Rabbit
Human (US; Jha)
HumanUj Human (Raute)
HumanN
Guinea_pig
Guinea pig Rat
Rat
Wild Human (Tharu)
HumanNt
Mouse
Domesticated Sheep
Sheep
Wild
Pig
B C Ra
Domesticated
I Rat
*
Wild
I * 1.000
Sheep
Human (US)
I
Dissimilarity from human (US)
Human (US; Jha)
I 0.975
Human (Tharu)
I
Human (Raute)
I 0.950
Human (Raji)
I *
Human (Chepang)
I 0.925
Human (Hadza)
I
Chimpanzee (Zoo)
I
Chimpanzee
0.3
I
0.0 0.3 0.6
0.900
Domestic Wild
Domesticated Wild
NMDS1 distance to group mean
Figure 5. Differences in gut microbial communities between industrialized humans and wild chimpanzees parallel those observed between
domesticated and wild mammals. (A) Nonmetric multidimensional scaling (NMDS) ordination of Bray–Curtis dissimilarities in the gut microbiota
illustrates that industrialized human populations (US and US Jha) exhibit similar trends relative to wild chimpanzees as domesticated animals do to wild
animals, but that non-industrialized human populations (Hadza, Chepang, Raji, Raute, and Tharu) do not (N = 5–7 individuals per primate population
Figure 5 continued on next page
Reese et al. eLife 2021;10:e60197. DOI: https://doi.org/10.7554/eLife.60197 11 of 27Research article Ecology Evolutionary Biology Figure 5 continued and 5–20 individuals per other animal species). (B) Distance along the first Bray–Curtis ordination NMDS axis relative to group mean differs in the same direction for the two industrialized human populations relative to wild chimpanzees or non-industrialized human populations as for domesticated animals relative to wild animals (p
Research article                                                                                  Ecology Evolutionary Biology

                                   suggesting that studying variations in animal husbandry practices may illuminate new levers for
                                   manipulating the mammalian gut microbiota (Velazquez et al., 2019; Villarino et al., 2016;
                                   Schmidt et al., 2019).
                                       Although there are many shared features of contemporary ecology and historic artificial selection
                                   on domestic animals, it is perhaps unsurprising that domestication has not produced a single, con-
                                   vergent domesticated gut microbiota. The animals we characterized represent a diverse set of line-
                                   ages in the mammalian clade, and thus their microbiota also differ due to variation in factors such as
                                   gut structure and size, passage rate, diet, and biogeography (Ley et al., 2008; Youngblut et al.,
                                   2019). While the domestication signal was comparable in magnitude to those of gut physiology and
                                   diet type, it does not mask those fundamental structuring forces. Furthermore, the particulars of a
                                   domesticated lineage can help clarify what aspects of ecology are most salient to the domestication
                                   effect. Cases where domestication effects are weaker in our comparative study generally consist of
                                   animals where the ecological change associated with domestication has been small – for example,
                                   sheep and pigs, whose diets may be quite similar to their wild progenitors, at least when kept in the
                                   non-industrialized agricultural settings that were sampled (McClure, 2013) – or where ecological
                                   changes are in the opposite direction from the domesticated norm – for example, canids, where the
                                   domesticate diet typically involves lower protein and higher carbohydrate levels than wild diets,
                                   instead of the higher protein levels seen in most laboratory or farm animals (Axelsson et al., 2013).
                                       Our reciprocal diet experiments in mice and canids substantiate our claim that ecology plays a
                                   predominant role in shaping the domesticated gut microbiota. However, they do not pinpoint the
                                   mechanism(s) for these effects. Variability in diet or other aspects of ecology and their concomitant
                                   effects on host physiology (e.g., passage rate) can alter microbial composition or abundance through
                                   changes in the selective landscape that microbes experience and changes in environmental
                                   exposure (David et al., 2014; Carmody et al., 2019). Animals may experience altered bacterial col-
                                   onization, leading directly to changes in composition, and/or viral colonization, which could then
                                   alter the bacterial community if new bacteriophages target gut bacteria or if eukaryotic viruses acti-
                                   vate the host immune system, leading to transformations in the gut environment. That the gut micro-
                                   bial impacts of change in a single ecological variable like diet were sufficiently profound to balance
                                   those of host taxon identity suggests that suites of ecological variables changing together, such as
                                   during domestication or industrialization, may have collectively exerted an even larger influence
                                   (Jha et al., 2018).
                                       Of course, microbiota changes were not the only pathway for animals undergoing domestication
                                   to respond to changing ecological factors. For example, genetic changes have enhanced the capac-
                                   ity for starch digestion in dogs (Axelsson et al., 2013; Reiter et al., 2016). Nevertheless, the
                                   increased microbial diversity and shifts in microbial composition that we observed in dogs may have
                                   additionally contributed to carbohydrate digestion. Indeed, dogs fed conventional diets have
                                   greater representation of carbohydrate metabolism genes in their gut metagenomes than do dogs
                                   fed meat-based diets (Alessandri et al., 2019). Notably, the microbiota has been found to supple-
                                   ment evolutionary responses during dietary niche expansion in wild animals that consume plants
                                   high in toxins (Kohl et al., 2014). As such, although hosts and their various gut microbial taxa are
                                   each expected to pursue their own fitness interests, gut microbial disparities observed between
                                   domesticated and wild animals, and more generally in other organisms under rapid environmental
                                   change, could potentially be adaptive for the host (Alberdi et al., 2016).
                                       Beyond host support of a gut microbiota that can better digest a domesticate diet, humans may
                                   have selected for animals harboring a microbiota that helped them grow and reproduce well on
                                   such diets, thereby applying unconscious selection on the microbiota (Zohary et al., 1998). Changes
                                   in microbial function that enhanced host dietary energy harvest, survivorship, or reproduction may
                                   have been particularly important early in domestication, before host evolution occurred, although
                                   that hypothesis remains to be tested empirically. Regardless, specialization of microbial performance
                                   on domesticate diets could conceivably have come at the cost of broader digestive capacity, as seen
                                   in the laboratory mouse microbiota, which was better at harvesting energy from domesticate diets
                                   than from wild diets (Figure 2—figure supplement 2). It may also have impacted the immunological
                                   functions of the gut microbiota. The elevated pathogen abundances found in wild populations over-
                                   all may largely be ascribed to low pathogen abundances in laboratory animals (Figure 1—figure
                                   supplement 2), which are maintained under specific pathogen-free conditions that minimize the like-
                                   lihood of infection. Under natural conditions, though, the domesticated microbiota may exhibit

Reese et al. eLife 2021;10:e60197. DOI: https://doi.org/10.7554/eLife.60197                                                      13 of 27
Research article Ecology Evolutionary Biology
reduced colonization resistance or immune system functioning (Rosshart et al., 2017; Beura et al.,
2016; Rosshart et al., 2019), resulting in higher pathogen colonization, as observed here in agricul-
tural animals. Future studies examining the trade-offs among microbially mediated functions, like
digestive capacity, reproduction, and immunity, will help to illuminate the complex selection pres-
sures shaping domesticated animals and their gut microbiota (Reese and Kearney, 2019).
We observed some correspondence between the gut microbial signatures of animal domestica-
tion and human industrialization that is most likely attributable to convergent ecological changes.
The observation that gut microbial divergence among Pan and Homo primarily affects industrialized
populations specifically implicates recent ecological changes as opposed to either ecological
changes with deeper roots in human evolution or host evolutionary changes. Many recent human
ecological changes involve accelerations of basic patterns established during the evolution of Homo,
including increased proportion of calories from fat and protein, increased dependence on animal
source foods, and extensive food processing involving both chemical and physical changes to food
(Carmody, 2017). Other ecological changes are likely specific to industrialization, including reduced
physical activity, high population density, and antibiotic use. These factors would be absent even in
populations currently transitioning from subsistence to industrialized lifestyles (Jha et al., 2018), but
may overlap with changes experienced by domesticated animals in their diets, habitats, and social
milieu. While we limited our analysis to human–chimpanzee comparisons because Pan is the closest
sister clade to Homo, recent work has indicated that the human gut microbiota is more similar to
that of baboons (Gomez et al., 2019; Amato et al., 2019). Baboons are more distantly related to
humans but have been argued to be closer in terms of diet and dietary physiology (Codron et al.,
2008; Lambert, 1998), accentuating our finding of the importance of ecological factors in shaping
the microbiota. Further work will be required to assess the specific combination of ecological factors
driving similarities between domesticated and industrialized gut microbial signatures.
Because laboratory animals demonstrate some of the largest overall differences relative to their
wild counterparts, they might be expected to have high translational potential as models for study-
ing the gut microbiota of industrialized human populations. However, recent findings show that lab-
oratory mice are poorer immunological models for humans in industrialized settings than are wild
mice or laboratory mice harboring a wild microbiota (Beura et al., 2016; Rosshart et al., 2019).
While the industrialized human gut microbiota exhibits parallels to those of domesticated animals, it
may experience a broader array of environments and greater temporal variability; for example,
greater ecological variability may explain the elevated gut microbial Shannon diversity seen in
humans as compared to laboratory animals (Figure 1—figure supplement 2). Alternatively, it may
be that domesticated laboratory animals are strong models for some aspects of host–microbe biol-
ogy other than immunology. Certainly, studies of non-domesticated animals will be necessary to
understand the natural history of host–microbe interactions (Reese and Kearney, 2019; Hird, 2017),
as well as to determine the most appropriate models for translational research.
The fact that laboratory mice were permissive of recolonization by wild strains indicates that the
local extinctions that occurred during domestication and/or generations in captivity can potentially
be mitigated, thereby potentially improving the utility of these animals for research. Previous work
has relied on laboratory mice colonized with a wild microbiota but fed standard laboratory chow
(Rosshart et al., 2017; Rosshart et al., 2019) or on wild mice fed wild diets (Martı́nez-Mota et al.,
2020). A combination of these approaches – adding wild gut microbial community members and
feeding wild diet – would be expected to best support a wild gut microbiota in laboratory mice. A
wild-microbiota laboratory-genotype model could be especially useful for studying infection chal-
lenges, disentangling host gene versus microbiota contributions to disease phenotypes, and testing
for host–microbiota coevolution (Rosshart et al., 2019).
More generally, our data add to growing evidence that the gut microbiota is finely tuned to varia-
tions in the environment, affording at once expanded opportunities for biological mismatch to arise
between the host and microbiota and for rapid microbiota-mediated host adaptation to novel envi-
ronments. Further work to characterize the ecological significance of gut microbial plasticity will help
reveal the fundamental nature of the host–microbial relationship, the conditions under which plastic-
ity is beneficial versus detrimental, and the ecological conditions promoting cooperative, commen-
sal, and competitive dynamics. The answers will have profound implications for our definition and
pursuit of a healthy gut microbiome.
Reese et al. eLife 2021;10:e60197. DOI: https://doi.org/10.7554/eLife.60197 14 of 27Research article Ecology Evolutionary Biology
Materials and methods
Key resources table
Reagent type
(species) or Source or Additional
resource Designation reference Identifiers information
Biological Feces This paper N = 9, sex unknown
sample
(Bos taurus)
Biological Feces This paper N = 20, sex unknown
sample
(Bison bison)
Biological Feces This paper N = 13, twelve females
sample
(Ovis aries)
Biological Feces This paper N = 10, sex unknown
sample
(Ovis
canadensis)
Biological Feces This paper N = 9, sex unknown
sample
(Sus scrofa
domesticus)
Biological Feces This paper N = 16, five females
sample
(Sus scrofa)
Biological Feces This paper N = 8, sex unknown
sample
(Vicugna pacos)
Biological Feces This paper N = 5, two females
sample
(Vicugna
vicugna)
Biological Feces This paper Comparative: N = 7, four females
sample Experiment: N = 9, sex unknown
(Canis
lupus familiaris)
Biological Feces This paper Comparative: N = 9, sex unknown
sample Experiment: N = 10, sex unknown
(Canis lupus)
Biological Feces This paper Domesticated: N = 11, four females
sample Wild: N = 12, sex unknown
(Oryctolagus
cuniculus)
Biological Feces This paper N = 10, zero female
sample
(Cavia
porcellus)
Biological Feces This paper N = 11, sex unknown
sample
(Cavia tschudii)
Biological sample Feces This paper Comparative:
(Mus musculus) N = 9 (domesticated), zero female
N = 9 (wild), sex unknown
Experiments:
N = 49 (domesticated), zero female
N = 6 (wild), sex unknown
Biological Feces This paper Domesticated: N = 6, sex unknown
sample
(Rattus
norvegicus)
Continued on next page
Reese et al. eLife 2021;10:e60197. DOI: https://doi.org/10.7554/eLife.60197 15 of 27Research article Ecology Evolutionary Biology
Continued
Reagent type
(species) or Source or Additional
resource Designation reference Identifiers information
Biological Intestinal This paper Wild: N = 10, three females
sample sample
(Rattus
norvegicus)
Biological Feces This paper Wild: N = 7, seven females
sample Captive: N = 3, two females
(Pan troglodytes)
Biological Feces This paper N = 7, five females
sample
(Homo sapiens)
Sequence- 515F Caporaso et al., 2011 PCR primers GTGCCAGCMGCCGCGGTAA
based reagent
Sequenced- 806R Caporaso et al., 2012 PCR primers GGACTACNVGGGTWTCTAAT
based reagent
Software, R R Core Team Version 3.3
algorithm
Software, QIIME Caporaso et al., 2010 Version 1.8
algorithm
Software, vegan Oksanen et al., 2017
algorithm
Software, lme4 Bates et al., 2015
algorithm
Software, TimeTree Kumar et al., 2017 http://timetree.org
algorithm
Software, boot Canty and Ripley, 2020 Version 1.3-25
algorithm
Fecal sample collection
Distal gut microbiota samples from a range of non-human species were collected by authors or col-
laborators. Fecal samples from non-human mammals were collected from the ground within seconds
to a few hours (Research article Ecology Evolutionary Biology
and guinea pig (Cavia porcellus; N = 10, zero female) fecal samples were collected from animals in
Harvard laboratory facilities (MA2). Domesticated rabbit (Oryctolagus cuniculus; N = 11, four
females) fecal samples were collected from a shelter in Billerica, Massachusetts (MA3). Dog (Canis
lupus familiaris; N = 7, four females) fecal samples were collected from personal pets in Stacy, Min-
nesota (MN). All samples were collected in summer or fall 2017. We have limited ability to distin-
guish between locale and species effects since all but one species (sheep) had samples collected
from only one locale. Some locales had multiple species present, and we do find a significant effect
of locale on overall microbial community composition even when correcting for host phylogeny
effects (pResearch article Ecology Evolutionary Biology
freely consumed their habitual diets. Fecal samples were immediately stored at –20˚C and were
transferred within 24 hr to permanent storage at –80˚C.
Animal experiments
Wild mouse capture
Mus musculus were introduced to North America from Western Europe and are now commonly
found in commensal settings (Schwarz and Schwarz, 1943). We set out Sherman live traps in the
evenings in buildings and barns during February 2018. Traps were baited with peanut butter and a
small cube of apple and outfitted with sufficient bedding and food to sustain an adult mouse for at
least 48 hr. They were checked the following morning to minimize time spent in the traps. Rodents
were transferred from their traps to a plastic bag, and unwanted rodent species were released
immediately. Mice that were identified as M. musculus (rather than Peromyscus spp., also common
in Massachusetts) were transferred to temporary cages for transport to lab facilities. At time of cap-
ture, we collected fecal samples and body swabs for zoonoses testing by Charles River. All individu-
als were tested for fur mites; MAV 1 and 2; MHV; MPV/MVM; MRV; mousepox; POLY; REO; LCMV;
LDV; TMEV/GDVII; SEND; PVM; Mycoplasma; Mycoplasma pulmonis; Filobacterium rodentium (for-
merly CAR Bacillus); Citrobacter rodentium; Clostridium piliforme; Corynebacterium kutscheri; Cory-
nebacterium bovis; Streptobacillus moniliformis; and pinworm. The only agent of concern found was
fur mites. Because animals were not treated for parasites or pathogens in order to preserve their
wild gut microbiota signature, they were housed under non-specific pathogen free (SPF) conditions
at Harvard’s Concord Field Station. Mice were allowed at least 3 days to adjust to laboratory condi-
tions without handling and provided with a wild mouse diet (a mix of bird seed [Wagner’s Eastern
Regional Blend Deluxe Wild Bird Food] and Bio-Serv freeze-dried mealworms; Supplementary file
3) before the beginning of the experiment. All mice were housed singly from the time of arrival at
the Concord Field Station and had access to water and food ad libitum.
Wild/laboratory mice reciprocal diet experiment
A total of 10 wild mice were captured for this experiment. Of these, two were deemed too young
for inclusion in the study, one died before beginning the experiment, and one died during the
course of the experiment. As a result, we collected six wild mice (WildH) that were included in the
full study. In addition to the wild mice, male C57BL/6 mice 10–12 weeks of age with a conventional
microbiota were purchased from Charles River Laboratories for inclusion in the study (DomH). All
mouse experiments were conducted in accordance with the National Institutes of Health Guide for
the Care and Use of Laboratory Animals using protocols approved by the Harvard University Institu-
tional Animal Care and Use Committee (protocol 17-11-315). The sample size for the laboratory ani-
mal group was chosen following power analyses to allow for b less than 0.1; the sample size for the
wild animal group was chosen based on animal availability (N = 3 per diet treatment). The experi-
ment was conducted once. All mice were housed singly from the time of arrival at the Concord Field
Station and had access to water and food ad libitum. Mice were provided nesting material and plas-
tic enrichment housing atop corncob bedding. The mice were maintained in a 20–22˚C room with
natural light cycles.
Mice, both wild and laboratory, were randomly assigned to one of two dietary treatment groups
(N = 10 laboratory mice or three wild mice per group). The first group (domesticate diet: DomD) was
provided ad libitum mouse chow (Prolab Isopro RMH 3000) in overhead food hoppers, as is standard
in mouse studies. The second group (wild diet: WildD) was provided a mix of bird seed (Wagner’s
Eastern Regional Blend Deluxe Wild Bird Food) and freeze-dried mealworms (Supplementary file 3)
in excess of predicted consumption. The food was placed in the corncob bedding to simulate
foraging.
Before initiating the dietary interventions, all individuals were weighed and multiple fecal samples
were collected. The mice were then returned to a new, clean cage with the treatment diet present.
Over the next week, fecal samples and weights were collected daily for each mouse. The amount of
food remaining was weighed and additional wild diet was added daily. One week after beginning
the experiment, mice were weighed and fecal samples were collected, then mice were moved to
clean cages. Weights and fecal samples were henceforth collected weekly (days 14, 21, and 28) until
the end of the experiment, although additional food was added biweekly for individuals assigned to
Reese et al. eLife 2021;10:e60197. DOI: https://doi.org/10.7554/eLife.60197 18 of 27Research article Ecology Evolutionary Biology
the wild diet treatment. Additional chow was added to hoppers for individuals assigned to the con-
ventional diet treatment, and all water bottles were refilled as necessary. At the end of each week,
food hoppers were weighed (DomD), and cage bedding was collected and sifted to quantify uneaten
food (WildD), determine total weekly fecal production (all groups during week 3), as well as to pro-
vide fecal samples for bomb calorimetry (6050 Calorimeter, Parr). All calorimetry results were
adjusted for the average weekly fecal production and average weekly food intake of each experi-
mental group. At the end of the experiment (days 28–30), mice were humanely sacrificed via CO2
euthanasia.
Wild/laboratory mice gavage experiment
Thirty 10-week-old male C57BL/6 mice with a conventional microbiota were purchased from Charles
River Laboratories for inclusion in the study. The sample size was chosen following power analyses
to allow for b less than 0.1; the experiment was conducted once. Mice were cohoused in litter
groups of 3–4 until beginning the study. Cage groups were spread across the treatment groups,
with individuals randomly assigned to a diet and colonization treatment. There were three treatment
groups: wild colonized/wild diet (WildC/WildD); wild colonized/domesticate diet (WildC/DomD); or
phosphate-buffered saline (PBS) gavage/wild diet (PBSC/WildD). The latter served as a colonization
control, emulating the DomH/WildD group from the reciprocal diet mouse experiment.
On the first day of study, fecal samples were collected from each mouse and the mice were
weighed before colonization. Mice receiving a wild microbiota were colonized with cecal contents
collected from one randomly selected WildH/WildD individual in the wild/laboratory experiment (see
above). The cecal contents were prepared following Rosshart et al., 2017. In short, frozen cecal
contents were resuspended in sterile-reduced PBS (1:1 g:ml) under anaerobic conditions then
diluted 1:30. Each recipient mouse received a single dose of 100 to 150 ml cecal solution via oral
gavage. PBS control mice received 100–150 ml sterile-reduced PBS via oral gavage.
Following gavage, mice were transferred to single housing in new, clean cages with the treatment
diet present. Mice receiving domesticate diet were provided ad libitum mouse chow (Prolab Isopro
RMH 3000) in overhead food hoppers. Wild mouse diet consisted of a mix of bird seed (Wagner’s
Eastern Regional Blend Deluxe Wild Bird Food) and freeze-dried mealworms (Supplementary file
3), which was provided in excess of predicted consumption and placed in the corncob bedding to
simulate foraging. All mice were provided with nesting material and plastic enrichment housing atop
corncob bedding.
Additional fecal samples and weights were collected on days 1, 2, and 8 following gavage. After
weights and fecal samples were collected on day 8, mice were humanely sacrificed via CO2 euthana-
sia. During the course of the experiment, one mouse in the PBSC/WildD (control) treatment group
died, resulting in a N = 9 for that group. At the end of the experiment, food hoppers were weighed
(DomD), and cage bedding was collected and sifted to quantify uneaten food (WildD) and total
weekly fecal production (all groups).
Wolf/dog reciprocal diet experiment
Ten wolves (Canis lupus) and nine dogs (Canis lupus familiaris) participated in the study. The sample
size for the canid experiment laboratory animal group was chosen following power analyses to allow
for b less than 0.1; the experiment was conducted once. Wild-caught or captive-born wolves lived in
packs of 2–6 wolves at the WSC (Stacy, MN). They were exposed to natural light cycles and weather
conditions, with access to shelters and wolf-dug dens in their enclosures. Wolves had ad libitum
access to water. Dogs enrolled in this study were privately owned in Stacy, MN, and were recruited
to participate through their owners. Dogs were kept in their typical environment throughout the
experiment. All canid experimentation was approved by the WSC IACUC (protocol HAR-001).
Wolves were enrolled in the study from December 5–20, 2018, and dogs were enrolled from Decem-
ber 24, 2018 to January 8, 2019.
On every day of the study, across both the control and reciprocal diet arms, wolves were given
inert colored glass beads via treats (~15 g raw meatballs). The beads can be passed naturally without
harm to the animal and allowed for source identification for fecal samples in cohoused animals. Fecal
samples were collected daily in a sterile manner then moved to 20˚C storage before long-term
storage at 80˚C. For the first week of the experiment, all animals received a control diet that
Reese et al. eLife 2021;10:e60197. DOI: https://doi.org/10.7554/eLife.60197 19 of 27Research article Ecology Evolutionary Biology
matched their genetic background (Supplementary file 3) – raw chicken parts (4 lbs/animal) for
wolves (WildH/WildD) and commercial dog food (Nutrisource Lamb Meal and Peas Recipe, Grain
Free) for dogs (DomH/DomD). Fecal samples were collected at least once daily from wolf enclosures
and the dogs’ home environments without handling the animals. On day 8, wolves were provided no
new food, but were able to complete consumption of previously provided food. Fecal samples col-
lected on this day were considered baseline samples for the next arm of the experiment. Beginning
on day 8, a week of reciprocal diet feeding was commenced. During this period, wolves were fed
commercial dog food (WildH/DomD) and dogs were fed raw chicken parts (DomH/WildD). Daily fecal
samples were again collected. Following completion of the study, animals were returned to their
standard diet.
Human sample meta-analysis
To compare the microbial differences observed between wild and domesticated animals and
between humans and chimpanzees with differences linked specifically to industrialization, we also
performed analyses including all of the samples outlined above plus a subset of published data from
Jha and colleagues (Jha et al., 2018). To match sample sizes used in our human–chimpanzee con-
trast, we subsampled seven adults from their Chepang (Nepalese foragers), Raji (Nepalese foragers
transitioning to subsistence farming), Raute (Nepalese foragers transitioning to subsistence farming),
Tharu (Nepalese subsistence farmers), and American populations, as well as seven adults from the
Hadza (Tanzanian hunter gatherers) population they analyze, which were originally described in
another study (Smits et al., 2017). All data were downloaded from the European Nucleotide
Archive. These populations represent extremes of industrialized and non-industrialized human life-
styles with the variation among the non-industrialized groups not covering the full breadth of inter-
mediate lifestyles (e.g., modern agricultural or recent urban transplants). We believe that these
extremes enable us to test how the human gut microbial communities respond to major ecological
change of a magnitude that could be argued to approximate that experienced by gut microbial
communities of animals undergoing domestication.
These samples were not necessarily collected or processed in an identical manner to each other
or to the new data collected in this paper – namely, the Chepang, Raji, Raute, and Tharu samples
were collected and preserved using OMNIgene kits while the American and Hadza samples were
frozen, while all samples were extracted with the MoBio PowerSoil kit and sequenced on an Illumina
MiSeq. Unfortunately, no existing published data on non-industrialized populations have been gen-
erated using exactly the same methods employed here. However, we reprocessed the sequences
using the 16S rRNA gene amplicon QIIME pipeline described below and rarefied all samples to
10,000 reads depth to make the data as comparable as possible. Importantly, to the extent that
these discrepancies introduce biases to our analyses, we expect they would do so in a manner
agnostic to the comparison with our chimpanzee and American human samples. The high similarity
between the US samples that we collected and those collected by Jha and colleagues supports this
expectation. Furthermore, the fact that the non-industrialized Hadza samples were not stored with
OMNIgene kits precludes conflating any non-industrialized signal with a sample-processing signal.
Specific taxa chosen for targeted analyses were identified from the human lifestyle analyses by
Smits and colleagues (Smits et al., 2017); only taxa that had a non-zero abundance in wild chimpan-
zees were analyzed here. Time since Pan–Homo divergence was drawn from http://timetree.
org (Kumar et al., 2017) to be consistent with domestication analyses.
16S rRNA gene analysis
Extraction
Following collection during observational or experimental animal work, fecal samples were tempo-
rarily stored at 20˚C then moved to 80˚C for long-term storage. Individual mouse pellets or
approximately 50 mg feces were used for DNA extraction using the E.Z.N.A. Soil DNA Kit
(Omega, Norcross, GA) following manufacturer’s instructions.
Sequencing
We performed 16S rRNA gene amplicon sequencing on fecal samples to determine gut microbial
community structure. We used custom barcoded primers (Caporaso et al., 2011) targeting the 515F
Reese et al. eLife 2021;10:e60197. DOI: https://doi.org/10.7554/eLife.60197 20 of 27Research article Ecology Evolutionary Biology
to 806Rb region of the 16S rRNA gene following published protocols (Caporaso et al., 2011;
Caporaso et al., 2012; Maurice et al., 2013). Sequencing was conducted on an Illumina HiSeq 2500
with single-end 150 bp reads in the Bauer Core Facility at Harvard University. Sequence files were
processed using QIIME version 1.8 (Caporaso et al., 2010). We demultiplexed the sequences using
split_libraries_fastq.py, then used parallel_pick_otus_uclust_ref.py to carry out closed reference
operational taxonomic unit (OTU) picking with 97% similarity using the default parameters under
UCLUST. Microbial taxonomy for these OTUs was assigned in reference to the GreenGenes data-
base (version 13.5) (DeSantis et al., 2006). We obtained 158,611 ± 109,567 assigned reads per
sample.
qPCR
To estimate total bacterial density, qPCR was performed on fecal DNA using the same primers as
used for sequencing. qPCR assays were run using PerfeCTa SYBR Green SuperMix Reaction Mix
(QuantaBio, Beverly, MA) on a Bio-Rad CFX384 Touch (Bio-Rad, Hercules, CA) in the Bauer Core
Facility at Harvard University. Cycle-threshold values were standardized against a dilution curve of
known concentration and then adjusted for the weight of fecal matter extracted.
Statistical analyses
All statistical analyses were carried out in R (R Core Team, version 3.3). Alpha-diversity (Shannon
index, OTU richness) were calculated for rarefied OTU tables (rarefaction limit of 17,500 for cross-
species dataset; 27,000 for wild mouse study; 15,500 for the mouse colonization study; 7,500 for
canid experiment). Beta-diversity (Bray–Curtis, Weighted UniFrac, Unweighted UniFrac) metrics were
calculated using the vegan package (Oksanen et al., 2017) or QIIME on unrarefied data. All statisti-
cal tests performed were non-parametric. PERMANOVA was carried out with the adonis2 function in
vegan with the domestication status variable nested within the species pair to correct for known rela-
tionships within dyads. To test how beta-diversity varied based on relatedness (within species,
between wild–domesticated pairs, or among unrelated pairs), domestication type (relative to US
human samples), or human/primate population (relative to zoo chimpanzee samples), we used a
bootstrapping approach, thus correcting for the non-independence of dissimilarity measurements
that include the same individuals in multiple comparisons. In short, we permuted the Mann-Whitney
U test statistics and p values, resampling (25,000 permutations) with stratification specified by indi-
vidual identity, using the boot package (Canty and Ripley, 2020). Variability in a species’ microbial
community composition was calculated with the permutest and betadisper functions in vegan. For
changes in family-level abundance, a Bonferroni correction for multiple hypothesis correction was
then applied to all test results.
Potential human pathogens were identified following published methods (Kembel et al., 2012;
Reese et al., 2016). In short, we obtained a list of potential human pathogens, compiled by Kembel
and colleagues (Kembel et al., 2012), then manually compared that list to the taxa identified to the
genus or species level in our analysis. A subset of the data containing only these species was then
analyzed for diversity with the same methods used for the total dataset.
To determine the consistency of gut microbial differences across ordination space due to domes-
tication, Pan–Homo divergence, or industrialization in the observational study, we calculated the
average position of the host dyad (e.g., pig/boar) or all primates (humans and chimpanzees) for axis
1 of the NMDS, then measured the displacement along each axis for an individual sample relative to
that mean position. We tested for differences in these ordination shifts by domestication status or
primate host taxonomy (e.g., chimpanzee versus US human). To estimate the direction and magni-
tude of changes in beta-diversity during the experimental studies, we tested whether inclusion of a
treatment group term improved the performance of a linear mixed effects model relative to a model
with only time and animal ID terms for predicting the NMDS1 axis value for an individual. These anal-
yses allowed us to consider the direction of beta-diversity changes in addition to the magnitude. We
estimated the direction and magnitude of dissimilarity from the expected community composition
(donor microbial community in gavage experiment; baseline species average for DomH/DomD or
WildH/WildD in diet experiments) as the length of the vector through the first axis of ordination
space. In analyzing the experimental diet study data, we used the lmer and anova functions in the
package lme4 (Bates et al., 2015) to perform likelihood tests comparing a linear mixed effects
Reese et al. eLife 2021;10:e60197. DOI: https://doi.org/10.7554/eLife.60197 21 of 27Research article Ecology Evolutionary Biology
model that included the variable of interest (i.e., treatment group) to a model that included only
time variables. In both models, individual identity was included as random effects.
We explored the role of relatedness in structuring the cross-species dataset by (i) performing a
Mantel test to compare divergence times and Bray–Curtis dissimilarities; (ii) testing for Spearman
correlations between the NMDS shifts and the time since divergence and performing likelihood tests
to compare a linear mixed effects model that included both domestication status and dyad as fixed
effects and divergence time as a random effect with a model that only included the dyad and diver-
gence time terms; and (iii) testing for Spearman correlations between the average dissimilarity within
a wild–domesticated dyad (e.g., the average dissimilarity for all combinations of boar–pig pairs) and
the time since domestication and time since divergence. We also used Mann–Whitney U tests to
determine if dissimilarity between unrelated pairs was higher than for wild–domesticated dyads or
within sets of conspecifics.
Acknowledgements
We thank many collaborators for help in collecting wild and domesticated animal fecal samples,
including Gwynne Durham and The Mountain School (cattle, pigs, sheep); Luina Greine Farm
(alpaca); Steve Ditchkoff (wild boar); Jason Munshi-South and Matthew Combs (rats); Pedro Monter-
roso, Marisa Rodrigues, and Marketa Zimova (European rabbits); Margaret Gruen and Kyle Smith
(dogs, wolves); Kevin Monteith (Bighorn sheep); J Scott Weese (bison); Cristián Bonacic (vicuña);
Bridget Alex, Hopi Hoekstra, Nicholas Holowka, Irene Li, Daniel Lieberman, Mark Omura, and Anto-
nia Prescott (wild mice). For help in collecting and processing wild chimpanzee samples, we thank
Tony Goldberg, Zarin Machanda, Martin Muller, Emily Otali, Leah Owens, Sarah Phillips-Garcia,
Richard Wrangham, and the staff of Kibale Chimpanzee Project. For assistance in collecting captive
chimpanzee samples, we thank the staff at Southwick’s Zoo, Mendon, MA. For assistance in carrying
out experiments, we thank Cary Allen-Blevins, Rachel Berg, Andy Biewener, Meg Callahan-Beckel,
Brian Hare, Kathleen Pritchett-Corning, Pedro Ramirez, and Emily Venable. For helpful comments on
the manuscript, we thank Daniel Lieberman, Richard Wrangham, and members of the Carmody lab.
Additional information
Funding
Funder Grant reference number Author
National Institute on Aging R01AG049395 Melissa Emery Thompson
Rachel N Carmody
Harvard University Dean’s Competitive Fund Rachel N Carmody
for Promising Scholarship
Harvard University William F. Milton Fund Aspen T Reese
The funders had no role in study design, data collection and interpretation, or the
decision to submit the work for publication.
Author contributions
Aspen T Reese, Conceptualization, Formal analysis, Funding acquisition, Investigation, Visualization,
Methodology, Writing - original draft, Writing - review and editing; Katia S Chadaideh, Mark Beckel,
Peggy Callahan, Roberta Ryan, Investigation, Methodology, Writing - review and editing; Caroline E
Diggins, Laura D Schell, Investigation, Writing - review and editing; Melissa Emery Thompson, Fund-
ing acquisition, Investigation, Writing - review and editing; Rachel N Carmody, Conceptualization,
Supervision, Funding acquisition, Visualization, Methodology, Writing - original draft, Project admin-
istration, Writing - review and editing
Author ORCIDs
Aspen T Reese https://orcid.org/0000-0001-9004-9470
Katia S Chadaideh https://orcid.org/0000-0003-2251-1170
Reese et al. eLife 2021;10:e60197. DOI: https://doi.org/10.7554/eLife.60197 22 of 27You can also read