Upregulation of RNA cap methyltransferase RNMT drives ribosome biogenesis during T cell activation
←
→
Page content transcription
If your browser does not render page correctly, please read the page content below
6722–6738 Nucleic Acids Research, 2021, Vol. 49, No. 12                                                              Published online 14 June 2021
https://doi.org/10.1093/nar/gkab465

Upregulation of RNA cap methyltransferase RNMT
drives ribosome biogenesis during T cell activation
Alison Galloway1 , Aneesa Kaskar1 , Dimitrinka Ditsova1 , Abdelmadjid Atrih2 ,
Harunori Yoshikawa 1 , Carolina Gomez-Moreira1 , Olga Suska1 , Marcin Warminski 4 ,
Renata Grzela3 , Angus I. Lamond1 , Edward Darzynkiewicz3 , Jacek Jemielity 4 and
Victoria H. Cowling 1,*
1
 Centre for Gene Regulation and Expression, School of Life Sciences, University of Dundee, Dow Street, Dundee

                                                                                                                                                              Downloaded from https://academic.oup.com/nar/article/49/12/6722/6298622 by guest on 24 August 2021
DD1 5EH, UK, 2 FingerPrints Proteomics Facility, School of Life Sciences, University of Dundee, Dundee, DD1 5EH,
UK, 3 Centre of New Technologies, University of Warsaw, 02-097 Warsaw, and Division of Physics, 02-093 Warsaw,
Poland and 4 Centre of New Technologies, University of Warsaw, 02-097 Warsaw, Poland

Received January 20, 2021; Revised May 09, 2021; Editorial Decision May 11, 2021; Accepted May 17, 2021

ABSTRACT                                                                        ordinate the actions of other immune cells by the secretion
         m7                                                                     of cytokines and factors. Following development in the thy-
The     G cap is ubiquitous on RNAPII-transcribed                               mus, naı̈ve T cells circulate through the blood and reside
RNA and has fundamental roles in eukaryotic gene                                in the lymphoid organs, quiescent but poised to respond to
expression, however its in vivo role in mammals                                 the recognition of an antigen through their cognate T cell
has remained unknown. Here, we identified the m7 G                              receptor (TCR). Strong TCR signalling drives T cell activa-
cap methyltransferase, RNMT, as a key mediator of                               tion, inducing cell growth, proliferation and differentiation
T cell activation, which specifically regulates ribo-                           into effector T cells. This requires the reprogramming of cel-
some production. During T cell activation, induction                            lular metabolism (1,2) and reshaping of the proteome (3,4),
of mRNA expression and ribosome biogenesis drives                               which are co-ordinated by global and gene-specific increases
metabolic reprogramming, rapid proliferation and dif-                           in transcription and translation (5–7). Critical to activation,
ferentiation generating effector populations. We re-                            T cell receptor (TCR) stimulation induces ribosome biogen-
                                                                                esis, producing the protein synthesis capacity required for
port that RNMT is induced by T cell receptor (TCR)
                                                                                rapid proliferation and effector molecule synthesis (8–10).
stimulation and co-ordinates the mRNA, snoRNA                                      Following transcription, RNA polymerase II (RNAPII)-
and rRNA production required for ribosome bio-                                  transcribed RNAs, including mRNA, miRNA, lncRNA,
genesis. Using transcriptomic and proteomic anal-                               snRNA and snoRNA precursors, are modified by the addi-
yses, we demonstrate that RNMT selectively regu-                                tion of a 7-methylguanosine (m7 G) RNA cap (11,12) (Fig-
lates the expression of terminal polypyrimidine tract                           ure 1A). m7 G cap formation involves cap guanosine addi-
(TOP) mRNAs, targets of the m7 G-cap binding pro-                               tion to the 5 end of nascent RNA, catalysed by the cap-
tein LARP1. The expression of LARP1 targets and                                 ping enzyme RNGTT (RNA guanylyltransferase and 5 -
snoRNAs involved in ribosome biogenesis is selec-                               phosphatase), followed by cap guanosine N-7 methylation
tively compromised in Rnmt cKO CD4 T cells re-                                  catalysed by RNMT (RNA guanine-7 methyltransferase)
sulting in decreased ribosome synthesis, reduced                                (12). RNMT has an activating subunit, RAM (RNMT-
                                                                                activating miniprotein/RAMAC), which increases methyl-
translation rates and proliferation failure. By enhanc-
                                                                                transferase activity and recruits RNA to the complex
ing ribosome abundance, upregulation of RNMT co-                                (13,14). Most non-coding RNAs lose their m7 G cap during
ordinates mRNA capping and processing with in-                                  maturation by cleavage or further modification to m2,2,7 G
creased translational capacity during T cell activa-                            trimethylguanosine.
tion.                                                                              The m7 G cap has fundamental functions; it recruits RNA
                                                                                processing, modification and translation factors, protects
INTRODUCTION                                                                    RNA from degradation and identifies it as self by block-
                                                                                ing the binding of viral RNA sensing receptors (12,15).
T cells have major roles in adaptive immunity; cytotoxic                        The discovery of regulation of the capping enzymes and
CD8 T cells directly kill infected or cancerous cells by the                    the identification of variants of the cap binding complexes
transfer of proteolytic enzymes and CD4 helper T cells co-

* To   whom correspondence should be addressed. Tel: +44 1382 386997; Email: v.h.cowling@dundee.ac.uk


C The Author(s) 2021. Published by Oxford University Press on behalf of Nucleic Acids Research.
This is an Open Access article distributed under the terms of the Creative Commons Attribution License (http://creativecommons.org/licenses/by/4.0/), which
permits unrestricted reuse, distribution, and reproduction in any medium, provided the original work is properly cited.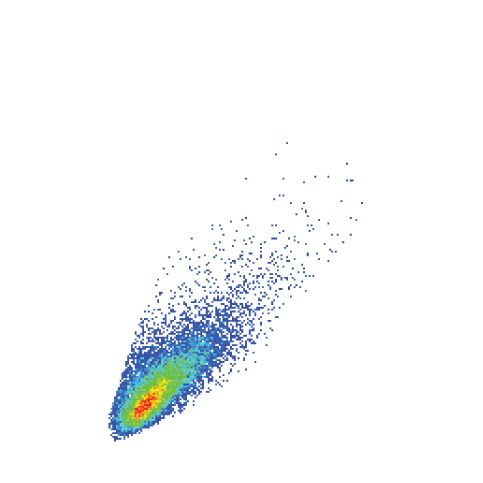
Nucleic Acids Research, 2021, Vol. 49, No. 12 6723

                                                                                                                                                                   Downloaded from https://academic.oup.com/nar/article/49/12/6722/6298622 by guest on 24 August 2021

Figure 1. RNMT is upregulated following T cell activation (A) m7 Gpppm6 Am cap structure with methyltransferases. (B) The Rnmt cKO T cell model: mature
and progenitor T cell populations are shown with the stage of Rnmt deletion and ex-vivo activation protocol. (C) Control CD4 T cells were activated, after
2 days IL2 was added. Western blot analysis of RNMT and RAM expression. (D) RNMT expression in 20 h-activated Rnmt cKO (n = 3) and control (n
= 3) CD4 T cells. Equivalent cell numbers analysed. (E, F) Cap methyltransferase activity in 1.6 × 10⁵ control (n = 3) and Rnmt cKO (n = 3) activated
CD4 T cells. GpppG capped RNA was incubated with the T cell extracts for the indicated times and the proportion of caps converted to m7 GpppG was
determined. (E) radiograph. (F) quantification. (G) FACS analysis of control (n = 5) and Rnmt cKO (n = 5) thymi. Quantification of single positive (SP)
cells and representative plots displaying live cells. Population names on control plot. Dots indicate biological replicates, lines indicate means, P values from
ANOVA with Sidak’s multiple comparisons test throughout. (H) FACS quantification of CD4 and CD8 T cells in spleens, peripheral lymph nodes (pLN),
and percentage in blood from control (n = 5) and Rnmt cKO (n = 5) mice. Figures are representative of (C, D) three and (G, H) two experiments.
6724 Nucleic Acids Research, 2021, Vol. 49, No. 12
reveals the RNA cap as a key integration point of sig- pH 7.05, 50 mM NaCl, 0.5% Triton X-10). For RNAPII
nalling pathways and gene expression (12,16–20). Such analysis, lysates were sonicated 3 × 30 s on a Biorup-
co- and post-transcriptional regulation mechanisms are in- tor (Diagenode) at medium intensity. Equivalent cell num-
creasingly recognised as integral to immune responses (21). bers were resolved by SDS-PAGE. For standard western
Here, we report that the m7 G cap methyltransferase, blots, proteins were transferred onto PVDF membranes
RNMT, is induced during T cell activation and is required (Millipore) with Tris-glycine buffer (25 mM Tris, 190 mM
for the substantial increases in RNA production, processing glycine, 20% methanol). For analysis of ribosomal proteins
and translation which support T cell expansion. Unexpect- the higher pH CAPs buffer (10 mM CAPs 20% methanol)
edly, RNMT has a gene-specific impact, controlling expres- was used. Membranes were incubated with primary an-
sion of a subset of RNAs including the terminal polypyrim- tibodies (Supplementary Table S1), followed by the rele-
idine tract (TOP) mRNAs encoding ribosomal proteins, ri- vant HRP-conjugated secondary antibodies (Supplemen-
bosome biogenesis factors and translation factors as well as tary Table S1) and developed with Pierce Super signal ECL
several non-coding snoRNAs involved in ribosome biogen- (Thermo Fisher scientific), visualised with X-ray film or us-
Downloaded from https://academic.oup.com/nar/article/49/12/6722/6298622 by guest on 24 August 2021
esis. TOP RNAs are stabilised by a specialised cap binding ing an ImageQuant LAS 4000 (GE healthcare). Western
protein, La-related protein 1 (LARP1), which has a pref- blots were quantified using NIH ImageJ software.
erence for binding to m7 G-capped TOP RNAs (22–25). We
identified the LARP1 binding sites in naı̈ve CD4 T cells and m7
GTP binding assay
found a correlation between cap-adjacent LARP1 binding
and reduced RNA expression in Rnmt cKO CD4 T cells. Ex- Jurkat cells were cultured in RPMI media, supplemented
pression of the proteins encoded by LARP1-bound RNAs with non-essential amino acids (Gibco) and sodium pyru-
were reduced in activated Rnmt cKO CD4 T cells, particu- vate (Gibco). Jurkat cell pellets were lysed using Buffer B
larly ribosomal proteins and proteins mediating ribosome (10 mM HEPES pH 7.4, 1 mM MgCl2 , 10 mM NaCl, 50
biogenesis and translation. Thus, we demonstrate that the mM NaF, 0.5% NP-40). Lysates were pre-cleared with Pro-
RNMT RNA regulon co-ordinates the mRNA synthesis tein A-Sepharose beads (Generon, PCA-125) for 30 min at
and ribosome biogenesis critical for T cell activation. 4◦ C, rotating. Lysate were split into equal parts, each in-
cubated with 40 ul m7 GTP-Agarose (Jena Bioscience) or
MATERIALS AND METHODS GTP-Sepharose for 2 h at 4◦ C. Beads were washed with
Buffer B. After washes, beads were re-suspended in LDS
Mice sample buffer (Novex) with 0.1 M DTT diluted in Buffer
Rnmt fl/fl mice with loxP sites flanking exon 3 of Rnmt were B. m7 GTP and GTP pulldown samples were resolved on the
sourced from Taconic Artemis Gmbh. CD4-Cre (Tg(Cd4- SDS-PAGE gels with SDS Running Buffer (25 mM Tris, 250
cre)1Cwi) (26) mice were gifted by Doreen Cantrell. Mice mM glycine, 0.1% SDS), then transferred to PVDF mem-
were maintained on a C57B6/J background in the Biolog- branes, which were probed with rabbit anti-LARP1 anti-
ical Resource Unit at the University of Dundee using pro- body (ProteinTech).
cedures approved by the University Ethical Review Com-
mittee and under the authorization of the UK Home Office Flow cytometry
Animals (Scientific Procedures) Act 1986.
Cells were incubated with labelled antibodies (Supplemen-
tary Table S1) and FC block (anti CD16/32, Biolegend) in
Preparation of cells FACS buffer (PBS + 2% FCS (Gibco)). Dead cells were la-
Lymph nodes (inguinal, brachial, axillary, superficial cer- belled with 0.1 g/ml DAPI or Fixable Viability Dye eFluor
vical, mesenteric, lumbar, caudal), spleens and thymi were 780 (eBioscience). For apoptosis, cells were stained with
dissected from mice, and mashed through a 70 m cell annexin V APC (Biolegend) in annexin V buffer (10 mM
strainer (Falcon) to prepare cell suspensions. Blood was HEPES pH 7.4, 140 mM NaCl, 2.5 mM CaCl2 , 4 mM KCl,
taken by cardiac puncture (following confirmation of death) 0.75 mM MgCl2 ). For translating ribosomes, cells were in-
and diluted in RPMI medium, red blood cells were lysed cubated with 1 ug/ml puromycin for 10 min at 37◦ C in
with ACK buffer (150 mM NH4 Cl, 10 mM KHCO3 , T cell culture medium, stained with Fixable Viability Dye
0.1 mM Na2 EDTA). Cells were counted either using the eFluor 780, fixed with 1% PFA in PBS (Santa Cruz Biotech)
BD FACSVerse (BD Biosciences) or Novocyte (Acea Bio- on ice, and permeablised and stained for puromycin and
sciences) flow cytometer, by haemocytometer (Fastread surface markers in saponin buffer (PBS+ 5% FCS + 0.1%
counting slides from Immune systems) or using AccuCheck saponin) (27). For cell cycle analysis, cells were fixed in 4%
counting beads (Thermo Fisher Scientific) in combination PFA, permeablised in ice cold 90% methanol 10% PBS, and
with a BD LSRFortessa (BD Biosciences) flow cytometer. stained with antibodies then 1 g/ml DAPI in FACS buffer.
Data was collected using either a BD FACSVerse, or LSR
Fortessa and analyzed using FlowJo10 (BD).
Western blotting
For analysis of RPs, LARP1 and RAM in supplemental
T cell culture
figure 1 M T cells were lysed directly in Laemmli buffer
(50 mM Tris pH 6.8, 2% SDS, 10% glycerol, 100 mM DTT, To measure proliferation, apoptosis, puromycin incorpora-
bromophenol blue). For analysis of RNAPII, RNMT and tion and forward scatter, lymph node cells were cultured in
RAM, T cells were lysed in F-buffer (10 mM Tris–HCl T cell culture medium (RPMI + 10% heat inactivated FCSNucleic Acids Research, 2021, Vol. 49, No. 12 6725
+ pen/strep + 50 M 2ME) with 0.5 ug/ml Ultra-LEAF Truseq kit with Ribozero Gold rRNA depletion. 20 h acti-
purified anti-mouse CD3ε antibody (clone 145-2C11, Bi- vated T cell cytoplasmic transcriptome and ribosome foot-
olegend), and 0.5 ug/ml Ultra-LEAF purified anti-mouse print libraries were prepared using the Illumina Truseq
CD28 antibody (clone 37.51, Biolegend). 20ng/ml IL-2 Ribo Profile (mammalian) kit. eCLIP was carried out as
(proleukin, Norvatis) was added on day 2. For analysis of described in the seCLIP protocol with a few modifica-
protein or RNA in CD4 T cells, magnet sorted CD4 T tions (32). Pseudouridine-seq was carried out according to
cells were cultured in T cell culture medium on anti-CD3 the -seq protocol (33). CD4 T cell RNAPII CHIPseq
(5 g/ml)/anti-CD28 (1 g/ml) coated plates. (RNAPII: GSM1903984, input: GSM1903982) (34), and
RAM knockdown HeLa cell RNAseq (GSE87767) (16),
datasets were obtained from NCBI Geo. Library prepara-
Preparation of CD4 T cells
tion methods and analysis are further detailed in supple-
To purify T cells, for most experiments CD4 T cells were mental materials and methods.
magnet sorted using EasySep mouse CD4 T cell isolation
Downloaded from https://academic.oup.com/nar/article/49/12/6722/6298622 by guest on 24 August 2021
kit (Stemcell Technologies), for the ribosome footprinting Mass spectrometry
experiment the mouse naı̈ve CD4 T cell kit was used, for
CAP-MAP, eCLIP, and -seq the Miltenyi mouse CD4 T CAP-MAP mass spec analysis was carried out as described
cell kit was used. For proteomics and naı̈ve T cell RNA se- previously. TMT proteomics was performed as described
quencing analysis, naı̈ve CD4 T cells were FACS sorted us- previously (35). Ribo Mega-SEC was performed as de-
ing the BD Influx (BD Biosciences), purities were > 98%. scribed previously (29). Further methods and analyses are
detailed in supplemental materials and methods.
RNA assays
Statistical analysis
N-7 cap guanosine methylation assay was performed ac-
cording to (14). The in vivo cap methylation assay was per- Excluding ‘omics’ data, statistical analyses and charts were
formed according to (28). More details in supplemental ma- generated in Graphpad Prism. Where used, t-tests were
terials. double sided and unpaired.
RNA was extracted using Tri-reagent (Sigma) or Tri-
zol (Thermo Fisher scientific) and quantified by Nanodrop Further information
(Thermo Fisher scientific). For qPCR, cDNA synthesised
using iScript (BioRad), then qPCRs performed on a Bio- Further detailed protocol information is available in the
Rad CFX384 using ssoFast Eva Green supermix (Bio- supplemental materials. Antibodies, primers and other key
rad) and primers in Supplementary Table S1. For mRNA reagents are listed in Supplementary Table S1.
extraction a Dynabeads mRNA DIRECT™ Purification
kit was used on total RNA with two rounds of purifi- RESULTS
cation. mRNA was quantified using the Qubit RNA HS
RNMT is upregulated following T cell activation
Assay Kit (Thermo Fisher scientific). For 3 H uridine la-
belling of RNA, cells were cultured with 0.37 MBq [5,6–3 H] Following T cell activation, major increases in transcrip-
uridine/ml medium, RNA and mRNA extracted and scin- tion and translation are likely to require increased produc-
tillation counts measured using Optiphase Hisafe3 scintil- tion of the m7 G cap to protect, process and translate the
lation fluid (Perkin Elmer) and a Tri-Carb 4910TR scintil- nascent mRNA. Consistent with this, we found that the
m7
lation counter (Perkin Elmer). G cap methyltransferase, RNMT, and co-factor, RAM,
For northern blotting, 1 g total RNA was analysed were upregulated downstream of T cell receptor (TCR) sig-
according to the previous report (29) with methylene nalling, induced using crosslinking antibody stimulation,
blue staining of 28S and 18S rRNAs for loading con- and maintained throughout CD4 and CD8 T cell activa-
trol. Oligonucleotides probes for pre-rRNA detection were: tion in the presence of the stimulatory cytokine interleukin 2
5 -ITS1, 5 -GCTCCTCCACAGTCTCCCGTTTAATGA (IL2) (Figure 1B, C, Supplementary Figure S1A–E). To as-
TC-3 ; ITS1-1b, 5 -CTCTCACCTCACTCCAGACACCT sess the role of RNMT in T cells, we crossed mice with Rnmt
CGCTCCA-3 ; ITS2-1, 5 -ACCCACCGCAGCGGGTG floxed alleles to mice expressing CD4-Cre to delete Rnmt at
ACGCGATTGATCG−3 (30,31). 3 -end biotin-labelled the double positive (DP) stage of T cell development (Fig-
oligonucleotides were synthesized by Eurofins Genomics. ure 1B, Supplementary Figure S1F). These cells are the de-
velopmental precursors to the mature T cells that are the
subject of this study (26). In Rnmtfl/fl CD4-Cre mice (Rnmt
DNA qPCR
cKO, conditional knock-out), RNMT protein was gradu-
DNA was isolated from CD4 T cells using a DNA blood ally lost during thymic T cell development and was mini-
and tissue kit (Qiagen). qPCR was performed as described mal in naı̈ve or activated lymph node CD4 T cells compared
for cDNA. to the equivalent cells in Rnmtfl/fl mice (controls) (Figure
1D, Supplementary Figure S1G–J). Deletion of Rnmt exon
3 in genomic DNA and loss of RNA reads aligning to Rnmt
RNA sequencing
exon 3 was confirmed in Rnmt cKO naı̈ve CD4 T cells (Sup-
Naı̈ve T cell transcriptome libraries were prepared by the plementary Figure S1K, L). The expression of RNMT and
Tayside Centre for Genomic Analysis using an Illumina RAM are co-dependent in other cell lineages, and RAM6726 Nucleic Acids Research, 2021, Vol. 49, No. 12
was repressed in activated Rnmt cKO CD4 T cells (Supple- the first transcribed nucleotide is cytosine (GpppCm), is the
mentary Figure S1M-N) (36). m7 G cap methyltransferase least tolerated incomplete cap structure, leading to loss of
activity was undetectable in Rnmt cKO in activated (Figure RNA initiating with a C on Rnmt deletion.
1E, F) or naı̈ve (Supplementary Figure S1O, P) CD4 T cell
extracts, confirming the loss of RNMT protein and the ab-
Rnmt deletion has a gene-specific impact including selective
sence of any entirely redundant m7 G cap methyltransferase.
loss of TOP mRNAs
Rnmt cKOs had normal numbers of DP, CD4 single positive
(SP) and CD8 SP in the thymus compared to controls, but To determine the impact of Rnmt deletion on RNA ex-
∼50% less CD4 and CD8 T cells in the peripheral lymph pression we performed RNA sequencing (seq) analysis on
nodes, spleen and blood (Figure 1G-H). The proportions naı̈ve CD4 T cells. Of 11 219 genes which passed analy-
of central or effector memory CD4 and CD8 T cells were sis thresholds, 753 were significantly reduced and 845 were
equivalent in Rnmt cKO mice and controls (Supplementary significantly increased in Rnmt cKOs compared to controls
Figure S1Q). Thus, loss of Rnmt has a moderate impact on (Figure 3A, Supplementary Table S2). Pathway analysis in-
Downloaded from https://academic.oup.com/nar/article/49/12/6722/6298622 by guest on 24 August 2021
T cell homeostasis. dicated that the downregulated transcripts were enriched
for ribosomal protein genes, with 58 of the 69 genes in
this pathway significantly decreased in Rnmt cKOs (Fig-
Cap guanosine N-7 methylation is reduced in Rnmt cKO T
ure 3A, Supplementary Figure S2B). Ribosomal protein
cells
(RP) genes were the only significantly enriched pathway
Although m7 G cap methyltransferase activity was minimal among the RNMT-sensitive genes, so we focussed further
in Rnmt cKO CD4 T cell extracts (Figure 1E-F, Supplemen- analysis on this group. Differential expression of selected
tary Figure S1O, P), it was important to determine the ex- genes was confirmed by RT-qPCR (Supplementary Figure
tent of mRNA and cap synthesis in vivo. The mRNA con- S2C). RP transcripts were highly abundant in naı̈ve CD4
tent per cell was unchanged in Rnmt cKO naı̈ve CD4 T T cells: using the reads per kilobase per million (RPKM)
cells, but the induction of mRNA synthesis following acti- as an approximation of transcript abundance they consti-
vation was impaired suggesting that RNMT and cap for- tuted ∼27% of the protein coding transcriptome, which re-
mation is more critical for RNA production in activated duced to ∼18% in Rnmt cKOs (Figure 3B, C). In HeLa
T cells (Figure 2A, B). Nevertheless, uridine incorporation cells, genes with highest RNAPII occupancy have the high-
into mRNA was equivalent on a per-mRNA basis at 20 est sensitivity to knockdown (KD) of RNMT-RAM (16).
h following activation, indicating comparable net mRNA Analysis of published RNAPII ChIP data indicated that
synthesis/degradation at this timepoint (Figure 2C). We RP genes also have high RNAPII occupancy in naı̈ve CD4
determined the rate of endogenous mRNA cap methyla- T cells (34), however, other transcripts with high RNAPII
tion in activated CD4 T cells by culturing them with 3 H- occupancy remain unaffected in Rnmt cKO CD4 T cells
methionine, which is converted to the methyl donor, S- (Supplementary Figure S2D), indicating that high RNAPII
adenosyl methionine (SAM), leading to 3 H-labelling of is not predictive of RNMT dependence in CD4 T cells.
methyltransferase substrates (28). Methylation of internal Furthermore, unlike in HeLa cells, RNAPII CTD (C-
nucleotides did not change in Rnmt cKO CD4 T cells com- terminal domain) Ser-5 and Ser-2 phosphorylation and net
pared to controls, consistent with no change in net mRNA mRNA synthesis/degradation were not RNMT-dependent
synthesis/degradation (Figure 2D, Supplementary Figure suggesting that transcription is not significantly regulated
S2A). Cap methylation, which includes both m7 G and first through RNMT in CD4 T cells (Figure 2C, Supplementary
nucleotide methylation, was reduced by ∼30% in Rnmt cKO Figure S2E, F).
CD4 T cells (Figure 2D, E). Given that we do not expect Transcripts encoding RPs and certain translation factors
first nucleotide methylation to be affected, this indicates a are members of a family of mRNAs initiating with cytosine
significant reduction in the rate of m7 G formation. followed by a terminal oligopyrimide (TOP) motif in their
The cap structures present on mRNA from activated 5 untranslated region (UTR). TOP RNAs bind to a spe-
T cells were quantified by CAP-MAP mass spectrome- cialised cap binding protein, La-related protein 1 (LARP1),
try (37). Rnmt cKO CD4 T cells had significantly more which enhances their stability and represses their transla-
cap structures which lack m7 G: GpppGm , Gpppm6 Am , and tion in MTOR and CDK1-regulated mechanisms that coor-
GpppAm , and significantly less mature m7 G-cap struc- dinate ribosome biogenesis with cell growth and circadian
tures: m7 GpppCm , m7 GpppGm and m7 GpppAm than con- rhythms (24,38–45). Canonical cap binding proteins such
trols (Figure 2F). Our protocols do not detect m7 GpppUm . as EIF4E of the EIF4F complex and NCBP2 of the CBC
Over 99% of control CD4 T cell mRNA had a m7 G cap complex bind to caps on all mRNA and as such have a high
structure, whereas in Rnmt cKOs m7 G-caps were reduced specificity for the m7 G cap, but little preference for the iden-
by 28% on mRNAs initiating with guanosine and by 17% tity of the first transcribed nucleotide (46,47). LARP1 is a
on mRNAs initiating with adenosine (Figure 2G). Thus in specialised cap binding protein which has a >90 fold pref-
Rnmt cKO CD4 T cells, m7 G-caps are synthesised at a lower erence for TOP RNA (in which C is the first transcribed
rate, their steady state concentration is lower, but the mod- nucleotide) over mutated TOP RNA with G as the first
ification is still abundant, indicating selection for mRNA transcribed nucleotide (40). Therefore, we initially focussed
bearing a complete m7 G cap structure. Interestingly, Rnmt on investigating a potential role for LARP1 in mediating
cKOs had a 35% decrease in mRNA initiating with cyto- the impact of RNMT on TOP-RNA expression, although
sine, but ∼95% of this mRNA had an m7 G cap (Figure 2G, other cap binding proteins are also likely to have a role in
H). This implies that the incomplete cap generated when regulating their stability, export and expression (see later).Nucleic Acids Research, 2021, Vol. 49, No. 12 6727
Downloaded from https://academic.oup.com/nar/article/49/12/6722/6298622 by guest on 24 August 2021
Figure 2. Rnmt cKO T cells have reduced mRNA cap methylation and C-initiating mRNA (A) dT-purified mRNA/cell from control (n = 5) and Rnmt
cKO (n = 4) naı̈ve CD4 T cells. Dots represent biological replicates, bars indicate means. P values from Student’s t-test. (B, C) 20 h-activated CD4 T cells
were incubated with 3 H uridine for 4 h. mRNA was dT-purified from control (n = 6) and Rnmt cKO (n = 6) cells. (B) mRNA per million cells. (C) CPM
per g mRNA. Dots represent biological replicates, bars indicate means. P values from Student’s t-test. Data combined from two experiments. (D, E) CD4
T cells activated for 20 h were 3 H-labelled on methyl groups for 2.25 h. Nucleotides from total RNA from control cells (n = 1), and mRNA from control (n
= 3) and Rnmt cKO cells (n = 4) were resolved by chromatography. Equivalent RNA loaded. (D) Counts per minute (CPM) presented. Elution volumes of
cap dinucleotides and nucleotides determined using standards. Points represent replicates, lines join medians. (E) CPM from cap dinucleotides, fractions
28–34 ml. Dots represent biological replicates, bars indicate mean. P value from Student’s t-test. (F, H) CAP MAP analysis in Rnmt cKO and control 20
hour activated CD4 T cells. (F) Quantitation of cap structures. P values from multiple t-tests corrected with FDR approach * P6728 Nucleic Acids Research, 2021, Vol. 49, No. 12
A B C
Downloaded from https://academic.oup.com/nar/article/49/12/6722/6298622 by guest on 24 August 2021
D E F
G
H I
Figure 3. LARP1 target RP mRNAs are sensitive to loss of Rnmt (A–C) RNAseq analysis of control (n = 3) and Rnmt cKO (n = 3) naı̈ve CD4 T cells. (A)
MA plot of RNA expression. Dots represent genes. Reads per million mapped reads (RPKM) on x-axis. Control and Rnmt cKO samples were compared
using EdgeR exact test and adjusted P-value used. Ribosomal protein genes and other TOP-RNA genes indicated. (B) Distribution of RPKM within all
genes or ribosome protein genes (RPGs) in control and Rnmt cKO naı̈ve CD4 T cell RNAseq data. (C) % of transcripts from RPG calculated using RPKM
as an approximation of transcript abundance. (D) Western blot analysis of LARP1 from Jurkat cell lysates enriched on m7 GTP- or GTP-agarose beads.
Data representative of three experiments. (E-I) LARP1 eCLIP of control and Rnmt cKO naı̈ve CD4 T cells. Distribution of reads as counts per million
(CPM) across protein-coding transcripts (E) and non-coding genes (pseudogene and lncRNA) (F) with LARP1 binding sites. (G) Distribution of reads
from LARP1 eCLIP on control naı̈ve CD4 T cells as counts per million (CPM) along target transcripts for three different anti-LARP1 antibodies. (All
other data is Abcam ab86359 antibody which was selected for further analysis). (H) Nucleotide composition surrounding LARP1 binding sites in 5 UTRs.
(I) Reads from anti-LARP1 antibody purified transcripts, isotype control antibody, and size matched input reads aligning to two example LARP1 target
transcripts. Genes annotated, dark yellow = protein coding transcripts, light yellow = non-coding genes, blue = snoRNA. CD4 T cell CAGE data from
FANTOM 5 project shown for reference. Counts are the number of reads starting at that position; read starts are expected to be 1nt downstream of the
crosslink site.Nucleic Acids Research, 2021, Vol. 49, No. 12 6729
Importantly, other established TOP RNAs were repressed La-module in a cap-independent manner, it is likely that
in Rnmt cKO CD4 T cells (Figure 3A), and RP and other some of the RNMT-insensitive LARP1 targets are bound
TOP RNAs were repressed in RNMT-RAM KD HeLa cells through this mechanism, which may have distinct regula-
(Supplementary Figure S2G), and in RNMT-compromised tory effects (49).
U2OS cells, indicating a conserved mechanism linking TOP The pattern of LARP1 binding in Rnmt cKO cells was
RNA abundance to RNMT activity (16,48). similar to controls (Figure 3E, F, I, Supplementary Fig-
ure S3C), and notably the expression of LARP1 itself is
not altered in Rnmt cKO CD4 T cells (Supplementary Fig-
LARP1 binding is predictive of RNMT dependence
ure S4A, B). As discussed earlier, only fully methylated
m7
LARP1 has multiple modes of RNA binding. The LA- GpppCm , and not GpppCm , was readily detected in Rnmt
module, made up of the LA-motif, PAM2 (PABPC1- cKO CD4 T cells, whereas unmethylated caps on non-TOP
binding) domain and RRM (RNA recognition motif), can RNAs, GpppAm, Gpppm6 Am and GpppGm, were abundant
bind to the TOP motif in a cap-independent manner (49). (Figure 2F, G). These data imply that only TOP-RNAs with
Downloaded from https://academic.oup.com/nar/article/49/12/6722/6298622 by guest on 24 August 2021
The LA-module also recognises the polyA tail directly a mature cap (i.e. m7 GpppCm ) are stable, and GpppCm TOP
and through interacting with the polyA-binding protein mRNA is degraded leading to the selective loss of GpppCm
PABPC1 (23,24,44,49,50). The DM15 domain is the cap- transcripts in Rnmt cKO CD4 T cells. TOP RNAs with in-
binding domain and binds the cap structure and TOP mo- complete cap structures would be predicted to bind less ef-
tif (40,51,52). The DM15 domain binds to the RNA cap ficiently to LARP1, which could be responsible for their re-
through a pi-stacking mechanism consistent with a pref- duced stability in Rnmt cKO cells. In addition, we cannot
erence for the more positively charged m7 G-cap over a rule out the enhanced dependency of TOP RNAs on other
G-capped structure (40,52). Accordingly, we found that cap binding proteins or associated factors.
LARP1 had increased interaction with m7 GTP over GTP
in vitro (Figure 3D).
Expression of small RNAs and mRNA processing is RNMT-
In HEK293 cells, PAR-CLIP analysis demonstrated that
dependent
LARP1 is bound predominantly to the CDS and 3 UTRs
(39). We sought to identify candidates for cap-dependent Many small RNAs including snRNAs, scaRNAs, snoR-
(5 proximal) LARP1 binding in naı̈ve CD4 T cells by NAs and their precursors are initially synthesised with a
m7
enhanced crosslinking immunoprecipitation (eCLIP) se- G cap. In addition, several snoRNAs are excised from
quencing analysis (Supplementary Figure S3A) (32). In the introns of pre-mRNAs or lncRNA hosts, of which we
contrast to the previous report, we found that in CD4 T identified 60 as LARP1-bound (Supplementary Table S3).
cells, the majority of direct LARP1-RNA interactions oc- 50 snoRNAs were detected in the naive CD4 T cell RNAseq
curred close to transcript start sites (TSS) in both cod- analysis, of which 33 were reduced in Rnmt cKO T cells
ing (Figure 3E) and non-coding (lnc-RNA and pseudo- (Figure 4C, Supplementary Table S4), these included both
genes) targets (Figure 3F). The TSS-adjacent binding pat- those encoded within LARP1 targets and those that were
tern was observed with three anti-LARP1 antibodies (Fig- not known to be associated with LARP1. All RNAPII-
ure 3G). Overall, we identified 367 LARP1 binding sites transcribed snRNAs were repressed in naı̈ve Rnmt cKO
within transcript 5 UTRs, and these had the expected CD4 T cells compared to controls (Figure 4C, Supplemen-
pyrimidine rich motif (Supplementary Figure S3B, Fig- tary Table S4). The snRNA U6 was not repressed, as ex-
ure 3H, Supplementary Table S3). These TSS-adjacent and pected, since as a RNAPIII-transcript it is synthesised with-
TOP motif-containing binding sites are good candidates for out a m7 G cap. Four of the five scaRNAs detected were also
cap-dependent binding through the DM15 domain. Several repressed in the Rnmt cKO T cells compared to controls. In-
binding sites were also identified in long non-coding RNA terestingly, the expression of several snoRNA and snRNAs
(lncRNA), including snoRNA host genes, and upstream of were also reduced in RNMT-RAM KD HeLa cells, indicat-
or within RP and translation factor pseudogenes (Supple- ing a conserved role for RNMT in small RNA expression
mentary Figure S3B) (53). Examples of LARP1 eCLIP data (Supplementary Figure S4C) (16).
alignment to individual coding and non-coding genes are snoRNAs are involved in the cleavage, methylation and
shown in Figure 3I and Supplementary Figure S3C. CAGE pseudouridylation of ribosomal RNA, and are required for
data from the FANTOM5 project are shown as a reference ribosome biogenesis (see later). snRNAs are essential con-
(54). stituents of spliceosomes and scaRNAs guide snRNA mod-
LARP1 binding to 5 UTRs, but not other sites, corre- ifications. Additionally, a major function of the RNA cap
lated with mRNA repression in the Rnmt cKO CD4 T cells is to promote splicing of the first intron via an interaction
(Figure 4A). LARP1-bound lncRNA (or snoRNAs derived with cap binding complex (CBC) (55–57). Therefore, we in-
from them) and pseudogenes were also repressed in Rnmt vestigated splicing in naı̈ve CD4 T cells. Rnmt cKO T cells
cKO cells (Figure 4A). mRNAs identified as LARP1 tar- had a mild defect in first intron splicing resulting in a rela-
gets included the classical TOP transcripts encoding RPs tive increase in reads aligning to intron 1 across many genes
and translation factors and additional targets in other path- (Figure 4D-E). This finding was recapitulated in cytoplas-
ways including signalling, energy metabolism, splicing and mic RNA from activated T cells (Supplementary Figure
nucleolar functions; amongst these functional groups, RPs, S4D-E). The intron 1 bias of the splicing defect in Rnmt
translation factors and nucleolar proteins were most consis- cKOs is consistent with defects in CBC recruitment rather
tently affected by Rnmt loss (Supplementary Table S3, Fig- than a general effect on splicing. Following activation, Rnmt
ure 4B). Since LARP1 can bind to the TOP motif via the cKO CD4 T cells have less mRNA per cell than their con-6730 Nucleic Acids Research, 2021, Vol. 49, No. 12
Downloaded from https://academic.oup.com/nar/article/49/12/6722/6298622 by guest on 24 August 2021
Figure 4. Small RNAs are sensitive to loss of Rnmt (A, B) Fold change in RNA expression from Rnmt cKO vs control naı̈ve T cell RNAseq analysis.
LARP1 target transcripts identified by eCLIP. (A) Transcripts grouped by LARP1 binding position and transcript biotype. (B) Transcripts with LARP1
binding to the 5 UTR grouped by functional pathway. (C) sRNA expression in RNAseq analysis of control (n = 3) and Rnmt cKO (n = 3) naı̈ve CD4
T cells. sRNAs are grouped by RFAM family and highlighted if at least one gene overlaps with a LARP1 target, defined as 5 UTR or non-coding RNA
binding. (D, E) Splicing analysis performed using RNAseq data from control (n = 3) and Rnmt cKO (n = 3) naı̈ve CD4 T cells. Exons and introns reads
normalised to total reads for that transcript. Then exon and intron read densities for each transcript compared between controls and Rnmt cKOs. (D)
Violins represent the frequency density. Box plots show median, upper and lower quartiles. Whiskers, 1.5× interquartile range. (E) Pie chart of significantly
altered introns and exons determined using DEXseq. Numbers indicate the number of significant differential splicing events in each group.
trol counterparts (Figure 2A); reduced mRNA processing cell cycle entry after activation, and exhibited increased
linked to loss of CBC interaction is likely to contribute to- apoptosis (Figure 5B–D, Supplementary Figure S5B, C).
wards this effect. Activated Rnmt cKO T cells had lower forward scatter, a
proxy of cell size, than controls (Figure 5E, Supplementary
RNMT is essential for T cell activation Figure S5D). Puromycin incorporation, an indicator of the
number of translating ribosomes, was decreased in Rnmt
Having established that RNMT has gene-specific impacts cKO T cells following activation (27) (Figure 5F, Supple-
in naı̈ve T cells, we proceeded to determine its role in T cell mentary Figure S5E). Thus, the biosynthetic pathways driv-
activation where transcription, translation and RNMT ac- ing increased protein synthesis, cell growth, and cell cycle
tivity are considerably increased (Figure 1B,C). Rnmt cKO entry are RNMT-dependent.
and control lymph node cells were activated ex vivo for
2 days by CD3 and CD28 co-receptor stimulation, followed
RNMT has a gene-specific impact on transcript abundance in
by IL2 addition. The high affinity IL2 receptor, CD25, and
activated T cells
type C lectin, CD69, hallmarks of TCR stimulation, were
induced equivalently in Rnmt cKO and control CD4 and We determined the transcriptome-wide effects of Rnmt dele-
CD8 T cells following activation, indicating that TCR sig- tion in CD4 T cells following 24 h of activation: of 10,126
nalling is intact and induction of certain proteins is RNMT- genes analysed, 2874 were significantly repressed and 2726
independent (58) (Figure 5A, Supplementary Figure S5A). were significantly increased (Figure 5G, Supplementary Ta-
Control T cells proliferated rapidly following stimulation ble S5). In activated CD4 T cells, the mRNA per cell was
whereas Rnmt cKO T cells failed to proliferate, had delayed reduced in Rnmt cKOs by 30% compared to controls, re-Nucleic Acids Research, 2021, Vol. 49, No. 12 6731
Downloaded from https://academic.oup.com/nar/article/49/12/6722/6298622 by guest on 24 August 2021
Figure 5. Rnmt cKO T cells have a defect in protein synthesis following activation (A–F) Control and Rnmt cKO lymph node cells were activated, after 2
days IL2 was added. (A) FACS analysis of CD69 and CD25 in control (n = 5) and Rnmt cKO (n = 5) CD4 T cells. Median fluorescence intensity (MFI)
shown. On dot plots, dots indicate biological replicates, line indicates mean. (B) Proliferation of control (n = 3) and Rnmt cKO (n = 3) CD4 T cells. (C)
FACS analysis of cell cycle of control (n = 5) and Rnmt cKO (n = 5) CD4 T cells, P-values are for % S phase cells. Bar indicates the mean, error bars
indicate standard deviation. (D) Percent of control (n = 5) and Rnmt cKO (n = 5) annexin V+ CD4 T cells. (E) Example FACS plots showing forward
and side scatter of control (1 of n = 5) and Rnmt cKO (1 of n = 5) CD4 T cells following one day of activation. (F) MFI of Puromycin incorporation into
nascent peptides in control (n = 5) and Rnmt cKO (n = 5) CD4 T cells. P-values from ANOVA tests with Sidak’s post test. (G–K) Ribosome footprinting
analysis of cytoplasmic RNA from control (n = 3) and Rnmt cKO (n = 3) 20 h activated CD4 T cells. On scatter plots dots represent genes. Genes with
LARP1 binding to transcript 5 UTR in pink. (G) MA plot of total RNA expression. Reads per million mapped reads (RPKM) on x-axis. Control and
Rnmt cKO samples compared using EdgeR Exact Test. (H) Comparison of fold changes in total RNA and ribosome protected fragment (RPF) RNA.
Differential translation efficiency (TE) in control and Rnmt cKO was calculated using Ribodiff. (I) Venn diagram displaying overlap between differentially
expressed total RNA and RPF RNA, both P < 0.05 with EdgeR exact test. (J) Comparison of fold changes in total RNA and translation efficiency (TE).
(K) Venn diagram displaying overlap between differentially expressed total RNA P < 0.05 with EdgeR exact test, and translation efficiency, P < 0.05 with
Ribodiff. Figures representative of (A– F) two experiments.6732 Nucleic Acids Research, 2021, Vol. 49, No. 12
flecting the impact of RNMT on mRNA transcription, pro- is known to be translationally repressed in naı̈ve T cells,
cessing and stability (Figure 2B). Because of this impact and thus forms a pre-transcribed pool poised for expres-
on RNA levels, single gene repression will be underesti- sion upon T cell activation (3). Indeed, following activa-
mated and upregulation overestimated in RNA seq anal- tion, many proteins were expressed in a Rnmt-dependent
ysis. LARP1 target mRNAs were repressed in Rnmt cKO manner (Figure 6C, D, Supplementary Table S7). Consis-
activated CD4 T cells, and pathways analysis revealed de- tent with decreased protein synthesis and cell size, the pro-
creased expression of mRNAs encoding RPs and proteins tein content was about 15% lower in Rnmt cKO cells than
involved in fatty acid oxidation and synthesis, the electron controls (Figure 6C, D). From 4495 proteins detected, 838
transport chain and TCA cycle, and DNA repair and repli- proteins were significantly decreased and 32 were increased.
cation (Figure 5G, Supplementary Figure S5F). Decreased Pathway analysis indicated that RPs were the most strongly
expression of genes involved in these biosynthetic and en- repressed proteins, with translation factors, DNA repli-
ergy producing pathways is consistent with the decreased cation and cholesterol biosynthesis also repressed (Sup-
proliferation and delayed cell cycle entry observed. plementary Figure S6A). Reduced expression of the RPs
Downloaded from https://academic.oup.com/nar/article/49/12/6722/6298622 by guest on 24 August 2021
Activated Rnmt cKO CD4 T cells had fewer translating RPS3 and RPS19 in the Rnmt cKO activated CD4 T
ribosomes (Figure 5F), and a proportion of their mRNA cells was confirmed (Figure 6E, Supplementary Figure
lacked the m7 G cap required for efficient translation (Fig- S6B).
ure 2F, G). Thus, we investigated if there was a gene- In activated Rnmt cKO CD4 T cells, we found a correla-
specific reduction in translation. Ribosome footprinting de- tion between LARP1-binding to the transcript 5 UTR and
tects ribosome-bound mRNA (ribosome protected frag- repression of the protein product (Figure 6D). Thus, al-
ments, RPFs), the relative abundance of which approxi- though in naı̈ve RNMT cKO T cells the selective repres-
mates translation efficiency (TE) (59). Since the number of sion of TOP RNAs had minimal impact on protein syn-
translating mRNAs and total mRNA abundance are lower thesis, these transcripts were critical for protein expression
in Rnmt cKOs most mRNA will be translationally repressed following activation. Of LARP1 target transcripts groups,
compared to controls. Therefore, we cannot infer absolute the most repressed proteins were RPs, translation factors
differences in translation, but can compare relative changes and nucleolar proteins (Figure 6F). Focussing on the nu-
in efficiency of translation, i.e. whether certain mRNAs are cleolar proteins which contribute to ribosome biogenesis
preferentially translated in Rnmt cKOs or whether all are (Figure 6G), the Rnmt cKO activated T cells had reduced
equally repressed. For the majority of mRNAs, the fold expression of the RNAPI component TAF1D, RNAPI/III
change in RPFs matched the fold change in mRNA, indi- component POL1RC and nucleolin (NCL) all of which
cating equivalent TE in Rnmt cKOs compared to controls promote rRNA transcription (60–62). Components of the
(Figure 5H-I). However, in the Rnmt cKO, 732 mRNAs had U3 snoRNP which mediates rRNA cleavage, UTP14a and
a significantly decreased TE, of which the majority had in- IMP3 (63,64), the pseudouridine methyltransferase EMG1
creased total RNA; and 276 mRNAs had a significantly in- and nucleophosmins 1 and 3 were also decreased (65,66).
creased TE, of which the majority had decreased total RNA These ribosome biogenesis factors all have LARP1 binding
(Figure 5J, K, Supplementary Table S5). Despite the loss sites.
of RNMT activity (Figure 1E, F), much of the mRNA in In HeLa cells, RNMT regulates ribosome biogene-
Rnmt cKO CD4 T cells had a m7 G cap (Figure 2F, G), how- sis through upregulation of c-MYC (67). Notably c-Myc
ever, the percentage m7 G-capped RNA varied depending mRNA was induced rather than repressed on Rnmt dele-
on the first transcribed nucleotide. In the Rnmt cKO cells, tion in activated CD4 T cells and there was no evidence of
RNAs initiating with C, which includes TOP-RNAs, had repression of the Myc transcriptional program (Supplemen-
the greatest proportion of caps with a m7 G structure (Figure tary Figure S6C). Conversely RNMT expression is depen-
2F, G). We would expect mRNAs with the m7 G cap to have dent on Myc in activated T cells and induction of RNMT is
greater translation efficiency due to their greater affinity to likely to contribute to the mechanism through which Myc
the translation initiation factor EIF4E (46). Accordingly, of induces ribosome biogenesis (Supplementary Figure S6D)
the 276 mRNAs with increased TE in Rnmt cKO, 93 were (68).
LARP1 target (C-capped) mRNAs. Conversely, we predict
that those RNAs that are stable in the absence of a m7 G cap
Ribosome biogenesis is RNMT-dependent in activated CD4
will be translationally repressed mRNA in the Rnmt cKO.
T cells
Since the ribosomal proteins, snoRNAs and ribosome bio-
Ribosome protein synthesis is RNMT-dependent in activated
genesis factors were repressed following Rnmt deletion, we
CD4 T cells
investigated the impact on ribosome biogenesis. Whilst the
We investigated whether deletion of Rnmt had an impact total RNA (mostly rRNA) content of naı̈ve CD4 T cells was
on the proteome of naı̈ve and activated CD4 T cells us- unchanged on Rnmt deletion, following activation the RNA
ing quantitative mass spectrometry. This revealed few differ- per cell and net rate of total RNA synthesis/decay was re-
ences in protein expression in Rnmt cKO naı̈ve T cells com- duced in Rnmt cKO T cells compared to controls (Figure
pared to controls; of 3874 proteins detected 12 were signif- 7A-C). Activated Rnmt cKO CD4 T cells had lower levels
icantly increased and 12 were significantly decreased (Fig- of monosomes and polysomes than controls, as assessed
ure 6A, Supplementary Table S6). Although LARP1 target by Ribo Mega-SEC profiling (29) (Figure 7D, E). Thus,
mRNAs were repressed in these cells, their proteins were RNMT is critical for the induction of ribosome biogenesis
minimally affected (Figures 3A and 6A, B). TOP mRNA following T cell activation.Nucleic Acids Research, 2021, Vol. 49, No. 12 6733
Downloaded from https://academic.oup.com/nar/article/49/12/6722/6298622 by guest on 24 August 2021
Figure 6. RNMT promotes expression of ribosome biogenesis factors in activated T cells TMT proteomics analysis of (A, B) control (n = 4) and Rnmt
cKO (n = 3) naı̈ve CD4 T cells; (C, D) control (n = 4) and Rnmt cKO (n = 4) 20 h-activated CD4 T cells. (A, C) MA plot of protein expression. Control and
Rnmt cKO samples compared by linear modelling in Limma using histone protein intensities to normalise expression between samples. Black dashed line
is at Log2 (Rnmt cKO/control) = 0 and blue dashed line on (C) indicates the median Log2(Rnmt cKO/control). (B, D) Fold change in proteins encoded
by LARP1 target transcripts (eCLIP), in Rnmt cKO vs control naı̈ve. Black dashed line is at log2 (Rnmt cKO/control) = 0 and blue dashed line on (D)
indicates the median log2 (Rnmt cKO/control). (E) Western blot analysis of ribosomal proteins in control (n = 4) and Rnmt cKO (n = 4) 20 hour activated
CD4 T cells. (F) Fold change in proteins in Rnmt cKO versus control activated CD4 T cells, proteins encoded by LARP1 target transcripts (eCLIP), defined
here as 5 UTR binding, are grouped by pathway. Black dashed line is at log2 (Rnmt cKO/control) = 0 and blue dashed line indicates the median log2 (Rnmt
cKO/control). (G) Comparison of protein and RNA expression from 20 h activated T cell cytoplasmic RNAseq and TMT proteomics analyses. Nucleolar
proteins with LARP1 binding to their transcript 5 UTR mRNA highlighted.6734 Nucleic Acids Research, 2021, Vol. 49, No. 12
Downloaded from https://academic.oup.com/nar/article/49/12/6722/6298622 by guest on 24 August 2021
Figure 7. RNMT promotes ribosome biogenesis in activated T cells (A) RNA/cell from control (n = 5) and Rnmt cKO (n = 4) naı̈ve CD4 T cells. Dots
represent biological replicates, bars indicate means. P values from Student’s t-test. (B, C) 20 h activated CD4 T cells were incubated with 3 H uridine for
4 h. (B) RNA per million control (n = 4) and Rnmt cKO (n = 4) cells. (C) CPM per g RNA from control (n = 6) and Rnmt cKO (n = 6) cells (data
combined from two experiments). Dots represent biological replicates, bars indicate mean. P values from Student’s t-test. (D, E) Ribo Mega-SEC analysis
of control (n = 3) and Rnmt cKO (n = 3) activated CD4 T cells, equivalent cells were loaded. (D) Polysome profiles. Lines represent biological replicates. (E)
Peak areas for 80S/polysomes, 60S and 40S ribosomes. Dots indicate biological replicates. Line indicates the mean. P values from an ANOVA with Sidak’s
post-test. (F, G) Northern blot analysis of rRNA intermediates in control (n = 3) and Rnmt cKO (n = 3) activated CD4 T cells. (F) Diagram explaining the
fragments and probes. (G) Northern blots. Each column number represents a biological replicate. (H) Pseudouridine ()-seq analysis of control (n = 4) and
Rnmt cKO (n = 4) activated CD4 T cells. PSU-score = (read starts/read coverage) CMC treated/(read starts/read coverage) mock treated for nucleotide
downstream of . Samples compared by linear modelling in Limma, no significant changes found. Figures representative of (D, E) three experiments.Nucleic Acids Research, 2021, Vol. 49, No. 12 6735
Having established that ribosome biogenesis was reduced m7
GpppCm capped-RNA (predominantly TOP transcripts)
in Rnmt cKOs we investigated the impact on ribosome qual- are proportionate (∼30%), and incompletely methylated
ity control. We characterised the protein content of ribo- GpppCm structures are rare compared to other incomplete
somes in activated Rnmt cKO CD4 T cell ribosomal frac- structures such as GpppGm , implying that GpppCm -capped
tions and found no significant differences in relative abun- RNA is unstable. Thus, the protective relationship between
dance of any RP in any ribosomal fraction (Supplementary TOP RNAs and the cap binding protein LARP1 may selec-
Figure S7, Table S8). snoRNAs can either guide pre-rRNA tively sensitise them to RNMT loss.
cleavage, pseuouridylation or ribose 2 O-methlyation and The link between RNMT expression and TOP-RNA ex-
we found examples of each class to be downregulated in pression is robust, being present in naı̈ve and activated
Rnmt cKO CD4 T cells (Supplementary Table S4). Analysis mouse CD4 T cells as well as human cancer cells. De-
of rRNA processing intermediates demonstrated equivalent spite this strong correlation between LARP1-RNA binding
rRNA processing in the control and Rnmt cKO activated and RNMT-dependency, other mechanisms could also con-
CD4 T cells (Figure 7F, G). Pseudouridine ()-seq analysis tribute to the specification of RNMT-dependent RNAs. For
Downloaded from https://academic.oup.com/nar/article/49/12/6722/6298622 by guest on 24 August 2021
of rRNA activated CD4 T cells detected pseudouridine in instance, TOP-RNAs may be more dependent on other cap
75 positions (33), but revealed no differences in the conver- binding complexes such as CBC, eIF4E and export com-
sion of uridine to pseudouridine in the control and Rnmt plexes for their splicing, co-transcriptional stability or ex-
cKO (Figure 7H, Supplementary Table S9). Thus, RNMT port, all of which can contribute to RNA stability. How-
controls the rate, but not the quality of ribosome biogenesis. ever, unlike LARP1, other analysed cap binding proteins
In conclusion, we report that during T cell activation, have no significant binding preference towards the caps of
upregulation of RNMT co-ordinates mRNA capping and TOP RNAs over other m7 G-capped RNAs. It is also possi-
maturation with increased translational capacity by selec- ble that other factors influence RNMT-dependent expres-
tively upregulating the proteins and non-coding RNAs in- sion of TOP and other RNAs, such as accessibility of RNA
volved in ribosome biogenesis. to RNMT or speed of transcription. Although we have fo-
cussed mainly on the RNMT sensitive transcripts in this
DISCUSSION study it would also be informative to investigate why many
transcripts are RNMT-insensitive.
When T cells are activated by interaction with a cognate TOP RNAs are translationally repressed in naı̈ve T cells,
antigen, the transition from naı̈ve to activated phenotype poised to be expressed in response to activation, permitting
is driven by the induction of biosynthetic pathways. Here, rapid transition to the activated phenotype by accelerating
we identified the m7 G cap methyltransferase RNMT as a ribosome biogenesis (3). In unstimulated naı̈ve T cells, al-
key mediator of T cell activation, induced by TCR stim- though loss of Rnmt affects the transcriptome by altering
ulation. The m7 G cap has previously defined biochemical the expression of the translationally repressed TOP RNAs
roles in RNA processing and translation, however, prior to there is little impact on the proteome. Upon activation, T
this study its influence on endogenous cellular transcripts cells increase their ribosome content, translational capacity,
in mammals had been unclear because the m7 G capping en- increase in size and undergo rapid proliferation. RNMT is
zymes, RNGTT and RNMT, are essential for cell viability required for the expression of TOP-encoded ribosomal pro-
in most lineages (69). teins and biogenesis factors and in the absence of Rnmt, T
An important observation was that although cap guano- cells fail to increase their translational capacity resulting in
sine N-7 methyltransferase activity was undetectable on reduced size, delayed cell cycle entry and ultimately apop-
Rnmt deletion, ∼80% mRNA had a complete m7 GpppNm tosis.
cap in Rnmt cKO T cells. Although by all indicators Rnmt Since the role of LARP1 had not been investigated in T
gene deletion was successful, residual RNMT protein may cells previously, we performed eCLIP analysis of LARP1-
be sufficient to methylate a proportion of mRNA caps RNA interactions in naı̈ve CD4 T cells to identify LARP1
aided by recruitment of RNMT to sites of transcription; target RNAs and map their site of interaction. In T cells,
these transcripts would be more stable and better processed the majority of LARP1 binding occurred close to the TSS
compared to RNA with incomplete cap structures (16,70). in both coding and non-coding RNAs, consistent with cap-
Rnmt cKO T cells, however, cannot induce RNMT pro- dependent interactions through the DM15 domain. LARP1
tein upon activation where the accelerated production of can associate with the polyA tail either directly or through
nascent RNA transcription is likely to outstrip the cap PABPC1 (23,24,44,49,50); our data suggests that most con-
methylation capacity of pre-existing, residual RNMT pro- tacts with the 3 end of RNAs would be indirect in T cells,
tein. An alternative explanation for the presence of the however, direct binding to the polyA tail could potentially
m7
GpppNm cap in Rnmt cKO T cells is that there is a par- still be important for the initiation of this interaction. Not
tially redundant m7 G methyltransferase, although such en- all the LARP1 targets identified were repressed by loss of
zymes or activities have not been identified. Rnmt. LARP1 can also bind to the TOP motif through the
Although the m7 G cap is ubiquitous on endogenous cel- LA-module in a cap-independent manner (49), which may
lular RNAPII-transcribed RNA, a key finding here is that have distinct regulatory effects, or these transcripts may re-
the expression of specific RNAs have enhanced dependency cruit other RNA binding proteins that stabilise them (71–
on RNMT, including TOP RNAs. The TOP RNAs are pro- 73). Interestingly, we also detected LARP1 binding to RP
tected from degradation by interaction with a specialised and translation factor pseudogenes. Although under cer-
m7
G-cap binding protein, LARP1. In Rnmt cKO CD4 T tain conditions, these pseudogenes could potentially act as
cells, the reduction in TOP transcripts and the reduction in LARP1-sponges and compete with the other TOP mRNAs6736 Nucleic Acids Research, 2021, Vol. 49, No. 12
for LARP1 binding, in naı̈ve CD4 T cells the pseudogene GSE160328. Proteomics datasets are available from pro-
expression and LARP1 eCLIP read counts were much lower teomeXchange with the following accessions: naı̈ve T cell
than their protein-coding counterparts. data PXD023793, activated T cell data PXD023799, Ribo
Since the ribosomal proteins (RPs) were the most re- Mega-SEC PXD023832.
pressed functional group in our proteomics analysis of ac-
tivated Rnmt cKO CD4 T cells, we focussed on ribosome
SUPPLEMENTARY DATA
biogenesis for this study. Ribosomes and translation factors
are the canonical targets of LARP1, however, there were Supplementary Data are available at NAR Online.
also LARP1 targets identified in metabolic pathways, splic-
ing, protein processing and cell signalling. Some of these
ACKNOWLEDGEMENTS
targets are novel and some have been identified as TOP
RNAs in previous studies (74–76), or as transcripts whose We thank Doreen Cantrell, Linda Sinclair, Simon Arthur,
translation is sensitive to MTOR pathway inhibition (77), Martin Turner and Cantrell and Cowling lab members for
Downloaded from https://academic.oup.com/nar/article/49/12/6722/6298622 by guest on 24 August 2021
a feature of TOP-RNA regulation. Co-regulation of trans- advice, assistance and reagents. Nadine Sommer and Ka-
lation, metabolism and cell signalling may integrate these sia Lewandowska contributed to technical expertise. We
co-dependent processes. The best characterised regulator thank the Biological Resource Unit, Flow Cytometry Fa-
of LARP1 is MTOR, a serine/threonine kinase that inte- cility, Fingerprints Proteomics Facility and Tayside Centre
grates signals from external and internal stimuli such as for Genomic Analysis
mitogens and nutrient availability (22,78,79). MTOR phos-
phorylates LARP1 adjacent to the DM15 domain, reducing
FUNDING
its cap-binding to allow more efficient translation of TOP
RNAs (24,42,45). We propose that RNMT functions up- European Research Council (ERC) under the Euro-
stream of this mechanism since efficient cap methylation al- pean Union’s Horizon 2020 research and innovation
lows LARP1 to stabilise a pool of TOP mRNA ready to be programme [769080]; Medical Research Council Se-
translated upon mitogenic stimuli such as TCR signalling nior Fellowship [MR/K024213/1]; Lister Research
in T cells. Prize Fellowship; Wellcome Trust PhD studentship
In addition to affecting TOP RNA expression, RNMT [097462/Z/11/Z]; Royal Society Wolfson Research Merit
has roles in non-coding RNA expression and mRNA pro- Award [WRM\R1\180008]; Wellcome Trust GRE Centre
cessing, specifically in splicing out the first intron, a CBC- Award [097945/Z/11/Z]. Funding for open access charge:
dependent process (55–57). snRNAs were repressed in ERC.
Rnmt cKO CD4 T cells, probably due to destabilisation Conflict of interest statement. None declared.
of those that do not gain a complete tri-methylguanosine
cap structure, since the un-capped snRNA U6 is unaf-
fected. Rnmt cKO CD4 T cells also had reduced expres- REFERENCES
sion of several snoRNAs. Capped snoRNAs interact with 1. Chapman,N.M., Boothby,M.R. and Chi,H. (2020) Metabolic
CBC to recruit snoRNA biogenesis factors, indicating a coordination of T cell quiescence and activation. Nat. Rev. Immunol.,
20, 55–70.
potential mechanism for their repression in Rnmt cKOs 2. Tan,H., Yang,K., Li,Y., Shaw,T.I., Wang,Y., Blanco,D.B., Wang,X.,
(80,81). Intron-derived snoRNAs are not capped so do Cho,J.H., Wang,H., Rankin,S. et al. (2017) Integrative proteomics
not interact directly with CBC, however, it is possible that and phosphoproteomics profiling reveals dynamic signaling networks
they recruit snoRNA biogenesis factors through the CBC and bioenergetics pathways underlying T cell activation. Immunity,
prior to splicing. We identified LARP1 binding sites in 10 46, 488–503.
3. Wolf,T., Jin,W., Zoppi,G., Vogel,I.A., Akhmedov,M., Bleck,C.K.E.,
lncRNAs and 50 mRNAs that host snoRNAs, and one Beltraminelli,T., Rieckmann,J.C., Ramirez,N.J., Benevento,M. et al.
snoRNA, Snord104. LARP1 binding could have an impact (2020) Dynamics in protein translation sustaining T cell
on snoRNA host stability or processing, but but changes preparedness. Nat. Immunol., 21, 927–937.
were also observed in snoRNAs whose hosts were not iden- 4. Howden,A.J.M., Hukelmann,J.L., Brenes,A., Spinelli,L.,
Sinclair,L.V., Lamond,A.I. and Cantrell,D.A. (2019) Quantitative
tified as LARP1 targets. analysis of T cell proteomes and environmental sensors during T cell
To conclude, we discovered that RNMT has a fundamen- differentiation. Nat. Immunol., 20, 1542–1554.
tal role in upregulating the expression of a TOP RNA reg- 5. Davari,K., Lichti,J., Gallus,C., Greulich,F., Uhlenhaut,N.H.,
ulon, driving ribosome biogenesis during T cell activation. Heinig,M., Friedel,C.C. and Glasmacher,E. (2017) Rapid
Ribosome biogenesis is critical for proliferation during T genome-wide recruitment of RNA polymerase II drives transcription,
splicing, and translation events during T cell responses. Cell Rep., 19,
cell activation and has important roles in other cells in- 643–654.
cluding driving inappropriate cell proliferation in cancerous 6. Ricciardi,S., Manfrini,N., Alfieri,R., Calamita,P., Crosti,M.C.,
cells where we have also observed a link between RNMT Gallo,S., Muller,R., Pagani,M., Abrignani,S. and Biffo,S. (2018) The
and TOP RNAs (8,9,82). Through the selective dependence translational machinery of human CD4(+) T cells is poised for
activation and controls the switch from quiescence to metabolic
of TOP RNA and snoRNA on RNMT, ribosome biogene- remodeling. Cell Metab., 28, 895–906.
sis is coordinated with the generation of m7 G capped tran- 7. Araki,K., Morita,M., Bederman,A.G., Konieczny,B.T., Kissick,H.T.,
scripts during T cell activation. Sonenberg,N. and Ahmed,R. (2017) Translation is actively regulated
during the differentiation of CD8(+) effector T cells. Nat. Immunol.,
18, 1046–1057.
DATA AVAILABILITY 8. Asmal,M., Colgan,J., Naef,F., Yu,B., Lee,Y., Magnasco,M. and
Luban,J. (2003) Production of ribosome components in effector
RNAseq data including ribosome footprinting, eCLIP and CD4+ T cells is accelerated by TCR stimulation and coordinated by
-seq are available at NCBI GEO datasets using reference ERK-MAPK. Immunity, 19, 535–548.You can also read