ANTONIO PONDINI A NEW STRATEGIC OVERCOME OF THE CHALLENGES INHERENT TO THE ROLE OF THE AGGREGATOR IN THE ITALIAN BALANCING MARKET - DIVA
←
→
Page content transcription
If your browser does not render page correctly, please read the page content below
A new strategic overcome of the
  challenges inherent to the role of the
aggregator in the Italian balancing market

                    Antonio Pondini

                     Master of Science Thesis
                KTH Unit of Energy Systems Analysis
                       Stockholm, Sweden

TRITA number                                          Submitted on:
TRITA-ITM-EX 2019:697                             21 November 2019

                                                                  1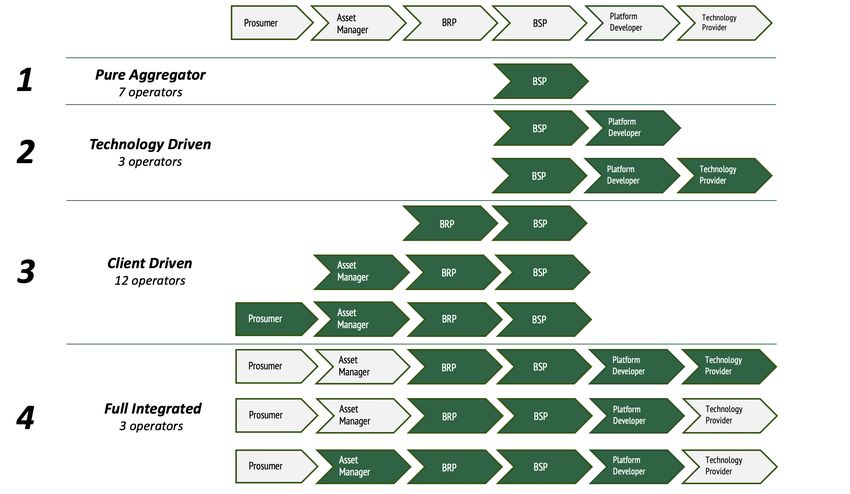
Abstract
The European Union is currently driving forward the development of an energy model that is more reliant on
renewable supply. Indeed, recent European Commission figures estimate a renewable penetration of 50%
by 2030. As well as a shift towards renewables, our reliance on electricity is also set to dramatically increase
in coming years, largely due to the inevitable electrification of vehicles and heating/cooling systems. Further
to this, daily lives becoming less regimented and predictable is making energy use patterns more irregular.
All of these factors are increasing the need for greater flexibility from our energy model so as to balance
demand and supply.

Improved flexibility and demand side management are crucial for the European Union so that it can meet its
decarbonisation goals. Furthermore, taking into consideration the continued decommissioning of fossil-
based power sources across the region, flexibility will need to take new forms. This is also growing demand
for both companies and households to shift from being consumers to prosumers through the localised
integration of renewable energy resources. A higher number of prosumers equates to higher flexibility and
this could have significant impact of supporting grid stability.

For prosumers to access flexibility markets, and in turn, support the decarbonisation of our energy system,
there is need for a new player in the energy value chain – the aggregator. The aggregator should be the force
that connects prosumers with transmission system operators, distribution system operators, and balance
responsible parties (BRP).

The role of aggregator can be done by pre-existent market stakeholders (e.g. suppliers). Both regulators and
industry bodies agree that demand-side management and response will become of increasing importance as
the energy system develops in coming years and aggregators will be fundamental for this transition.

With Resolution 300/2017, Italy has defined the criteria to allow demand, “relevant production units” from
non-programmable renewable sources, “non relevant units” (i.e. distributed generation), as well as
accumulation systems to participate in the flexibility market.

To date, 24 subjects have decided to take part as aggregators in the balancing market. If the interest of the
main market operators in the aggregation of flexibility resources is evident, the need for an adjustment of
the regulatory framework that, overcoming the barriers and obstacles currently existing, can encourage a
greater participation is equally clear.

Despite this, there remains to be much debate over how aggregation should best be implemented, and what
regulatory framework needs to be put in place so that it can effectively support flexibility markets. Various
aggregator implementation methods have already been proposed internationally. However, for a truly
robust, integrated, and clear flexibility market, there is still need for more clarity on its roles and processes.

                                                                                                                2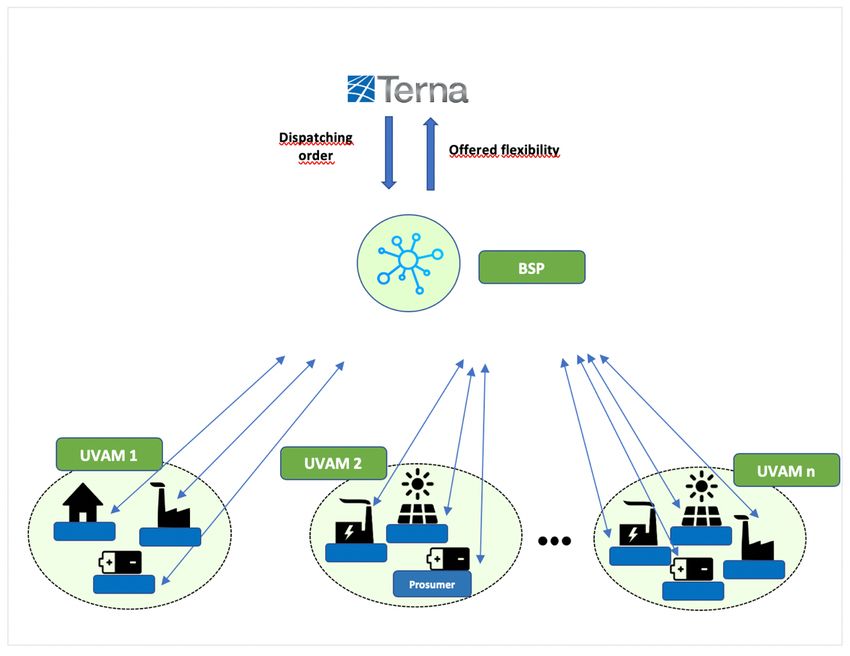
Acknowledgment
I would like to thank Simone Franzò and Andrea Di Lieto from Energy & Strategy. Simone and Andrea were
the supervisors to this work within the company. Their feedback and their ongoing support have been key to
achieve this outcome. I would also like to thank all the partners who supported the research work I have
done. It is admirable to know that there are many companies who consider research work fundamental for
the growth of our country.

To conclude, I would like to thank Francesco Fuso Nerini, my supervisor from KTH. I am highly appreciative
of the time he took over the last few months to analyze my work and critique my findings.

                                                                                                        3
In Collaboration with:
Energy & Strategy and Politecnico di Milano

                                              4
Table of contents

Abstract ....................................................................................................................................................2

Acknowledgment ......................................................................................................................................3

Table of contents ......................................................................................................................................5
     List of figures................................................................................................................................................. 7
     List of tables .................................................................................................................................................. 8
     List of abbreviations ...................................................................................................................................... 9

1.       Introduction .................................................................................................................................... 10

2.       Literature review ............................................................................................................................ 11
     2.1.        Clean energy for all Europeans package ........................................................................................ 11
     2.2.     National Energy and Climate Plan: Italy ........................................................................................ 11
        2.2.1. The decarbonization target ....................................................................................................... 11
        2.2.2. The evolution of the internal electricity market........................................................................ 13
     2.3.     Resolution n. 422/2018/R/EEL - UVAM.......................................................................................... 15
        2.3.1. Technical requirements ............................................................................................................. 16
        2.3.2. Terms of participation to pilot projects ..................................................................................... 17
        2.3.3. The technological infrastructure ............................................................................................... 18
     2.4.        UVAM pilot projects – The current market share .......................................................................... 18

3.       First level of analysis ....................................................................................................................... 20
     3.1.        The sample of analysis ................................................................................................................... 20
     3.2.     Methodology.................................................................................................................................. 22
        3.2.1. The Aggregation Value Chain .................................................................................................... 22
        3.2.2. Set up......................................................................................................................................... 23
        3.2.3. First section – The Canvas representation of the BSP business models .................................... 24
        3.2.4. Second section – The relationships established between the BSP and the other players ........ 27
     3.3.     Results ............................................................................................................................................ 28
        3.3.1. First section – The Canvas representation of the BSP business models .................................... 28
        3.3.2. Second section – The relationships established between the BSP and the other players ........ 35

4.       Second level of analysis .................................................................................................................. 40
     4.1.     Methodology.................................................................................................................................. 40
        4.1.1. UVAM regulation – Potential future scenario ........................................................................... 40
        4.1.2. The chosen business models ..................................................................................................... 42
        4.1.3. The sources of flexibility ............................................................................................................ 43
        4.1.4. Cases of study ............................................................................................................................ 46
        4.1.4.1. Case of study 1 ...................................................................................................................... 46
        4.1.4.2. Case of study 2 ...................................................................................................................... 46
        4.1.4.3. Case of study 3 ...................................................................................................................... 47
        4.1.4.4. Case of study 4 ...................................................................................................................... 47

                                                                                                                                                                      5
4.1.5. Assumptions .............................................................................................................................. 48
     4.2.     Results ............................................................................................................................................ 52
        4.2.1. Case of study 1 .......................................................................................................................... 52
        4.2.2. Case of study 2 .......................................................................................................................... 54
        4.2.3. Case of study 3 .......................................................................................................................... 55
        4.2.4. Case of study 4 .......................................................................................................................... 57

5.       Discussion ....................................................................................................................................... 59

6.       Conclusion ...................................................................................................................................... 61
     6.1.        Limitations of the study ................................................................................................................. 62
     6.2.        Future development of the study ................................................................................................... 63

7.       References ...................................................................................................................................... 64

Annex 1 – Draft of the interview carried out with the market operators ................................................. 65

Annex 2 – Schematic illustration of the information gathered from interviews with the 14 operators
shown in Table 3 ..................................................................................................................................... 68
     Operator 1................................................................................................................................................... 68
     Operator 2................................................................................................................................................... 69
     Operator 3................................................................................................................................................... 70
     Operator 4................................................................................................................................................... 71
     Operator 5................................................................................................................................................... 72
     Operator 6................................................................................................................................................... 73
     Operator 7................................................................................................................................................... 74
     Operator 8................................................................................................................................................... 75
     Operator 9................................................................................................................................................... 76
     Operator 10................................................................................................................................................. 77
     Operator 11................................................................................................................................................. 78
     Operator 12................................................................................................................................................. 79
     Operator 13................................................................................................................................................. 80
     Operator 14................................................................................................................................................. 81

Annex 3 - Draft of the interview carried out with the TSO ....................................................................... 82

Annex 4 - Calculations performed to determine the NPV, payback time and IRR for case of study 1 ........ 84
     Base Model ................................................................................................................................................. 84
     Technology Driven Model 1 ........................................................................................................................ 84
     ESCo Model ................................................................................................................................................. 84

Annex 5 - Calculations performed to determine the NPV, payback time and IRR for case of study 2 ........ 85
     Base Model ................................................................................................................................................. 85
     Technology Driven Model 1 ........................................................................................................................ 85

                                                                                                                                                                   6
ESCo Model ................................................................................................................................................. 85

Annex 6 - Calculations performed to determine the NPV, payback time and IRR for case of study 3 ........ 86
  Base Model ................................................................................................................................................. 86
  Technology Driven Model 1 ........................................................................................................................ 86

Annex 7 - Calculations performed to determine the NPV, payback time and IRR for case of study 4 ........ 87
  Base Model ................................................................................................................................................. 87
  Technology Driven Model 1 ........................................................................................................................ 87

List of figures

Figure 1 Evolution from 2011 to 2030 of the electricity gross consumption and the RES share in TWh ____ 12
Figure 2 Expected evolution of electricity production from RES by source ___________________________ 13
Figure 3 Expected residual load curve in April 2030 [6] [7]_______________________________________ 14
Figure 4 Expected residual load curve in April 2040 [6] [7]_______________________________________ 14
Figure 5 Actors and roles involved in the UVAM pilot projects ____________________________________ 16
Figure 6 Technological elements installed and definition of the modalities of communication __________ 18
Figure 7 MW awarded in area A - Annual, infrannual (April and July) and monthly auctions ____________ 19
Figure 8 MW awarded in area B - Annual, infrannual (April and July) and monthly auctions ____________ 19
Figure 9 Aggregation chain _______________________________________________________________ 22
Figure 10 Cluster 1 – Pure Aggregator ______________________________________________________ 24
Figure 11 Cluster 2 – Technology Driven Aggregator ___________________________________________ 24
Figure 12 Cluster 3 – Client Driven Aggregator ________________________________________________ 24
Figure 13 Cluster 4 – Full Integrated Aggregator ______________________________________________ 24
Figure 14 Graphical representation used to describe the business models __________________________ 26
Figure 15 Classification of business models according to the cluster _______________________________ 28
Figure 16 Case of study 1: variation of the NPV for the BM, TDM1 and ESCoM business models as the
percentage of calls from the TSO varies _____________________________________________________ 53
Figure 17 BM – Case of study 1: annual operating profit divided into Costs, Earnings from variable
remuneration, Earnings from fixed remuneration _____________________________________________ 53
Figure 18 Case of study 2: variation of the NPV for the BM, TDM1 and ESCoM business models as the
number of UVAMs aggregated varies _______________________________________________________ 55
Figure 19 TDM1 – Case of study 3: annual operating profit divided into Costs, Earnings from variable
remuneration, Earnings from fixed remuneration _____________________________________________ 56
Figure 20 Case of study 3: variation of the NPV for the BM and TDM1 business models as the number of
UVAMs aggregated varies________________________________________________________________ 57
Figure 21 Figure 19 TDM1 – Case of study 4: annual operating profit divided into Costs, Earnings from
variable remuneration, Earnings from fixed remuneration ______________________________________ 58
Figure 22 Operator 1 - results of the interview carried out ______________________________________ 68
Figure 23 Operator 2 - results of the interview carried out ______________________________________ 69
Figure 24 Operator 3 - results of the interview carried out ______________________________________ 70
Figure 25 Operator 4 - results of the interview carried out ______________________________________ 71
Figure 26 Operator 5 - results of the interview carried out ______________________________________ 72
Figure 27 Operator 6 - results of the interview carried out ______________________________________ 73
Figure 28 Operator 7 - results of the interview carried out ______________________________________ 74
Figure 29 Operator 8 - results of the interview carried out ______________________________________ 75
Figure 30 Operator 9 - results of the interview carried out ______________________________________ 76
Figure 31 Operator 10 - results of the interview carried out _____________________________________ 77

                                                                                                                                                               7
Figure 32 Operator 11 - results of the interview carried out _____________________________________ 78
Figure 33 Operator 12 - results of the interview carried out _____________________________________ 79
Figure 34 Operator 13 - results of the interview carried out _____________________________________ 80
Figure 35 Operator 14 - results of the interview carried out _____________________________________ 81
Figure 36 BM – Case of study 1: calculations performed to determine the NPV, payback time and IRR____ 84
Figure 37 TDM1 – Case of study 1: calculations performed to determine the NPV, payback time and IRR _ 84
Figure 38 ESCoM – Case of study 1: calculations performed to determine the NPV, payback time and IRR _ 84
Figure 39 BM – Case of study 2: calculations performed to determine the NPV, payback time and IRR____ 85
Figure 40 TDM1 – Case of study 2: calculations performed to determine the NPV, payback time and IRR _ 85
Figure 41 ESCoM – Case of study 2: calculations performed to determine the NPV, payback time and IRR _ 85
Figure 42 BM – Case of study 3: calculations performed to determine the NPV, payback time and IRR____ 86
Figure 43 TDM1 – Case of study 2: calculations performed to determine the NPV, payback time and IRR _ 86
Figure 44 BM – Case of study 3: calculations performed to determine the NPV, payback time and IRR____ 87
Figure 45 TDM1 – Case of study 3: calculations performed to determine the NPV, payback time and IRR _ 87

List of tables

Table 1 Technical requirements for UVAM and prosumers ______________________________________ 16
Table 2 Operators that have taken part in UVAM pilot projects and MW assigned ___________________ 18
Table 3 Interviewed operators and assigned capacity __________________________________________ 21
Table 4 Players and roles within the aggregation chain _________________________________________ 22
Table 5 Total MW aggregate as BRP VS total MW aggregate ____________________________________ 35
Table 6 Type of contracts between BSPs and platform developers ________________________________ 36
Table 7 Cost difference between the internal development of the platform and the external supply of the
service for different types of UVAM ________________________________________________________ 36
Table 8 Types of contracts between BSP and technology provider ________________________________ 37
Table 9 Contractual relationships between BSP and prosumers __________________________________ 38
Table 10 Total MW as single asset UVAM VS total MW aggregate ________________________________ 39
Table 11 The four period of development provided for the future scenario __________________________ 41
Table 12 Business Cases – Base Model – Types of contractual relationship _________________________ 42
Table 13 Business Cases – ESCo Model – Types of contractual relationship _________________________ 43
Table 14 Business Cases – TDM1 – Types of contractual relationship ______________________________ 43
Table 15 Service sector – 60 people apartment building – Flexibility features________________________ 45
Table 16 Service sector – 60 people apartment building with FV – Flexibility features _________________ 45
Table 17 Case of study 1 – UVAM configuration_______________________________________________ 46
Table 18 Case of study 1 – UVAM development scenario ________________________________________ 46
Table 19 Case of study 2 – UVAM configuration_______________________________________________ 46
Table 20 Case of study 2 – UVAM development scenario ________________________________________ 46
Table 21 Case of study 3 – UVAM configuration_______________________________________________ 47
Table 22 Case of study 2 – UVAM development scenario ________________________________________ 47
Table 23 Case of study 3 – UVAM configuration_______________________________________________ 47
Table 24 Case of study 2 – UVAM development scenario ________________________________________ 48
Table 25 Case of study 1 – Bid value and remuneration to client depending on the business model used __ 48
Table 26 Case of study 1 – Cost of the platform for the three different business models _______________ 49
Table 27 Case of study 2 – Cost of the platform for the three different business models _______________ 49
Table 28 Case of study 2 – Cost of the platform for the three different business models _______________ 50
Table 29 Case of study 3 – Cost of the platform for the three different business models _______________ 50
Table 30 Case of study 3 – Cost of the platform for the three different business models _______________ 51
Table 31 Case of study 1: NPV, Payback time and IRR __________________________________________ 52
Table 32 Case of study 2: NPV, Payback time and IRR __________________________________________ 54
Table 33 Scenarios of UVAM development ___________________________________________________ 54
Table 34 Case of study 3: NPV, Payback time and IRR __________________________________________ 55

                                                                                                        8
Table 35 Case of study 4: NPV, Payback time and IRR __________________________________________ 57

List of abbreviations

BM – Base Model

BMC – Business Model Canvas

BRP – Balancing Responsible Party

BSP – Balancing Service Provider

CDM1 – Client Driven Model 1

CDM2 – Client Driven Model 2

CDM3 – Client Driven Model 3

ESCo – Energy Service Company

ESCoM – Energy Service Company Model

IRR – Internal Rate of Return

MSD – Mercato Servizi Dispacciamento (Balancing Market)

NECP – National Energy and Climate Plan

NPV – Net Present Value

PBT – Payback Time

RES – Renewable Energy Source

TDM1 – Technology Driven Model 1

TDM2 – Technology Driven Model 1

TSO – Transmission System Operator

UPNR - Non-relevant Production Units

UPM – Unità Periferica di Monitoraggio (Monitoring Device Unit)

UVAM – Unità Virtuali Abilitate Miste (Mixed Qualified Virtual Units)

                                                                                               9
1. Introduction
The new targets set within the Clean Energy for all Europeans’ Package, and consequently within the plans
of the member states, have given the flexibility and the subjects able to offer flexibility services a central
place in the revolution that is sweeping the electricity market. Together with a whole range of new subjects
who were not previously able to offer flexibility services in the balancing market, a new role is characterizing
the transition of the electricity market: the role of the aggregator.

With the approval of the resolution no. 422/2018/R/EEL Italy has sanctioned the birth of the UVAM pilot
projects, aggregations of peripheral units of production, consumption and accumulation managed by the
new role of the aggregator. The pilot projects aim to understand the potential that new flexible subjects can
have for the development of the Italian electricity market. Therefore, the aggregator becomes the
fundamental and main role within the reform of the Italian balancing market, and through its adaptation
different future scenarios can be forecasted.

This paper aims to study and detail the different business models that aggregators have implemented till
now in the market intending to shed some light on the future developments and potential of a market that
is looking for a way to succeed. Both the lack of experience of the aggregators in interpreting a new role and
the uncertainty of a regulatory framework that does not fully satisfy operators have made it clear that it is
important to follow a path of development in which operators and regulatory body go hand in hand.

Following a literature review to clarify the regulation that gave rise to the pilot projects and the role of the
aggregator, the paper is divided into two different sections, each representing a different level of analysis:

The first level of analysis is aimed at identifying the business models currently implemented by operators in
the Italian market. To do this, direct interviews were carried out with the operators, during which, in addition
to the business models, the drivers and barriers that are characterizing the development of this new business
have been identified.

The second level of analysis aimed to apply the business models identified in the first level analysis to case
studies representing different types of UVAM. The objective was to understand what the most competitive
business model for the BSP is depending on different case studies. The contribution of the regulatory body
was essential to identify a possible scenario for the future development of the UVAM regulation.

Finally, it is important to underline, that the analysis has been possible thanks to the close collaboration of
the operators that today are aggregators in the Italian market with whom direct interviews have been
conducted. The interest in the future development of a still uncertain market has certainly contributed to
guaranteeing the patronage that this work has received from both the main actors and the governmental
entities.

                                                                                                             10
2. Literature review
2.1. Clean energy for all Europeans package
In June 2019 the legislative process that led to the definition of the Clean energy for all Europeans package,
a set of directives and regulations which concerns the various areas of the energy sector and outlines the
energy strategy of the European Union, was concluded [1].
The approval of the document – Regulation on internal market for electricity – represented a further
confirmation of the desire of the member countries of the European Union to jointly move towards common
objectives. There are five areas of intervention on which the greatest focus is placed within the Clean energy
for all European package [2]:
• Energy security
• Internal energy market
• Energy efficiency
• Decarbonization
• Research, innovation and competitiveness
As a common target, the European Union undertakes by 2030 to achieve the following objectives [3]:
• Share of energy from renewable sources in the gross final energy consumption of at least 32%
• Energy savings of 32.5% in energy efficiency
• 40% reduction in greenhouse gas emissions (GHG)
The Clean energy for all Europeans package is representative of the European Union's desire to progress as
an Energy Union and not just at the level of the individual member countries that are part of it. The Clean
energy for all Europeans package, therefore, becomes indispensable for the study of the national plans of
the members of the European Union, since it is both the input and the base.
The draft of the Italian National Energy and Climate Plan was presented in Brussels in June 2019. The targets
and the challenges expected by the Italian NECP are reported below and represent the background from
which this paper has been developed [2].
2.2. National Energy and Climate Plan: Italy
In accordance with the investigation of this research paper, two areas of intervention within the five
previously illustrated are deepened for the Italian NECP: decarbonization and the reform of the internal
energy market. As illustrated below, it is appropriate to underline the close interdependence of these two
areas of intervention. In fact, the current market reform is and will be a direct consequence of the actions
aimed at the decarbonization of the energy market.
2.2.1. The decarbonization target
The decarbonization target is clearly linked to the issue of GHG emission reduction. Since the GHG emission
from energy uses exceeds 80% of the total, the achievement of European objectives cannot stand without
actions aimed at promoting the reduction of dependence on fossil sources and, consequently, increasing the
energy share from sustainable resources in gross final consumption.
11To this end, the Italian NECP has set the goal of reaching by 2030 a share of energy from renewable energy
sources (RESs) in gross final energy consumption of 30% [4]. The biggest transformation is certainly expected
in the electricity generation sector. In fact, the Plan provides that the share of production coming from RESs
will exceed the 55% of the total by 2030, compared to the current 35% [4]. Figure 1 shows the development
that is expected from the RES share of electricity consumption to 2030 [5].
350 55,4% 60%
52,7%
50,1%
345 47,4%
42,0%
44,7% 50%
340 39,9% 40,9%
36,4% 37,6% 38,8%
35,6%
335 33,4% 33,5% 34,0% 34,1% 34,9% 40%
31,3%
330 27,4%
23,5% 30%
325
320 20%
315
10%
310
305 0%
2011
2012
2013
2014
2015
2016
2017
2018
2019
2020
2021
2022
2023
2024
2025
2026
2027
2028
2029
2030
Electricity gross consumption Expected electricity gross consumption
Share of RES Expcted share of RES
Figure 1 Evolution from 2011 to 2030 of the electricity gross consumption and the RES share in TWh
Looking at the data differentiated by source [5], Figure 2, the largest increase compared to current levels is
expected for wind and photovoltaic generation. The contribution of water and geothermal sources does not
present particular variations with respect to the current levels, while the contribution of bioenergy is
expected to slightly decrease.
1280
70
60
50 Solar
TWh
Wind
40
Hydro
30
Bioenergy
20 Goethermal
10
0
17 19 21 23 25 27 29
20 20 20 20 20 20 20
Figure 2 Expected evolution of electricity production from RES by source
2.2.2. The evolution of the internal electricity market
As previously stated, it is clear that the decarbonization target envisaged by the Italian NECP has to go with
an adequate development of the internal energy market. In fact, the consistent development of RESs and
the progressive decommissioning of thermoelectric plant have put strain on the safe management and
adequacy of the electrical system.
The main problems encountered with the transformation of the national energy profile in the management
of the electrical system are the following [6]:
• Increasing steepness of the loading ramp caused by the drastic and sudden reduction of solar
production in the evening hours. Therefore, a rapid increase in production from flexible systems is
necessary;
• Growing periods of over-generation from renewables in the central hours of the day. This can lead
to cuts in the energy produced by these plants if the system is not equipped with adequate storage
capacity;
• Network congestion, due to the uneven distribution of renewable plants in the national territory.
An illustrative example is shown by the graphs in Figure 3 and Figure 4, where the average hourly profile of
the residual load – the difference between gross electricity demand and RES production – was projected in a
day of low consumption respectively of April 2030 and April 2040 [6] [7]. It is evident that the residual load
has decreased significantly to the point that in some hourly intervals, typically in the hours of maximum
photovoltaic production, it has negative values, as an excess of generation to be evacuated: in the 2040 case
the residual load reaches negative peaks of about 35 GW.
13April 2030
60
50
40
30
20
10
0
0 5 10 15 20 25 30
-10
-20
-30
Residual load RES Gross electricity demand
Figure 3 Expected residual load curve in April 2030 [6] [7]
April 2040
80
60
40
20
0
0 5 10 15 20 25 30
-20
-40
-60
Residual load RES Gross electricity demand
Figure 4 Expected residual load curve in April 2040 [6] [7]
Furthermore, the growth of intermittent RES and the progressive decommissioning of thermoelectric
capacity imply a reduction in "rotating" power [6]. The problem is compounded by the phase-out of
conventional steam thermal, in particular coal-fired plants, considering their high response speed in the first
few seconds. In order to be able to manage the network safely, it is absolutely necessary to expand the range
of rapid resources to be activated and to be supplied in a short time [8].
Comparable problems are found at the distribution network level, since the impact of renewable penetration
translates into the recent phenomenon of reversal energy flows towards the transmission network [8]. This
14emphasizes, for example, problems of limited hosting capacity and congestion on weak directions. The
resolution of these critical issues could benefit from the use of appropriate flexible resources located directly
on the distribution network.
The use of flexible resources could therefore have a positive impact on the overall operating costs of the
entire system – transmission and distribution – and its future expansion. Obviously, the introduction of
flexibility services requires a review of the roles of the actors involved as well as an evolution of the current
regulation. With Resolution 300/2017, followed by Resolution 422/2028/R/EEL, Italy made the first attempt
to reform the overall market design, giving the possibility to the units from renewable sources, the
generation widespread and the consumer units to play an active role in the electricity market by providing
flexibility.
2.3. Resolution n. 422/2018/R/EEL - UVAM
As detailed in the next chapters, the primary objective of this research paper is the analysis of the subjects
and of the new roles that arose following the opening of the dispatching services market to the units from
renewable sources, to the distributed generation and to the units of consumption. It is therefore of primary
importance, before going deeper into the study, to understand the legislative framework within which the
analysis stands, namely Resolution 422/2018/R/EEL [9].
Resolution 422/2018/R/EEL is the third attempt made by ARERA – Italian regulatory authority for energy,
networks and environment – to open the market for dispatching services to new flexible resources. In
particular, the decree sanctioned the birth of the UVAM pilot projects – Mixed Qualified Virtual Units – and
defined the regulation for the participation of the demand, of the production units not already qualified –
non-programmable renewable sources, distributed generation – and of the systems of accumulation in the
dispatching services market (MSD) as part of UVAM pilot projects.
The role of the aggregator – BSP – becomes therefore central, since it is the subject responsible for the
participation of the UVAM in the MSD. Before describing what are the necessary technical requirements and
the terms of participation defined by the resolution, it is important to introduce what are the key actors and
roles involved in the pilot projects and how these actors interact with each other.
Figure 5 schematically shows the actors involved in the pilot projects and their role [10].
The operational flow that summarizes the interaction between these subjects can be thought of as a set-up
where an aggregator is offering explicit (incentive-based) demand response services to the TSO, Terna. To
this end, the Aggregator builds up relationships with Prosumers that own controllable assets. Prosumers will
receive remuneration based on the flexibility they offer through their assets. The Aggregator builds an UVAM
that can be thought of as a portfolio of assets to meet the size and timing constraints of specific flexibility
products. These assets belong to different Prosumers. The Aggregator may choose to specialize on a single
flexibility product or offer multiple products within the same portfolio [10] [11] [12].
15Terna – Italian
Trasmission System
Operator
BSP – Balancing service
provider. It is the subject
responsible of the UVAM
Prosumer – Asset that
produces/consumes
energy. It is the source of
flexibility
UVAM – Virtual unit
formed by different
sources of flexibility
(prosumers)
Figure 5 Actors and roles involved in the UVAM pilot projects
2.3.1. Technical requirements
The technical requirements expressed in the resolution concern both the UVAM and the individual units
within the UVAM and are shown in Table 1 [12].
Table 1 Technical requirements for UVAM and prosumers
UVAM Prosumer
The UVAM must be able to offer at least 1 MW
Prosumer must be equipped with a Peripheral
of flexibility and must be able to support
Monitoring Unit (UPM)
modulation for at least two consecutive hours
If the prosumer provides the instantaneous
and/or emergency interruptibility service and/or
The UVAM must be able to modulate within 15 instantaneous reduction of withdrawals, it can
minutes from Terna's dispatching order/call be included in a UVAM with exclusive reference
to electrically separate loads from those
engaged for the other services
Two categories of UVAM have also been defined which include all the types of UVAM that can be created
[12]:
16• UVAM A – Aggregation of non-relevant production units (UPNR), consumption units, «stand alone»
storage systems or combined with UPNR, relevant consumption units and production units that are
not necessarily MSD enabled and that share the connection point to the network with one or more
consumption units with power input at the connection point < 10 MVA
• UVAM B – Relevant production units not already enabled for the MSD that share the connection
point to the network with one or more consumption units with power input value at the connection
point > 10 MVA
Finally, the regulation provides for 15 geographical perimeters within which each BSP can aggregate flexible
resources [11] [12]. The assets that make up each UVAM must reside within a single aggregation perimeter.
2.3.2. Terms of participation to pilot projects
Since the pilot projects still represent an experimental phase to integrate new flexibility services within the
MSD, also the participation modalities and the remuneration system envisaged for the UVAM differ
considerably from the standard regulation foreseen for MSD.
To date, resolution 422/2018 / R / EEL has established a validity of pilot projects and detailed regulations of
two years – period 2019-2020. Moreover, the regulation provides for a maximum quantity of MW that can
be assigned to UVAM pilot projects and for which the regulation defined by the resolution applies [11] [12].
The maximum power that can be assigned for year 2019 is 1 000 MW and is divided between two Assignment
Areas [10] [11]:
• Assignment Area A – North, Central-North market areas: 800 MW
• Assignment Area B – Central-South, South, Sicily and Sardinia market areas: 200 MW
The power is assigned to the BSPs, owners of the UVAM, through an auction starting from a unitary payment
of € 30 000 / MW per year, with a "pay as bid" and merit order schemes. The offer made by the BSP for the
allocation of power must be less than 1 MW [10] [11] [12].
At the beginning of the reference year, capacity is assigned to each BSP through an annual auction that has
a validity of one year. Moreover, three infra-annual auctions and twelve-monthly auctions occur [10] [11].
Once the UVAM is part of the pilot projects, the BSP can take advantage of the remuneration scheme
established by the regulation, which provides for [12]:
• Fixed reward – A reward of 30 000 €/MWassigned per year is expected to the BSP.
• Variable reward – The variable reward is related to the price and quantity of energy that the BSP
offers on the MSD. This reward is paid just in case of activation of the units. A strike price of 400
€/MWh has been fixed.
The BSP, in the validity period, is committed to fulfil flexibility services in the balancing market at prices not
higher than the strike price and for a power at least equal to the assigned one. Moreover, the offer of the
service must be for at least four consecutive hours in the time slot between 2:00 pm and 8:00 pm from
Monday to Friday. In the case the BSP is not able to provide the service for at least four consecutive hours,
the fixed daily reward is reduced linearly up to a maximum value of 50% [10] [11] [12].
172.3.3. The technological infrastructure
Finally, it is appropriate to define the technological structure that characterizes a UVAM, since it represents
a key part of the analysis proposed in this paper. Figure 6 represents the technological elements installed at
each actor and defines the ways in which these elements contribute to the operation of the UVAM [11].
Figure 6 Technological elements installed and definition of the modalities of communication
2.4. UVAM pilot projects – The current market share
Before delving into the business models of aggregators, a first picture of the market of the UVAM pilot
projects and the share of the main operators are reported. To date, 25 operators have participated in the
forward auctions. Table 2 shows the operators that have taken part in UVAM pilot projects and the MW
awarded.
Table 2 Operators that have taken part in UVAM pilot projects and MW assigned
18The quantities assigned in Area A and in Area B are shown below. A progressive increase is clear, indicating
the increasing interest of operators towards the UVAM pilot projects. The information illustrated in Table 2,
Figure 7 and
Figure 8 was provided by Terna within the Energy & Strategy research work.
1000
900 Area A
800
700
600
MW
500
400
300
200
100
0
y
ne
r
ch
ly
ry
ril
st
ay
be
ar
Ju
gu
Ap
ua
ar
Ju
M
nu
em
Au
M
br
Ja
pt
Fe
Se
Annual Infrannual April Infrannual July Monthly
Figure 7 MW awarded in area A - Annual, infrannual (April and July) and monthly auctions
250
Area B
200
150
MW
100
50
0
y
ne
r
ch
st
ly
ry
ril
ay
be
ar
Ju
gu
Ap
ua
ar
Ju
M
nu
em
Au
M
br
Ja
pt
Fe
Se
Annual Infrannual April Infrannual July Monthly
Figure 8 MW awarded in area B - Annual, infrannual (April and July) and monthly auctions
193. First level of analysis
The uncertainty of a regulation that is still evolving, as well as the opening of a market with resources that
have been considered secondary until now, has led the new protagonists, the aggregators, to undertake very
different approaches to the market. The purpose of the first level of analysis of this paper is to understand
and study the different business models that have been implemented by aggregators to date.
To do this, first of all, the actors participating in the establishment of a UVAM and the roles covered by these
subjects have been identified. Secondary the fundamental phases of the establishment of a UVAM have been
reconstructed. In this way it was possible to determine how the aggregator interacts with the various actors
within the aggregation chain and above all to differentiate the business models according to the roles
covered by the aggregator and the specific relationships that are created between the actors.
It should be remembered that the study was developed starting from the aggregator's point of view, and
consequently the structures identified for each business model are representative of the aggregator's
business models.
The first level of analysis mainly consists of two sections:
• In the first section, all the business models investigated were grouped into different categories
according to the roles covered by the BSP in the aggregation chain. The different categories have
been described through the classic structure of the business model canvas (BMC).
• In the second part, the goal was to study in detail the relationships that are created between the BSP
and the other players in the aggregation chain. In fact, if in the first section the focus was to give a
macro view of the aggregator's business models, in the second section the focus was to group the
business models according to the relationships created by the BSP with the other actors, comparing
the specificities of the single business models.
The methodology and the presentation of the results follow the subdivision of the first level analysis into two
parts. The analysis was carried out through direct interviews with operators who act as aggregators in the
Italian market
3.1. The sample of analysis
The identification and analysis of the types of business models were carried out through direct interviews
with the operators who have participated in the UVAM pilot project as aggregators. 14 of the 25 operators
have been interviewed.
In addition to the main features of the business models, the interview aimed to of highlight the limits and
potential future developments of the UVAM pilot project. In Annex 1 the text used as a draft during
interviews with operators is shown. The topics discussed during the direct interviews are the following:
• The current interest of the BSP for the MSD market
• UVAM operation and characteristics
• The characteristics of the business models adopted
• The Italian regulatory framework
In order to characterize the analyzed sample, the operators interviewed, together with their market share
within the pilot project max capacity, are shown in Table 3 [12]. 3 of the interviewed operators decided to
20leave their information blind and were not included in Table 3. In Annex 2, information gathered from
interviews with each of the 14 interviewed operators is shown.
Table 3 Interviewed operators and assigned capacity
ALPIQ 0-10 MW
GRUPPO CURA 0-10 MW
FALCK 0-10 MW
DUFERCO ENERGIA 0-10 MW
HERA 10-20 MW
VEOS 10-20 MW
DOLIMITI ENERGIA 20-50 MW
ENGIE 20-50 MW
EGO 20-50 MW
EPQ >100 MW
ENEL X >100 MW
213.2. Methodology
3.2.1. The Aggregation Value Chain
As presented by Barbetti et al. [13], the first step in the assessment of the different business models which
have been implemented by the aggregator was to define the actors and roles that characterize the making
of an UVAM. It is shown in Figure 9 the aggregation chain where all the needful players to build an UVAM
are listed. As already stated, the aggregator can play different roles.
Asset Platform Technology
Prosumer Manager BRP BSP Developer provider
Figure 9 Aggregation chain
The players identified in the aggregation chain and their roles are described in the following Table 4. For the
descriptions of the roles the classification proposed by Hans de Heer et al [14] was used.
Table 4 Players and roles within the aggregation chain
Prosumer A Prosumer can be regarded as an end user that no longer only consumes
energy, but also produces energy. For the purpose of this paper there’s no
difference between residential end users, small and medium-sized
enterprises, or industrial users. In particular the term Prosumer is used for
end users that have controllable assets and are thereby capable of offering
flexibility.
All those subjects that hold a commercial / contractual relationship with
Asset Manager the final customer and that consequently represent a priority channel for
the BSP in the approach of the final customer are identified as Asset
Manager. For example, a company that holds an O&M contract for certain
plants can be considered an asset manager.
BRP It is the subject that has signed a dispatching service contract with Terna. It
can be the owner or the mandated subject of one or more dispatching
points in input and/or outputs. It is responsible to Terna for dispatching
energy and balancing inputs and outputs [14].
22Electricity market operator that aggregates different production and
consumption units distributed in a single virtual unit. This allows access not
BSP/Aggregator only to spot markets, but also to the dispatching services market, to which
the individual units of the portfolio would not have access. In this way these
services can be offered to Terna, supporting the operation of the network
and the integration of renewable energy plants. For the purposes of this
paper, the focus will be on the flexibility that the aggregator offers to the
dispatching services market [14].
Platform Developer It is the subject that has developed the necessary platform for the optimal
and coordinated management of several prosumers. The platform is used
by the aggregator.
Technology Provider It is the subject that provides the aggregators with the technological
infrastructure required by each prosumer to satisfy Terna's regulations. The
technological infrastructure consists of (i) UPM, (ii) communication
between UPM and concentrator, (iii) concentrator and (iv) communication
between concentrator and Terna systems.
3.2.2. Set up
Since the objective of this paper is the description of the UVAM making process starting from the aggregator's
point of view, the starting set-up that represents the structure of a UVAM focuses on the role of the
aggregator. For the description of the set up, it is adopted a model where all the roles characterizing an
UVAM are separated, model that will be later detailed.
The set up described here is illustrative of the relationships that the BSP must create with other actors in
order to form a UVAM. It should be noted that the TSO, Terna, was not included within the aggregation chain.
In fact, although it is flawless within the pilot projects, it is not an actor that determines the peculiarity of a
business model towards others. To confirm this the contractual relationship that is created between BSP and
TSO is regulated and therefore not different from case to case [9].
An outline is assumed where the BSP builds a portfolio of clients, prosumers, who can offer flexibility services
by forming a UVAM. Consequently, a contractual relationship is established between BSP and prosumers,
which provides for a sharing of the profit that the BSP receives from the offer of flexibility in the MSD. Since
the BSP is the operator most interested in the formation of UVAM, the technological structure necessary for
the individual prosumer must be provided by him. Consequently, the BSP signs a contract with a technology
supplier for the supply and installation of the technological elements at each prosumer. To conclude, the BSP
signs a contract with a developer of an optimization platform for the management of the aggregate and
dispatching orders. The asset manager replaces the prosumer if the BSP decides to create a partnership with
a company that controls different prosumers.
A separate analysis is planned for the BRP. In fact, since the activation of flexibility changes the energetic
profile of the prosumer, the BRP of the prosumer can be influenced. Terna's regulation had initially omitted
the potential convergence of these two roles and there were cases in which the BRP prevented prosumers
linked to it from participating in the UVAM pilot projects [15]. The TSO has modified the regulation and
currently the BRP must provide evidence of a potential obstacle to its operation to deny prosumers
23participation in pilot projects. The relationship between BSP and BRP will be deepened in the second section
of the analysis.
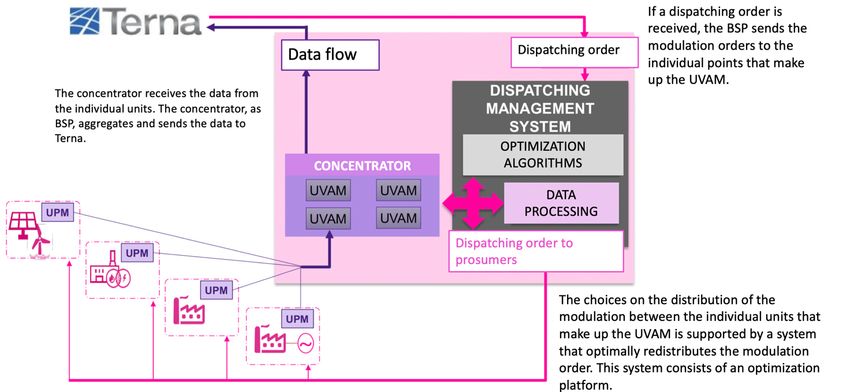
3.2.3. First section – The Canvas representation of the BSP business models
The first step that was done to categorize the business models was to identify reference clusters. These
clusters were identified prior to the interviews conducted with the aim of facilitating the categorization of
the information collected during the interviews. The clusters are the following:
• Pure Aggregator – This cluster contains all the operators who have decided to rely on an external
company both for the supply of the technological infrastructure and for the development of the
platform. Moreover, the operators do not have any priority channel with which to approach the final
customer. This cluster itself represents a single business model.
Asset Platform Technology
Prosumer BRP BSP
Manager Developer Provider
Figure 10 Cluster 1 – Pure Aggregator
• Technology Driven Aggregator – This cluster includes the BSP that have made the strategic choice
to internally develop a management platform and/or to produce the technological infrastructure
necessary for the making of an UVAM.
Asset Platform Technology
Prosumer BRP BSP
Manager Developer Provider
Figure 11 Cluster 2 – Technology Driven Aggregator
• Client Driven Aggregator – The main feature of this cluster is the already existing commercial /
contractual relationship between the customers and the aggregator. Indeed, being the aggregator
or BRP, or manager, or owner of the assets, it surely has a priority channel to involve the customer
in the UVAM project.
Asset Platform Technology
Prosumer BRP BSP
Manager Developer Provider
Figure 12 Cluster 3 – Client Driven Aggregator
• Full Integrated Aggregator – This cluster contains the operators who have decided to invest in the
development of the technologies needed to create a UVAM and who also have a priority channel to
involve prosumers. This cluster is therefore a combination of the two previous clusters.
Asset Platform Technology
Prosumer BRP BSP
Manager Developer Provider
Figure 13 Cluster 4 – Full Integrated Aggregator
This type of classification was certainly useful to have a first picture of the current level of interest of the
aggregator for the market and, consequently, of the current propensity of the aggregator to invest in this
market. For example, the willingness of an operator to invest in the internal development of the technological
24You can also read