MIT REAP-UK Innovation Ecosystem Assessment and Strategy of the West Midlands - Team West Midlands - Innovation Alliance for the West Midlands
←
→
Page content transcription
If your browser does not render page correctly, please read the page content below
MIT REAP-UK
Innovation Ecosystem Assessment and
         Strategy of the West Midlands

                       Team West Midlands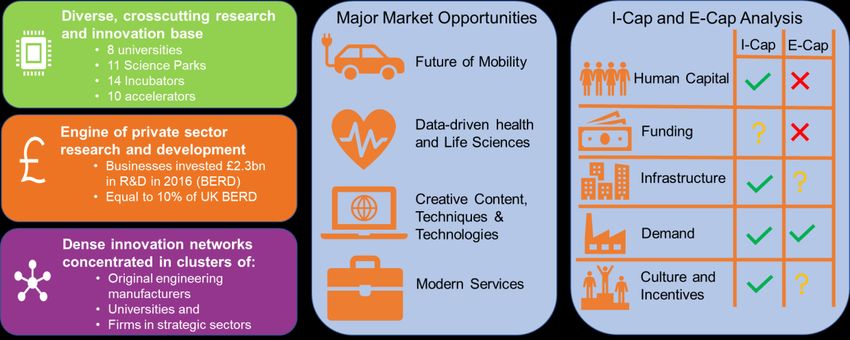
MIT REAP-UK
Table of Contents
1     Introduction ................................................................................................................................................. 4
2     Our Vision ................................................................................................................................................... 4
    2.1      Our Region .......................................................................................................................................... 4
    2.2      The West Midlands Innovation Ecosystem......................................................................................... 5
3     MIT REAP-WM Analysis of the Regions Innovation Ecosystem ............................................................... 6
    3.1      Analysis of Business Support ............................................................................................................. 6
    3.2      I-CAP and E-CAP Analysis ................................................................................................................. 7
    3.3      Human Capital..................................................................................................................................... 9
    3.4      Funding.............................................................................................................................................. 10
    3.5      Infrastructure ..................................................................................................................................... 11
    3.6      Demand ............................................................................................................................................. 12
    3.7      Culture and Incentives ...................................................................................................................... 13
4     Challenge Identification ............................................................................................................................ 14
    4.1      Human Capital: Strong in I-Cap, Weak in E-Cap ............................................................................. 14
      4.1.1         Human Capital Challenges .......................................................................................................................14
    4.2      Funding.............................................................................................................................................. 15
      4.2.1         Funding Challenges ..................................................................................................................................16
    4.3      Infrastructure: Strong in I-CAP, Average in E-CAP .......................................................................... 17
      4.3.1         Infrastructure Challenges ........................................................................................................................18
    4.4      Demand: Strong I-Cap, Strong E-Cap .............................................................................................. 18
      4.4.1         Demand Challenges .................................................................................................................................18
    4.5      Culture and Incentives: Strong in I-CAP, Average for E-CAP .......................................................... 19
      4.5.1         Culture and Incentives Challenges...........................................................................................................20
5     iEcosystem Challenges ............................................................................................................................ 20
    5.1      Overview............................................................................................................................................ 20
    5.2      Human Capital................................................................................................................................... 20
    5.3      Funding.............................................................................................................................................. 22
    5.4      Infrastructure ..................................................................................................................................... 22
    5.5      Demand ............................................................................................................................................. 24
    5.6      Culture and Incentives ...................................................................................................................... 24
6     Must Win Battles ....................................................................................................................................... 26
    6.1      A Coherent Regional Funding Strategy ............................................................................................ 26
      6.1.1         Challenge Overview .................................................................................................................................26
      6.1.2         Proposed Interventions ...........................................................................................................................26
      6.1.3         Stakeholders ............................................................................................................................................26
      6.1.4         Next Steps ................................................................................................................................................27
    6.2      Coordinated Business Support ......................................................................................................... 27
6.2.1         Challenge Overview .................................................................................................................................27
      6.2.2         Proposed Intervention .............................................................................................................................27
      6.2.3         Stakeholders ............................................................................................................................................28
      6.2.4         Next Steps ................................................................................................................................................28
    6.3      Digitisation of Manufacturing............................................................................................................. 28
      6.3.1         Challenge Overview .................................................................................................................................28
      6.3.2         Proposed Intervention .............................................................................................................................28
      6.3.3         Stakeholders ............................................................................................................................................29
      6.3.4         Next Steps ................................................................................................................................................29
    6.4      Showcasing the Region .................................................................................................................... 29
      6.4.1         Challenge Overview .................................................................................................................................29
      6.4.2         Proposed Intervention/s ..........................................................................................................................29
      6.4.3         Stakeholders ............................................................................................................................................30
      6.4.4         Next Steps ................................................................................................................................................30
7     Strategy Plan ............................................................................................................................................ 31
    7.1      Introduction ........................................................................................................................................ 31
    7.2      Strategic Objectives .......................................................................................................................... 31
    7.3      Comparative Advantage.................................................................................................................... 32
    7.4      West Midlands Innovation Framework.............................................................................................. 32
      7.4.1         Principles ..................................................................................................................................................32
      7.4.2         Pillars ........................................................................................................................................................32
      7.4.3         Delivery ....................................................................................................................................................33
      7.4.4         Metrics .....................................................................................................................................................33
8     Stakeholder Engagement Plan ................................................................................................................ 36
    8.1      Government....................................................................................................................................... 36
    8.2      Entrepreneurs.................................................................................................................................... 36
    8.3      University ........................................................................................................................................... 36
    8.4      Corporate........................................................................................................................................... 36
    8.5      Risk Capital ....................................................................................................................................... 36
9     Appendix 1 .................................................................................................................................................. 0
10        Appendix 2 .............................................................................................................................................. 8
Innovation Ecosystem Assessment and
              Strategy of the West Midlands
1 Introduction
This is the Innovation Ecosystem Assessment of the West Midlands based upon data gathered through the
MIT Regional Entrepreneurship Accelerator Programme.

2 Our Vision
“To develop and support an innovation ecosystem that fosters entrepreneurship, drives up levels of
business innovation and the exploitation of research and development, targeting varying needs in
different parts of the region.”

2.1 Our Region
The West Midlands is the centre of mobility innovation in the UK; it is a growing centre of data driven
healthcare and life sciences; the largest full service modern professional services centre outside London and
a centre for creative design, techniques and content production. With a long history of industrial innovation,
our aim us to continue to be at the centre of UK exploitation of research to meet national and global challenges
and opportunities.
The West Midlands is underpinned by a complicated innovation ecosystem. It is a UK manufacturing
heartland, grounded in history as the place where the first industrial revolution was commercialised. The
West Midlands’ mix of universities, anchor companies, research and development facilities, knowledge
networks and skilled workforce provides the foundations of 21 st century industry.
The UKIS (2017) found that in the West Midlands, 52% of the organisations were ‘innovation active’ meaning
they had introduced a significant innovation in the last 12 months. This figure was very similar to a survey of
300 firms that City-REDI1 conducted in 2019, which found that 53% of the organisations were ‘innovative
active’. Comparison across different regions shows that the West Midlands is above the national average (of
49%), coming fourth out of nine English regions and ahead of all three of the devolved nations.

At the same time, there is a West Midlands’ productivity gap, around 40% of the output gap between the
West Midlands and the UK is due to weaker performance in competition, investment, enterprise and
innovation2. Overall business productivity in the WM was 16% below the national average in 2019 which was
attributed to the ‘long tail’ of low productivity “long tail” firms and the lack of high productivity ‘frontier’ firms.
Business start-up rates have been very strong but survival rates substantially weaker, which suggests a need
to work intensively with potential high growth businesses at an early stage to stimulate survival and growth.

These challenges to business productivity in the West Midlands are thought to have been exacerbated,
historically, by weaknesses in the business support landscape and lack of R&D funding to the region,
specifically:
      •    A fragmented business support offering within the region that reduces the ability to provide
           comprehensive support, tailored to specific needs of business
      •    A, related, lack of clarity over the best support with multiple publicly funded providers competing
           to provide support and no, clear centralised support to help businesses better understand this
           complex ecosystem
      •    Insufficient demand-side focused approach to business support and private sector R&D built
           around the need of business owners from their perspective
      •    Lack of matching private funding of R&D and public funded R&D. The West Midlands has lagged
           behind other regions in obtaining public funding for R&D from UKRI and has been overlooked for
           large capital investments in research from the Department for Business, Innovation & Skills (BIS)
           even though it has significant private sector investment in R&D.

1   https://www.birmingham.ac.uk/research/city-redi/index.aspx
2   WM Local Industrial Strategy
The impact of the Covid-19 pandemic has put even more pressure on the productivity gap and the goal to
innovate has become even more important. Businesses all over the world are faced with an unprecedented
situation. Now, more than ever, business agility, the ability to respond and adapt, to change faster, become
leaner and smarter, is crucial for business survival. The more innovative businesses are the more resilient
they will be and thus the higher their chances to survive.

It is therefore clear that region prioritises business innovation in West Midlands enterprises to enable recovery
and future resilience.

2.2 The West Midlands Innovation Ecosystem

The West Midlands innovation ecosystem is defined by three core strengths3:
A diverse, cross-cutting research and innovation base: The West Midlands brings together a range of
sectors, services, enabling competencies and technologies together in a single place. The capabilities in
research and development, design and production span multiple industries including advanced
manufacturing and engineering, next-generation transport systems, data-driven healthcare technologies,
energy generation and storage, and data and systems integration. The West Midlands is home to a range
of universities, consistently ranked in the top 20 nationally for the quality of their blue sky and applied
research. Knowledge from these institutions spills over into industry through commercially-engaged
academics, science parks, incubators and the largest concentration of accelerators in the country. The
West Midlands also hosts two of the UK’s strategically important High Value Manufacturing and Energy
Systems Catapults.
These research strengths are central to the West Midlands’ overall productivity effort; helping create new
technologies, solutions and business models to address the strategic opportunities set out in the WM Local
Industrial Strategy. For example, Warwick Manufacturing Group and the Advanced Propulsion Centre will be
central to the West Midlands’ ambition to be a global hub for battery Research and Development, while the
Birmingham Institute of Translational Medicine (ITM) will be at the core of the approach to data-driven
healthcare. This impact will only be maximised if the extent and pace at which research is translated into
business and markets is improved.
An engine of private sector research and development: Businesses across the West Midlands invested
£2.3bn in R&D in 2016, making up 10 per cent of all UK Business Enterprise expenditure on R&D (BERD)
and the 4th highest region in the UK. However, this investment is not matched by public funding, Research
published by UKRI in 2020 shows that 52% of gross domestic expenditure on R&D (GERD) goes to
London, the South East, and East of England regions 4; In 2018-19, the West Midlands received only 9%.
The West Midlands is a leader in R&D intensive industries such as automotive—with Europe’s largest
automotive R&D facility in the National Automotive Innovation Campus at the University of Warwick—which
as a sector has played an increasingly important role in driving UK business R&D. In other sectors, the region
has some strong business led, cluster organisations with a strong focus on innovation, such as the Midlands
Aerospace Alliance and the recently formed Create Central (Screen Industry), with a Health Technology
Cluster body also emerging.
Home to dense innovation networks and clusters: Innovation takes place across the region, but it is also
highly concentrated in geographic clusters of original engineering manufacturers, universities and firms in
strategic sectors. These can be found in: Birmingham, Coventry and Wolverhampton city centres;
Edgbaston’s life sciences cluster; the area surrounding Birmingham Airport; the automotive and future
mobility cluster around Coventry and Warwickshire; and Leamington Spa’s ‘Silicon Spa’ cluster of computer
game companies.
This is underpinned by significant physical infrastructure. Universities, developers and the public sector have
invested across the West Midlands. The region’s accelerators, incubators and translational research centres
bring together established companies, start-ups and research expertise to turn ideas into new products and
services. The West Midlands also has strong partnerships, such as Innovation Alliance for the West Midlands

3   West Midlands Science and Innovation Audit
4   ONS, 2020
and the West Midlands Academic Health Science Network, that bring business, universities and other public
sector organisations together to drive innovation.

3 MIT REAP-WM Analysis of the Regions Innovation Ecosystem
A key theme highlighted by the MIT program is the importance of strengthening both the innovation capacity
(I-Cap) and entrepreneurial capacity (E-Cap) within a region. I-Cap being defined as a regions ability to
develop new to the world innovations from inception through to the market. It covers not only the development
of basic science and research, but also the translation of their ‘solutions’ into useful products, technologies
and services. E-Cap is defined as a regions ability to start and build new to the world businesses from
inception to maturity. This includes a subset of more general entrepreneurial capabilities and conditions for
forming enterprises. Often innovators have great ideas (I-Cap) but lack the entrepreneurial skills (E-Cap) to
develop them5. Similarly, there are many talented entrepreneurs whose talents are wasted on a limited
pipeline of high-quality ideas.

The analysis of the West Midlands Innovation Ecosystem combines four research streams:
   1. Mapping of the current business support activity in the region and aligning that business support as
      I-Cap and E-Cap support
   2. A survey of businesses and Risk Finance Providers on their view of the region’s innovation ecosystem
      and their engagement with the five REAP stakeholders (Government, Entrepreneurs, Universities,
      Large Corporates and Risk Finance)
   3. Two separate University and Business Forums
   4. Mapping of I-Cap and E-Cap for the region based on an agreed set of indicators.

We have used theses research streams to provide us with a view of the current Innovation ecosystem and
to identify needs and challenges within that system.
3.1 Analysis of Business Support
As part of the MIT REAP Teams analysis of the region’s innovation ecosystem the business support
programmes offered around the whole of the West Midlands have been mapped. Each business support
activity delivered by an institution has been allocated to one of 6 support types: Networks, Training, Access
to Finance, University Knowledge Transfer, Accelerators and Incubators, Business Support and Co-working
space. The support activity has also been mapped against the five pillars of I-Cap and E-Cap (Human
Capital, Funding, Infrastructure, Demand and Culture). Only support activities based within the region have
been included as mapping the engagement of national support schemes from businesses in the regions
becomes too complex. The one caveat to this is the inclusion of the Catapults which are based in the region
as their engagement is integrated into many of the region’s institutions and activities.

A visualisation of the innovation Ecosystem can be seen in Figure 1, Red Nodes are businesses, Green
Nodes are Universities and Blue Nodes are Governmental/Public Bodies Purple Nodes are Risk Finance and
Orange Nodes represent Large Corporates.

We can see immediately from this type of visualisation the importance of universities in the delivery of
business support activity, not only in the transfer of university expertise and knowledge to the region’s
businesses but also the provision of incubators, business support and finance. It is understood that many of
the support programmes have more than one partner, in this mapping the lead partner has been used. We
can see which organisations are involved in a variety of activities; the more nodes an organisation is
connected to the more influence it has in the region’s ecosystem. The visualisation also provides some
indicators of areas which require further investigation, for example there are a number of Risk Finance
companies operating in the region but their involvement with other activities appears limited a more
networked Risk Finance provision would provide easier access to that finance from the business
communities.

A more detailed breakdown of this mapping can be seen in Tables 1 and 2 in Appendix 1 where the business
support activity is also mapped against specific sector areas of support.

5
    Chisholm, D., Grey, S., Ritchie, I., Levie, J., Harris, J., & Reeves, C. (2014)., Increasing innovation-driven
entrepreneurship in Scotland through collective impact
Figure 1: WM Innovation Ecosystem by Business Support Activity Areas
3.2 I-CAP and E-CAP Analysis
The ‘MIT I-Cap/E-Cap framework’ suggests a set of measures that captures the strengths of the I-Cap and
E-Cap in a specific region. Using these a set of indicators was developed to assess the capability to support
Innovation and Entrepreneurship in the West Midlands region. WM-REDI6 (part of the West Midlands MIT
REAP Team) have led on matching these indicators with datasets, which compare the West Midlands
regional figure with the National average (Data sets can be found in Appendix 2). These measures are
grouped into the I-Cap and E-Cap Pillars to provide an indication of the Strengths and Weaknesses of Each
Pillar in relation to I-Cap and E-Cap.
In addition, a survey of businesses and Risk Finance Providers was undertaken across the West Midlands
using the survey provided by the MIT REAP-UK. In total 127 survey responses from businesses in the West
Midlands were obtained. The responses form this survey have been used to ‘sense check’ the findings of
the I-Cap and E-Cap analysis and to provide a qualitative view of the region’s innovation ecosystem. Other
insights obtained from the Growth Hubs represented on the MIT REAP-WM Team have been included in the
analysis.
Further one to one interviews were held with 10 Risk Finance Providers who were asked “how as part of the
West Midlands ecosystem do we engage more effectively with Risk Capital providers and ensure better
investment success”.
Two forums were also held, one with leaders from the 6 main Universities in the region and one with Business
leaders. Both forums discussed similar questions around the availability and access of national funding for
innovation and research. The Business Forum sought to answer:
1. How can we work more collaboratively to access national funding and grow our regional R&D&I
assets?
6 https://www.birmingham.ac.uk/research/city-redi/wm-redi/index.aspx2. How best should public sector funding be used to align with Business R&D strategies?
The University Forum discussed:
1. How can the regions universities work more collaboratively to access national funding whilst
maintaining each institution’s competitive advantage? and
2. How can we present the region better to show the connected assets of the innovation ecosystem and
thus compete more effectively for government funding?3.3 Human Capital
I-CAP E-CAP
Strong Weak
Strengths Weaknesses
The West Midlands has the largest University sector outside London, including nine Only 33.5% of the region’s population (861,700 people) have a degree level
universities and four higher education colleges. There are an additional 41 further qualification (NVQ4+). To reach the UK average of 40.2%, an additional 173,249
education colleges with students taking higher education courses. Higher education need to be upskilled. This translates that there are not enough graduates trained to
institutions are critical sites for innovations, they educate prospective workers and sustain the innovative and analytical work behind R&D.
produce technological and scientific results that can be turned into patents and
product. They are therefore, an important part of the region’s I-Cap.
The eight Midlands Innovation (MI) alliance universities (Aston, Birmingham, There is a high proportion of the West Midland’s working-age population with no
Cranfield, Keele, Leicester, Loughborough, Nottingham and Warwick) currently formal qualifications (11.3%). To reach the UK average of 7.9%, an additional
generate more patents per unit of research income than any other major UK 87,115 need to gain one qualification. This alongside the above average
university grouping (MICRA, 2020). unemployment rate raises concerns of a regional skills gap, which does not meet
the ‘I-Cap demands’ for a supply of skilled people, technicians, researchers and
support staff.
Graduate retention is an important contributing factor to ensure there are enough To increase the entrepreneurial capacity in the region, a greater proportion of the
trained graduates to sustain innovative work. In total, 40.4% of graduates from a working-age population is needed with the required skills and knowledge to start a
Birmingham institution work in the West Midlands six months after graduation. In business.
addition, 23% of Warwick University graduates take up professional jobs in the West
Midlands in the six months following graduation.
The percentage of engineering / scientist graduates in the region is 22.1%, which is Region has the highest number of non-internet users in the UK.
higher than the UK average of 19.5%. This is important since a higher quality of
STEM education leads to a higher rate of more advanced technological
breakthroughs made.
For the ‘average progress 8’ score Birmingham is rated as ‘Above Average’; both Highest proportion of employers saying they find digital skills difficult to obtain from
Solihull and Wolverhampton as ‘Average’; while Coventry, Dudley, Sandwell and applicants of any UK region.
Walsall were deemed ‘Below Average’. A school's ‘average progress 8’ score is the
average of all of its students' scores and reflective of the quality of secondary school
education.3.4 Funding
I-CAP E-CAP
Average Weak
Strengths Weaknesses
The West Midlands is identified as a ‘business-led innovation region’. This reflects the The UK’s R&D spending, both public and private, is highly regionally imbalanced,
above-average levels of private sector investment in R&D in the region 7. which disadvantages the West Midlands region7.
Research published by UKRI in 2020 shows that the so-called ‘Golden Triangle’
benefits disproportionately from public investment, compared with other regions of the
UK. The headline stat is that 52% of gross domestic expenditure on R&D (GERD)
goes to London, the South East, and East of England regions8. In 2018-19, the West
Midlands received only 9%. (ONS, 2020)8.
Research funding awarded to local universities acts as a catalyst for other The regional investment available to take these to market is dwarfed by that available
investments in city-regions. The presence of research-intensive universities in to university spinouts and affiliated businesses in London, Oxford and Cambridge.
Birmingham is a central factor in the success of the Greater Birmingham and Solihull Indicatively, the South-East and East of England recorded 63% of all investment deals
LEP and its ability to attract funding awards. The GBSLEP has received significant (of all types) in the UK in 2019. The East and West Midlands combined had just
levels of funding from Horizon2020 (53,590,192 euros for 2014-2018) and research 4.4%10.
council/Innovate UK (£997,002,402 for 2012-2021)9.
When we account for the unequal LEP geographies, by standardising funding data Access to Finance and Cash flow – The impact of the COVID-19 pandemic has meant
per head of population in each LEP, we find that the GBSLEP sits in the top ten LEP that credit providers are now more cautious about who to lend to and sales have
areas outside of London, in terms of its success at winning both European and UK diminished. Consequently, the region’s businesses are facing new challenges with
research funding. The Midlands Engine receives the highest level of InnovateUK regards to access to finance and cash flow.
Funding awards, reflecting its strong history of manufacturing. However, there are
wide geographic and sector variations in a broad and diverse economy like the West
Midlands.
7 Forth and Jones, (2020) The Missing £4 Billion: Making R&D work for the whole UK, NESTA
8 ONS: Gross domestic expenditure on research and development, by region, UK
9 Taylor, A. (2019) The realities challenges and strengths of the external funding environment
10 The Deal: Equity investment in the UK 2019, Beauhurst,3.5 Infrastructure
I-CAP E-CAP
Strong Average
Strengths Weaknesses
The West Midlands is one of the largest urban areas outside London. Its central In the West Midlands, there is a major issue regarding affordable housing. This has
location at the heart of the road and rail network, together with Birmingham negative consequences across the board, including issues of accessibility for first time
International Airport, means that it is well connected to the rest of the UK and buyers, higher rents in the private sector due to high demand, and longer waiting times
international markets. for those registering for social housing 11.
Key rail and road links include: (i) Direct train services to London and the South West, The M6, M5, M42 and M40 are key road linkages that are all part of the region’s
the West Midlands, Scotland, the North West and Yorkshire; (ii) The M6, which Strategic Road Network. A comparison of delays on these key road links between
provides access to the North West; (iii) The M5, which provides access to the South 2017 and 2018 identified that some junctions had experienced an increase in average
West; (iv) The M42, which provides access to the East Midlands; and (v) The M40, delays whereas others have remained the same. The sections, which are affected by
which provides access to the South East. the lowest speeds, are Birmingham, Wolverhampton, Coventry, Walsall, West
Bromwich and Brierley Hill and these are considered to be strategic centres (Cepeda
Zorilla,)11.
The region has a number of high tech business parks that are helping to foster There is intra-regional variation for super-fast, ultra-fast and Full Fibre availability. Full
innovative practices and high tech industry. These business parks provide crucial fibre availability represents where the network has been rolled out to a “lead-in” that
opportunities for businesses and key stakeholders to network, broadening their will serve the consumer end premise and where the consumer would expect to pay a
potential resource base and maximising their opportunities. This is particularly standard installation charge for that connection. The West Midlands is behind the UK
valuable for smaller, younger, and potentially more innovative firms. average of 6% for full fibre availability (% of premises). The figures in Walsall are 7.2%
and 3.3.% in Birmingham and Coventry. However, in Wolverhampton they are 0.7%
and 0.8% in Sandwell and Dudley.
96.5% (1,768,211) of premises have access to ultrafast and superfast broadband in There is limited analytic capacity and capability within local government and an ad-
the WMCA in 2019. Across the WMCA, the overall median data usage was on hoc approach to data sharing.
average 178GB in 2019, which is above the UK average of 174GB. The region also
has above average outdoor and indoor 4G coverage.
The West Midlands has the best 5G mobile coverage in the UK and has recently set
up three 5G accelerators.
There is ongoing major infrastructure investment in the region (i.e. HS2), as well as a
strong construction sector and portfolio of capital investment opportunities.
The region has major assets including 2 Catapults, 6 Universities, and a major
manufacturing infrastructure.
11 BER (2019) Birmingham Economic Review3.6 Demand
I-CAP E-CAP
Strong Strong
Strengths Weaknesses
In the West Midlands Combined Authority (3 LEP area) the following sectors are in a City-REDI research shows that 12.2% of West Midlands GDP is at risk because of
greater proportion (in terms of percentage number of jobs) when compared to the Brexit negative trade-related consequences. The West Midlands as a whole is more
national average: advanced manufacturing and engineering (11.4% vs 8.0%), the exposed than the UK average. Brexit will exacerbate the negative economic effects
public sector including education (13.1% vs 12.9%) and logistics and transport caused already by Covid-19 in UK firms, regions and sectors12 (Ortega-Argiles, 2020).
technologies (5.9% vs 4.9 %) , life sciences and health care (13% v 12.7%) and retail
(16.6% v 15.3%). This suggests that the domestic market is attractive enough for the
products/services of a new enterprise to form in these sectors.
The largest sector in the WMCA is the Business and Professional service sector, More focus/ investment in stimulating and supporting the demand side of innovation,
which accounts for £27.8bn GVA and makes up 26.5% of the whole economy. from the private sector, public sector, third sector and, indeed the public/end
customers is needed. Ultimately, innovation needs a market, so stimulating that
market and enabling new knowledge and technologies to be pulled (rather than simply
pushed) into these markets is critical.
The West Midlands is the 3rd largest value export region in England and exports more The impact of the funding shortfall is also evident in that good new spinouts in
Than Wales and Northern Ireland. ‘unfashionable’ sectors (e.g. medical devices, advanced manufacturing) have
difficulty in securing match funding for Innovate UK grants. Under-capitalised spinouts
and start-ups struggle to attract and secure top commercial and technical talent. They
spend disproportionately more time on fund-raising, raise less per investment round
and university founders suffer increased dilution from more frequent rounds. The
potential to scale and generate employment and more economic activity within the
region is therefore limited as things stand.
There are several potential entrepreneurial opportunities from Coventry being the
2021 City of Culture.
The ERC (Warwick and Aston University Business Schools), is based in the West
Midlands, and is the UK’s leading centre of excellence for research into the growth,
innovation and productivity of small and medium-sized enterprises (SMEs).
12 Ortega Argiles, (2020) How is Brexit going to be affected by the COVID-19 outbreak.3.7 Culture and Incentives
I-CAP E-CAP
Strong Average
Strengths Weaknesses
In 2018, the WMCA had a business base of 170,475 active enterprises, this has There were 18,805 enterprise births in 2013 in the WMCA (3 LEP), 42.1% (7,910)
increased at a faster rate than the UK average growth (3.3% compared to 0.5%) since were still active in 2018. This is slightly below the UK survival rate of 42.4%.
2017.
The WMCA enterprise births per 10,000 population is above the UK average (59 per Further research and data collection is needed to understand how culturally accepted
10,000 population compared to 58 for the UK). These are all positive signs that entrepreneurship is in the region and the extent to which there are positive or negative
entrepreneurship is considered as an acceptable career choice in the region, incentives.
encouraged by social norms.
The high prestige and quality of the scientific research institutions in the West SMEs do not know how to make the innovation eco-system work for them. Although
Midlands helps attract talent and is central to many of the region’s technology clusters, there is innovation ambition in the region there is a complete and utter lack of
including: the University of Birmingham’s Institute of Translational Medicine and the confidence in applying for innovation or business support to compete nationally or
High Temperature Research Centre; the University of Warwick’s Advanced internationally.
Propulsion Centre Hub and Warwick Manufacturing Group (HVM Catapult); the
Institute for Advanced Manufacturing and Engineering (IAME), a collaboration
between Coventry University and Unipart Manufacturing Group and the National
Transport Design Centre (NTDC).
Birmingham produces 39.1 STEM graduates per 1000 people which is far higher than
the UK average of 19.8. This suggests that there is a strong allure for choosing a
degree in science and engineering.
The West Midlands, alongside a number of the larger urban areas in the UK, are hubs
of ethnic minority business activity. The vital social contribution of these small
businesses is evident too in the cafés, convenience stores, grocers and private hire
taxi firms we see across the UK.
16% of the self employment workforce are ethnic entrepreneurs. This is significantly
higher than the 9.6% share in the North West and 9.6% share in the North East.
The density of ethnic entrepreneurs in the West Midlands is significant because: (i)
30% of ethnic minority businesses engaged in recent product or service innovation,
11 percentage points higher than non-ethnic minority firms; (ii) Since 2002 typically
ethnic minority entrepreneurs have reported a higher Total Entrepreneurial Activity
rate than non-ethnic minority entrepreneurs; and (iii) EMB owners in every UK region
were more likely to export than non EMB owners.4 Challenge Identification
4.1 Human Capital: Strong in I-Cap, Weak in E-Cap
The analysis of the regional and national factors relating to Human Capital indicate that the region is strong
in I-CAP but weak in E-CAP for this Pillar. In terms of I-CAP, the region is strong, with particular reference to
the percentage of engineering / scientist graduates in the region is 22.1%, which is higher than the UK
average of 19.5%. This is important since a higher quality of STEM education leads to a higher rate of more
advanced technological breakthroughs made. The important distinction here is retention of these graduates.
We see from analysis of the survey results that 79% of respondents have an undergraduate degree or higher
with 35% having a Master’s degree as their highest level of education emphasising the importance of further
education for those running and managing a business. When the respondents of the survey were asked to
think about their general business approach prior to Covid-19 the businesses were less concerned with the
ability to find the talent they needed, however, hiring talented people was a priority. This indicates that prior
to Covid-19 companies were seeking talent but were not concerned with their ability to find it. The problem
appears to be that although the region is producing graduates they may not be staying, only 33.5% of the
region’s population (861,700 people) have a degree level qualification (NVQ4+). To reach the UK average of
40.2%, an additional 173,249 need to be upskilled.
It was clear however that the region does support a substantial engineering and manufacturing skill set which
is being utilised in the automotive and aerospace manufacturing sectors.
There is also a high proportion of the West Midland’s working-age population with no formal qualifications
(11.3%). To reach the UK average of 7.9%, an additional 87,115 need to gain one qualification. This
alongside the average unemployment rate raises concerns of a regional skills gap, which does not meet the
‘I-Cap demands’ for a supply of skilled people, technicians, researchers and support staff.
This highlights the importance of the region’s ‘Skills Advisory Panels’, which aims to bring together local
employers and skills providers to pool knowledge on skills and labour market needs, and to work together to
understand and address key local challenges. The SAP needs to have a focus on building the innovation
capacity of the region.
UK employers stand out internationally for their preference to recruit rather than train, even when faced with
skill shortages. This is supported by the survey results which showed only 13% of respondents saying they
would invest in staff training. The UK Skills Mismatch in 2030, published in October 2019. Highlighted a
pressing need to shift to a new norm of lifelong learning. Longer working lives and rapidly changing skills
demands will require people to adapt within or shift between careers through upskilling and reskilling 13. As
part of a responsive skills system, national and local actors should develop clearly defined career pathways,
establish more flexible provision and funding, approach training more holistically and in partnership, and
provide greater clarity over their long-term objectives, roles and responsibilities13. In terms of timeframes for
skills planning employers face a balancing act of ensuring practical skills are in place for the ‘here and now’
to deal with ‘business as usual’ operations while at the same time looking ahead at strategic skills needed
for future business development and success. The prior experience of respondents from the survey showed
that although 31% had extensive background industry knowledge a similar percentage had no such
experience in either setting up a business or managing one.
We can see from the current support available in the region that there is a wide range of business support
programmes to help individuals with their start-ups run by both universities and councils and specific sector
support activities such as Create Central’s Apprenticeships and Bootcamp pilots for the creative sector. There
is also training available in entrepreneurship and in business leadership, but this is fragmented. A recent
development in the region is the launch of the BEIS small business leadership programme which is delivered
by 3 of the region’s universities. There is only one programme in the whole region that provides training in
Innovation Skills for business.
4.1.1 Human Capital Challenges
• A partnership approach to Digital skills development is needed to address some of the skills
challenges identified and deliver the full spectrum of social, economic and cultural benefits 13.
13 Lyons, H., Taylor, A., Green, A. (2020) Rising to the UK’s Skills Challenges.• There needs to incentives to help shift the businesses to training and reskilling rather than
recruitment14. “Programmes to reach underrepresented groups are particularly important to ensure
inclusive growth and access all the pools of talent and creativity we will need”.
• Access to leadership and management education for entrepreneurs and small business leaders. This
isn’t all about start-ups, business leaders crucially need the skills to grow and scale their businesses
along with growth ambition and access to finance for E-Cap to flourish.
4.2 Funding
In terms of I-CAP, the West Midlands is identified as a ‘business-led innovation region’. This reflects the
above-average levels of private sector investment in R&D in the region. However, research published by
UKRI in 2020 shows that the so-called ‘Golden Triangle’ benefits disproportionately from public investment,
compared with other regions of the UK. The headline stat is that 52% of gross domestic expenditure on R&D
(GERD) goes to London, the South East, and East of England regions (ONS, 2020). In 2018-19, the West
Midlands received only 9%. (ONS, 2020). A large amount of private sector funding comes from large
corporates such as JLR. State aid rules dictate that large corporates can only attract 30-40% of public match
funding which accounts for some of the disparity in funding. We could increase public investment by
encouraging more SME’s work with large corporates to run innovation projects as they are able to attract up
to 70% public funding under the state aid rules. If public sector investment in the West Midlands is not
increased, the danger is that the private sector will respond to the better availability of innovation resources
and skills elsewhere by relocating their own investment.
A substantial regional devolution of innovation funding at a sufficient scale to achieve a better fit with local
opportunities is needed along with a commitment to greater transparency on how funding decisions are made
in the government’s existing research funding agencies, and an openness to a broader range of views on
how this might change is needed15. The recent publication and subsequent consultation on the Government’s
R&D Roadmap do show that these sentiments have been heard and there is a move towards the levelling
up of R&D funding across the country. However, what form this takes is yet to be determined.
The UKIS (2017) observed that ‘availability and costs of finance’, together with ‘innovation costs’ and
perceived ‘economic risks’, are the most common barriers to innovation. These findings are consistent with
City-REDI’s recent survey of 300 firms across the Advanced Manufacturing, BPS, retail, and hospitality
sector16. The surveyed firms in the West Midlands reported a range of barriers to innovation limiting their
ability to improve products and services or the way these are produced/sold. Collectively, the firms rated ‘cost
factors’ as the most pressing constraint, as do UK firms generally. The retail (53.3%) and hospitality (53.8%)
firms, in particular, identified this as a high barrier to innovation, compared to 27.4% in advanced
manufacturing and 31.1% in BPFS firms. A contributing factor to the cost constraints observed by the region’s
firms is the disproportionate regional distribution of funding for research and business. Interestingly, although
access to finance was an issue, we can see from the survey results that prior to Covid-19 the companies
were less concerned about cashflow and access to finance and more concerned with maintaining a digital
capability.
In terms of E-CAP, the impact of the COVID-19 pandemic has meant that credit providers are now more
cautious about who to lend to and sales have diminished. Consequently, the region’s businesses are facing
new challenges with regards to access to finance and cash flow.
Analysis of the access to finance programmes in the region supporting I-Cap such as R&D loans and grants
shows there are a number of regional incentives such as Innovation Vouchers but most are geographically
segregated such as the Black Country Investment Fund and Pivot to Prosper which is GBSLEP centric. The
I-Cap is supported by a proliferation of national innovation funding through InnovateUK.
E-Cap analysis shows that there are a large amount of Risk Finance providers operating in the region which
would indicate that there is funding available for growth. A report from HMRC on companies raising funds17
showed that spinout companies from the Midlands Universities offer a potentially attractive portfolio for
investment, built from a collective investment in research of £550m p.a. The portfolio has generated £15m
14 Green, A. and Taylor, A. (2020) Workplace Perspectives on Skills
15 Forth and Jones, (2020) The Missing £4 Billion: Making R&D work for the whole UK, NESTA
16 Billing et al., 2020, https://www.birmingham.ac.uk/Documents/college-social-sciences/business/research/city-redi/Projects-
Docs/Productivity-Project-Survey-Results.pdf
17 Enterprise Investment Scheme Seed Enterprise Investment Scheme and Social Investment Tax Relief (2019) HMRCcash returns for MI universities in the past five years, with the remaining university equity currently valued at £30m. The ‘paper value’ of the companies is £440m. The spinouts already raise a collective average of over £60m investment a year and are currently seeking around £105m. Add in the relevant university-affiliated businesses in the Midlands and investment capital demand is potentially over £300m/year). However, analysis of the survey of the Risk Finance Providers highlighted that in 2008 80% of start-up funding was from private capital in the West Midlands, that private capital was lost from the region when Venture Capital Firms pulled out and consolidated their offices down South. Attracting London investors back to the region remains problematic as they will not travel efforts to entice some of the VC further North given the disparity in availability of private funding have met with little success. In addition, many large VC firms are just focusing on their existing portfolio’s focusing on scale-ups with a substantial turnover. These groups see the status quo as acceptable and see no need to change. The preferred approach is to take the companies to the investors, to do this the region requires a more coordinated approach so that the best the region has to offer can be presented. Currently the collaboration between incubators and accelerators is fragmented. The respondents thought that a more altruistic approach may help where the incubators and accelerators collaborate to present the “bright sparks” of the West Midlands in a coordinated approach to the VC community in London. Although the University spin-outs are well supported in the development of their businesses, there is a whole swathe of companies that are not and can’t get easy access to funding. The fragmented business support in the region through their contact with the Growth Hub leads to little success. A coordinated approach is needed to support these companies. Quality is key, a targeted approach to a business with a sophisticated vetted technology requires a lower proof barrier for investment, the team that comes with the business is also very important, these factors are crucial to investment success and helps breaks through the noise for the investor. In addition, the way funding has been allocated in the past has inhibited innovation in supply chains. Historically grant funding support was aimed at increasing both productivity and employment - extremely difficult to achieve simultaneously unless you are in a very rapidly growing sector – these support routes need to be separated. A more coherent strategic approach to attracting funding for strengths or capabilities within the region is needed, this should be a long-term approach. One challenge of the funding ecosystem identified was the lack of funding for early start-ups something that the Advantage Growth Fund used to support in the region. With these early funds, there was significantly more angel investing alongside compared to what is available now. Whilst the recent Midlands Engine Investment Fund (MEIF) has provided an important boost to regional funding, the £93m reserved for the very risky ‘proof-of-concept’ (seed) and venture stage (scale-up) equity investment over its initial investment period of five years to 2022 averages out at less than £20m/year across all investment opportunities. Of this, the total MEIF received by university spinouts is only c.£3.5m to date. Most of the Midlands Innovation universities have established, or invested in, small (
form of financial literacy or even more basic information about fundamental principles such as ethics,
       citizenship, tax and other bedrocks of commerce and business is needed.

   •   Create new support programmes integrated with local supply chains, including crucial Tier 2 and Tier
       3 firms, through demonstrator projects, supporting broad and accessible investment and access to a
       good supply of appropriate finance products on attractive terms as well as challenge opportunities
       leading to contracts
            o Coordinated presentation of businesses seeking investment to London VC firms.

   •   Establish a regionally-focused equity finance fund to allow a more flexible access to finance options
       for. Additionally, a funding network of partners to support the development of R&D bids is needed.

4.3 Infrastructure: Strong in I-CAP, Average in E-CAP
The West Midlands region benefits from its Central location and being one of largest urban areas outside
London. Its central location at the heart of the road and rail network, together with Birmingham International
Airport, means that it is well connected to the rest of the UK and international markets. Investment in the
Strategic Road Network (SRN) can support economic growth through improving productivity including
reducing unemployment and increasing labour supply by linking concentrations of skill labour with
employment opportunities. Enhancing regional and inter-regional connectivity facilitates agglomeration
economies and increasing competition and encourages private sector investment (BER, Cepeda Zorilla,
2019). Although the key road linkages can be subject to delays, reducing travel time the regions
Infrastructure supports a strong I-Cap.
City-REDI research by Dr Abigail Taylor, found that local universities will need to continue to play an active
role in continuing to attract investment to the region. This research examined the experiences of Local
Enterprise Partnerships (LEPs) and their partners in securing funding. The research found that the presence
of research-intensive universities in Birmingham is a central factor in the success of the Greater Birmingham
and Solihull LEP and its ability to attract funding awards thus contributing to the strong I-Cap in this Pillar.
Having strong research universities is critical to this success because they tend to be awarded to the
strongest consortia of university research groups and R&D focused businesses in key technology areas.
However, concerns have been raised that West Midland Universities are not collaborating enough in
consortia, the region has a range of universities that can bring different expertise to the table and occupy
different pieces of the ecosystem. It is this strength we must leverage.
But high levels of science, technology and engineering skills, strong regional partnership networks, and
coherent local industrial policies are also all important factors.
Analysis of the current Infrastructure I-Cap provision shows 12 Accelerators and Incubators supported by a
range of manufacturing support services. The region also is supported by a wide variety of university
knowledge transfer activity, most notably from Birmingham University with 13 interventions. However, there
was a consensus in the discussions held that the regions Universities need to cooperate more and present
their capabilities and research strengths to industry more effectively. In addition the region’s current
business support offer faces challenges including:
           • A fragmented business growth support offer within the region reduces the ability to provide
                 comprehensive support, tailored to specific needs of business.
           • Lack of clarity over the best support with multiple publicly-funded providers competing to
                 provide support and no clear centralised support to help businesses better understand this
                 complex ecosystem.
           • Insufficient focus on the demand-side of business support built around the perspectives and
                 needs of business leaders.

In terms of E-CAP, here is intra-regional variation for super-fast, ultra-fast and Full Fibre availability. The
West Midlands is behind the UK average of 6% for full fibre availability (% of premises). The figures in Walsall
are 7.2% and 3.3.% in Birmingham and Coventry. However, in Wolverhampton they are 0.7% and 0.8% in
Sandwell and Dudley. There is huge potential in using digital technologies to support the growth and scale
up of the region’s businesses. WM5G has helped position the region as a place to come but there is still a
reluctance in businesses up taking technologies of this type. Covid19 drove businesses to take on
automation, the difference automation makes is dramatic unfortunately the region is failing in this area. We
are doing the research and development but sending the automation abroad. Additionally, in the West
Midlands, there is a major issue regarding affordable housing. This has negative consequences across the
You can also read