QUEENSLAND CRICKET INFRASTRUCTURE STRATEGY
2018-2028
←
→
Page content transcription
If your browser does not render page correctly, please read the page content below
QUEENSLAND CRICKET INFRASTRUCTURE STRATEGY 2018-2028
ACKNOWLEDGEMENTS

                                                             Queensland Cricket (QC) wishes to acknowledge the significant contribution made by a number of
                                                             stakeholders in the development of this Strategy. Thank you to the cricket community, including
                                                             associations, local clubs, individuals and organisations that have contributed significant information and
                                                             feedback.
                                                             QC acknowledges the support provided by the Queensland Government in co-funding the project and its
                                                             representation on the Project Control Group. Thank you also to all councils that participated in a range of
                                                             consultation activities, in particular those council representatives who were members of Project Groups.

Queensland Cricket Infrastructure Strategy I November 2018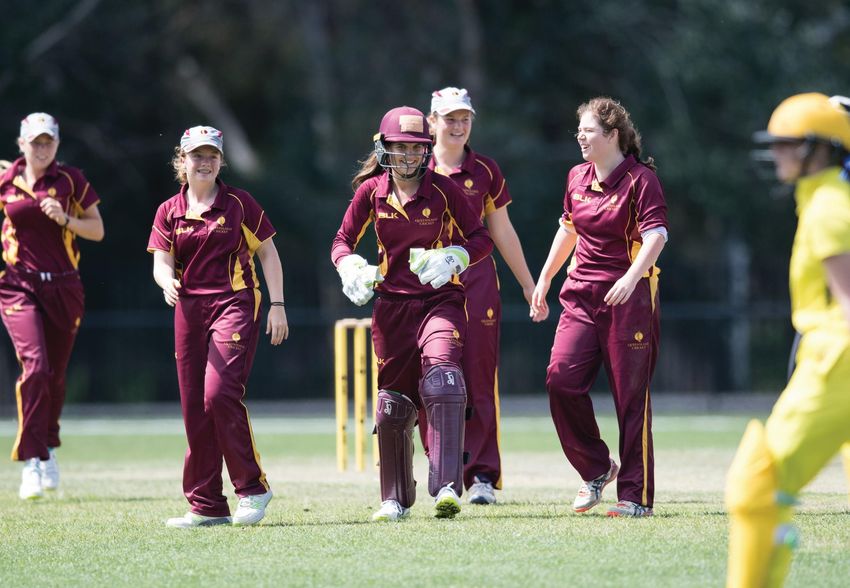
CONTENTS

Queensland Cricket Infrastructure Strategy                        ABOUT THIS DOCUMENT

1:   Welcome                                                  1   The Queensland Cricket Infrastructure Strategy (QCIS) provides the Queensland cricket
                                                                  community and its stakeholders with a detailed assessment and analysis of the state’s cricket
2:   Executive Summary                                        2
                                                                  facility landscape. It identifies key future venue planning and development priorities for the 2018
3:   Introduction and Background                              5   to 2028 period. In addition to the overarching state-wide and Premier Cricket infrastructure
                                                                  priorities identified, a detailed assessment, strategic directions and recommendations have been
4:   Impact on cricket delivery in Queensland                 8
                                                                  provided for each of Queensland Cricket’s (QC’s) 12 Regions. The Strategy also highlights the
5:   The ‘Value of Cricket’                                  11   associated economic impact some cricket competitions and events can have on a local
                                                                  economy, as well as detailing the relationship between the player pathway and associated
6:   Cricket in Queensland – ‘State of Play’                 14
                                                                  infrastructure requirements at each level.
7:   Facility Hierarchy                                      34
8:   Infrastructure priorities by Region                     37
9:   Premier Cricket                                         66
10: Tier Facilities                                          70
11: National Cricket Campus                                  73
12: Delivering the Strategy                                  79

Queensland Cricket Infrastructure Strategy I November 2018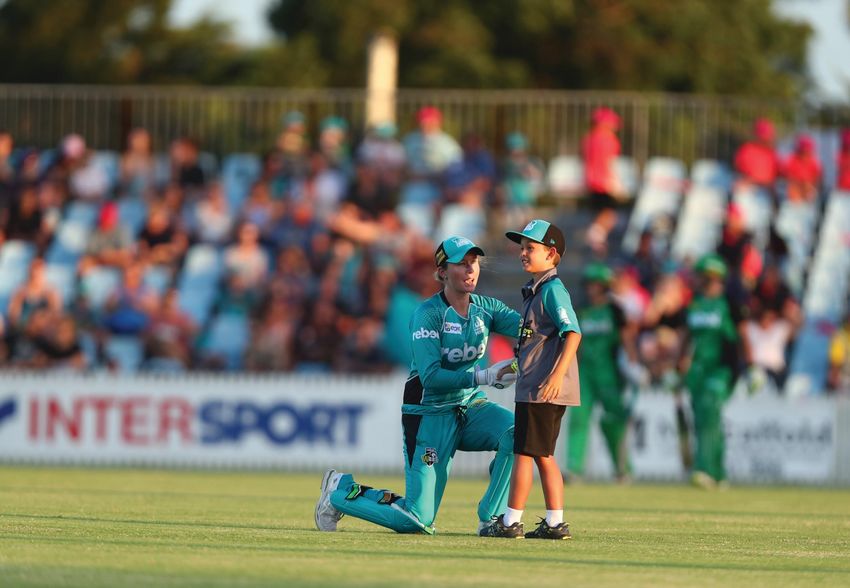
1. WELCOME
A MESSAGE FROM THE CEO

                                     I am delighted to present the Queensland Cricket Infrastructure Strategy 2018-2028 (QCIS).
                                     The QCIS presents a clear blueprint for cricket stakeholders, councils and governments alike to ensure we work together to direct and
                                     maximise smart investment in the right cricket infrastructure for Queensland, in the right locations, at the right time.
                                     The release of the QCIS will enable Queensland Cricket and Cricket Australia to invest more in our vital cricket infrastructure. This forward-
                                     looking document also provides impetus for our funding partners to increase and allocate their investments with confidence, ensuring our
                                     cricket clubs and associations can provide the best possible opportunities for more people of all ages, genders, backgrounds and abilities to
                                     play and enjoy the experience of participating in Australia’s favourite sport.
                                     This important document is the culmination of a significant project in partnership with Cricket Australia, gathering and collating
                                     comprehensive infrastructure data, consulting with cricket and government interests, and determining clear investment priorities in each
                                     region, at each level of the cricket pathway.
                                     Queensland Cricket could not have delivered the QCIS without the willing assistance of cricket volunteers and government representatives
                                     at all levels who answered surveys, attended consultation meetings, and provided valuable input and information.
                                     I acknowledge and thank our consultants insideEDGE Sport and Leisure Planning for their diligence and hard work. I also recognise Cricket
                                     Australia, and especially the Queensland State Government for their significant commitment to investing in the QCIS through the Sport and
                                     Recreation Planning Program, and through experience and advice from key officers and departments.
                                     I look forward to implementing the QCIS, and to the outcomes this work will bring in delivering better cricket infrastructure for Queensland
                                     over the next decade.

                                     MAX WALTERS
                                     CHIEF EXECUTIVE OFFICER

Queensland Cricket Infrastructure Strategy I November 2018                                                                                                                            1
2. EXECUTIVE SUMMARY

The QCIS provides an integrated and strategic approach to the future provision of           In addition to the framework, strategic priorities and recommendations are provided
and investment in cricket facilities across both metropolitan and country areas of          for each of QC’s 12 Regions (six identified as metropolitan and six as country
Queensland for the next 10 years. The Strategy also identifies a clear framework for        Regions for this Strategy). These provide unique and customised insights into the
how QC, the cricket community and government stakeholders view the future                   future planning priorities for each individual Region. The important role Premier
development of cricket and associated facilities. It enables cricket clubs and              Cricket plays in the player development pathway is also highlighted within this
associations in Queensland to now act to develop their own localised plans to meet          Strategy, with priority projects for Premier Cricket venues identified.
future infrastructure needs, using this Strategy as a solid basis.
                                                                                            In 2017-18, QC serviced 67,655 registered club and community cricket participants
The preparation of the QCIS has included significant sport and government sector            and more than 304,000 total participants across all of its programs and formats.
engagement and is closely aligned with the national direction and objectives for            Further growth and diversity in the game will drive support and investment in both
cricket into the future, as set by Cricket Australia (CA), the sport’s national governing   cricket participation initiatives and facility development.
body.
                                                                                            To support the structured provision of cricket facilities, CA’s National Cricket Facility
The following page highlights QC’s framework for the future planning and provision of       Hierarchy is applied to guide priorities based on infrastructure provision according to
cricket facilities in Queensland to 2028, and will ensure the right decisions are made      each venue’s purpose and local cricket participation and potential.
about investing in the right projects, in the right places, at the right time.
                                                                                            In order to fund priority infrastructure, QC and CA are investing more in grass roots
Five key strategic objectives are included within the framework that will underpin          cricket infrastructure as a catalyst to attract investment from our partners in cricket
cricket infrastructure planning and investment decisions for the sport over the next 10     clubs and associations, as well as in federal, state and local government. QC’s
years. Each objective is supported by actions designed to help guide the                    Australian Cricket Infrastructure Fund (ACIF) allocation will exceed $1 million in
development and implementation of the Strategy’s recommendations.                           2018-19 for the first time, and is expected to grow. This commitment is in addition to
                                                                                            $4.25 million set aside to support the National Cricket Campus project.

Queensland Cricket Infrastructure Strategy I November 2018                                                                                                                              2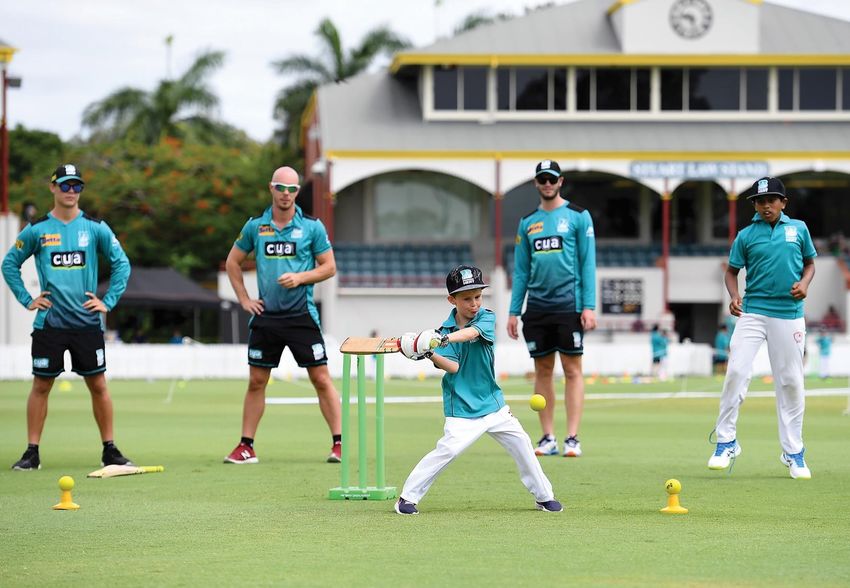
QCIS FRAMEWORK

                The QCIS is a blueprint for planning, construction, upgrading and maintenance of cricket facilities across Queensland. It will aim to ensure the right
  WHY?          decisions are made about investing in the right projects, in the right places, at the right time

                                                  STRATEGIC OBJECTIVES – WHAT DO WE WANT TO ACHIEVE BY 2028?
                   Better activate existing                                            Increase venue
 WHAT?                                             Create more flexible and                                                                    Secure cricket infrastructure
                  fields and green spaces,                                      sustainability and capacity   Improve quality of game and
                                                      inclusive cricket                                                                         to support, strengthen and
                 alongside development of                                          to encourage targeted           practice facilities
                                                        environments                                                                             connect talent pathways
                        new facilities                                           infrastructure investment

                                                             ACTIONS – HOW WILL WE ACHIEVE OUR OBJECTIVES?
                ✓ ‘Light up’ cricket by          ✓ Design universal            ✓ Promote shared facility      ✓ Invest in quality pitches,     ✓ Build the right level and
                  increasing the number of         facilities and amenities      use and create more            outfields and                    mix of infrastructure for
                  floodlit cricket fields and      that cater for all users      flexible community             practice/training facilities     each level of the player
                  training facilities                                            venues                                                          pathway – Community,
                                                 ✓ Construct more                                             ✓ Provide infrastructure
                                                                                                                                                 Pathway and High
                ✓ Improve cricket                  accessible buildings and    ✓ Pursue infrastructure          that is practical and
                                                                                                                                                 Performance
                  scheduling                       supporting infrastructure     partnerships with key          matches local resources
                                                                                 external partners                                             ✓ Partner with growth area
                ✓ Promote modified junior        ✓ Increase focus on                                          ✓ Enable education and
                                                                                                                                                 Councils, State
                  cricket formats that             infrastructure supporting   ✓ Increase support for           training support for
                                                                                                                                                 Government, developers
                  maximise field use               female, Indigenous,           better planning and            improved maintenance
  HOW?                                                                                                                                           and commercial partners
                                                   junior and disabled           access to funding              practices and resourcing
                ✓ Grow cricket                                                                                                                   on the development of
                                                   participants
                  infrastructure                                               ✓ Projects to grow financial                                      new cricket fields in
                  partnerships with                                              sustainability of clubs                                         areas of forecast future
                  schools                                                        and facilities                                                  demand

                                          KEY STATE-WIDE INFRASTRUCTURE PRIORITIES (Metropolitan, Regional, Premier)
                                                                                                                                                     PATHWAY AND HIGH
                                                                                                                            PREMIER CRICKET
                                                   COMMUNITY CRICKET PRIORITIES                                                                        PERFORMANCE
                                                                                                                               PRIORITIES
                                                                                                                                                         PRIORITIES

                                                                   REGION BY REGION INFRASTRUCTURE PRIORITIES

Queensland Cricket Infrastructure Strategy I November 2018                                                                                                               3
To ensure the needs of the Queensland cricket community are met in the short,
                                                             medium and long-term, 13 state-wide and 72 regional priorities have been
                                                             recommended for implementation over the next 10 years.

                                                             Strategic recommendations have been informed through:
                                                             •   Assessment of facilities held in the National Cricket Facility Audit database;
                                                             •   Analysis of Queensland cricket participation, and market projections;
                                                             •   Stakeholder consultation and facility partner / investor engagement; and from
                                                             •   Collective interpretation of QC’s greatest challenges and needs with respect to its
                                                                 infrastructure.

                                                             The Strategy will also need to be underpinned by a number of broader sector changes and
                                                             developments. These include:
                                                             •   Evolving the way in which cricket is structured and competitions and programs are
                                                                 offered to players, teams and clubs;
                                                             •   Ongoing support and investment via the government sector at federal, state and local
                                                                 levels, and via other funding partners (commercial developers, sponsors etc.);
                                                             •   Unique circumstances, conditions and geography of Queensland’s country regions.

                                                             This Strategy is an important document to support an aligned approach to infrastructure
                                                             planning. The implementation of strategic directions and recommended actions will require
                                                             an aligned approach by all levels of cricket, government and community stakeholders.

Queensland Cricket Infrastructure Strategy I November 2018                                                                                               4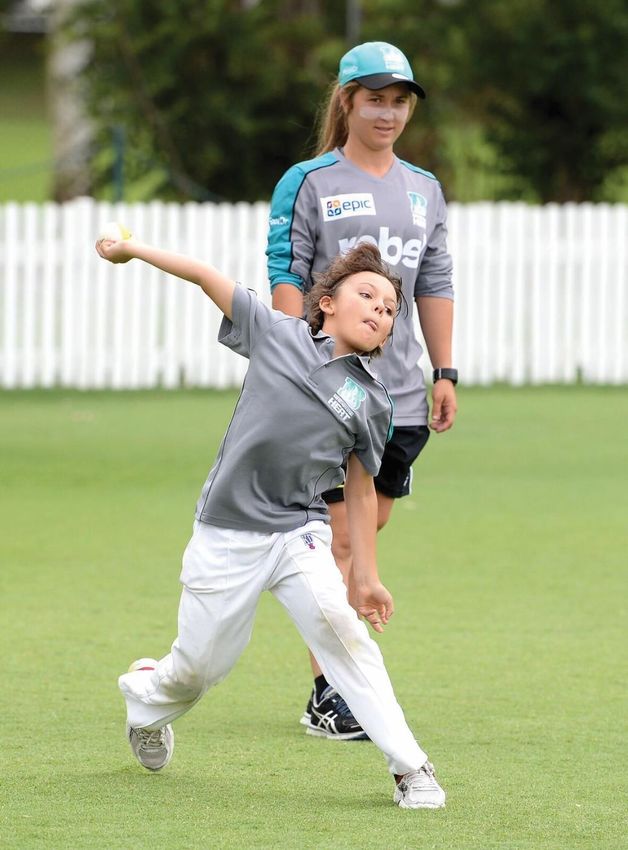
3. INTRODUCTION AND BACKGROUND

Queensland Cricket Infrastructure Strategy I November 2018   5
WHAT IS THE QCIS?                                                                                                    KEY QCIS PROJECT OUTPUTS

QC is regularly asked to provide strategic and policy        Underpinning QCIS recommendations has been the
direction to local governments, schools, associations        results and analysis from the National Cricket          • Reports on cricket facility audits conducted across
and clubs to support the planning, provision and             Facility Audit - an audit of facilities used for           Queensland to understand current facility provision,
maintenance of cricket facilities. This document aims        community cricket competition across Australia. This       gaps, trends and development priorities.
to enhance the collaboration between all layers of the       was a two-year undertaking by CA with State cricket
cricket community and government, and highlight the          bodies, and involved examination of community cricket
important drivers of cricket facility planning and           facilities across Queensland as registered on CA’s      • Briefing material on the impact projected
investment.                                                  MyCricket database. The result is Australia’s most         participation and population change will have on
                                                             comprehensive information on individual cricket            current and future cricket facility provision
The QCIS aligns cricket’s strategic planning objectives
                                                             facilities, measured against CA’s Community Cricket        requirements across the State.
with those of government and local communities, and
                                                             Facility Guidelines. There are undoubtedly cricket
provide targeted research and direction across QC’s
                                                             facilities not yet examined in the data. However, the   • Identification of the economic impact of some
12 regions. Each region is different and their unique
                                                             data source is ‘live’ and easily updated, and will         cricket infrastructure, events and content across
characteristics, available resources, structure and mix
                                                             continue to drive collaborative planning and               Queensland.
of programs all need to be considered when planning
                                                             investment decisions for the cricket community as it
and delivering facilities.
                                                             continues to grow and become more comprehensive.        • A strategic framework for the integrated planning
This document identifies the priorities for collective                                                                  and development of cricket infrastructure across
support and investment in community infrastructure                                                                      metropolitan and country Queensland.
that will sustain the game and meet the changing
needs of participants.
The QCIS builds on existing strategic planning and                                                                   • Identification of specific regional and facility level
objectives outlined in the Australian Cricket                                                                           needs, key issues and infrastructure development
Strategy, QC’s Strategic Plan and Premier Cricket                                                                       priorities.
Strategy, and those of the Queensland Government
and sporting community. QC’s vision of being
                                                                                                                     • The alignment of future facility planning and
‘Queensland’s favourite sport’ and ‘delivering
                                                                                                                        investment with CA and QC game/pathway
outstanding life experiences for Queensland
                                                                                                                        development and participation initiatives, and with
communities anywhere, anytime’ will only be achieved
                                                                                                                        scheduling and investment priorities.
via an aligned and strategic approach to future
provision of, and investment in cricket facilities across
all regions of Queensland.                                                                                           • A prioritised facility development implementation
                                                                                                                        plan with clear direction for cricket regions, Premier
                                                                                                                        Cricket and governments at all levels.

Queensland Cricket Infrastructure Strategy I November 2018                                                                                                                      6
STAKEHOLDER ENGAGEMENT                                                                  PARTICIPATION AND FACILITY DATA
Significant stakeholder consultation has been undertaken to develop the QCIS and to     Cricket participation figures presented and analysed throughout this Strategy have
ensure that it responds to current and future facility demands.                         been informed by CA’s National Cricket Census as well as by data registered in the
                                                                                        MyCricket database.
Key stakeholders involved in the development of this Strategy include local and state
government officers and representatives, local cricket associations and club            National Cricket Census participation data is published annually, and is audited
representatives, Queensland Premier Cricket representatives, CA and QC staff, and       against other sports’ participation figures by respected independent consultants,
members of the general cricket community.                                               Street Ryan. CA’s MyCricket database registers teams, matches and participants in
                                                                                        formalised cricket competitions and programs across Queensland. It does not include
The following consultation methods have been undertaken and informed the
                                                                                        participants aligned with some informal and/or social cricket competitions, schools
development of the Strategy:
                                                                                        programs or other cricket participation opportunities outside of affiliated club
•   Local/State government and cricket stakeholders workshops in Brisbane,              competitions/programs.
    Rockhampton, Mackay, Townsville and Cairns.
                                                                                        Given this Strategy’s focus is on infrastructure, it should be noted that regional cricket
•   Wide Bay cricket stakeholder teleconferences (government reps and cricket           participation figures provided are based on the location of an individual player’s home
    associations).                                                                      club/facility location, not necessarily their QC association affiliation. For example, a
                                                                                        player that lives within the Bayside East and Redlands Region, but has a club home
•   Association / Competition Survey (34 online survey responses received).
                                                                                        ground/facility located within the Brisbane North Region, and whose club plays in the
•   Government Survey (46 online survey responses received).                            Sunshine Coast Cricket Association competition, will register in the Brisbane North
                                                                                        Region participation data. Some regional participation variances may also result from
•   12x Premier Cricket Club meetings and surveys.
                                                                                        cricket region boundary changes by QC over a period of years.
•   Project information webpage.
                                                                                        Facility condition and provision data was collected by QC staff and volunteers as part
•   Project information bulletins.                                                      of CA’s National Facilities Audit. While every effort has been made to ensure data is
                                                                                        as detailed as possible, accessing all 1,103 cricket fields and associated buildings
•   Project Control and Working Group meetings including representation from QC,
                                                                                        across the State (particularly in remote rural areas) presented some challenges.
    CA, state and local government.
                                                                                        In some areas, data completion rates have not reached 100%. In these areas,
•   Consultation with a Project Reference Group with cricket, council and state
                                                                                        consultation and engagement activities with regional cricket community and local
    government sports department representation.
                                                                                        government representatives have helped inform facility findings and related
•   Individual meetings with QC Area Managers, Facilities and Game Development          infrastructure priorities. This data will continue to improve with input.
    staff.
                                                                                        All demographic data (and associated analysis) has been sourced from Queensland
•   Review of a State of Play and Infrastructure Framework Report by Project            Government population projections, 2015 edition; Australian Bureau of Statistics.
    Reference Group.

    Significant stakeholder consultation was undertaken to develop the QCIS to ensure that it responds to
    current and future facility demands.

Queensland Cricket Infrastructure Strategy I November 2018                                                                                                                      7
4. IMPACT ON CRICKET DELIVERY IN QUEENSLAND Queensland Cricket Infrastructure Strategy I November 2018 8
HOW COMMUNITY CRICKET IS CHANGING

The game of cricket has changed and evolved over time and continues to do so through new innovations, competition structures and modified
formats to attract and retain participants. CA and QC’s strategic planning is heavily focused on providing the right mix of opportunities to engage
with a broader range of participants. The following changes in the way cricket is played are considered key drivers for QCIS directions and
recommendations.

More people are playing cricket                              In addition to a more engaging game that creates           In addition to providing the right support, education
                                                             more action, fun, improved skill development and less      and resource structures, ensuring access to
QC reported a 16.2% increase in total participation
                                                             time to play, the modifications to pitch lengths and       appropriate facilities to accommodate cricket for
across all forms of the game between the 2015/16 and
                                                             boundary sizes has allowed junior cricket to maximise      women and girls will be critical to maintaining
2017/18 seasons. A wider push into more schools via
                                                             the use of existing playing fields. Changes to playing     participant levels over time.
entry level programs resulted in more than 206,000
                                                             schedules has resulted in the growth of the game at
school-based participants in 2017/18, setting the                                                                       Transformation of the sport at a grassroots level to
                                                             the introductory level with little impact on the demand
foundation for more players being introduced to the                                                                     better cater for females is a key strategy of both
                                                             for new fields in many areas. Cricket is also looking to
game and creating opportunities to transition them into                                                                 cricket and local communities, and is strongly
                                                             be proactive and maximise the use of fields with the
club cricket.                                                                                                           supported by all levels of government. Community
                                                             adoption of portable wickets for use in schools and
                                                                                                                        cricket infrastructure needs to keep pace with this
Modified formats                                             outfields.
                                                                                                                        growth and improvements need to be incrementally
New junior cricket formats were trialled in the 2016-17      Cricket for women and girls                                made to player, umpire, administrator, volunteer and
season to increase the fun, activity levels and skill                                                                   spectator facilities to continue to promote the
                                                             Along with the introduction of modified playing formats
development of Australian kids as they commence                                                                         involvement of women and girls.
                                                             for juniors, growth in girls’ participation in school
their cricket journey. CA, states and territories –
                                                             programs, competitions and entry level programs is
including QC – partnered with 15 associations
                                                             evident. More girls than ever are playing and the
nationally to deliver this new initiative that enabled 640
                                                             number of junior teams is growing in many
teams to play 6,261 innings of cricket under the
                                                             metropolitan and country areas. Female club and
modified formats. In Queensland, 67% of junior
                                                             community cricket participation increased by 98%
associations played new junior formats in 2017/18,
                                                             (2,673 additional female players in total) between the
growing to 92% of associations in 2018-19.
                                                             2015/16 and 2017/18 seasons.
Following a successful trial in a number of
                                                             Australian cricket is providing a strong focus and
geographical areas across Queensland, QC continues
                                                             increased resources towards growing the game for
to implement the new national junior cricket formats.
                                                             girls and creating a realistic pathway from modified
The evidence from the pilot program confirms that
                                                             programs, through to junior competition and into senior
players face more balls, can play more shots in more
                                                             women’s cricket.
areas, get more wickets and field far more balls than
traditional 11-a-side, full-length pitch formats.

Queensland Cricket Infrastructure Strategy I November 2018                                                                                                                      9
A ‘sport for all’
Promoting inclusion and diversity is a key CA strategy. It’s what helps make cricket ‘Australia’s
favourite sport – a sport for all Australians’. Clubs, associations and schools across Australia are
seeing thousands of new participants from previously under-represented communities try their hand
at cricket for the first time. CA reported a 79% increase in diversity participation nationally over the
past three years, with a significant rise in participation also occurring in Queensland.
Prioritising and supporting facility projects that deliver diversity and inclusion outcomes is important
for QC, as is ensuring adequate education and resources to deliver inclusive competitions, programs
and practices is provided to stakeholders responsible for running cricket across the state.
Increased demand for shorter, more flexible cricket programs and competitions
The game of Cricket has changed and evolved over time and continues to do so through new
innovations, competition structures and modified formats to attract and retain participants.
One of the biggest changes has been the rise in popularity of shorter T20 cricket competitions and
events. This form of the game is considered complementary to the traditional, longer format or cricket
ordinarily played on Saturdays and Sundays, T20 cricket is an excellent format to be played during
the week, with less time required to complete a match. With no daylight saving and minimal natural
light beyond 6.30pm in the summer months, demand for sports field floodlighting across the state is
growing rapidly.
Cricket is a summer sport, isn’t it?
No. Warehouse Cricket in Queensland has records of winter competition going back as far as 1930.
In recent years, there has been a resurgence in winter cricket, with much of this demand coming
from winter leagues and competitions across Brisbane.
Winter cricket attracts a growing base of registered cricketers and primarily is played on synthetic
cricket wickets. While this extension to the summer version of the sport is strongly supported by QC,
and complementary to the game’s continued growth and sustainability, it does present potential
facility access issues if competitions continue to grow, with some synthetic pitches covered, and
others inaccessible from April through to September under use by winter sporting codes.
Continuing to design new playing fields in partnership with winter sporting codes (e.g. AFL, Soccer,
Rugby Union, Rugby League) that enable synthetic pitches to remain usable at times during the
winter is particularly important in Metropolitan Brisbane.
Queensland Cricket Infrastructure Strategy I November 2018 105. THE ‘VALUE OF CRICKET’ Queensland Cricket Infrastructure Strategy I November 2018 11
The economic contribution of cricket
As part of the QCIS, quantitative and qualitative information was collected on the economic contribution of two
cricket-based events that considered the facility offering, accommodation and additional spend impacts from players,
families and officials.
To deliver this work, InsideEDGE engaged specialist economic development consultants Street Ryan - Australia’s
foremost consulting organisation in measuring and monitoring the economic impact and contribution of major sports,
events, and industrial and commercial initiatives. The full Street Ryan report can be made available by contacting
QC, with key highlights outlined on this page.
General findings
Sporting events controlled by clubs and associations, are important contributors to regional economies, with many
councils specifically targeting the attraction of major and significant events as part of their tourism and economic
development strategies. Cricket events make economic contributions to a region through:                                The event is estimated to have generated a
                                                                                                                       total contribution of $479,086 to the regional
•   Event organisation, promotions, venue preparation and maintenance.                                                 economy, comprising:
•   Local participants, daytrip and overnight visitors to the region.
•   The flow-on effects of this expenditure within the regional economy, initially in the service sectors such as
    accommodation and food service, transport, recreation services, retailing and entertainment.
                                                                                                                                        $144,390
The content of two regional cricket events were selected for assessment - the National Indoor Cricket
Championships held in Mackay, and the National Under 17 Male Championships held on the Sunshine Coast.
                                                                                                                             in travel and accommodation
National U17 Male Championships - Sunshine Coast (Tier 4 event)
The National U17 Male Championship was staged over four days (25 to 29 September 2017) and involved:
•   Ten competing teams from Queensland, NSW Metropolitan, ACT/NSW Country, Victoria Metropolitan, Victoria                             $188,110
    Country, Northern Territory, Western Australia, South Australia, Tasmania and a CA Development Squad.
•   Team squads consisting of 13 players, a coach, manager, physiotherapist and contingents of parents, all staying
                                                                                                                       in retail, food service, communications
    at least four nights on the Sunshine Coast.
                                                                                                                                    and maintenance
•   Total visitor nights from these participants was estimated to be 1,200.
•   Five games per day with the remaining fixtures and finals played in Brisbane.
•   An additional 250 daytrip visitors/spectators over the course of the event was assumed.                                             $146,586
•   Assumed average overnight domestic visitor expenditure in the Sunshine Coast was $175, and the average day
    trip visitor spent $98.                                                                                            in other business and multiplier effects
Six fields across three cricket venues in Buderim, Landsborough and Caloundra were used to host the event.

Queensland Cricket Infrastructure Strategy I November 2018                                                                                                              12
The event generated an estimated total contribution of $5,070,142 to the regional economy,
comprising:
$1,491,914 in travel and accommodation
$2,102,576 in retail, food service, communications and maintenance
$1,475,652 in other business and multiplier effects
National Indoor Cricket Championships – CRICKET’S UNIQUE SOCIAL VALUE WITHIN OUR COMMUNITIES
Mackay (2017)
Encouraging participation in cricket has clear benefits for Queenslanders and our communities. Cricket
The National Indoor Cricket Championship was contributes significant social, health and cultural benefits in excess of its economic value.
staged over 14 days (1 to 15 July 2017) at a five-
court facility in central Mackay that included: Cricket contributes in a unique way to demonstrating and enhancing Australian culture. Cricket is genuinely a
sport for all, with various game iterations catering for players of all ages and genders, and all skill levels, from
• 80 teams competing in 200 matches across 11 a vast array of cultural and socioeconomic backgrounds. It is a sport that attracts thousands of willing
divisions. volunteers to support and belong to vibrant local clubs. It unites Queenslanders, and continues to be
• An estimated 1,010 players and officials and 500 synonymous with the Queensland lifestyle and the Australian way of life.
family and friends and regular spectators, as well as Socially, cricket makes a valuable contribution to building and uniting strong local communities through the
250 local volunteers and participants per day. playing and supporting of local team sport. Cricket is a unique team sport in that it can require team members
• Commercial accommodation was used by all teams to participate, concentrate and cooperate for longer periods of time, on and off the field to achieve a result.
(including those within Queensland) plus other Playing cricket requires a high level of physical activity and so contributes to encouraging active and healthy
visiting supporters and spectators. lifestyles.
• Assumed average overnight domestic visitor With Queensland’s enviable climate, cricket can be played all-year round, allowing for year-round delivery of
expenditure in the Mackay was $186 (for visitors these largely unmeasured social benefits. However, these benefits will only be realised through the provision
staying in commercial accommodation), and the of well planned, quality cricket fields and supporting infrastructure.
average day trip visitor spent $143.
Investment in cricket infrastructure and the development of facilities that can attract and host cricket-based events create significant economic
benefits to local and regional communities.
Queensland Cricket Infrastructure Strategy I November 2018 136. CRICKET IN QUEENSLAND – STATE OF PLAY Queensland Cricket Infrastructure Strategy I November 2018 14
PARTICIPATION                                                                             QC’S ‘TOP SIX’ PARTICIPATION TRENDS
‘CLUB’ CRICKET PARTICIPATION IN QUEENSLAND
The level of club cricket participation across Queensland continues to grow steadily.
                                                                                                   Increasing demand for shorter and modified
The rise of both the men’s and women’s domestic Big Bash League competitions has
increased demand for a shorter, faster version of the game at local community level,
                                                                                             1     versions of the game
while the introduction of CA’s new junior formats has re-shaped the way introductory
and junior programs and competitions are played and delivered.
While these changes in cricket programs (and related participation) are notable, and
impacting on the way cricket is delivered across Queensland, traditional club cricket
remains the pillar of the sport with 67,655 club and community players taking to the              2       Increasing female participation
field in the 2017/18 season. This was an increase of 16.2% on 2015/16 totals and
included 2,673 additional female club cricketers (5,393 players in total representing a
98% increase on 2015/16).
It is important to note that the above Cricket Census participation figures relate                           New junior competition formats
specifically to club and community team participants and do not include schools or                    3      adoption
indoor cricket participation.
The adjacent diagram highlights the ‘top six’ cricket participation trends for
Queensland and the following page provides a summary of the current state-wide
club based participation numbers.                                                                            Increasing school participant numbers
                                                                                                      4      and programs

                                                                                                  5       Junior (5-12 years) participation increasing

                                                                                             6     Senior participation (18+ years) remains stable

Queensland Cricket Infrastructure Strategy I November 2018                                                                                               15
417 57 67,655 5,393 26,645 13,414 32,596
CLUBS ASSOCIATIONS / CLUB FEMALE JUNIOR YOUTH SENIOR
COMPETITIONS PARTICIPANTS PLAYERS PLAYERS PLAYERS PLAYERS
(5-12 years) (13-18 years) (19+ years)
Source: National Cricket Census (2017/18)
Queensland Cricket Infrastructure Strategy I November 2018 16CA’s 2017/18 season census data OVERALL PARTICIPATION FEMALE PARTICIPATION SCHOOL PARTICIPATION
revealed the following key
participation highlights across the
state. These figures extend beyond
structured club-based programs
and competitions and include all
forms of participation and
engagement across the State (e.g.
school cricket programs) during the
2017/18 season.
About the 2017/18 National Cricket
304,160 100,373 206,007
Census
The 2017/18 census was the sixteenth
+11% +12% +10%
annual auditing of Australian cricket
participation. A ‘participant’ is defined
by the National Cricket Census as
someone who participates in at least CLUB AND COMMUNITY INDOOR CRICKET
four sessions of a formal cricket 4,052
program. PARTICIPANTS* PARTICIPATION
T20 BLAST
The 2017/18 census was compiled by
specialist researcher Street Ryan, with
the cooperative efforts of CA and each
of the eight state and territory cricket
associations. 4,792
The organisations record the number
IN2 CRICKET
of programs, teams and registered
players within their state/territory for
each cricket program area.
67,655* 30,498 COMMITTTMENT TO JUNOR
FORMATS
*‘Club and Community participants includes both junior and senior club members, as well as 92% OF ASSOCIATIONS
participation in modified and introductory programs and activities delivered at a local club level.
Queensland Cricket Infrastructure Strategy I November 2018 17CLUB CRICKET PARTICIPATION BY QC REGION
METROPOLITAN
METROPOLITAN
Community and Club Cricket participation across Metropolitan cricket regions
REGION MAP
has continued to grow steadily. Participation in these regions was equal to
around 61% of Queensland’s total participation in 2017/18.
2017/18 Club 6
No. Region Cricket Playing Fields
Participation
1 Brisbane North 13,067 196
2 Bayside East and Redlands 7,488 141
3 South East Queensland 5,809 98
4 Metropolitan South West 6,383 106
5 Gold Coast 3,929 74 1
6 Sunshine Coast 4,351 83
TOTAL 41,027 698 4 2
Note: Gold Coast Cricket Region and Cricket Gold Coast Ltd participation numbers (found on page 21) differ due
to the fact the physical location of four club’s home ground venues that are affiliated with Cricket Gold Coast Ltd
fall just within the geographic boundary of the South East QC Region.
3
5
Queensland Cricket Infrastructure Strategy I November 2018 18COUNTRY
Country Regions, as defined in this Strategy, accounted for 39% of total participation
in Queensland at the completion of the 2017/18 season.
2017/18 Club
No. Region Cricket Playing Fields
Participation
Darling Downs and
1 6,914 136
South West QLD
2 Central Queensland 3,759 53
3 North Queensland 6,926 62
6 COUNTRY
REGION MAP
4 Wide Bay 2,556 62
5 Mackay Whitsunday 2,976 50
6 Far North Queensland 3,497 42
TOTAL 26,628 405
3
5
2
4
1
Queensland Cricket Infrastructure Strategy I November 2018 19QUEENSLAND’S TOP 20 LGAs (2017/18)
The table below provides a list of the top 20 club and community cricket participating local government areas at the completion of the 2017/18 season. The table also provides
information on the number of cricket venues and fields within each of these LGAs and a current field to club and community cricket participant ratio.
Number of Number of
2017/18 Club LGA field to
No. LGA QC Region cricket venues in audited cricket
participation participation ratio
LGA fields in LGA
Includes four Metropolitan
1 Brisbane 24,892 203 358 1: 70
Regions
2 Gold Coast Gold Coast 4,713 50 74 1: 64
3 Sunshine Coast Sunshine Coast 4,698 34 54 1: 87
Darling Downs and South West
4 Toowoomba 4,558 42 66 1: 69
QLD
5 Moreton Bay Brisbane North 4,071 50 59 1: 69
6 Mackay Mackay Whitsunday 2,527 17 30 1: 84
7 Logan South East Queensland 2,526 27 41 1: 62
8 Ipswich South East Queensland 2,396 27 37 1: 65
9 Redland Bayside East and Redlands 2,380 25 38 1: 63
10 Townsville North Queensland 2,032 20 32 1: 64
11 Rockhampton Central Queensland 1,975 8 17 1: 116
12 Cairns Far North Queensland 1,689 13 18 1: 94
13 Lockyer Valley South East Queensland 1,045 13 19 1: 55
14 Gladstone Central Queensland 976 11 12 1: 81
15 Bundaberg Wide Bay 904 10 20 1: 45
16 Fraser Coast Wide Bay 874 4 10 1: 87
17 Scenic Rim Wide Bay 710 9 16 1: 44
18 Tablelands Far North Queensland 511 4 8 1: 64
19 Whitsunday Mackay Whitsunday 414 2 9 1: 46
20 Central Highlands Central Queensland 387 10 12 1: 32
Queensland Cricket Infrastructure Strategy I November 2018 20QUEENSLAND’S TOP 20 CRICKET ASSOCIATIONS (2017/18) The below table provides a list of the top 20 QC associations in terms of the number of participants at the completion of the 2017/18 season. # Association 2017/18 Participants 1 Warehouse Cricket Association 7,984 2 Brisbane North Junior Cricket Association 6,279 3 Metropolitan South West District Cricket Inc. 4,694 4 Cricket Gold Coast Ltd 4,401 5 Sunshine Coast Cricket Association 3,898 6 Toowoomba Cricket Inc 3,466 7 Queensland Premier Cricket 3,197 8 Bayside East & Redlands Cricket Association 2,524 9 Eastern Districts Junior Cricket Association 2,438 10 Mackay Cricket Association Inc. 2,390 11 Ipswich & West Moreton Cricket Association 2,118 12 Cricket Far North Inc 1,925 13 Rockhampton Cricket Inc 1,878 14 Townsville Cricket Inc 1,862 15 Queensland Sub Districts Cricket Association 1,820 16 Queensland Cricket State Championships 1,456 17 Logan District Junior Cricket Association 1,453 18 Bundaberg Cricket Association 961 19 QJC Development Championships 874 20 Gladstone Cricket Inc. 854 Queensland Cricket Infrastructure Strategy I November 2018 21
FUTURE DEMAND
For the purpose of this Strategy, each region’s ‘penetration rate’ has been used to forecast future participation growth. A penetration rate is calculated by dividing the number of
registered players by the total population for a respective area. The table below provides each region’s penetration rates for census participants, and then applied this figure to
2026 forecast population to estimate what cricket participation may look like in each region, if the current level of participation per population remains the same. This method
should be used as a guide only for planning purposes.
There is no definitive formula or tool to predict when and if participation in a particular sport will increase or decrease. Forecasting future demand for any sport is challenging as it
can be influenced by a number of contributing factors including demographic change, the type of programs and competitions being offered, access to and condition of facilities,
and in some cases the success and hence high profile of a state or national professional team (e.g. the Brisbane Heat or Australian Cricket team).

                                                                                                                                             Forecast Change
                                                                                                                                                                             Projected
                                                                                   2017/18            2026
                                              2017/18            2016                                                2026 Forecast             2017/18 – 2026            additional 11 per
Region                                                                           Penetration        Forecast
                                            Participants       Population                                             Participants                                      side team numbers
                                                                                    Rate           Population                                   (Number and                   to 2026
                                                                                                                                                 Percentage)

Brisbane North                                 13,067            867,979            1.51%            938,944              14,178               +1,111/+8.50%                 +101 teams
South East Queensland                           5,809            580,907            1.00%            656,851              6,569                +760/+13.07%                   +69 teams
Gold Coast                                      3,929            562,651            0.70%            621,751              4,352                +432/+10.77%                   +38 teams
Sunshine Coast                                  4,351            347,321            1.25%            382,911              4,786                +435/+10.01%                   +40 teams

Bayside East and Redlands
                                                7,488            450,789            1.66%            478,738              7,947                 +459/+6.13%                   +42 teams
(BEARS)

Metropolitan South West                         6,383            435,008            1.47%            460,612              6,771                 +388/+6.08%                   +35 teams
Darling Downs and South West
                                                6,914            313,817            2.20%            329,587              7,251                 +337/+4.87%                   +31 teams
QLD
Central Queensland                              3,759            253,058            1.49%            271,623              4,047                 +288/+7.67%                   +26 teams
North Queensland                                6,926            274,504            2.52%            295,725              7,452                 +526/+7.60%                   +48 teams
Mackay Whitsunday                               2,976            186,499            1.60%            199,604              3,194                 +218/+7.31%                   +20 teams
Far North Queensland                            3,497            286,654            1.22%            304,677              3,717                 +220/+6.29%                   +20 teams
Wide Bay                                        2,556            293,861            0.87%            309,270              2,691                 +135/+5.27%                   +12 teams
Total                                                                                                                                          +3,260/+7.83%                 +482 teams
Note: The ‘penetration rate’ demand method is used to predict future participation by Community and Club cricket census numbers only, and does not take into account high levels of participation in
other programs or activities currently being delivered by QC (e.g. school programs). Participation in unstructured and/or informal or non-affiliated cricket competitions and events are also not included.
Queensland Cricket Infrastructure Strategy I November 2018                                                                                                                                               22
74% of pitch widths are narrower 80% of pitch lengths are shorter
QUICK FACILITY STATS National average field to population than CA’s recommended pitch than CA’s recommended pitch
provision ratio is approximately width length
699 venues
1103 fields 1: 3,300 20%
26%
333 turf pitch fields 74% 80%
599 synthetic pitch fields
State-wide Region average field to
114 concrete pitch fields
population provision ratio
2.4m+ Less than 2.4m 25m+ Less than 25m
1: 4,687
By 2023, approximately 300 synthetic pitch surfaces
Metropolitan Region average field to across Queensland will require replacement due to
population provision ratio poor condition at an estimated cost of $900,000.
2 Tier 1 Venues
1: 4,908
4 Tier 2 Venues 46%
Over half of cricket
2 Tier 3 Venues Country Region average field to venues across
population provision ratio 27% Queensland provide
less than three
6 Tier 4 / Regional Venues
1: 4,467 training net lanes
17%
(CA’s recommended
Premier Cricket Club 10% level of provision for
12 Primary Venues a ‘Club Home’ level
venue)
Community Club 1 net 2 nets 3 nets 4 or more nets
251 (home ground) venues State-wide
average field to
Community Club
339 player ratio
(satellite ground) venues 27% of current training net facilities present
1: 61
potential safety issues
School ground venues
83 (used for club cricket)
Only 14% of change room facilities audited were
considered to be female friendly
Queensland Cricket Infrastructure Strategy I November 2018 23FACILITIES Field to Population Ratio by Region (2016) The below table provides field to player ratios by QC
Region following the 2017/18 season.
PROVISION Provision Ratio
Region # of Fields 2017/18 Season Field to Player Ratio by Region
(2016)
In 2016, the National Cricket Facility Audit registered
Gold Coast 74 1: 7,603
1,103 playing fields provided across 699 sites that are 2017/18 Field to Player
Far North Queensland 42 1: 6,825 Region
used for club and community cricket (including those Ratio
school sites used for club cricket on MyCricket) across South East Queensland 98 1: 5,928 Gold Coast 1: 53
Queensland, all of which have varying levels of Central Queensland 53 1: 4,775 Far North Queensland 1: 83
infrastructure provision and condition. Of the 1,103 Wide Bay 62 1: 4,740 Central Queensland 1: 71
playing fields, 30.2% provide turf centre pitches, North Queensland 62 1: 4,427 Mackay Whitsunday 1: 60
54.3% synthetic grass pitches, 10.3% concrete pitch Brisbane North 196 1: 4,341 Met South West 1: 60
surface types and the remaining 5.2% of sites
Metropolitan South West 106 1: 4,104 Sunshine Coast 1: 52
provided no pitch surface condition information.
Sunshine Coast 83 1: 4,185 Brisbane North 1: 67
Pitch Surface Type Mackay Whitsunday 50 1: 3,730 North Queensland 1: 112
Bayside East and Redlands 141 1: 3,197 South East Queensland 1: 59
5.2%
Darling Downs and South Bayside East and Redlands 1: 53
10.3% 136 1: 2,307
West QLD
Wide Bay 1: 41
Average 92 1: 4,687
Darling Downs and South
1: 51
Note: National field to population average provision ratio is West QLD
approximately 1: 3,300.
Queensland average 1: 61
30.2% 54.3%
Population data source: Queensland Government population
projections, 2015 edition; Australian Bureau of Statistics
Note: While provision ratios don’t provide an exact science to
calculating suitable levels of provision, they are a widely
Looking purely at facility provision compared with accepted planning tool for forecasting facility requirements
Synthetic overall population can lead to misguided perceptions relating to future population growth.
of over or under supply of facilities within a certain
Turf cricket region or local government area.
Concrete For example, a local area or region with a lower than
average field to population facility provision ratio, does
not necessarily indicate demand for additional cricket
Provision by QC Region field provision.
Based on the below ratios, the 2016 statewide field to Factors such as each local Council’s demographic
population provision ratio was 1: 4,687, with this profile and the volume and format of cricket being
provision level being lower in metropolitan Queensland played within individual regions should be considered
(1:4,908) and higher in country Queensland (1:4,467). when confirming demand for future facility
development and/or increased utilisation of existing
venues.
Queensland Cricket Infrastructure Strategy I November 2018 24Pitch Surface Type by QC Region Sports Field Floodlighting by QC Region
Metropolitan Queensland The majority of facility audit reports do not provide detailed lux level recordings for
those sites with floodlighting. It is assumed a high portion of sites listed below as
Region Turf Synthetic Other Not provided having floodlighting do not meet CA’s recommended minimum lighting provision
Brisbane North 28% 41% 22% 9% levels for Class III / local club competition venues (300 Lux square / 200 Lux outfield).
Bayside East and Metropolitan Queensland
24% 59% 12% 5%
Redlands
South East Floodlit Cricket Fields
45% 45% 7% 3% Region
Queensland
# %
Metropolitan South
31% 60% 6% 3% Brisbane North 25 13%
West
Bayside East and Redlands 16 12%
Gold Coast 28% 66% 6% 0%
South East Queensland 27 28%
Sunshine Coast 35% 55% 10% 0%
Metropolitan South West 18 17%
Average 31% 53% 12% 4%
Gold Coast 12 16%
Sunshine Coast 25 30%
Country Queensland
Average 20.5 19%
Region Turf Synthetic Other Not provided
Wide Bay 36% 47% 11% 6%
Country Queensland
Mackay Whitsunday 26% 56% 14% 4%
North Queensland 29% 57% 14% 0% Floodlit Cricket Fields
Region
Central Queensland 42% 39% 4% 15% # %
Far North Wide Bay 11 18%
29% 64% 7% 0%
Queensland
Mackay Whitsunday 9 18%
Darling Downs and
23% 68% 9% 0% North Queensland 7 11%
South West QLD
Central Queensland 12 23%
Average 29% 57% 11% 3%
Far North Queensland 3 7%
Darling Downs and South West
= under average provision = above average provision 22 16%
QLD
Average 12.8 16%
Queensland Cricket Infrastructure Strategy I November 2018 25STATE-WIDE FACILITY ISSUES
The following facility issues are having the greatest impact on the growth and sustainability of cricket in Queensland, and are being experienced across both
metropolitan and country regions. Addressing these issues through implementation of the QCIS will be required for QC and its partners to ensure future planning
and development provides fit for purpose and flexible facilities.
Sports field floodlighting Practice facilities (design, condition and renewal)
With no daylight saving, Queensland’s hot climate and The standard and quality of practice facilities was
a lack of green open space in inner urban areas to identified as a key issue by clubs and LGAs.
develop more cricket fields, there is a strong desire Approximately 25% of practice facilities were
from cricket stakeholders to be able to schedule more assessed as having potential safety issues (e.g. torn
activities in the evening. Identifying existing sites with synthetic surface creating trip hazard, holes in net
the capacity to introduce or increase lighting levels, fencing) and a high percentage of club practice
and ensuring adequate lighting at new venues will facilities offer less than three nets (CA’s recommended
enable greater flexibility and opportunities for cricket level of provision for a ‘Club Home’ level venue). The
scheduling and competitions. While it is recognised identified seven and a half year average life-span of
lighting is not a requirement (nor feasible) at all practice facility pitch surfaces highlights the need to
venues, increasing the number of floodlit fields and plan for the future replacement and or renewal of
training facilities will enable increased and more Synthetic pitch surface condition and dimensions these facilities within the timeframe of the QCIS.
flexible cricket participation opportunities as well as
The current state-wide average lifespan for centre Turf pitch provision, preparation and maintenance
reduce the impact of extreme heat (seen as a major
deterrent for current and prospective cricketers). wicket synthetic pitch surfaces is six and a half years. Turf pitch provision and management practices are a
QC can use and make available audit information to key consideration for cricket. Consultation with local
Female friendly and inclusive facility design support clubs and LGAs in planning for the clubs, associations and councils raised the challenges
Only 14% of cricket venues audited across replacement of synthetic pitches, ensuring of cost, access to natural resources (in particular
Queensland were assessed as providing suitable participation in the game is not impacted. water) and gaps in knowledge that need addressing in
female friendly change room facilities and supporting Approximately 300 synthetic pitches across the state order to deliver consistently high quality turf wickets.
amenities. will require replacement over the next five years, an
average of 60 surface replacements per year. The The question of where and for who to provide turf
Following the recent growth in female participation in estimated total cost of these pitch surface pitches will need to be collectively addressed by QC
cricket, combined with healthy increases in multi- replacements is $900,000. and the broader cricket community in conjunction with
cultural, indigenous and all abilities player categories, local councils.
a key focus will be to ensure redeveloped, new and The lengthening and widening of existing synthetic
pitches to meet guidelines is also a priority. Ensuring current and future turf/synthetic pitch playing
upgraded/retrofitted cricket facilities are gender
Approximately 75% of existing synthetic pitches do not field provision is strategic, financially sustainable,
inclusive and infrastructure promotes an accessible,
meet guidelines. Providing a pitch of adequate width is supports player pathway and development and
safe and attractive environment.
important for junior development (promotes greater grassroots participation is a key focus area for cricket
enjoyment if juniors are able to land their delivery on across Queensland over the next 10 years.
the pitch) and also encourages spin bowling with
players able to pitch the ball wide on the pitch.
Queensland Cricket Infrastructure Strategy I November 2018 26Utilities Planning, funding and investment
Cricket clubs are significant users of both water and With access to public funding becoming more
electricity. With the costs of accessing and consuming competitive, sporting organisations are required more
these utilities consistently increasing well above than ever to demonstrate their value proposition.
inflation for many years, clubs are struggling to carry
Cricket has renewed its focus on selling the ‘good
the increased financial burden. In some areas, simply
news’ and highlighting the social, economic, physical
getting access to sufficient water to properly service
and cross cultural benefits it delivers. This will need to
turf wickets and outfields has become a long-term
be performed effectively in order to demonstrate the
challenge due to ongoing drought and resultant water
importance of investing in the game and its facilities.
restrictions. Synthetic fields and hybrid wickets –
special synthetic grass wickets with a black soil base – Engagement with clubs identified a lack of strategic
have been identified as potential solutions to some planning and clear direction regarding facility priorities.
water access and cost issues. However, high capital QC is prepared to support clubs in forward planning,
investment required to install synthetic fields is yet to and prioritising the development of strategic plans
be proven as a cost effective investment for cricket. across all levels of club competition. LGAs highlighted
On a positive note, early trials of hybrid wicket a gap in asset management and sustainability Demographic change
technology are showing that use of these wickets as a planning from cricket users, a lack of planned ‘shovel
turf alternative produces significant water savings, ready’ projects to fund, and minimal evidence (data) As the Queensland population changes so to does the
reduces time and effort required in wicket required to influence facility funding decisions. market for cricket. Changes in game formats and
rolling/preparation, and enables increased usage programs, increased access to cricket for girls and
Sharing facilities women and year-wide competitions all play a vital role
rates.
Despite many clubs using facilities on weekends and in determining cricket’s participation markets.
Aging pavilions
weekday evenings for training activities and matches, Queensland is forecast to experience healthy
Aging community infrastructure is a common issue for there still remains significant opportunity for local population growth, with 5.7 million plus population
many sports occupying local government-owned communities to share and use cricket fields. projected by 2031. While population growth across the
facilities. Asset management and facility renewal gap State is not a new phenomenon, cricket needs to
With high demand for community sports infrastructure
funding is one of the biggest issues facing LGAs and understand where key demographic changes are likely
funding, there is and will continue to be an increasing
affects how cricket clubs use facilities. to occur. Whether it’s growth in key suburban areas
need for cricket to work with new partners to share
The National Facilities Audit identified a significant facility use and investment responsibilities. This (which will impact on field provision and need), decline
number of cricket venues with infrastructure that has includes fields, off-field amenities and training facilities in rural areas (which impacts on player numbers and
reached the end of its life and no longer services (both indoor and outdoor). Strong partnerships with club sustainability), or a shift in player numbers from
cricket’s changing needs. A key outcome of the audits co-tenants and winter sporting codes supported via one age group to the next (influencing annual field and
is to share data and assist clubs and LGAs to develop the establishment of joint project development resource allocations), a coordinated approach to future
facility renewal plans that address the issue of aging principles will assist in maximising use of facilities and planning, development and activation of new cricket
infrastructure. ensuring mutual benefits. infrastructure is required to ensure the Queensland
cricket community continues to be well serviced in
A key challenge to sharing is maintaining shorter grass future years.
needed for cricket play, and managing field quality
levels year-round with heavier winter usage.
Queensland Cricket Infrastructure Strategy I November 2018 27Indoor training facilities
Consultation with local clubs and associations
identified a strong need for increased access to indoor
training facilities across the state. Provision of at least
one multi-purpose indoor training facility within each of
QC’s cricket Areas (a combination of two or more
cricket Regions managed by a QC Area Manager)
would enable greater capacity to deliver cricket
pathway programs all year round (e.g. junior
development and high performance programs and
club training) as well as remove a current travel barrier
for cricketers located in more rural parts of the state.
Identifying opportunities for greater use of, and
improved partnerships with, existing indoor cricket
venues for cricket training and/or modified programs
and activities will also increase the financial
sustainability of these centres (via increased
scheduling) and provide an alternative, and equally An under provision of purpose built indoor training facilities across the state has been identified as a key gap in
effective, indoor training option. existing cricket infrastructure by the Queensland cricket community. Improving relationships with existing indoor
cricket centres could be a win-win solution.
Queensland Cricket Infrastructure Strategy I November 2018 28You can also read