Cleaner Cars from Cradle to Grave - How Electric Cars Beat Gasoline Cars on Lifetime Global Warming Emissions - Union of Concerned ...
←
→
Page content transcription
If your browser does not render page correctly, please read the page content below
Cleaner Cars from
Cradle to Grave
How Electric Cars Beat Gasoline Cars on Lifetime
Global Warming Emissions
Cleaner Cars from
Cradle to Grave
How Electric Cars Beat Gasoline Cars on Lifetime
Global Warming Emissions

Rachael Nealer
David Reichmuth
Don Anair

November 2015

© 2015 Union of Concerned Scientists
     All Rights Reserved

     Rachael Nealer is a Kendall Science
     Fellow in the UCS Clean Vehicles Program.
     David Reichmuth is a senior engineer in
     the program. Don Anair is deputy director
     and research director in the program.

     The Union of Concerned Scientists
     puts rigorous, independent science to
     work to solve our planet’s most pressing
     problems. Joining with citizens across the
     country, we combine technical analysis and
     effective advocacy to create innovative,
     practical solutions for a healthy, safe, and
     sustainable future.

     More information about UCS and the
     Clean Vehicles Program is available on the
     UCS website: www.ucsusa.org

     This report is available online (in PDF
     format) at www.ucsusa.org/EVlifecycle.

     Layout:
     Rob Catalano, Catalano Design

     Cover photo: © iStockphoto.com/
     m-imagephotography
     Printed on recycled paper

ii     union of concerned scientists
[ contents ]

 v    Figures, Tables, and Boxes
vii   Acknowledgments

 1    executive summary

 5    introduction

      chapter 1
 6    Global Warming Emissions from Driving Electric Vehicles
 6    Methodology for Comparisons
 7    Rating the Regions
 8    Expanding EV Options and Improving Vehicle Efficiency
 9    An Improving Electricity Grid
10    Regional EV Emissions: Main Findings
12    Beating the Average with Cleaner Electricity
14    The Future of EV Emissions

      chapter 2
16    Global Warming Emissions from Manufacturing Electric Vehicles
16    How the Manufacturing of BEVs Differs from That of Gasoline Cars
17    Choice of Vehicles for Modeling Manufacturing Emissions
20    Estimating Emissions from Vehicle Manufacturing
21    Manufacturing Emissions of Today’s BEVs: Main Findings
23    Future Potential for Reducing BEV Emissions from Manufacturing

      chapter 3
25    How Federal Policies Could Increase the Benefits of Electric Vehicles
25 Limit Power Plant Emissions and Expand Renewable Electricity
		Generation
26    Directly Invest in Battery Technology
27    Facilitate Electric Vehicle Accessibility

                                                     Cleaner Cars from Cradle to Grave   iii
30   References
                                     33   Appendix A: Operation Emissions Modeling
                                     37   Appendix B: Manufacturing Emissions Modeling
                                     41   Appendix C: Disposal, Recycling, and Reuse
                                     42Appendix D: Average vs. Marginal Electricity Global Warming
                                     		Emissions

iv   union of concerned scientists
[ figures, tables, and boxes ]

		figures
 2 Figure ES-1. Electric Vehicle Global Warming Pollution Ratings and Gasoline
		 Vehicle Emissions Equivalents by Electricity Grid Region
 3 Figure ES-2. Life Cycle Global Warming Emissions from the Manufacturing and
		 Operation of Gasoline and Battery-Electric Vehicles
 9 Figure 1. Percent of Electric Vehicle Sales by Make and Model for Model
		 Year 2014
11   Figure 2. Percent U.S. Electricity Generation by Fuel Type for 2009 and 2012
12 Figure 3. Electric Vehicle Global Warming Pollution Ratings and Gasoline
		 Vehicle Emissions Equivalents by Electricity Grid Region for 2012
13 Figure 4. Electric Vehicle Global Warming Pollution Ratings and Gasoline
		 Vehicle Emissions Equivalents by Electricity Grid Region for 2009
14   Figure 5. Electric Vehicle Global Warming Emissions Ratings by Population
17   Figure 6. Drivetrain Components of Battery-Electric Vehicles
21 Figure 7. Life Cycle Global Warming Emissions from the Manufacturing and
		 Operation of Gasoline and Battery-Electric Vehicles
26 Figure 8. Life Cycle Global Warming Emissions for a Midsize BEV for Three
		 Different Electricity Grid Mixes
27 Figure 9. State Renewable Electricity Standards (Including the District
		 of Columbia)
40 Figure B-1. Life Cycle Global Warming Emissions from the Manufacturing and
		 Operation of Gasoline and Battery-Electric Vehicles with More Than One
		 Battery Replacement

		tables
 7 Table 1. Well-to-Wheels BEV Miles-per-Gallon Equivalent (MPGghg) by
		 Electricity Source
 8   Table 2. Global Warming Emissions Rating Scale for Electric Vehicles
10   Table 3. Electric Vehicle Efficiency Ratings
18   Table 4. Midsize Battery-Electric and Gasoline Vehicle Characteristics
18   Table 5. Full-size Battery-Electric and Gasoline Vehicle Characteristics

                                                        Cleaner Cars from Cradle to Grave   v
34   Table A-1. Mix of Generation Sources for Each Grid Region in 2012
                                     36   Table A-2. Emissions Intensity from Electricity Generation by Region in 2012
                                     37   Table B-1. Midsize Gasoline Vehicles Comparable with the Nissan LEAF
                                     38   Table B-2. Full-size Gasoline Vehicles Comparable with the Tesla Model S
                                     38   Table B-3. Composition of Vehicles Modeled by Material Type
                                     39   Table B-4. Lithium-ion Battery Specifications for Midsize and Full-size BEVs
                                     39 Table B-5. Global Warming Emissions Changes Based on Battery Chemistry
                                     		 for 28 kWh Battery
                                     40   Table B-6. First 15 Years of Vehicle Lifetime in Annual Mileage
                                     41   Table C-1. Recycling Rates of Metals for All Vehicles Modeled

                                     		boxes
                                     20   Box 1. Disposal Considerations
                                     23   Box 2. Manufacturers Are Making Greener Choices

vi   union of concerned scientists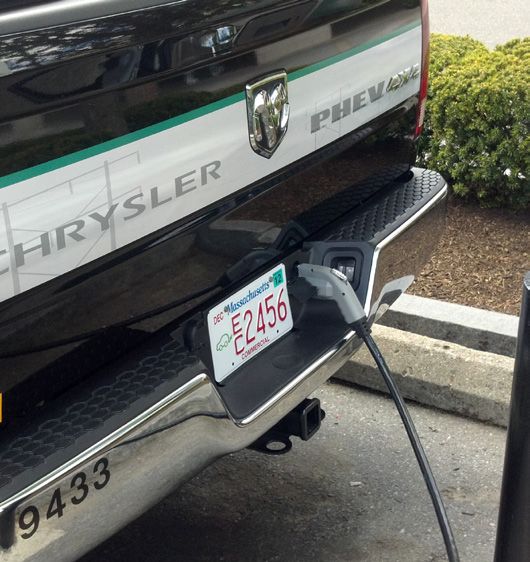
[ acknowledgments ]

This report was made possible by the generous support of the estate of the late
Henry Kendall and the Kendall Science Fellowship program, the William and Flora
Hewlett Foundation, the 11th Hour Project (a program of The Schmidt Family
Foundation), and the Energy Foundation.
     The authors thank the following people for their help in providing information
or for reviewing this report:
     Marcus Alexander (Electric Power Research Institute)
     Travis Johnson (U.S. Environmental Protection Agency)
     Jarod Kelly (Argonne National Laboratory)
     Nic Lutsey (International Council on Clean Transportation)
     Jeremy Michalek (Carnegie Mellon University)
     Nick Nigro (Atlas Public Policy)
     Julia Sohnen (BMW of North America)
     Ken Srebnik (Nissan North America)
     Luke Tonachel (Natural Resources Defense Council)
     Marzia Traverso (BMW of North America)
     Thomas Turrentine (University of California–Davis)
     Russell Vare (Nissan North America)
     Jacob Ward (U.S. Department of Energy)
     and other individuals who wish to remain anonymous
     The authors also thank many of their colleagues at the Union of Concerned
Scientists, including Jeff Deyette, Jimmy Nelson, and members of the Clean
Vehicles Program for their thoughtful input and advice. Special thanks go to
Bryan Wadsworth, Cynthia DeRocco, Heather Tuttle, Rob Catalano, and Steven
Marcus for their roles in the report’s editing and production.
     Organizational affiliations are listed for identification purposes only. The
opinions expressed herein do not necessary reflect those of the organizations
that funded the work or the individuals who reviewed it. The Union of
Concerned Scientists bears sole responsibility for the report’s contents.

                                                   Cleaner Cars from Cradle to Grave   vii
viii union of concerned scientists
[ executive summary ]

Electric vehicles (EVs) are a critical part of the
American transportation future given their potential
to dramatically cut global warming emissions—
especially when charged by a clean electricity grid.

Together with other oil-saving approaches, such as more           •   EVs are now driving cleaner than ever before. Driving
efficient vehicles and advanced biofuels, EVs can help cut            an average EV results in lower global warming emissions
projected U.S. oil use in half over the next 20 years. EVs            than driving a gasoline car that gets 50 miles per gallon
will also be essential to achieving the deep emissions reduc-         (MPG) in regions covering two-thirds of the U.S. popula-
tions by mid-century needed to avoid the worst impacts of             tion, up from 45 percent in our 2012 report. Based on
climate change.                                                       where EVs are being sold in the United States today, the
     This report compares battery-electric vehicles (BEVs)            average EV produces global warming emissions equal to a
with similar gasoline vehicles by examining their global              gasoline vehicle with a 68 MPG fuel economy rating.
warming emissions over their “life cycles”—from the raw ma-
                                                                  •   EVs will become even cleaner as more electricity is
terials to make the car through manufacturing, driving, and
                                                                      generated by renewable sources of energy. In a grid
disposal or recycling. Toward that end, we performed up-to-
                                                                      composed of 80 percent renewable electricity, manufactur-
date assessments of the carbon footprints of BEVs, taking into
                                                                      ing a BEV will result in an over 25 percent reduction in
account the latest information about electricity generation
                                                                      emissions from manufacturing and an 84 percent reduc-
and BEV models. The two BEVs we modeled, midsize and
                                                                      tion in emissions from driving—for an overall reduction of
full-size, are not specific to any particular manufacturer but
                                                                      more than 60 percent (compared with a BEV manufac-
are based on the two most popular BEV models sold in the
                                                                      tured and driven today).
United States today: the Nissan LEAF and the Tesla Model S.
Our analysis reflects the BEVs available to American consum-
ers and comparable gasoline vehicles.
                                                                  Global Warming Emissions from Driving
     Our analysis revealed that:
                                                                  Electric Vehicles
•      From cradle to grave, BEVs are cleaner. On average,
       BEVs representative of those sold today produce less       Although a BEV has no tailpipe emissions, the total global
       than half the global warming emissions of comparable       warming emissions from operating it are not insignificant;
       gasoline-powered vehicles, even when the higher emis-      they depend on the sources of the electricity that charge the
       sions associated with BEV manufacturing are taken into     vehicle’s batteries and on the efficiency of the vehicle. We
       consideration. Based on modeling of the two most popu-     estimated the global warming emissions from electricity
       lar BEVs available today and the regions where they are    consumption in the 26 “grid regions” of the United States
       currently being sold, excess manufacturing emissions are   (see Figure ES-1, p. 2)—representing the group of power
       offset within 6 to 16 months of average driving.           plants that together serve as each region’s primary source of

© Rachael Nealer                                                                                Cleaner Cars from Cradle to Grave   1
FIGURE ES-1. Electric Vehicle Global Warming Pollution Ratings and Gasoline Vehicle Emissions Equivalents by
Electricity Grid Region
NEWE
86 MPG
MROE
40 MPG NYUP
RFCM 135 MPG
38 MPG
MROW
NWPP 43 MPG NYCW
94 MPG 79 MPG
RFCW NYLI
44 MPG 47 MPG
RMPA SRMW
CAMX 35 MPG SPNO 36 MPG RFCE
87 MPG 35 MPG 68 MPG
SRTV
45 MPG SRVC
SPSO 63 MPG
AZNM 39 MPG
53 MPG SRMV
55 MPG SRSO
51 MPG
ERCT
52 MPG Good (31–40 MPG)
AKMS Better (41–50 MPG)
112 MPG
HIOA Best (51+ MPG)
FRCC
36 MPG 51 MPG
AKGD HIMS
45 MPG 46 MPG U.S. average (EV sales-weighted): 68 MPG
Note: The MPG (miles per gallon) value listed for each region is the combined city/highway fuel economy rating of a gasoline vehicle that would have global
warming emissions equivalent to driving an EV. Regional global warming emissions ratings are based on 2012 power plant data in the EPA’s eGRID 2015 database
(the most recent version). Comparisons include gasoline and electricity fuel production emissions. The 68 MPG U.S. average is a sales-weighted average based on
where EVs were sold in 2014.
SOURCE: EPA 2015C; IHS 2015.
electricity—and we rated each region based on how charging calculations that weighted where EVs were sold in 2014, driving
and using an EV there compares with driving a gasoline ve- an EV in the United States produced global warming emissions
hicle. We also estimated, based on recent sales data, the aver- equal to a gasoline vehicle with 68 MPG during operation.
age efficiency of new EVs (battery-electric and plug-in Emissions from operating electric vehicles are likely to
electric vehicles combined) sold in the United States in 2015. keep falling, as national data from 2013 to 2015 show a declining
We found that: (1) driving the average electric vehicle percentage of electricity generated by coal power and an in-
in any region of the country produces lower global warming crease in renewable resources such as wind and solar. Addition-
emissions than the average new gasoline car achieving 29 MPG; ally, the Clean Power Plan finalized by the U.S. Environmental
(2) our ratings in 20 out of 26 regions have improved since our Protection Agency (EPA) in 2015 offers opportunities for even
2012 report; and (3) about 66 percent of Americans—up from greater progress, as states must collectively cut their 2005 pow-
45 percent just three years ago—live in regions where power- er-sector carbon emissions 32 percent by 2030. Meanwhile,
ing an EV on the regional electricity grid produces lower global many EV owners are pairing electric vehicle purchases with
warming emissions than a 50 MPG gasoline car. home investments in solar energy. With increasing levels of re-
Comparisons between electric vehicles and gasoline cars newable electricity coming onto the grid, with carbon stan-
look even more attractive when one considers that many EVs dards for fossil-fuel power plants beginning to be implemented,
are currently being sold and driven in areas where the electric- and with continued improvements in vehicle technologies, the
ity grid is cleaner than the U.S. mean. As a result, based on emissions-reduction benefits of EVs will continue to grow.
2 union of concerned scientistsGlobal Warming Emissions from
Manufacturing Battery-Electric Vehicles
The extra emissions
Global warming emissions occur when manufacturing any
associated with BEV
vehicle, regardless of its power source, but BEV production manufacturing can be
results in higher emissions than the making of gasoline cars—
mostly due to the materials and fabrication of the BEV lithi-
rapidly offset by reduced
um-ion battery. Under the average U.S. electricity grid mix, we emissions from driving.
found that producing a midsize, midrange (84 miles per
charge) BEV typically adds a little over 1 ton of emissions to
the total manufacturing emissions, resulting in 15 percent In other words, the extra emissions associated with elec-
greater emissions than in manufacturing a similar gasoline tric vehicle production are rapidly negated by reduced emis-
vehicle. However, replacing gasoline use with electricity re- sions from driving. Comparing an average midsize midrange
duces overall emissions by 51 percent over the life of the car. BEV with an average midsize gasoline-powered car, it takes
A full-size long-range (265 miles per charge) BEV, with just 4,900 miles of driving to “pay back”—i.e., offset—the extra
its larger battery, adds about six tons of emissions, which in- global warming emissions from producing the BEV. Similarly,
creases manufacturing emissions by 68 percent over the gaso- it takes 19,000 miles with the full-size long-range BEV com-
line version. But this electric vehicle results in 53 percent pared with a similar gasoline car. Based on typical usages of
lower overall emissions compared with a similar gasoline these vehicles, this amounts to about six months’ driving for
vehicle (see Figure ES-2). the midsize midrange BEV and 16 months for the full-size
long-range BEV.
FIGURE ES-2. Life Cycle Global Warming Emissions Meanwhile, the global warming emissions of manufac-
from the Manufacturing and Operation of Gasoline and turing BEVs are falling as automakers gain experience and
Battery-Electric Vehicles improve production efficiency. With a focus on clean manu-
facturing, emissions could fall even more. There are many
ways in which the EV industry might reduce these manufac-
Life Cycle Global Warming Emissions
600 turing-related emissions, including:
• Advances in manufacturing efficiency and in the
500
(grams of CO2e per mile)
recycling or reuse of lithium-ion batteries;
53%
400 reduction • The use of alternative battery chemistries that require
51%
less energy-intensive materials; and
reduction
300
• The use of renewable energy to power manufacturers’
200
and suppliers’ facilities.
100
Recommendations
0
To accelerate the U.S. transition to a low-carbon future, we
Midsize Midsize Full-size Full-size
Gasoline 84-mile Gasoline 265-mile recommend the following:
Car BEV Car BEV
• Under the EPA’s Clean Power Plan, states should develop
and implement strong compliance plans that prioritize
Battery Manufacturing Operation
renewable energy and energy efficiency in meeting their
Vehicle Manufacturing
emissions-reduction targets.
Note: We assume that the midsize vehicles are driven 135,000 miles over their • Policy makers at all levels of government should adopt
lifetimes and the full-size vehicles 179,000 miles. The difference in the two
mileages derives from the dissimilar uses of 84-mile-range and 265-mile-range new or strengthened policies and programs for increasing
battery-electric cars, as described in Chapter 2. We further assume that a energy efficiency and the deployment of renewable energy.
consumer buying a BEV would drive it the same total of miles as a
corresponding gasoline vehicle. We use U.S. average electricity grid emissions These options include renewable electricity standards,
to estimate manufacturing emissions, while the average electricity grid
emissions intensity during vehicle operation are based on a sales-weighted energy-efficiency resource standards, carbon-pricing
average of where EVs are being sold today.
mechanisms, tax incentives and other financial incentives,
Cleaner Cars from Cradle to Grave 3and improvements in grid operation, transmission, and
resource planning.
To reach their full
• Government and the private sector should support more potential, EVs must
research aimed at decreasing the global warming emis-
sions associated with making electric vehicles’ batteries,
account for a larger share
increasing the efficiency of their operation, and improv- of vehicle sales while
the electricity grid shifts
ing the processes for battery recycling or reuse. By sup-
porting this emerging sector, we can help encourage
manufacturers not only to reduce manufacturing emis-
sions but also to lower the batteries’ costs.
from coal to low-carbon
• To increase the benefits of electric vehicles—especially
renewable sources.
those in regions where global warming emissions from
electricity generation are higher than the U.S. average—
policies should support consumers who consider invest- Electric vehicles provide benefits both in carbon emis-
ing in cleaner sources of electricity, such as by installing sions and oil savings, with the greatest emissions benefits oc-
rooftop solar photovoltaic systems or purchasing renew- curring in regions with the lowest-carbon electricity sources.
able energy credits. To reach their full potential, EVs must account for a larger
• Electric vehicle makers and their suppliers should raise the share of vehicle sales while the electricity grid shifts from
percentage of renewable electricity they use to build these coal to low-carbon renewable sources. Moving forward with
cars. The Union of Concerned Scientists estimates that, both of these transitions constitutes a critical strategy for cut-
with a future 80 percent renewable electricity grid, manu- ting projected oil use in half over the next 20 years and put-
facturing emissions alone could decrease by more than ting the United States on a trajectory toward net-zero climate
25 percent compared with manufacturing BEVs today. emissions by mid-century.
4 union of concerned scientists[ introduction ]
Electric vehicles (EVs) are becoming a critical part of the (see Figure 7, p. 21). Toward that end, we performed up-to-
American transportation future because they can dramati- date assessments of the carbon footprints of BEVs, taking into
cally cut global warming emissions, especially when charged account the latest information about electricity generation
by a clean-electricity grid. Together with other oil-saving ap- and BEV models.
proaches—such as more efficient vehicles and advanced bio- We proceeded by addressing the following two key ques-
fuels— EVs can help achieve the goal, advocated by the Union tions, whose successive answers gave rise to Chapters 1 and 2:
of Concerned Scientists (UCS) and others, that the United 1) What are the global warming emissions from operat-
States cut projected oil use in half over the next 20 years. EVs ing an electric vehicle today? We updated our previous
will also be an essential part of any plan for proposed deep State of Charge emissions analysis from 2012, using the
emissions reductions for avoiding the worst impacts of cli- latest available information on regional electricity grid
mate change (UCS 2012). emissions and current EV models. We thus derived
But EVs are not global warming emissions–free. They new estimates of the miles-per-gallon rating a gasoline-
produce emissions, for example, during generation of the elec- powered vehicle would need in order to equal the
tricity required to charge the vehicles. The 2012 UCS report emissions of a comparable EV charged on the regional
State of Charge examined the global warming emissions from electricity grid.
operating an EV in different areas of the United States, and the
authors found that in every region, driving the average EV 2) How much does the manufacturing of BEVs affect
produced lower global warming emissions than driving the their total global warming emissions benefits? Broad-
average new gasoline car (Anair and Mahmassani 2012). ening the scope from UCS’s previous analysis, we exam-
Since State of Charge was published, those EV-related emis- ined the impact of BEV manufacturing on the vehicles’
sions have become even lower in many parts of the country. global warming emissions. We used the Argonne Nation-
Electricity generation has been getting cleaner—coal-fired gen- al Laboratory’s vehicle manufacturing emissions model
eration has declined while lower-carbon alternatives have in- to analyze two composite vehicles representing midsize
creased—and electric vehicles are becoming more efficient. For and full-size BEVs. These composites were similar, re-
example, the Nissan LEAF—the most popular battery-electric spectively, to the two best-selling BEVs in the United
vehicle (BEV),1 powered completely by electricity—now has States: the Nissan LEAF (an 84-mile-range car) and the
greater efficiency than before, and other even more efficient Tesla Model S (a 265-mile-range car).2 We then com-
BEV models, such as the BMW i3, have come to market. pared our results with the global warming emissions
However, global warming emissions from driving an EV from the manufacturing of like gasoline cars.
are not the full story. We must be attentive to the “bottom This report also discusses the global warming emissions
line”—the vehicle’s overall global warming emissions during its consequences of what may be done with the BEV after it has
life cycle—which takes into account its operation, production, finished its useful life. The disassembly of the vehicle, the re-
and disposal. The manufacture of EV batteries, for example, is cycling of its parts, and the disposal of its battery are briefly
of particular concern regarding global warming emissions. addressed in Chapter 2. Despite our conservative estimates of
This report compares battery-electric cars with similar the global warming emissions from these end-of-life process-
gasoline cars by examining their global warming emissions, es, they account for only a small fraction of the life cycle to-
both from driving and manufacturing, over their lifetimes tals for BEVs—and for gasoline cars.
1 In this report, EVs refer both to plug-in hybrid vehicles (such as the Chevrolet Volt) and battery-electric vehicles such as the Nissan LEAF, while BEVs refer specifically
to battery-electric vehicles.
2 The Tesla Model S has numerous configurations; for our analysis, we used a rear-wheel-drive model with a battery rated at 85 kilowatt-hours (kWh).
Cleaner Cars from Cradle to Grave 5[ chapter 1 ]
Global Warming Emissions from
Driving Electric Vehicles
A vehicle’s largest contribution of global warming emissions of the country, the most effective vehicle for reducing global
comes from its fuel consumption. In the case of gasoline ve- warming emissions today.
hicles, these emissions are the result of burning gasoline in In the next two sections of this chapter, we describe the
the engine—and also of producing that fuel in the first place. methodologies for determining EV global warming emissions
With electric vehicles, which have little to no global warming by region. In the three sections that follow, we deepen our
emissions at the tailpipe during operation, these emissions discussion of the two kinds of major changes cited above. We
are produced indirectly—from generating the electricity used then specify what individual EV owners might do to “beat the
to charge the vehicles’ batteries and from producing the fuels average,” and in the final section we build on the chapter’s
to enable that electricity’s generation. overall content to provide a look into the future.
In comparing electric and gasoline vehicles in 2012, our
State of Charge report found that in every region of the Unit-
ed States, EVs produced lower global warming emissions than The efficiencies of EVs
the average compact gasoline vehicle. However, because the
sources of electricity varied across the country, some electric
have improved, the number
vehicles were cleaner in some regions than in others (Anair of available models has
and Mahmassani 2012).
Over the three years since State of Charge was published, widened, and lower-carbon
two major changes have occurred:
electricity sources are now
1) The efficiencies of EVs have improved, while the number
of available models has widened. For example, the most used more often.
popular BEV, the Nissan LEAF, and the most popular
plug-in hybrid electric vehicle, the Chevrolet Volt, have
undergone improvements to increase their efficiencies; Methodology for Comparisons
and the most lightweight and efficient BEV so far, the
BMW i3, has come to market. In comparing EVs’ global warming emissions with gasoline
vehicles’ emissions, we take a “well-to-wheels” approach that
2) The way we produce electricity across the country has been accounts for the full fuel cycle for both types of vehicles.
evolving. Coal use in power plants has declined, and lower- To assess the global warming emissions from charging
carbon sources of electricity have been used more often. electric vehicles, we address all contributions from electricity
These changes have lowered the global warming emis- production. This includes: (1) emissions that result from ex-
sions of operating an electric vehicle, making it, in more parts tracting raw materials, such as coal mining or natural gas
6 union of concerned scientistsdrilling, and from delivering these resources to the power
plants; (2) emissions from burning the fuel in the power plant TABLE 1.Well-to-Wheels BEV Miles-per-Gallon
to generate electricity; (3) electricity losses that occur during Equivalent (MPGghg) by Electricity Source
distribution from the power plant to the point where the elec-
tric vehicle is plugged in; and (4) the efficiency of the vehicle Gasoline Vehicle
in using electricity. Emissions % Reduction
Electricity Equivalent from Average
To assess the global warming emissions from a compa- Source1 (MPGghg)2,3 New 2014 Car4
rable gasoline vehicle, we address emissions that result from:
Oil 29 0%
(1) oil extraction at the well; (2) transporting the crude oil to a
Coal 29 1%
refinery; (3) refining the oil into gasoline; (4) delivering the
fuel to the gas station; and (5) combusting the fuel in the en- Natural gas 58 51%
gine of the vehicle. Geothermal 310 91%
STANDARDIZING THE UNITS OF COMPARISON: MPGGHG Solar 350 92%
Nuclear 2,300 99%
Most drivers are familiar with the concept of miles per gallon
(MPG), the number of miles a car travels on a gallon of gaso- Wind 2,500 99%
line. The greater its MPG, the less fuel burned and the lower Hydro 5,100 99%
the car’s global warming emissions. But how can such emis- Notes:
sions be figured for electric vehicles, which don’t use gaso- (1) Represents electricity available at the wall outlet and includes emissions
from power plant feedstocks (e.g., coal mining) and power plant combustion.
line? One way is by determining how many miles per gallon a Power plant construction emissions are also included; they are the only emis-
sions associated with solar, wind, geothermal, and hydro sources.
gasoline-powered vehicle would need to achieve in order to
(2) Gasoline vehicle emissions equivalents account for oil extraction and refin-
match the global warming emissions of driving an EV. ing of crude oil, but not refinery construction.
(3) Average new car (excluding truck) fuel economy for model year 2014 is
The first step in this process is to calculate the global 28.7 MPG. Sources: EPA 2014; ANL 2014A.
warming emissions that result from generating the electricity (4) To calculate the MPGghg estimate, we use the 2014 average sales-weighted
efficiency of 0.33 kWh/mile, regarding both plug-in hybrid and battery-electric
needed to charge a vehicle. Then we convert this estimate into vehicles (see Table 3, p. 10).
a gasoline miles-per-gallon equivalent—designated MPGghg,
where ghg stands for greenhouse gas emissions. If an electric
electricity demand on the grid. While the use of the marginal
vehicle has an MPGghg value equal to the MPG of a gasoline-
generation mix for electric vehicles is important for evaluating
powered vehicle, both vehicles will produce the same amount
EV global warming emissions at a particular time, average
of global warming emissions for each mile traveled.
generation provides more practical emissions information to
For example, if one were to charge a typical midsize BEV
consumers regarding a vehicle they might purchase and oper-
using electricity generated by coal-fired power plants, that
ate today. Note that no region gets electricity solely from one
BEV would have an MPGghg of 29. In other words, the global
source, but rather from a mix of the electricity generation fu-
warming emissions from driving it would be equivalent to the
els listed in Table 1. Further discussion on this issue is pro-
emissions from operating, and producing the fuel for, a gaso-
vided in Appendix D.
line vehicle with a 29 MPG fuel economy rating over the same
distance (see Table 1).3 Under this equivalency, the cleaner an
Rating the Regions
electricity generation source, the higher the MPGghg. When
charging a BEV from sources such as wind or solar, for ex- To further help consumers evaluate the global warming ben-
ample, the MPG equivalent is in the hundreds (or thousands) efits of electric vehicles in comparison with gasoline vehicles,
because these options produce no global warming emissions we developed ratings in our State of Charge report—Good,
when generating electricity. Better, and Best—to characterize the country’s different re-
Finally, when estimating emissions from charging an gions (see Table 2, p. 8).
electric vehicle, we use regional average emissions (averaged
GOOD
over the full mix of a region’s electricity sources). An
alternative approach is to consider only marginal emissions: In regions rated Good, EVs are similar to the best convention-
emissions from the power plants that operate to meet new al gasoline vehicles and some hybrids (31 to 40 MPGghg). That
3 Note that MPG values in this report refer to combined city/highway operation estimates and that U.S. EPA window-label values should be used as the basis of com-
parison between specific vehicle models.
Cleaner Cars from Cradle to Grave 7BETTER
EVs rated Better correspond to the most efficient hybrids
(41 to 50 MPGghg). The most efficient gasoline hybrids, such as
the Honda Insight and the Toyota Prius, are in this category,
though the model year 2016 Toyota Prius is expected to ex-
ceed 50 MPG (Voelcker 2015).
BEST
Driving a typical EV in these regions is equivalent to gasoline-
powered vehicles with a combined city/highway fuel econo-
my of more than 50 MPGghg. While the most efficient gasoline
Massachusetts Office of Energy and Environmental Affairs
hybrids are approaching this level of efficiency, electric ve-
hicles can go well above—even exceeding 100 MPGghg. EVs are
the best choice in these regions for reducing global warming
emissions and cutting oil use.
Expanding EV Options and Improving
Vehicle Efficiency
Since 2010, when the Chevrolet Volt (a plug-in hybrid
[PHEV] powered by batteries and a conventional gasoline
EVs are appealing not only to individual consumers but also to state and local
governments. By generating lower global warming emissions, these vehicles engine) and the Nissan LEAF (a BEV) came to market, auto-
(such as the plug-in hybrid truck above, tested by Massachusetts’ public transit makers—spurred by government policy and consumer de-
agency) are an important tool in city and state efforts to meet emissions-
reduction targets. mand—have commercially introduced new and updated EV
models. At this writing (in November 2015), consumers may
is, driving a typical electric vehicle in these regions will result choose from among 21 different kinds, offered mostly in Cali-
in global warming emissions equivalent to gasoline vehicles fornia (see Figure 1).
with a combined city/highway fuel economy rating of 31 to Electric vehicles vary in how far they can go on a kilo-
40 MPG. This level is better than that of the average new watt-hour (kWh) of electricity. For example, the 2014 Nissan
gasoline car (29 MPG) on the market today (EPA 2014). LEAF is estimated to consume 0.30 kWh of electricity per
TABLE 2. Global Warming Emissions Rating Scalen for Electric Vehicles
EV Regional Global
Warming Emissions Rating Good Better Best
EV Global Warming
Emissions Equivalent 31–40 41–50 51+
(MPGghg)1
What Does It Mean EVs have emissions comparable EVs have emissions comparable EVs outperform the most
Regarding EV Global with the most efficient non- with the most efficient 2015 efficient 2015 gasoline hybrid
Warming Emissions? hybrid gasoline models available gasoline hybrid models available models available today
Examples of Model Year Honda Fit (36 MPG) Toyota Prius (50 MPG) No gasoline or diesel
2015 Gasoline and Hybrid Ford Focus SFE (36 MPG) Honda Accord Hybrid (47 MPG) comparisons in model
Vehicles2 Chevrolet Cruze Eco (33 MPG) Volkswagen Jetta Hybrid year 2015
(42 MPG)
Notes:
(1) Assumes 10,881 grams of global warming pollution per gallon of gasoline and average EV efficiency of 0.333 kWh/mile.
(2) Model year 2015 combined city/highway fuel economy window-label value. Data from the 2015 Fuel Economy Guide are available at EPA 2015a. All vehicles
given as examples are classified by the EPA as midsize or smaller.
8 union of concerned scientistsmile traveled, while the BMW i3 consumes 0.27 kWh/mile
and the Tesla Model S consumes 0.38 kWh/mile (DOE FIGURE 1.Percent of Electric Vehicle Sales by Make and
2015a).4 Each vehicle’s design and capabilities determine its Model for Model Year 2014
energy efficiency, as is the case for gasoline vehicles. For ex-
ample, the Tesla is a full-size BEV with substantial battery
capacity, which allows to it go farther on a single charge. Such
features also add to its weight, causing the Tesla to use more 14.1%
electricity than a smaller, lighter-weight, shorter-range elec- 24.5%
5.0%
tric vehicle in going the same distance. Even for vehicles of
similar size (or footprint), changes in design can affect vehicle
6.9%
efficiency. The BMW i3, for example, is similar in size to the
Nissan LEAF but has greater efficiency, due in part to a car-
bon-fiber body that helps reduce its overall weight. 9.4% 15.3%
Since our State of Charge analysis in 2012, efficiency has
also improved in existing models such the Chevrolet Volt and 10.8%
Nissan LEAF. The 2014 LEAF, for example, represented a 14.1%
12 percent improvement in efficiency compared with the
2011 LEAF, a result of vehicle upgrades that included better
regenerative braking, improved aerodynamics, and a more
efficient heater. The Chevrolet Volt also improved its electric- EV Make and Model
drive efficiency between model years 2011 and 2014, and the
Nissan LEAF Ford Fusion Energi
new redesigned 2016 model boasts even better performance.
See Table 3 (p. 10) for a list of the top-selling EVs and their Chevrolet Volt Ford C-Max Energi
energy efficiencies. Tesla Model S BMW i3
Also since our 2012 report, the combination of recent Toyota Prius PHEV Other
model introductions and upgrades to existing models has af-
fected the overall efficiency of the full electric vehicle fleet.
Given the few models available at the time, the efficiency of Note: “Other” includes EVs produced by BMW, Cadillac, Chevrolet, Fiat, Ford,
Honda, Kia, Mercedes, Mitsubishi, Porsche, Toyota, Smart, and Volkswagen.
the 2011 Nissan LEAF—0.34 kWh/mile—was chosen as repre- SOURCE: INSIDEEVS 2015.
sentative of EV efficiency. However, there are now sufficient
sales of EVs to use an average EV efficiency; based on sales
data for the 2014 calendar year, that average efficiency is now Sustained lower natural gas prices have led to a declining
0.33 kWh/mile—a 3 percent improvement from the efficiency share of coal-fired power (one of the highest-polluting sourc-
of the 2011 LEAF. The improvement in overall EV efficiency es of electricity) and a rising share of electricity generated
means that electric vehicles are on average going farther on from natural gas. The deployment of renewable energy sourc-
a kilowatt-hour of electricity, resulting in lower emissions es, such as solar and wind, have also contributed to the elec-
per mile. tricity grid’s improvements.
Figure 2 (p. 11) shows how the primary sources of U.S.
An Improving Electricity Grid electricity generation have changed between 2009 (the year
on which our previous estimates of EV global warming emis-
The sources of energy used to generate electricity in the sions were based) and 2012 (the most recent year for which
United States have been changing, with a consequent reduc- data are available, at this writing, from the EPA’s eGRID data-
tion in “emissions intensity”—the average global warming base 5). Coal power remains the predominant source of elec-
emissions emitted from producing a given amount of electricity. tricity in the United States. However, the last several years
4 The Nissan LEAF has a 24 kWh battery, the BMW i3 has a 22 kWh battery, and the Tesla Model S has a 85 kWh battery. Note the Tesla Model S is available in
more battery sizes.
5 The EPA periodically publishes the Emissions & Generation Resource Integrated Database (eGRID) of power plant electricity generation and emissions for
26 electricity grid regions around the country (EPA 2015C). These data are the basis for our regional emissions analysis of electric vehicles for 2009 and 2012 in
Figure 3 (p. 12) and Figure 4 (p. 13).
Cleaner Cars from Cradle to Grave 9TABLE 3. Electric Vehicle Efficiency Ratings
Tesla Model Tesla Model Nissan 2014 Sales-
S (265-mile S (208-mile Chevrolet LEAF (84- Plug-in Weighted Average
2014 Models range) range) Volt mile range) Prius of All EVs
EV Type BEV BEV PHEV BEV PHEV BEVs and PHEVs
Electric Efficiency
0.38 0.35 0.35 0.30 0.29 0.33
(kWh/mile)
Notes: The plug-in Prius uses a small amount of gasoline when operating from battery power (charge depleting mode). The efficiency numbers here represent
only the electricity consumed per mile.
SOURCE: DOE 2015A; IHS 2015.
have seen a substantial shift toward other sources of electric- generation for that region, affecting in turn the estimates of
ity, including natural gas and renewables. The share of coal in global warming emissions from electric vehicles being operated
powering the nation’s electricity grid dropped from 44 percent in that region. These changes are discussed next.
in 2009 to 37 percent in 2012. Natural gas increased by a simi-
lar amount, producing 30 percent of the nation’s electricity in Regional EV Emissions: Main Findings
2012, up from 23 percent in 2009. Non-hydro renewable elec-
tricity (biomass, wind, and large-scale solar), while still a Using the most recently available regional emissions data, we
small portion of the national grid mix, increased significantly, find that electric vehicles are not only getting cleaner but also
surpassing 5 percent of utility-level electricity generation. becoming the best choice for more Americans aiming to help
These figures represent the average change across the cut global warming emissions and slash oil consumption.
26 electricity grid regions of the United States. Changes in the Figure 3 (p. 12) shows, for each U.S. electricity grid region,
grid mix of each region affect the emissions from electricity the fuel economy rating that a gasoline vehicle would need in
© iStockphoto.com/joel-t
On average, battery-electric vehicles produce less than half the global warming emissions of comparable gasoline-powered vehicles; these emissions savings increase
in regions of the country that get more of their electricity from renewable resources.
10 union of concerned scientistsFIGURE 2. Percent U.S. Electricity Generation by Fuel Type for 2009 and 2012
Other
Petroleum
2009
Non-hydro 2012
Renewables
Hydro
Nuclear
Natural Gas
Coal
0% 5% 10% 15% 20% 25% 30% 35% 40% 45% 50%
Note: Non-hydro renewables include wind, solar, and geothermal electricity generation.
SOURCES: EPA 2015C; EPA 2012A.
order to achieve the same global warming emissions as the
average EV. The numbers of Figure 3 are based on 2012 power Emissions from charging
plant emissions data. For comparison, Figure 4 (p. 13) shows
the updated figures using power plant emissions from 2009.
an electric vehicle on the
Given these updated circumstances, our main findings grid have improved in 76
are as follows:
As a result of a cleaner electricity grid and improved
percent of the regions over
efficiency of electric vehicles, emissions from charging an the past three years.
electric vehicle on the grid have improved in 76 percent
of the regions over the past three years. Twenty out of 26
regions saw reduced emissions from EVs because of regional the cutting of global warming emissions by 70 percent or more,
changes in the mix of electricity sources. The biggest im- compared with the average new gasoline car in these areas.
provements occurred in the Pacific Northwest, where coal Up from just 45 percent three years ago, about 66 per-
and natural gas generation dropped nearly 10 percent—with cent of Americans now live in regions where powering
replacements largely by hydropower and wind—resulting in a an EV on the regional electricity grid produces lower
greater than 20 percent decrease in the emissions intensity of global warming emissions than a 50 MPG gasoline car
electricity generation. (Figure 5, p. 14). And down from 17 percent three years ago,
Driving an EV in any region of the country produces only 12 percent of Americans now live in the lowest-rated re-
less global warming pollution than the average new gaso- gions, where powering an EV on the regional electricity grid
line car. Even on the dirtiest U.S. regional electricity grid, EVs produces global warming emissions similar to that of the best
produce the global warming emissions equivalent of a 35 MPG non-hybrid gasoline cars. Electricity grid improvements and
gasoline vehicle—a 21 percent improvement over the new gaso- improved EV efficiency mean several new regions of the
line car’s average fuel economy of 29 MPG.6 On the cleanest country are now “Best” regions, including Florida and Texas.
electricity grids, including those covering parts of California In these locales, EVs powered by the regional electricity grid
and New York, EVs emit lower global warming emissions than do better than a 50 MPG gasoline vehicle on global warming
a gasoline vehicle rated at more than 85 MPG. This results in emissions.
6 For the model year 2014, the EPA Trends report estimates average new car fuel economy, excluding trucks and SUVs, to be 28.7 MPG (EPA 2014).
Cleaner Cars from Cradle to Grave 11FIGURE 3. Electric Vehicle Global Warming Pollution Ratings and Gasoline Vehicle Emissions Equivalents by
Electricity Grid Region for 2012
NEWE
86 MPG
MROE
40 MPG NYUP
RFCM 135 MPG
38 MPG
MROW
NWPP 43 MPG NYCW
94 MPG 79 MPG
RFCW NYLI
44 MPG 47 MPG
RMPA SRMW
CAMX 35 MPG SPNO 36 MPG RFCE
87 MPG 35 MPG 68 MPG
SRTV
45 MPG SRVC
SPSO 63 MPG
AZNM 39 MPG
53 MPG SRMV
55 MPG SRSO
51 MPG
ERCT
52 MPG Good (31-40 MPG)
AKMS Better (41-50 MPG)
112 MPG
HIOA Best (51+ MPG)
FRCC
36 MPG 51 MPG
AKGD HIMS
45 MPG 46 MPG U.S. average (EV sales-weighted): 68 MPG
Note: The MPG (miles per gallon) value listed for each region is the combined city/highway fuel economy rating of a gasoline vehicle that would have global
warming emissions equivalent to driving an EV. Regional global warming emissions ratings are based on 2012 power plant data in the EPA’s eGRID 2015 database
(the most recent version). Comparisons include gasoline and electricity fuel production emissions. The 68 MPG U.S. average is a sales-weighted average based on
where EVs were sold in 2014.
SOURCE: EPA 2015C; IHS 2015.
Based on 2014 EV sales data, the average EV in the EVs perform on average in each region. However, individual
United States produces global warming emissions while EV owners may be able to achieve lower-than-average emis-
driving similar to a 68 MPG gasoline vehicle, thereby cut- sions. Some utilities within the region may rely on cleaner
ting emissions 60 percent compared with the average sources of electricity than the regional average, many EV
new gasoline car. In 2014, approximately half of all EVs sold consumers may pair their EV purchase with rooftop solar,
were in California, where plugging in produces emissions and green power programs may provide additional opportu-
similar to that of an 87 MPG gasoline vehicle. Using data on nities to heighten the global warming benefits of today’s EVs.
new EV registrations across the country in 2014, we estimate
PAIRING EVS WITH ROOFTOP SOLAR
that the sales-weighted average MPGghg for EVs is 68 MPG,
which means they produce less than half the emissions of the A 2013 survey of new EV owners in California, which repre-
average new car while driving (IHS 2015). sents more than 40 percent of the market for EVs, found that
32 percent of respondents had solar photovoltaic (PV) sys-
Beating the Average with Cleaner Electricity tems in their homes. An additional 16 percent indicated they
planned to install a PV system in the future (CCSE 2013).
Our analysis of global warming emissions from charging an
GREEN POWER PROGRAMS
electric vehicle is based on the average mix of electricity
sources in a given region. This provides an estimate of how Not everyone has the option of installing solar panels to
12 union of concerned scientistsFIGURE 4. Electric Vehicle Global Warming Pollution Ratings and Gasoline Vehicle Emissions Equivalents by
Electricity Grid Region for 2009
NEWE
75 MPG
MROE
40 MPG NYUP
RFCM 115 MPG
38 MPG
MROW
NWPP 39 MPG NYCW
73 MPG 41 MPG
RFCW NYLI
42 MPG 84 MPG
RMPA SRMW
CAMX 34 MPG SPNO 37 MPG RFCE
78 MPG 35 MPG 64 MPG
SRTV
46 MPG SRVC
SPSO 60 MPG
AZNM 38 MPG
49 MPG SRMV
57 MPG SRSO
46 MPG
ERCT
48 MPG Good (31-40 MPG)
AKMS Better (41-50 MPG)
110 MPG
HIOA Best (51+ MPG)
FRCC
36 MPG 48 MPG
AKGD HIMS
44 MPG 42 MPG
Note: The MPG value listed for each region is the combined city/highway fuel economy rating of a gasoline vehicle that would have global warming emissions
equivalent to an EV. Regional global warming emissions ratings are based on 2009 power plant data in the EPA’s eGRID 2012 database. Comparisons include
gasoline and electricity fuel production emissions.
SOURCE: EPA 2012A.
By providing additional green pricing program (DOE 2015b; EPA 2015a). These initia-
tives allow consumers, by paying a small premium for renew-
revenue for renewable able electricity, to support their utility’s greater investment in
renewables (Swezey and Bird 2001). The types of renewables
energy projects, the and program details vary by utility (EPA 2015a). In some de-
purchase of RECs can help regulated utility markets, consumers have the ability to
choose their power provider. In those locales, choosing a pro-
to increase the supply of vider that supplies electricity from renewable sources or that
renewable electricity. maintains a green pricing program may be distinct options.
States offering this type of choice for at least some consumers
include California, Connecticut, Illinois, Maine, Maryland,
power their EV. But participating in a green power program Massachusetts, New Jersey, New York, Pennsylvania, Rhode
offered by your utility, or independently purchasing renew- Island, Texas, and Virginia. The District of Columbia offers
able energy certificates, are two additional ways of supporting such a choice as well (DOE 2015b).
renewable energy. Purchasing renewable energy certificates (RECs), which
According to the U.S. Department of Energy (DOE), near- are available nationwide, is another option. RECs are directly
ly 850 utilities across the nation are offering some type of tied to electricity generated by renewable sources and are
Cleaner Cars from Cradle to Grave 13FIGURE 5. Electric Vehicle Global Warming Emissions Ratings by Population
12%
17%
Good
22% Better
Good (31-40 MPG)
45%
Best (41-50 MPG)
Better
Best (51+ MPG)
66%
38%
2009 2012
Note: Global warming emissions ratings are based on 2012 and 2009 power plant data in the EPA’s eGRID 2015 and 2012 databases, respectively.
sold in a voluntary market (CRS 2015). By providing addition- more than 150 MPGghg, compared with the regional average of
al revenue for renewable energy projects, the purchase of 94 MPGghg (UCS 2015).
RECs can help to increase the supply of renewable electricity States and utilities can help consumers determine how
(Heeter, Belyeu, and Kuskova-Burns 2014). clean their electricity is by disclosing data on emissions and
When reviewing options for buying green power, con- on electricity produced and consumed. Efforts have been
sumers should look for the Green-e certification label, which made in this regard, and some utilities also report to their
indicates that the products have been independently verified customers the specific mix of energy sources that generate
(see www.green-e.org). their electricity (CEC 2015).7 However, such disclosures are
not consistent across all utilities, and they often do not con-
ESTIMATES BY STATE OR INDIVIDUAL UTILITY
tain an estimate of the actual emissions intensity of the deliv-
Finally, particular states or utilities within a region may have ered electricity.
lower or higher emissions than the regional average, based on Table A-1 (p. 34) provides the grid mix for each region. If
the types of power purchases they make. Utilities procure elec- a utility does provide a breakdown of its sources of electricity,
tricity from (1) power plants that they own, (2) direct contracts consumers can compare that utility’s mix with the regional
with owners of other power plants, (3) short-term purchases mix. As a general rule of thumb, its percentage of coal indi-
through the regional power grid, and (4) trades across regions. cates whether the utility is providing electricity that has high-
Emissions data at the individual utility level are not consistent- er or lower global warming emissions intensity than the
ly or readily available across the country, which is in part why regional average.
this report uses grid-level information for its primary estimates.
Similarly, individual states within a region may have The Future of EV Emissions
cleaner or dirtier electricity than the regional average, based
on the sources of energy used by the utilities in those states. While electric vehicles have begun to reduce global warming
In Washington, for example, carbon dioxide emissions associ- emissions today, if EVs are to deliver on their full potential—if
ated with the power delivered to customers in the state are they are to help us avoid the worst consequences of climate
reported by utilities, which supply a great deal of renewable change—we must move systematically in the coming years to a
electricity (WA DOC 2015). Using data specific to Washing- clean-power grid. That is, a “decarbonizing” of the transporta-
ton, an EV charged with electricity in that state averages tion and electricity sectors over the next several decades, in
7 For example, California requires utilities to provide a Power Content Label specifying the mix of generation sources that are supplying their customers, but no
emissions intensity values need to be reported. See CEC 2015.
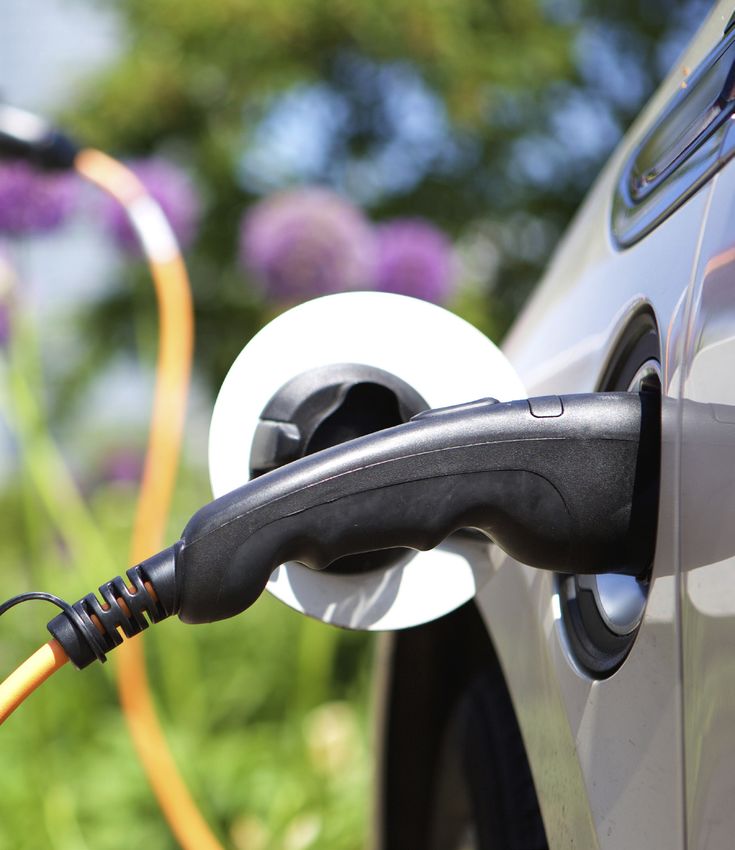
14 union of concerned scientists© iStockphoto.com/123ArtistImages
As the United States develops more renewable energy resources, electric vehicles will become even cleaner.
ergy, energy efficiency, natural gas, and nuclear power; and
If EVs are to deliver on shifting from coal-fired power. States have until September
their full potential we 2016 to submit their final compliance plans, and emission re-
ductions must begin in 2022 (EPA 2015b).
must move systematically By 2050, much greater deployment of renewable energy
in the coming years to a sources could lower global warming emissions even further.
UCS has modeled a scenario in which, by mid-century, 80 per-
clean-power grid. cent of U.S. electricity is produced from renewable sources
(Cleetus et al. 2014; Mai et al. 2012). Under this scenario,
electricity emissions intensity is reduced to below 100 grams
the United States as well as in other countries, is needed. of carbon dioxide–equivalent emissions (CO2e) per kWh of
Standards to reduce global warming emissions from elec- electricity generated (g/kWh), resulting in global warming
tricity generation are invaluable for moving the United States emissions from electric vehicles comparable with 300 MPGghg
away from high-pollution sources such as coal. Several indi- gasoline vehicles.
vidual states—including California and the nine Northeast
states participating in the Regional Greenhouse Gas Initia-
tive—have adopted such standards and are successfully im-
plementing them.
In August 2015, the EPA finalized the first-ever national
standards for cutting power sector carbon emissions. Under
the Clean Power Plan, states are collectively required to re-
duce power plant carbon emissions by 32 percent below 2005
levels by 2030. The plan provides for a number of options to
cut carbon emissions, including investing in renewable en-
Cleaner Cars from Cradle to Grave 15[ chapter 2 ]
Global Warming Emissions from
Manufacturing Electric Vehicles
The use of different parts, materials, and processes to build
components unique to electric vehicles means that global
The greatest difference
warming emissions from building a battery-electric vehicle in the manufacture of
differ from those of building comparable gasoline vehicles.
The relative significance of those two sets of emissions dif- battery-electric vehicles
fers as well. With gasoline cars, we have found that vehicle
operation accounts for almost 90 percent of the lifetime
compared with gasoline
global warming emissions, making the manufacturing emis- vehicles is in the type and
size of batteries required.
sions a smaller portion of the life cycle burden. By contrast,
BEVs produce lower emissions during operation, with emis-
sions from manufacturing being a more significant contribu-
tor to the total life cycle emissions.
To determine the impact of manufacturing emissions on rely on much larger lithium-ion batteries to power the
the overall global warming emissions benefits of EVs, we vehicle itself.
modeled two common configurations of battery-electric ve- The energy-storage capacity of a BEV battery, measured
hicles available today: an 84-mile-range midsize BEV and a in kWh, varies in different electric vehicle models and is a key
265-mile-range full-size BEV. factor in determining how far a vehicle can travel on a single
charge.8 The larger the battery, the greater the vehicle range;
How the Manufacturing of BEVs Differs but also the greater the weight added to the vehicle and the
From That of Gasoline Cars greater the emissions from manufacturing the battery. For
example, the 24 kWh battery for the Nissan LEAF, which al-
Unlike gasoline vehicles, BEVs have no fuel tank or internal- lows a driving range of 84 miles and weighs about 650 pounds
combustion engine but instead have a battery pack, electric- (Nissan 2015). The much larger 85 kWh battery in the Tesla
drive motor, power-control electronics, and regenerative Model S weighs about 1,200 pounds and carries the vehicle
braking systems (see Figure 6). The greatest difference in the 265 miles (Tesla Motors 2015).
manufacture of BEVs compared with gasoline vehicles is in In addition to a large battery pack, BEVs also have differ-
the type and size of batteries required. Gasoline vehicles only ing components, such as the power train, transmission, and
have a small lead-acid battery for starting the engine and traction motor. These components are not a large portion of
powering accessories while the engine is off, whereas BEVs the vehicle’s materials and weight (less than 15 percent); and
8 Additionally, various battery chemistries are used for the batteries in different BEVs.
16 union of concerned scientistsYou can also read