Radar Congestion Study - DOT HS 812 632 September 2018 - NHTSA
←
→
Page content transcription
If your browser does not render page correctly, please read the page content below

DOT HS 812 632 September 2018

Radar Congestion Study
DISCLAIMER

 This publication is distributed by the U.S. Department of Transportation, National
 Highway Traffic Safety Administration, in the interest of information exchange.
 The opinions, findings and conclusions expressed in this publication are those of
 the authors and not necessarily those of the Department of Transportation or the
 National Highway Traffic Safety Administration. The United States Government
 assumes no liability for its contents or use thereof. If trade or manufacturers’ names
 are mentioned, it is only because they are considered essential to the object of the
 publication and should not be construed as an endorsement. The United States
 Government does not endorse products or manufacturers.

Suggested APA Format Citation:

Buller, W., Wilson, B., Garbarino, J., Kelly, J., Subotic, N., Thelen, B., & Belzowski, B. (2018,
 September). Radar congestion study (Report No. DOT HS 812 632). Washington, DC:
 National Highway Traffic Safety Administration.
1. Report No. 2. Government Accession No. 3. Recipient's Catalog No.
 DOT HS 812 632
4. Title and Subtitle 5. Report Date
 September 2018
Radar Congestion Study 6. Performing Organization Code
 HOTO-1
7. Authors 8. Performing Organization Report No.
 William Buller, Brian Wilson, Joseph Garbarino, Jack Kelly, Nikola Subotic,
 Brian Thelen, all Michigan Technological University, and Bruce Belzowski
 (UMTRI)
9. Performing Organization Name and Address 10. Work Unit No. (TRAIS)
University of Michigan Transportation Research Institute 11. Contract or Grant No.
2901 Baxter Road
Ann Arbor, MI 48109 DTNH22-14-D-00329L-0006
12. Sponsoring Agency Name and Address 13. Type of Report and Period Covered
 National Highway Traffic Safety Administration Final Report
 1200 New Jersey Avenue SE. 14. Sponsoring Agency Code
 Washington, DC 20590
15. Supplementary Notes

16. Abstract

This study builds on prior work to characterize the environment in which automotive radars must operate, especially as
systems with greater autonomy enter the market. Systems that operate well in environments without other radars may
suffer significant degradation of performance in radar-congested environments. The results of this research provide an
understanding of the levels of interference expected under different scenarios. This allows us to identify situations that
require mitigation of radio frequency interference (RFI). Many techniques have been developed to mitigate RFI and
several are discussed in this report. Some mitigation strategies rely on standards practiced by all the transmitters in the
environment. This study identifies scenarios that require RFI mitigation and those strategies that require harmonization.

17. Key Words 18. Distribution Statement
automotive sensors, radar, mutual interference, active safety,
 This document is available to the public through
autonomous vehicles, RFI, radio frequency interference
 the National Technical Information Service,
 www.ntis.gov.
19. Security Classif. (of this report) 20. Security Classif. (of this page) 21. No. of Pages 22. Price
 87
Unclassified Unclassified

 i
Contents
1 Executive Summary .................................................................................................................... 1
2 Introduction ............................................................................................................................... 3
 2.1 Assisted driving and active safety radars ........................................................................... 3
 2.2 Recent changes to spectrum allocation ............................................................................. 4
 2.3 Radars and mutual interference ........................................................................................ 5
 2.4 Interference mitigation strategies ..................................................................................... 6
3 Literature Review and Prior Studies .......................................................................................... 9
 3.1 General physics of the congestion problem .................................................................... 10
 3.2 Modeling and simulation of congested environments .................................................... 13
 Estimating interference power ................................................................................ 13
 Radar system trends ................................................................................................ 15
 3.3 Testing and performance measures for radar in a congested environment ................... 16
 3.4 Mitigation techniques ...................................................................................................... 17
 Spatial....................................................................................................................... 18
 Temporal .................................................................................................................. 20
 Spectral .................................................................................................................... 20
 Coding ...................................................................................................................... 22
4 Interviews with Automakers and Suppliers ............................................................................. 24
 4.1 Industry use of radar ........................................................................................................ 25
 4.2 Recognition of threat posed by mutual interference ...................................................... 25
 4.3 System response to interference ..................................................................................... 25
 4.4 Tests ................................................................................................................................. 26
 4.5 Trends .............................................................................................................................. 27
 4.6 Interview process ............................................................................................................. 28
5 Models for Estimating Interference ......................................................................................... 29
 5.1 Radar models ................................................................................................................... 29
 5.2 Interference model .......................................................................................................... 30
 Interference from opposing traffic .......................................................................... 32
 Interference from passing traffic ............................................................................. 33
 Interference while backing out of parking space ..................................................... 34

 ii
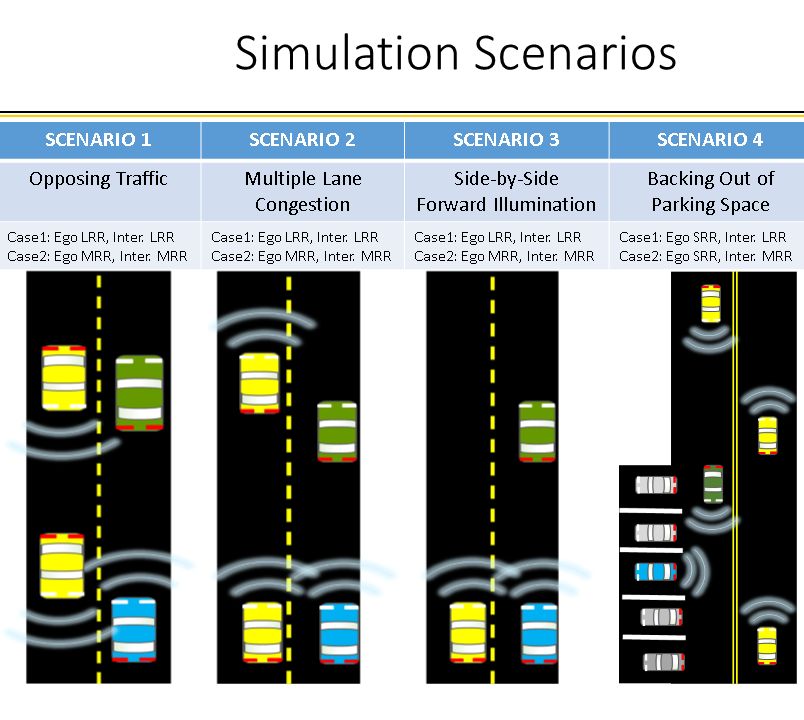
5.3 System model................................................................................................................... 36
 Scenario generation ................................................................................................. 37
 Sensor definition and placement ............................................................................. 38
 Sensor detection modeling ...................................................................................... 39
6 Scenarios .................................................................................................................................. 42
 6.1 Scenario result format ..................................................................................................... 44
 6.2 Scenario 1 - Interference from opposing traffic .............................................................. 46
 Scenario 1, Long-range radar system impacts ......................................................... 49
 Scenario 1, Mid-range radar system impacts .......................................................... 49
 6.3 Scenario 2 - Interference from passing traffic ................................................................. 50
 Scenario 2 – Long-range radar system impacts ....................................................... 53
 Scenario 2 – Mid-range radar system impacts......................................................... 54
 6.4 Scenario 3 – Side-by-side forward illumination ............................................................... 54
 Scenario 3 – Long-range radar system impacts ....................................................... 57
 Scenario 3 – Mid-range radar system impacts......................................................... 57
 6.5 Scenario 4 – Backing out of a parking space .................................................................... 58
 Scenario 4 – Short versus long-range radar system impacts ................................... 61
 ......................................................................................................................................... 61
 Scenario 4 – Short versus mid-range radar system impacts .................................... 62
 6.6 Scenario 5 – Rear-facing SRR and forward-facing LRR in traffic ...................................... 63
 6.7 Results .............................................................................................................................. 65
7 Recommendations for Test Development ............................................................................... 66
 7.1 Tests for model validation ............................................................................................... 66
 Interference from opposing traffic .......................................................................... 66
 Interference from passing traffic ............................................................................. 67
 7.2 Tests for evaluation of fielded systems ........................................................................... 67
8 Discussion................................................................................................................................. 68
 8.1 Review .............................................................................................................................. 68
 8.2 Study conclusions............................................................................................................. 68
9 Bibliography ............................................................................................................................. 70
Appendix A: Evaluation of Mitigation Strategies From MOSARIM ............................................. A-1

 iii
Appendix B: Appendix: Matlab ADAS Toolbox, Radar, and Tracker Objects .............................. B-1
 1. Long-range radar:............................................................................................................ B-1
 2. Medium-range radar: ...................................................................................................... B-1
 3. Short-range radar:........................................................................................................... B-2
 4. Tracker ............................................................................................................................ B-3

 iv
List of Tables
Table 1: Ranking list of mitigation techniques. .................................................................................. 7
Table 2 –Radar Congestion Study rankings for RFI mitigation countermeasures. ............................ 9
Table 3: SAE Autonomy Levels ......................................................................................................... 26
Table 4: Techniques used by automotive manufacturers and suppliers to either mitigate or
avoid RFI. .......................................................................................................................................... 26
Table 5: Parameters used for generic radar to model interference level. ...................................... 29
Table 6: Description of radar parameters ........................................................................................ 30
Table 7: Evaluating the constants for calculating the interference based on the radar parameters
in Table 5. ......................................................................................................................................... 33
Table 8: Received power from reference target, clutter, and interference power in reference
range bin, PT, PC, and PI, respectively, for Scenario 1: Interference from opposing traffic. ......... 47
Table 9: Received power from reference target, clutter, and interference power in reference
range bin, P_T, P_C, and P_I, respectively, for Scenario 2: Interference from passing traffic. ....... 52
Table 10: Received power from reference target, clutter, and interference power in reference
range bin, P_T, P_C, and P_I, respectively, for Scenario 3: Side-by-side forward illumination ....... 56
Table 11: Received power from reference target, clutter, and interference power in reference
range bin, P_T, P_C, and P_I, respectively, for Scenario 4: Backing out of parking space .............. 60
Table 12: SINR and impact on track range for the scenarios using the 76-77 GHz band. ............... 65
Table 13: SINR and impact on track range for the scenarios using the 76-81 GHz band. ............... 66
Table 14: Ranking list of mitigation techniques from MOSARIM study.......................................... A-1

 v
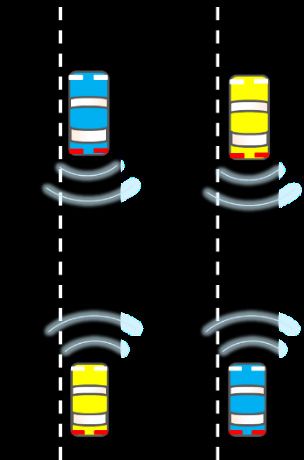
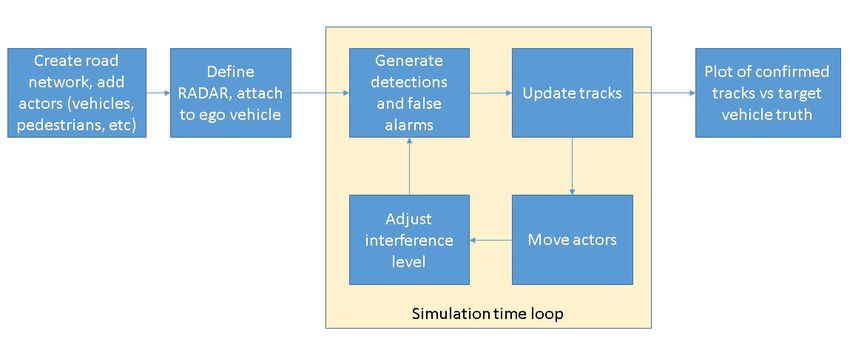
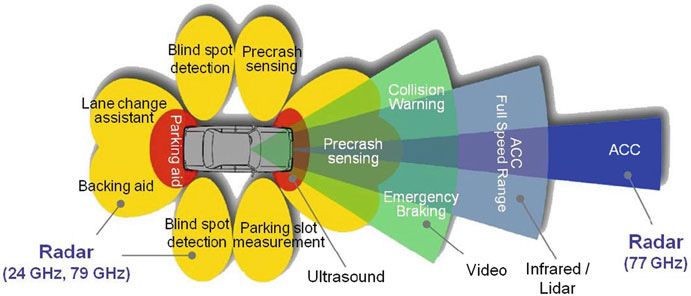
List of Figures
Figure 1:- An example deployment of multiple radar sensors used for active safety and
assisted driving systems ..................................................................................................................... 4
Figure 2: A linear frequency modulated waveform, or chirp, is shown on the left, as a time
domain signal. The spectrogram at right shows the spectral power in frequency, increasing
linearly over time. .............................................................................................................................. 6
Figure 3: Vehicles traveling in opposite directions are shown. ....................................................... 18
Figure 4: At left, delays introduced across the receiving antenna elements focus the directional
response of the radar, in an electronically steered array receiver. At right, is a graphic showing
the response of a digital beamforming radar system, ..................................................................... 27
Figure 5: Locations of vehicles are shown, distributed along a line, with a Poisson point
process density of 1/25 meters. ...................................................................................................... 32
Figure 6: Scenario 1 is represented schematically above.. .............................................................. 33
Figure 7: Scenario 2 is represented schematically above. ............................................................... 34
Figure 8: Ego rear-facing SRR (blue) receiver FOV overlapping with interferer MRR (orange)
transmitter FOV. .............................................................................................................................. 35
Figure 9:- Simulation Processing Flow ............................................................................................. 37
Figure 10:- Examples of ADAS generated roadways ........................................................................ 38
Figure 11: Generated roadway with vehicles that contain custom color assignments ................... 38
Figure 12: Overhead view showing radar beam indicating azimuth field of view........................... 39
Figure 13: Example ROC curve relating SNR and PD given desired PFA .......................................... 40
Figure 14: Example of subdividing radar beam to identify point target responses ........................ 40
Figure 15: Summary of the Scenarios tested in simulation.. ........................................................... 43
Figure 16: At left, the ego vehicle in blue, operates a rear looking radar and faces interference
from the forward-looking radar of the yellow car. At right, the roles are reversed. ...................... 43
Figure 17: Scenario 1 Depiction ....................................................................................................... 46
Figure 18: Position of vehicles at end of Scenario 1 ........................................................................ 47
Figure 19: Comparison of target, clutter, and interferer power with various radars at various
ranges............................................................................................................................................... 48
Figure 20: Plot of persistent target tracks from Scenario 1, long-range radar with no
interference ..................................................................................................................................... 49
Figure 21: Plot of persistent target tracks from Scenario 1, long-range radar, with interference,
for the case of 76-77 GHz band ....................................................................................................... 49
Figure 22: Plot of persistent target tracks from Scenario 1, long-range radar, with interference,
for the case of 76-81 GHz band ....................................................................................................... 49
Figure 23:- Plot of persistent target tracks from Scenario 1, mid-range radar with no
interference ..................................................................................................................................... 50
Figure 24: Plot of persistent target tracks from Scenario 1, mid-range radar, with interference,
for the case of 76-77 GHz band ....................................................................................................... 50
Figure 25: Plot of persistent target tracks from Scenario 1, mid-range radar, with interference,
for the case of 76-81 GHz band ....................................................................................................... 50
Figure 26: Scenario 2 Depiction ....................................................................................................... 51
Figure 27: Position of vehicles at end of Scenario 2 ........................................................................ 51
Figure 28: Comparison of target, clutter, and interferer power with various radars at various
ranges............................................................................................................................................... 52
Figure 29: Plot of persistent target tracks from Scenario 2, long-range radar with no
interference ..................................................................................................................................... 53

 vi
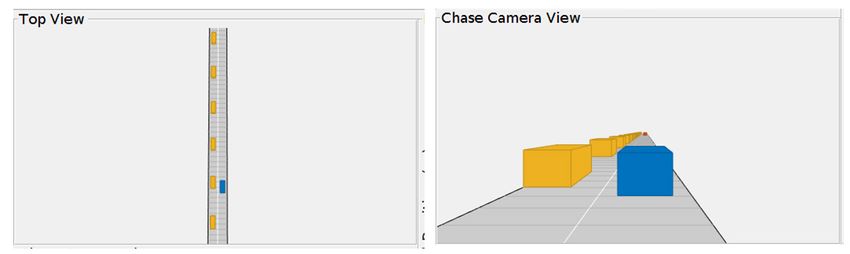
Figure 30: Plot of persistent target tracks from Scenario 2, long-range radar, with interference,
for the case of 76-77 GHz band ....................................................................................................... 53
Figure 31: Plot of persistent target tracks from Scenario 2, long-range radar, with interference,
for the case of 76-81 GHz band ....................................................................................................... 53
Figure 32: Plot of persistent target tracks from Scenario 2, mid-range radar with no
interference ..................................................................................................................................... 54
Figure 33: Plot of persistent target tracks from Scenario 2, mid-range radar, with interference,
for the case of 76-77 GHz band ....................................................................................................... 54
Figure 34: Plot of persistent target tracks from Scenario 2, mid-range radar, with interference,
for the case of 76-81 GHz band ....................................................................................................... 54
Figure 35: Scenario 3 Description .................................................................................................... 55
Figure 36: Position of vehicles at end of Scenario 3 ....................................................................... 55
Figure 37: Comparison of target, clutter, and interferer power with various radars at various
ranges............................................................................................................................................... 56
Figure 38: Plot of persistent target tracks from Scenario 3, long-range radar with no
interference ..................................................................................................................................... 57
Figure 39: Plot of persistent target tracks from Scenario 3, long-range radar, with interference,
for the case of 76-77 GHz band ....................................................................................................... 57
Figure 40: Plot of persistent target tracks from Scenario 3, long-range radar, with interference, for
the case of 76-81 GHz band ............................................................................................................. 57
Figure 41: Plot of persistent target tracks from Scenario 3, mid-range radar with no
interference ..................................................................................................................................... 58
Figure 42: Plot of persistent target tracks from Scenario 3, mid-range radar, with interference,
for the case of 76-77 GHz band ....................................................................................................... 58
Figure 43: Plot of persistent target tracks from Scenario 3, mid-range radar, with interference, for
the case of 76-81 GHz band ............................................................................................................. 58
Figure 44: Scenario 4 Description .................................................................................................... 59
Figure 45: Position of vehicles at end of Scenario 4 ........................................................................ 59
Figure 46: Comparison of target, clutter, and interferer power with various radars at various
ranges............................................................................................................................................... 60
Figure 47: Plot of persistent target tracks from Scenario 4, short-range ego radar with no
interference ..................................................................................................................................... 61
Figure 48: Plot of persistent target tracks from Scenario 4, short-range ego radar versus long-
range interferer radar, with interference, for the case of 76-77 GHz band .................................... 61
Figure 49: Plot of persistent target tracks from Scenario 4, short-range ego radar versus long-
range interferer radar , with interference, for the case of 76-81 GHz band ................................... 61
Figure 50: Plot of persistent target tracks from Scenario 4, short-range ego radar with no
interference ..................................................................................................................................... 62
Figure 51: Plot of persistent target tracks from Scenario 4, short-range ego radar versus mid-
range interferer radar, with interference, for the case of 76-77 GHz band .................................... 62
Figure 52: Plot of persistent target tracks from Scenario 4, short-range ego radar versus mid-
range interferer radar, with interference, for the case of 76-81 GHz band .................................... 62
Figure 53: The forward-looking LRR on the ego vehicle (blue) faces direct illumination from a
rear-facing SRR. ................................................................................................................................ 64
Figure 54: The rear-facing SRR on the ego vehicle (blue) faces direct illumination from a forward-
looking LRR. ...................................................................................................................................... 64
Figure 55: A test track with five vehicles used to measure interference power similar to that
estimated in Scenario 1. .................................................................................................................. 67

 vii
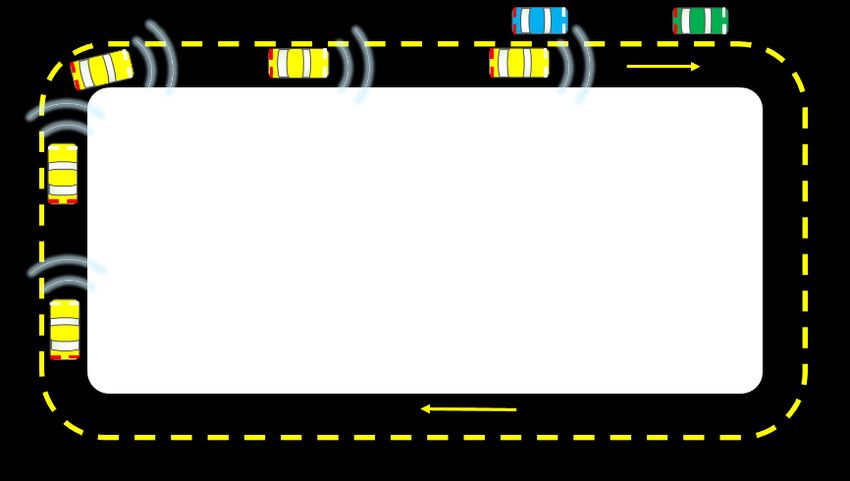
Figure 56: Interfering vehicles in yellow pass the ego vehicle in blue. The radiometer on the
blue vehicle measures energy from the radars, including that which is reflected from the
green target car. .............................................................................................................................. 67

 viii
List of Abbreviations and Acronyms
ADAS Advanced Driver Assist System
AEB automated emergency braking
BPSK binary phase shift keying
CF channel fraction
CFAR constant false alarm rate
clutter objects illuminated by radar, which the system needs to ignore
CW continuous wave
dB decibels
dBm2 decibel meters squared (log unit of area)
DBF digital beam-forming
DF duty factor
ego vehicle vehicle under test
fN noise factor
FCW forward collision warning
FOR field of regard
FOV field of view
Hz Hertz (cycles per second)
interferer vehicle operating a radar which may interfere with ego vehicle's
 radar
LFM linear frequency modulated waveform
MOSARIM MOre Safety for All through Radar Interference Mitigation
PD probability of detection
PFA probability of false alarm
POI probability of intercept
PSK phase shift keying
radar radio frequency detection and ranging
RCS radar cross section
RF radio frequency
ROC receiver operating characteristic
RX receiver
SINR signal to interference plus noise ratio
SNR signal to noise ratio
SOC system on chip
SWAP+C size, weight, and power plus cost
target object of interest illuminated by radar
TX transmitter

 ix
1 Executive Summary
The automotive industry is undergoing a fundamental transformation, made possible by a
multitude of advancements in electronic, communication, and remote sensing technologies.
Automobiles are being developed with varied levels of autonomy to increase efficiency, reduce
congestion, improve safety, and provide reliable transportation to communities that formerly
would be dependent on others for assistance. Consider, for example, the following press release
from 2016:

 The U.S. Department of Transportation’s National Highway Traffic Safety
 Administration and the Insurance Institute for Highway Safety announced today a
 historic commitment by 20 automakers representing more than 99 percent of the
 U.S. auto market to make automatic emergency braking (AEB) a standard feature
 on virtually all new cars no later than NHTSA’s 2022 reporting year, which begins
 Sept 1, 2022. “U.S. DOT and IIHS announce historic commitment of 20 automakers
 to make automatic emergency braking standard on new vehicles.” (NHTSA & IIHS,
 2016)

Vehicles that are designed to sense their surroundings and navigate traffic safely, may reduce the
risks posed by human errors in their operation. Such vehicles rely on a host of active and passive
sensing systems; an important class of sensors for this application is radio frequency detection
and ranging systems (RADAR). The technology is old enough that the word radar is used in daily
language.

Radar is particularly well suited for detection and tracking of objects for collision avoidance
systems. Radar is an active sensing technology, which can function day or night, and in all
weather. The parameters of a radar can be tuned to the detection and tracking problems of
navigation guidance and collision avoidance. Recent developments in a multitude of technologies
have facilitated the availability of radar systems highly capable for automotive navigation, with
relatively low size, weight, and power plus cost (SWAP+C). As with any active sensor, a radar
transmits energy to understand its local environment. The operation of multiple active systems
can result in an environment where each sensor is subject to energy emitted by other
transmitters, as well as its own. This situation results in mutual interference for the sensing
systems, and degrades their performance.

This radar congestion study characterizes the environment in which automotive radars must
operate, as market penetration of radar-equipped vehicles grows. Systems that operate well in
environments with few other radars may suffer significant degradation of performance in radar
congested environments. The results of the study show levels of interference based on operation
of current systems in congested environments will be significant. In scenarios with many vehicles
operating radars in the 76-81 GHz band, the power from other radars will likely exceed the power
of echoes from targets needed for specified performance by several orders of magnitude.

The modeling and simulation work focused on two questions:

 • How much power does a given radar receive from other radar transmitters?
 • How does this impact the performance of a collision warning system?

 1
The first question was addressed by developing a model for nominal automotive radars and
computing the amount of power overlapping in space, time, and spectrum. This work is done
theoretically, assuming free space propagation of radio frequency (RF) waves.

The second question was addressed by introducing the power computed for the interference, as
noise, into a system simulation. This approach is common in past studies, and assumes the
waveforms of the interfering radar are substantially different, so that their mutual energy does
not correlate. This approach is taken, in part, because it requires a minimum of assumptions
about the signal processing chain behind the receiving radar’s front end. Further, there are a
great deal of possible combinations, and interactions, that require empirical evaluation.

To quantify possible system impacts, the processing functions were based on a generic model
developed in cooperation with industry professionals and simulated in MATLAB’s Automated
Driving System Toolbox. For this reason, the current study does not capture the system impacts
which depend on the multitude of interactions possible with different waveforms, which could be
addressed through further analysis and empirical tests. Nevertheless, with these caveats, the
simulations in this study suggest radar performance could be significantly impacted.

The results of this research provide an initial understanding of the levels of interference expected
under different scenarios. Scenarios are selected to represent typical traffic situations in which
mitigation of radio frequency interference (RFI) would improve radar performance. The report
provides an understanding of the level of interference that systems face, and what strategies may
provide sufficient mitigation.

Many techniques have been developed for the purposes of mitigating RFI, and are discussed in
this report. The report focuses on those strategies reported as practiced by the industry, as well
as others, which show significant promise. Some mitigation strategies rely on common operating
standards practiced by all the systems in the environment (harmonization). This study identifies
scenarios requiring significant RFI mitigation. The study tabulates the effectiveness of mitigation
strategies, and identifies those which involve harmonization across transmitters.

Based on the analysis here, using reasonable specifications for automotive radars, it is shown that
automotive radars, operating in congested environments, will face significant interference. For
example:

 • In the case of opposing traffic on a two-lane highway, assuming that the radars use
 randomly selected carrier frequencies, an automotive radar will encounter power from
 other radars far greater than the echoes of its own transmissions needed to track other
 vehicles. The interference approaches four orders of magnitude, or nearly 40 dB, greater
 than echoes typical of a reference target, as specified for the system.
 o Under simulation, the range at which the radar develops a track that persists
 through to collision, was reduced to a fraction, 11 percent, of what is observed
 without interference.
 • In the case of radars which face rearward (such as blind-spot detection systems), these
 units are vulnerable to the direct arrival of forward collision avoidance radars that utilize
 higher power and antenna gain. Our analysis shows these units could experience
 interfering power from a forward collision avoidance radar that is nearly five orders of
 magnitude, or 50 dB, greater than the reflections from their specified reference target.

 2
Therefore, it is important that automotive radar makers consider techniques capable of
mitigating interference to levels that allow the system to perform as specified. The automotive
safety testing community should consider this side effect of active sensors in its assessment of
automotive systems employing active sensors.

The study here evaluated the practices and trends in the industry through a survey of literature,
and interviews with manufacturers. Mitigation strategies, with estimates of performance, are
tabulated. The principal mitigation techniques practiced in industry are listed below, along with
estimates of effectiveness:

 • A technique focused on detecting interference and repairing receiver results in time
 domain can reduce interference by 3 to 20 dB, depending on the specifics of the
 interfering systems.
 • Stretch processing, which lowers the systems’ overall signal to noise ratio, can reduce
 levels of interference by 10 dB.
 • Digital Beam Forming, is becoming more common with system-on-chip (SOC)
 architectures, allows the radar to restrict the receiver’s spatial field of view. Based on
 current designs, this should allow many systems to put the majority of the interfering
 systems at the antenna array’s side lobe levels, and reduce the interference by 5 to 10 dB.
 • Specific polarization following the radar location on the automobile: front, rear, or side.
 The idea is that front-facing radars, for example, could be selected so as to reduce
 interference levels when confronting each other in opposing traffic. This approach can
 mitigate interference levels by 10 to 15 db; however, it involves harmonization across the
 industry to a common convention.
 • The formidable interference levels that a rear-facing radar will experience from
 illumination by more powerful forward collision radars suggests that polarization
 conventions alone will not be sufficient. With all radars operating at W-band, one solution
 would be to divide the 76-81 GHz spectrum, for operation of forward-facing and rear-
 facing radars. This approach can mitigate up to 60-80 dB, but also involves harmonization
 across the industry.

Results from this study are reported based on stochastic models of interference power and the
impact on a generic system in simulation. The estimates of the interference power are tabulated,
and compared to the power associated with ambient clutter (reflections from the road), and a
reference target. If the interference power is near the level of power reflected from targets of
interest (other cars, pedestrians, bicyclists, etc.), then the radar systems is operating in an
environment that will degrade its performance, if mitigation strategies are not employed.

2 Introduction
2.1 Assisted driving and active safety radars
Increased occurrence of radar interference has negative impacts on the performance of
automotive radars and the assisted driving systems that rely on them. Assisted driving systems
are becoming embedded in more vehicles as the technology base matures. These systems
promise greater safety, reduced congestion and greater situation awareness for drivers. In many
cases, these systems use active and passive sensors along with wireless communications (Sturm,
Sit, Braun, & Zwick, 2013), as shown in Figure 1. Up to this point, attention has been paid to

 3
making the technology operate and not much consideration has been paid to the mutual impact
of the highway infrastructure and safety systems when deployed in large numbers. The effect of
operating large numbers of radars in the same spectrum and in close proximity raises the
possibility that their operation may cause mutual interference.

Figure 1:- An example deployment of multiple radar sensors used for active safety and assisted driving
systems (Kissinger, 2012)

2.2 Recent changes to spectrum allocation
An important change in the allocation of the automotive radar spectrum has occurred following
the start of this study. The United States Federal Communications Commission has expanded the
spectrum available for vehicular radars, to include the entire 76-81 GHz band and to transition
radars out of the 24 GHz band. This change makes for a consistent allocation of spectrum
available internationally, avoiding the need to customize the radars in vehicles for different
markets. The analysis performed in this study is, thus, focused on systems operating in the 76-77
and 76-81 GHz.

The text from the FCC announcement appears below (Grace, 2017).

 Media Contact:
 Neil Grace, (202) 418-0506, neil.grace@fcc.gov
 For Immediate Release

 FCC UNLOCKS NEW AIRWAVES FOR VEHICULAR RADAR USE
 Spectrum Will Enhance Crash Avoidance and other High-Tech Safety Features

 WASHINGTON, July 13, 2017 – The Federal Communications Commission today expanded
 the spectrum available for vehicular radars that are used for a variety of purposes, including
 safety applications like collision avoidance and adaptive cruise control. Access to this
 additional spectrum will enable continued innovation in this space, allowing these radars to
 better distinguish between objects in areas close to the vehicle. This action will improve
 performance for applications such as lane change warnings, blind spot detection, parking
 aids, “stop and follow,” “stop and go,” autonomous braking, and pedestrian detection.

 4
The Commission’s action expands the current 76-77 GHz spectrum allocation to include the
 entire 76-81 GHz band and transitions radars out of the 24 GHz band. This is consistent with
 the spectrum that is available internationally, avoiding the need to customize the radars in
 vehicles for different markets.

 The Order also permits the use of this band for fixed and mobile radars at airports that are
 used for important safety applications, such as the detection of debris on runways that
 could harm aircraft on take-off and landing. Making the entire 76-81 GHz band available at
 airports will allow for improvements to these existing technologies as well as promote the
 development of new safety applications, such as wingtip radars that can help aircraft avoid
 collisions with objects while moving on airport grounds.

 Action by the Commission July 13, 2017 by Report and Order (FCC 17-94). Chairman Pai,
 Commissioners Clyburn and O’Rielly approving and issuing separate statements. ET Docket
 No. 15-26

2.3 Radars and mutual interference
Radar is inherently a wave sensing measurement and subject to constructive and destructive
combinations of radar transmissions. Therefore, interference is expected in environments dense
with reflective targets, as well as environments with similar transmitters. This section discusses
the growing role of radar in automotive applications and how that growth increases the
occurrence of radar interference.

Radars use knowledge of radiated signals to identify echoes and estimate the range and speed of
objects in the environment. These echoes are not perfect copies of the original signal, but a sum
of multiple returns that constructively and destructively interfere with the signal. It is important
to understand that returns from objects illuminated by radar fluctuate, especially when the
relative range, aspect and other objects in the scene change. With multiple radars operating in
near proximity and an environment of multiple sources of scattering, the performance of each
radar degrades as the interference level rises.

The research conducted here shows the levels of mutual interference expected when operating
many vehicles with automotive radar in dense traffic produces a challenging environment for
successful radar operation. A generic automotive radar specification was generated, based on a
survey of literature and manufacturers specifications, and then assessed as reasonable, by
engineers from Delphi and Bosch. Automotive radars are typically evaluated for detection
performance on a reference target. In this study, the reference target for the automotive radar
has a cross-section of 10 2 , and is observed at a range of 175 . In scenarios with opposing
traffic, and cars spaced at an average of 15 , the power expected on a radar’s receiving antenna
is computed to be approximately 30 decibels (dB) above the power expected from the return of
the reference target. Typical radar operation requires false alarm rates to be kept near or below 1
per 1 million samples. At this false alarm rate, to achieve a 90 percent probability of detection, a
radar needs approximately 10 dB of signal to noise ratio (Tyson, 2013). In the case of radar
interference limiting system performance, 10 dB of signal to interference is necessary to operate
the system without suffering an intolerable error rate. Thus, to achieve the specified
performance, the system must be able to mitigate approximately 40 decibels of interference.

 5
2.4 Interference mitigation strategies
There are several key issues that need to be addressed when proposing RFI mitigation techniques
beyond suppressing interference. Automotive radars are relatively low power transmitters
intended to detect other vehicles for collision avoidance. The precision of the range estimate, ,
for a radar is based on the bandwidth, , of its waveform. Greater bandwidth provides better
range resolution. The resolution statement for a radar is expressed as in the equation below,
where the constant is used for the propagation speed of light.
 Equation 1
 =
 2

The speed of light is approximately 3 × 10⁸ / . So if a radar designer wants the system to
resolve targets as small as 1 meter, then the bandwidth of the waveform should be 1.5 ×
108 / , or 150 MHz. To obtain good resolution of the unambiguous Doppler shift (thus, the
radial speed of the target), the radar benefits from a waveform where the shift in frequency can
be observed over many samples (high duty cycle). This leads many automotive radar designs to
the use of a linear frequency modulated waveform.

Figure 2: A linear frequency modulated waveform, or chirp, is shown on the left, as a time domain signal.
The spectrogram at right shows the spectral power in frequency, increasing linearly over time.

Many automotive radars employ linear frequency modulated waveforms for a variety of reasons.

 • High time-bandwidth product: because the waveform changes frequency, it covers a
 large bandwidth, over a long time, providing both range and Doppler resolution
 • Strong Doppler tolerance: the waveform is robust to under sampling at the analog to
 digital conversion stage, because minor shifts in timing will result in a detection with only
 a minor shift in frequency
 • Smooth phase modulation – unlike digital phase shift keyed waveforms, the continuous
 phase transition of the LFM does not introduce unnecessary noise into the receiver

Other automotive radars use frequency shift keying, where the frequency is varied, according to
a pre-determined code. This type of waveform also allows the radar to achieve a high time-
bandwidth product, but typically increases the noise factor, because of electronic switching, for
the radar.

 6
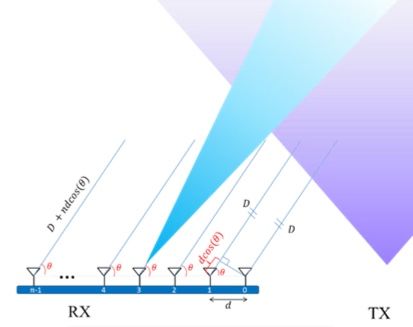
Many automotive radars operate in the 76 to 77 GHz and often use upwards of 200 MHz
bandwidth. If each radar needs 200 MHz bandwidth of a total of 1000 MHz available, then only 5
radars can operate in a given area and that is without any guard bands. The ranking list identified
from MOre Safety for All through Radar Interference Mitigation (MOSARIM) is shown in Table 1.
This list was used as a starting point for the current study, and the updated evaluation appears in
Table 2.
Table 1: Ranking list of mitigation techniques. The reference numbers refer to the mitigation techniques’
appearance in the MOSARIM study tables. Items in green were evaluated as being most valuable for
interference mitigation. Items in yellow are evaluated as being of secondary value. Source: from Kunert,
2012
 Ref. Title

 T3.1 CFAR (constant false alarm rate) for interference mitigation
 T6.5 Detect interference and change transmit frequency range of chirps
 T2.1 Using pauses of random length between chirps or pulses
 T3.4 Application of driving direction specific pre-defined frequency band separation
 T6.2 Detect interference and repair Rx results (Time domain)
 T2.2 Using random sequence of chirp types (Up-chirp, Down-chirp, CW-Chirp)
 T5.4 Digital beam forming
 T6.4 Detect interference and change timing of transmit chirp or pulses
 T1.2 Specific polarization following the radar location (frontal rear side)

The mitigation strategies listed in Kunert (2012) come with trade-offs. For example, the first
mitigation strategy suggests the use of a constant false alarm rate (CFAR) detector. This was given
a positive evaluation in MOSARIM, but it should be noted, this is promising for mitigating false
alarms, but has significant side effects. The CFAR will ensure that the false alarm rate does not
erupt in the presence of high noise or interference; however, this is achieved by reducing the
probability of detection.

Some of the techniques consider randomizing of time multiplexing which may not provide
mitigation in high clutter environments – if there are reflections at many delay times, the
interfering signal will show up regardless of the transmitting schedule. Other strategies such as
the second in the list, which is referred to as “sniff-and-avoid” in cognitive radio applications, may
be successful in low-congestion operation, but in highly congested environments this may greatly
degrade radar performance.

This study included a survey with automotive radar industry representatives to gain a better
understanding of the industry view of the threat posed by mutual interference for their radar
systems, and the steps being taken to mitigate the threat. Based on the results of that survey and
examination of the literature, the table first prepared in the MOSARIM study can be updated to
focus on the techniques that are reported by the industry, and result from developments in
technology, and the market.

The updated table of countermeasures appears as Table 2, where row headings in blue identify
techniques that involve adherence to convention across the industry (harmonization). Each of the
rows in this table is given further comment as follows:

 7
• T6.2: Detecting interference and repairing receiver results may be implemented in a
 multitude of ways. The techniques with the most promise are in the time domain
 waveform. One implementation uses prior knowledge of transmissions by other radars. In
 this implementation, a detector, matched for other radars, identifies pulses that contain
 high levels of interference and flags them, so that they are elided and do not pollute
 processing downstream. Performance of countermeasures in this class are subject to the
 density of other systems, the fidelity and completeness of the systems database of other
 radar transmissions, and may still be vulnerable to RFI from a unit with similar
 parameters.
• The radar congestion study finds that many automotive radar makers employ a technique
 called stretch processing (Levanon & Mozeson, 2004). This is often done so that the
 receiver can use a lower rate analog to digital converter, which is a significant cost saving.
 The beneficial side effect is that the receiver uses less bandwidth, and reduces spectral
 overlap, perhaps by as much as a factor of 10.
• T5.4: Although not tested during the MOSARIM study, digital beam forming is becoming a
 prominent feature in newer automotive radar systems for the benefit of finer angular
 resolution. The narrowed angular response of the antenna array benefits the receiver by
 spatially limiting interference. The amount of interference reduction is constrained by the
 number of elements in the receiving antenna array, and the directionality of interference
 sources. Newer antenna arrays are being designed with a greater number of elements,
 and this is reflected in the increased estimate of interference reduction, over that
 reported in MOSARIM.
• T1.2: The idea of specifying polarization to mitigate interference is reported by
 MOSARIM. This can be done with linearly and circularly polarized transmitters. For linear
 systems, the transmitting antenna must all be rotated about their axis (a.k.a. clocked) in a
 way as to present energy to other systems in an orthogonal polarization state. Circular
 polarized radars, using the same handedness, are also orthogonal for this application if
 they all use the same handedness. This is because a radar, for example, using a left-
 handed circularly polarized transmit antenna, CPLH, detects reflections with a right-
 handed circularly polarized receive antenna, CPRH. The CPLH waveforms will be greatly
 attenuated at the receive antenna. The reduction for the response of a linear antenna to
 the transmission of a circularly polarized radar, and vice versa, is 3 dB.
• The radar congestion study finds that a rear-facing radar will experience illumination by
 more powerful forward collision radars which may overwhelm the radar’s ability to
 operate at even a degraded level. With all radars operating at W-band, one solution
 would be to divide the 76-81 GHz spectrum, for operation of forward and rear-facing
 radars. If this approach is implemented with harmonization across the industry, it can
 mitigate interference between forward and rearward radars by 60-80 dB.

 8
Table 2 –Radar Congestion Study rankings for RFI mitigation countermeasures reported by industry,
including those evaluated MOSARIM study. Items in green are practiced by multiple makers in the industry.
The items in blue involve harmonization.
 Interference
 ID Counter Measures Comment
 Reduction
 Detect interference The influence of fast or slow crossing FM chirps
 MOSARIM 3-20 dB , depending
 and repair Rx results still needs further investigation on mitigation
 T6.2 on environment
 (time domain) margin impact
 The main cost of the stretch processing technique
 is the loss of signal to noise ratio. So long as the
 RCS Study Stretch processing 10 dB
 interference is at least 10 dB greater than the
 noise, the technique is advisable.
 Mitigation effect depends on beamwidth (space
 MOSARIM
 Digital Beam Forming 5-10 dB domain), based on number of elements in
 T5.4
 receiver array
 Specific polarization This is already partially used for ACC radars that
 10-15 dB for co pol -
 MOSARIM following the Radar have 45 degree slant linear polarization (reduced
 systems using the
 T1.2 location (frontal, interference from oncoming radars by 15 dB).
 same convention
 rear, side) Involves harmonization.
 As all automotive radars move to W-band, 76-81
 Spectrum division 60 to 80 dB for
 GHz, splitting the spectrum could reduce
 following the Radar forward and rear-
 RCS Study interference between forward and rearward
 location (frontal, facing radars in
 looking radars by 60 to 80 dB. Involves
 rear, side) traffic
 harmonization.

Notably removed from the original table, which appears in Appendix: Evaluation of Mitigation
Strategies From MOSARIM, is the technique labelled as T3.1: The application of a CFAR. This was
considered as a technique for interference mitigation at the time of the MOSARIM study;
however, it should not be considered as such for autonomous vehicle operation in scenarios with
persistent RFI. It is a valid technique for mitigating false alarms, but inherently adds risk for
desensitizing the system.

3 Literature Review and Prior Studies
Automotive radars operating in traffic face an environment rich with interference from the direct
arrival of other radar transmissions as well as their reflections from objects in the environment.
Radio frequency interference is, thus, impacted by the density of vehicles using radar in the same
band, as well as the density of objects in the environment. The study of existing literature and
prior work reveals that the community of interest, which includes industry and academia, has
increased its interest in mitigating interference for automotive radar systems as the number of
systems grows.

The literature search focused on four areas.

 • General physics of the congestion problem
 • Modeling and simulation of congested environments
 • Testing and performance measures for radar in a congested environment
 • Mitigation techniques

 9
Important works in each of these four areas are highlighted in the following sections. This review
is not intended to be exhaustive, but provides a snapshot of the current body of knowledge. Each
section leads with a summary of what is relevant to the current study.

3.1 General physics of the congestion problem
While radar interference is a well understood phenomenon and studied for many decades, the
concern of when and how this will impact the development of advanced driver assist systems and
autonomous vehicles is relatively new. The references highlighted in this section address this
point, and provide resources that are used to help develop our models of the radars and the
operating environment used in this study.

Heuel, S. (2016). Automotive radar sensors must address interference issues. Microwave Journal,
59(12), pp. 22-36.

 This reference is used in modeling parameters of automotive radars and
 experimental design.

 There are mainly two different types of waveforms used in today’s automotive radar
 sensors. Blind Spot Detection (BSD) radars often use the Multi-Frequency Shift Keying
 (MFSK) radar signal and operate mainly in the 24 GHz band. Radars operating in the
 77 GHz or 79 GHz band often make use of Linear Frequency Modulated Continuous
 Wave (LFMCW) signals or Chirp Sequence (CS) signals, which are a special form of
 LFMCW signals.

 Considering that 72 million new cars are registered each year with a potential
 average of three (or more) automotive radar sensors per car, about 200 million more
 automotive radar sensors could be on the streets in the not too distant future.
 Consequently, the 24 GHz and 76 to 81 GHz spectrum will be heavily occupied.
 Automotive radar sensors will need to cope with mutual interference and offer signal
 diversity and interference mitigation techniques.

Jain, V., & Heydari, P. (2013). Automotive radar sensors in silicon technologies. New York: Springer
New York, 1-100.

 This reference is used in modeling the parameters of automotive radars in this
 study.

 This book presents architectures and design techniques for mm-wave automotive
 radar transceivers. Several fully-integrated transceivers and receivers operating at
 22-29 GHz and 77-81 GHz are demonstrated in both CMOS and SiGe BiCMOS
 technologies. Excellent performance is achieved indicating the suitability of silicon
 technologies for automotive radar sensors. This book bridges an existing gap
 between information available on dependable system/architecture design and circuit
 design. It provides the background of the field and detailed description of recent
 research and development of silicon-based radar sensors. System-level requirements
 and circuit topologies for radar transceivers are described in detail. Holistic
 approaches towards designing radar sensors are validated with several examples of
 highly-integrated radar ICs in silicon technologies. Circuit techniques to design
 millimeter-wave circuits in silicon technologies are discussed in depth.

 10
You can also read