A Review on Glaucoma Disease Detection Using Computerized Techniques
←
→
Page content transcription
If your browser does not render page correctly, please read the page content below
Received February 2, 2021, accepted February 15, 2021, date of publication February 23, 2021, date of current version March 10, 2021.
Digital Object Identifier 10.1109/ACCESS.2021.3061451

A Review on Glaucoma Disease Detection Using
Computerized Techniques
FAIZAN ABDULLAH1 , RAKHSHANDA IMTIAZ2 , HUSSAIN AHMAD MADNI 2 ,
HAROON AHMED KHAN 2 , (Member, IEEE), TARIQ M. KHAN 1 , (Member, IEEE),
MOHAMMAD A. U. KHAN3 , AND SYED SAUD NAQVI 2 , (Member, IEEE)
1 Schoolof Information Technology, Faculty of Science Engineering and Built Environment, Deakin University, Burwood, VIC 3125, Australia
2 Department of Electrical and Computer Engineering, COMSATS University Islamabad, Islamabad 45550, Pakistan
3 Department of Electrical Engineering, Namal Institute Mianwali, Mianwali 42200, Pakistan

Corresponding author: Haroon Ahmed Khan (haroon.ahmed@gmail.com)

  ABSTRACT Glaucoma is an incurable eye disease that leads to slow progressive degeneration of the retina.
  It cannot be fully cured, however, its progression can be controlled in case of early diagnosis. Unfortunately,
  due to the absence of clear symptoms during the early stages, early diagnosis are rare. Glaucoma must
  be detected at early stages since late diagnosis can lead to permanent vision loss. Glaucoma affects the
  retina by damaging the Optic Nerve Head (ONH). Its diagnosis is dependent on the measurements of Optic
  Cup (OC) and Optic Disc (OD) in the retina. Computer vision techniques have been shown to diagnose
  glaucoma effectively and correctly with little overhead. These techniques measure OC and OC dimensions
  using machine learning based classification and segmentation algorithms. This article aims to provide a
  comprehensive overview of various existing techniques that use machine learning to detect and diagnose
  glaucoma based on fundus images. Readers would be able to understand the challenges glaucoma presents
  from an image processing and machine learning stand-point and will be able to identify gaps in current
  research.

  INDEX TERMS Glaucoma, convolutional neural networks (CNN), diabetic retinopathy, cup-to-disc ratio
  (CDR), optic nerve head (ONH), optic cup (OC), optic disc (OD), intra ocular pressure (IOP).

I. INTRODUCTION                                                                                by Glaucoma were undiagnosed at the early stages of the
Glaucoma is a family of eye diseases that affect the optic                                     disease [4]. Glaucoma can be diagnosed by analyzing fundus
nerve. Glaucoma is commonly associated with Intra Ocular                                       images, specifically, by measuring the sizes of OC and OD
Pressure (IOP), but it may also be caused by high blood                                        (a depression in the OD). In a fundus image, OD is oval in
pressure, migraines, obesity, ethnicity, and family history.                                   shape and yellowish in color. OC is visible as a white color
High IOP results in damage to the optic nerve [1]–[3]. This                                    circle inside the OD and enlarges with an increase in the IOP.
phenomenon is prevalent amongst adults and people over                                         CDR for the normal eye is 0.65 as given in [6]. Any change
60. The optic nerve deterioration occurs in the region of the                                  in CDR is indicative of the existence of Glaucoma. For a
Optic Disc (OD) known as Optic Nerve Head (ONH). All                                           computer to accurately diagnose Glaucoma, it is imperative
forms of Glaucoma are incurable and their damage is mostly                                     that it must be able to isolate, detect and segment both the
irreversible. The only options available to the patients are                                   OC and the OD from the retinal image. Analysis of the ratio
ways to slow down the rate of progression of this disease.                                     between the two helps diagnose the occurrence of Glaucoma.
The efficacy of all treatments depend on the early diagno-                                        Visual computing systems have been shown to be particu-
sis of the disease. However, early diagnosis is uncommon                                       larly effective in analyzing medical images and classifying
due to lack of obvious symptoms. In a study conducted in                                       items of interest inside an image. Most visual computing
Japan, it was observed that 93 percent of people affected                                      algorithms for medical imaging are fundamentally used to
                                                                                               identify shapes and geometries of objects in an image. Visual
   The associate editor coordinating the review of this manuscript and                         computing machines need to be trained extensively to identify
approving it for publication was Victor Sanchez            .                                   artefacts of interest in an image. Training such machines to

                     This work is licensed under a Creative Commons Attribution 4.0 License. For more information, see https://creativecommons.org/licenses/by/4.0/
VOLUME 9, 2021                                                                                                                                                        37311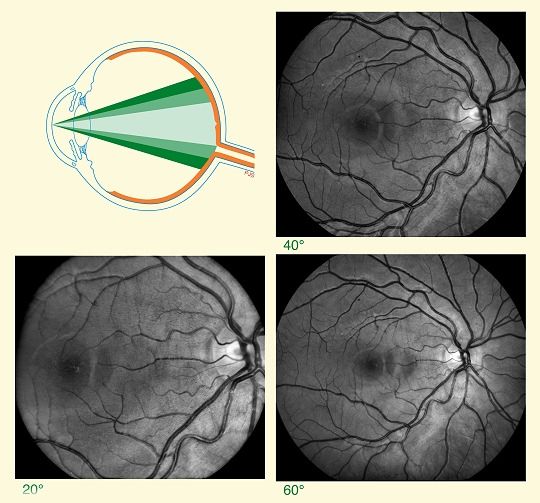
F. Abdullah et al.: A Review on Glaucoma Disease Detection Using Computerized Techniques
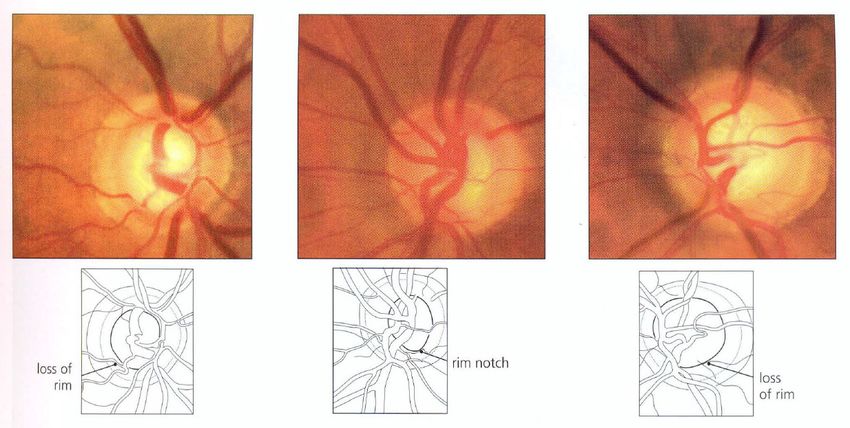
FIGURE 1. The Optic Nerve Head (ONH) in the fundus image. The Optic Disc (OD), Optic Cup (OC) and Neuroretinal Rim have been labelled. The images
show a healthy eye, initial state and advanced stage of glaucoma from left to right. The relative expansion of the OC and the thinning of the Neuroretinal
Rim is clearly noticeable as is the effect on retinal vessels. Original image courtesy to the Atlas of Clinical Ophthalmology [5].
learn effectively requires a large dataset. In context of image II. DATASETS
analysis, datasets are collections of relevant images where Different datasets used in the Glaucoma detection techniques
regions of interest have been properly annotated. The number have been described and grouped as follows.
of images may vary from a few hundred to several thousands.
A. SINDI
It has been shown that the quality of analysis increases sub-
stantially with the increase in size of the dataset [7]. A study was conducted on Indian population for the analysis
Significant work has been done for the automatic anal- of both eyes. People with age range from 40 to 40 to 83 years,
ysis of retinal fundus images using computer vision tech- were included in the analysis. Previous surgery character was
niques. Machines can be taught to recognize various artefacts taken into account for the analysis. This dataset contains
in a retinal image like the OC and OD as shown in Fig- 5670 normal and 113 Glaucomatous images.
ure 1. They can further be trained to measure factors like B. SCES
the CDR. Almazroa et al. [8] have been able to train a This cross-sectional study took place in Singapore on the
machine to analyse glaucoma using the publicly available basis of population in which 1060 chinese took part. All
RIGA (Retinal-fundus Images for Glaucoma Analysis) data subjects went through the Optical Coherence Tomography
set with considerable accuracy. Hatanaka et al. [9] were able (OCT). This dataset is comprised of 1630 normal images
to automatically measure the CDR by performing online and 46 Glaucomatous images with a sum of 1676 images.
profile analysis of retinal images. Artefacts other than OC This dataset is subjected to classify the images as normal or
and OD can be used to detect glaucoma from a retinal Glaucomatous.
image. In the review conducted by Haleem et al. [10], various
anatomical features to assist early detection of glaucoma have C. SIMES
been discussed. These include Vasculature Shift (VS), Peri- For the SiMES, a study was conducted to analyse eye diseases
papillary Atrophy (PPA), Retinal Nerve Fibre Layer (RNFL), especially in adults living in Malays Singapore. People with
and Neuroretinal Rim Notching (NRN) in addition to CDR. age range of 40 to 79 were taken into consideration for the
This review aims to provide a detailed analysis of key analysis. Patients were assessed by retinal photography, optic
papers published in this domain to date. A number of dif- disc, ocular biometry and digital lens. The dataset consists
ferent visual computing techniques have been used to detect of 482 as normal images and 168 as Glaucomatous iamges
Glaucoma [11]. In this review, efforts have been made to used for the purpose of classification.
present a discussion and a multifaceted comparison of these D. ARIA
approaches. The techniques reviewed have been segregated in This dataset is mainly focused on efficient measurement and
terms of learning approaches (20 of them unsupervised and detection of retinal vessels which can be implemented on both
22 supervised). For every algorithm, different performance high and low resolution fundus images. This dataset contains
measures for detection of glaucoma have been discussed 161 images with resolution of 768×576 used for the detection
individually. These measures quantify how well the algo- and measurement of retinal vessels and analysis of Glaucoma
rithms detect the disease. These measures include accuracy, in the eye.
sensitivity, specificity and F-scores. At the conclusion of this
review, the reader should have a clear understanding of the E. DRISHTI-GS
current state-of-the-art in the use of visual computing systems The Drishti-GS dataset consists of 101 retinal images
used to detect glaucoma. which are attained from the Aravind eye hospital, India.
37312 VOLUME 9, 2021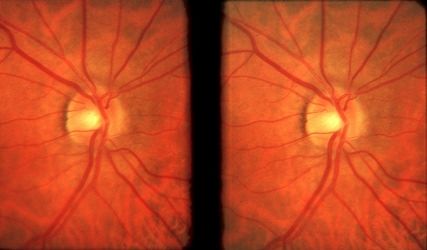
F. Abdullah et al.: A Review on Glaucoma Disease Detection Using Computerized Techniques

The resolution of these retinal image is 2896 × 1944 where                     first version of this dataset, annotations of OD and OC are not
Field of View (FOV) is 30 degree. The age of the patients                      given, therefore, it can only be employed for classification
were in the range of 40 and 80. The groundtruths of OD and                     purpose.
OC exist in the dataset. Moreover, the images were annotated
by 4 ophthalmologists.                                                         J. STARE
                                                                               This dataset is special for Structured Analysis of the Retina
F. RIM-ONE                                                                     (Hoover, Kouznetsova, and Goldbaum 2000). There are
In RIM-ONE v3, 159 retinal fundus images are present along                     81 retinal images having resolution of 700 × 605 pixels. The
with their groundtruths that have been annotated by the oph-                   dataset distribution contains 31 normal images and 50 dis-
thalmologists. This dataset is comprised of 74 glaucomatous                    eased images. This dataset is intended for the segmentation
and 85 non glaucomatous images.                                                of OD and the blood vessels.

G. RIGA                                                                        K. ONHSD
RIGA is a dataset used for the diagnosis of Glaucoma and                       It stands for Optic Nerve Head Segmentation dataset
it stands for Retinal Images for Glaucoma Analysis. This                       (Lowell et al. 2004). It consists of 100 retinal images
dataset consists of 750 retinal fundus images. These retinal                   which were taken from the people belonging to different
fundus images are acquired from three different resources                      backgrounds including 20% Asian, 50%Causian, 16% Afro-
which are MESSIDOR, Magrabi Eye Centre in Riyadh and                           Caribbean, and 14% patients unknown. The images in this
Bin Rushed ophthalmic centre in Riyadh. This dataset con-                      dataset were acquired using Canon CR-6 45MNf. Resolution
tains glaucomatous as wells as non-glacomatous images                          of retinal images is 640 × 480 pixels and FOV is 45 degree.
along with their groundtruths that are manually annotated by                   The OD is annotated by ophthalmologists and annotations are
six ophthalmologists.                                                          present in this dataset.

H. ORIGA-LIGHT                                                                 L. DRIVE
The retinal fundus images present in the ORIGA-light dataset                   This dataset is acquired from the screening program of dia-
are collected by the Singapore Malay Eye Study (SiMES)                         betic retinopathy (DR) in Neitherland and it stands for Digital
[6]. The process of collection was funded by National Med-                     Retinal Images for Vessel Extraction (Staal et al. 2004).
ical Research Council and conducted by the Singapore Eye                       The ages of patients were between 25-90 years. This dataset
Research Institute which was completed in the duration of 3                    consists of 40 retinal images which include 33 images having
years. This dataset provides the assistance to the researcher                  no symptoms of DR and the 7 images having mild symptoms
for the segmentation of retinal images that helps in the analy-                of DR. The Canon CR-5 non-mydriatic 3CCD camera was
sis of Glaucoma. This dataset also contains the groundtruths                   768 × 584 pixels with FOV as 45 degree. In this dataset, FOV
that facilitate the researcher and provides the benchmark                      of every retinal image is circular, therefore, the diameter of
for the evaluation of the tools that are designed for the                      FOV is 540 pixels and a mask image is used to define the
diagnosis of Glaucoma. To study this case, retinal fundus                      FOV. This dataset is distributed into two sets i.e. training and
images of both eyes were taken, and the age of the people                      test set, both having equal number of images i.e. 20.
that were examined, was between 40 and 80. The number
images that were kept for making this dataset are 650 in                       M. DIARETDB1
total. Out of 650 images, there are 168 images that are                        DIARETDB1 is a public database which contains 89 color
Glaucomatous and other 482 images are nonglaucomatous.                         images. There are 5 images which are normal and 84 images
This dataset is comprised of retinal fundus images along with                  having at least mild non-proliferative signs (microaneurysms)
their groundtruths. The trained professionals of Singapore                     of the diabetic retinopathy. The camera used to capture these
Eye Research Institute have segmented and annotated these                      images had 50 degree field-of-view.
650 images that exist in the ORIGA-light dataset.
                                                                               N. DRIONS-DB
I. ACRIMA                                                                      This dataset consists of 110 images which are manually OD
This dataset consists of 705 retinal images with 396 glau-                     segmented color images. This dataset is special for Digital
comatous and 309 healthy images. The retinal images were                       Retinal Images for the purpose of Optic Nerve Segmentation
taken from both eye (i.e. left and right), and were formerly                   (Carmona et al. 2008). These images were acquired by two
dilated and centred in the OD. The Topcon TRC retinal                          different experts and analogical fundus camera was used
camera and IMAGEnet capture system were used to capture                        to capture the images. HP-photo smart-S20 high resolution
the retinal images. The FOV of retinal images is 35 degree                     scanner was used to digitize these images. It is 8 bits per pixel
while resolution is 2048 × 1536 pixels. The images in this                     and has resolution of 600 × 400. The average age of patients
dataset were annotated by two specialists of glaucoma at the                   is 53 years in this dataset having 53.8 percent Caucasian
Fundación Oftalmológica del Mediterráneo (FOM). To label                       ethnicity female and 46.2 percent Caucasian ethnicity male.
these images, no other clinical information was used. In the                   The prolonged modest glaucoma was found in 23.1 percent

VOLUME 9, 2021                                                                                                                            37313
F. Abdullah et al.: A Review on Glaucoma Disease Detection Using Computerized Techniques
patients and 76.9 percent had eye hypertension. There were R. HRF
110 images which had potential issues that can deface the The High- Resolution Fundus (HRF) dataset (Köhler et al.
identification procedure of the OD contour. 2013) comprises of 45 images. This dataset includes
15 healthy images, 15 glaucomatous images, and 45 retinal
O. CHASEDB1 images that are affected by diabetic retinopathy. The reso-
This dataset is a reference database of retinal ves- lution of these images is 3504 × 2336 pixels and field of
sels that is obtained from the multiethnic schoolchildren view is 45. These retinal images were taken by the Canon-
(Owen et al. 2011). There are 28 number of retinal images CR-1 fundus camera.
in this dataset in which 20 images are present in test set All datasets are enlisted in Table 1.
and remaining 8 images are present in training set (Ng et al.
2014). The resolution of these retinal fundus images is 1280× III. STRUCTURAL CHANGES DUE TO GLAUCOMA
960 pixels and it has FOV of 30 degree. In this dataset, Glaucoma causes irreparable structural changes in the eye.
retinal fundus images are categorized on the basis of images In this section, we will try to review these structural changes
with non-uniform background illumination and the images in to appreciate all approaches in diagnosing this disease. The
which blood vessels have poor contrast in comparison with structure most affected by Glaucoma is the Optic Nerve Head
background. (ONH). This section describes some of these changes that can
be detected visibly in an ophthalmoscope image.
P. REFUGE
There are 1200 retinal images present in this REFUGE A. OPTIC DISC ASYMMETRY
dataset. This dataset is categorized into three subdivisions If the difference of the CDR between both eyes exceeds a
which are training, validation and test. Each category contains certain threshold, it is indicative of Glaucoma [27]. This is
equal number of images (i.e. 400 in each). Two different especially obvious in the earlier stages of the Glaucoma [28].
fundus cameras (i.e. Ziess Visucam 500 and Canon CR-2) As it is the most obvious and persistent symptom across all
were used to capture the retinal fundus images. Ziess Visucam forms of Glaucoma, it is the single most important visual
500 was used to capture the images for training where Canon- symptom [29], [30].
CR-2 was used to acquire the retinal images for validation
and test. The resolution for Zeiss Visucam 500 and Canon B. LOSS OF NEURORETINAL RIM
CR-2 camaras, was 1634x 1634 and 2124 × 2056 pixels The neuroretinal rim is the area between the edge of the cup
respectively. At the posterior pole, all the retinal images are and the disc. In glaucoma, the cup may extend to touch the
centred with the macula and OD. Images with the glaucoma edge of the disc and may result in the total cupping of the disc
labels are only present in training datasets which includes and loss of the neuroretinal rim [31]. The thinning of the rim
40 glaucomatous and 360 healthy retinal fundus images. The can be used for early diagnosis of glaucoma [32].
health record was used to acquire the label for training set
which shows that it is not acquired on the basis of only C. DISC HEMORRHAGES
retinal fundus images but also using visual field and the OCT. Small splinter and flame shaped hemorrhages visible in the
The groundtruths were annotated by 7 opthalmologists of retinal layer of the nerve fiber are indicative of some kind of
Zhongshan Opthalmic center, Sun Yat-sen university, China. Glaucoma [33]. Hemorrhages typically indicate the presence
The annotations of all 7 ophthalmogists were combined to of either ‘‘Normal Tension Glaucoma’’ [34] or ‘‘Primary
make the final reference standard. Open Angle Glaucoma’’ [35].
Q. MESSIDOR D. PERIPAPILLARY ATROPHY (PPA)
This dataset consists of 1200 retinal fundus images that Peripapillary Atrophy is a symptom that can be detected
are attained by 3 departments of ophthalmology. Its name visibly. It describes the atrophy of the of retinal layers
stands for Method to evaluate segmentation and indexing and the retinal pigment epithelium (RPE) around the OD.
techniques in the field of retinal ophthalmology (Decencière, An association between the progression of peripapillary atro-
X. Zhang, et al. 2014). Out of 1200 retinal images, there are phy has been well established with the progression of glau-
800 images that were attained using pupil dilation and other coma, where the glaucomatous damage manifests itself in
400 images were attained without pupil dilation. The color the optic disc resulting in progressive visual field loss [36],
video 3CCD camera was used to capture these retinal images even though PPA can occur in healthy subjects as well [37].
on a Topcon TRC NW6 non-mydriatic retinograph. Field of PPA is divided into alpha (α) and beta (β) regions [38]. The
view of these images is 45 degree and having resolution of frequency of β PPA amongst patients of ‘‘Open Angle Glau-
1440 × 960, 2240 × 1488 or 2304 × 1536 pixels. For every coma’’ is shown to be significantly higher than its occurrence
retinal image, medical specialists provided retinopathy grade in healthy eyes [39] and is detectable using visual computing
and the risk of macular oedema. techniques [40].
37314 VOLUME 9, 2021F. Abdullah et al.: A Review on Glaucoma Disease Detection Using Computerized Techniques TABLE 1. Datasets used for the detection of glaucoma. E. VASCULAR CHANGES IV. VISUAL SYMPTOMS OF GLAUCOMA IN RETINAL A strong association between glaucoma and changes to IMAGES the retinal vascular structure has been established fairly Computerized diagnosis of glaucoma is performed by analyz- recently [41]. Narrowing of the retinal vessels is indica- ing retinal images. An understanding of the visual symptoms tive of advanced optic nerve damage due to glaucoma of glaucoma in these images is fundamental to appreciate the [38]. This is a potential area that can be leveraged to challenges in computerized diagnosis of glaucoma. There are detect glaucoma but is limited due to the fact that base- a variety of retinal image acquisition modalities including line values for vascular structure have not been conclusively fundus (ophthalmic) photography, stereo fundus photogra- established yet. phy, hyperspectral imaging (HSI), fluorescein angiography VOLUME 9, 2021 37315
F. Abdullah et al.: A Review on Glaucoma Disease Detection Using Computerized Techniques

                   FIGURE 2. Diagnosis of glaucoma in retinal fundus images.

(FA), scanning laser ophthalmoscope (SLO) and optical                     center of ONH, group of elliptical lines was used to model
coherence tomography (OCT) [42]. Any one of these modal-                  the direction of nerve fiber and then images were converted
ities can be used to acquire images from the eye that can be              into polar transformation. To enhance the contrast of NFLD,
used for the diagnosis of glaucoma using visual computing                 Gabor filters were used as a post process. The transformed
techniques. However, retinal fundus photographs are most                  image was then classified for NFLD using a neural network.
commonly used since they are economical and the screening
of diseases using visual computing techniques is quite simple             B. ANALYSIS OF OPTIC NERVE HEAD
[43]. Ophthalmoscopy, also known as funduscopy, is the                    The ONH deformation is another symptom of Glaucoma.
process used to acquire the retinal fundus images.                        ONH is a point where all optic nerves and blood vessels
   Visual computing algorithms can analyse these images to                originate from. In the deformation of the ONH, the optic
detect visible symptoms indicating progression of glaucoma.               nerve becomes damaged, the size of cup increases and the
The two main visual symptoms that are most commonly                       neuroretinal rim becomes thinner. This type of ONH defor-
searched for are the defect in the retinal fibre layer and the            mation is called cupping which occurs in the earlier stages
CDR in the optical nerve head. The use of fundus images for               of Glaucoma. In the diagnosis of Glaucoma, the cup to disk
the diagnosis of glaucoma has been summarized in figure 2.                ration (CDR) is considered a key visual symptom [49], but
                                                                          is rarely used in clinical settings as it is often difficult to
A. ANALYSIS OF THE RETINAL NERVE FIBRE LAYER                              recognize the boundary of OC in a retinal fundus images
The retinal nerve fiber layer defect (NFLDs) is a fundamental             by the naked eye of a medical practitioner. Computer vision
sign of Glaucoma that appears as a dark pattern spreading                 techniques have been shown to calculate the correct CDR
out from the ONH. The nerve fiber layer (NFL) can be                      value consistently and effectively.
observed in fundus photography, OCT and the scanning laser
polarimetry. Computerized analysis of NFL in retinal fun-                 1) DETERMINATION OF CDR ON PLAIN FUNDUS
dus photographs is common. The pattern of NFL has been                    PHOTOGRAPH
analyzed and measured by comparing pixel values around                    Determining the boundary between the OC and the OD and
and inside the NFL [44]. Intensity information of NFL has                 hence measuring the CDR is quite challenging in flat fundus
been used effectively for the analysis of the NFL [45]. The               images. This is because the border between OD and OC is
derivative of the intensity was taken to measure the thickness            not easily visible due to interweaving network of capillaries
of NFLDs. The NFLDs were analyzed by Yogesan et al. [46]                  surrounding the OD. Many techniques have been published
using texture based information. It was observed that the                 to counter this problem. Nayak et al. have shown that While
analysis of texture for the NFL is useful for the recognition of          the CDR is not readily detectable in an RGB colour (Red-
NFLD. Kolar et al. used Markov random field to differentiate              Green-Blue) fundus image, the detection becomes consider-
the NFL regions for healthy people compared to those with                 ably easier when using either the red or the green component
Glaucoma [47]. Muramatsu et al. proposed a method based                   of the image [50]. Zhang et al. have demonstrated the efficacy
on texture analysis after transforming the fundus image using             of a convex envelope based boundary estimation algorithm,
Gabor filter [48]. After the image transformation, the curvy              that has been shown to mark the border of the OC with good
bands like pattern of NFLDs appear straight. Pertaining to the            confidence [51]. It has also been shown that the contours

37316                                                                                                                                 VOLUME 9, 2021
F. Abdullah et al.: A Review on Glaucoma Disease Detection Using Computerized Techniques
FIGURE 3. (a) A flat fundus image acquired at 40 degree viewing angle. (b) a stereo image of the same eye acquired at a single 34 mm frame. Images
courtesy Ophthalmic Photography: Retinal Photography, Angiography, and Electronic Imaging [54].
of the cups can be defined by finding the blood vessels and A. DETECTION OF GLAUCOMA THROUGH OPTIC
detect where they bend at the border of the OC and OD [52]. NERVE HEAD
Hatanaka et al. proposed a method in which CDR is computed Glaucoma disease exists in the region of ONH due to which
using values of the individual pixels in the fundus image extraction of this region from the retinal image plays an
[53]. In this technique, after the segmentation of OD, vertical important role. Therefore, for the segmentation of this region,
profiles were attained from the center of OD, and noise is automated tools have been designed which are based on
removed by averaging those profiles followed by second machine learning and deep learning. The sequential steps
derivative of the profiles to determine the OC and hence CDR. of machine learning based techniques include acquiring of
Despite the progress in determining an accurate picture of the the retinal fundus image from the retinal datasets. Some of
CDR, there are still much room for improvement. these datasets include MESSIDOR, Rim-one, Drishti-GS,
ORIGA and RIGA. Second step is pre-processing of the
2) DETERMINATION OF CDR ON STEREO PHOTOGRAPHS retinal image. In pre-processing, quality of retinal image
Stereo fundus photography is used to acquire 3D images of is improved that helps in the segmentation. In this pro-
the ONH. Stereo fundus images have been shown to offer cess, different steps can be performed including localization,
certain advantages over plain fundus images when detecting noise removal, illumination correction, vessel extraction,
OC and OD. The images are acquired using a pair of special and contrast enhancement of the retinal image by applying
retinal fundus cameras that capture a dual (stereo) perspec- various techniques. Pre-processing also helps in eliminating
tive of the ONH. This gives a 3D perspective to the fundus the irrelevant information from the retinal image and keeps
image making it easier to compute the CDR. It has been the specific parameter regarding assessment of the disease
shown that the contours of OD and OC can be detected quite measurement which makes it more reliable [58]. The next
efficiently by computing the cross-correlation and stereo step is segmentation in which region of interest (ROI) is
disparity between the two fundus images [55]. In another segmented which includes localization of OD, after that
technique proposed by Xu et al. [56], stereo disparity was process of feature extraction is performed [59]. It is also
calculated using cross-correlation and minimum difference observed that OD is attained for the diagnosis of Glaucoma
of the features. Contour of OD and margin of the OC were without performing this process (i.e. segmentation) [60].
positioned on the particular depth from the margin of the OC. After segmentation, post-processing is performed for achiev-
Abramoff et al. implemented a technique on the stereo images ing better outcome in terms of evaluating parameters. For the
that was based on the classification of pixels, region of OC, screening of Glaucoma, segmentation of OD and OC plays a
background and the neuroretinal rim [42]. In the classification significant role and there are many existing approaches that
of pixels, features of disparity were used along with the color have been employed for this purpose. This papers caters these
features. CDR was computed by calculating the pixels in the approaches that are used earlier for the segmentation of OD
region of OC and neuroretinal rim [57]. and OC. The common tactics include thresholding that shows
Flat and stereo fundus images can be compared in figure 3 some response for the specific pixels that lie below or above
from that intensity level. This shows that these techniques
V. COMPUTERIZED TECHNIQUES TO DIAGNOSE use the notion of surfaces, curves, clusters with alike pixels
GLAUCOMA IN RETINAL IMAGES in specific range of group, active contour and active shape
This section discusses various approaches that have been used model. Moreover, these techniques depend on the boundaries
in the visual computing domain to detect glaucoma based on and shape of the region, component and features (i.e. color
the aforementioned symptoms. and intensity).
VOLUME 9, 2021 37317F. Abdullah et al.: A Review on Glaucoma Disease Detection Using Computerized Techniques B. THRESHOLDING BASED TECHNIQUES applied and by subtracting the OD and OC, the neuroretinal It is common and easy approach for the segmentation. This rim is attained. Subsequently, RDR is computed by acquiring technique converts the colored or gray scale image into binary the temporal and inferior areas using the mask of all quad- image. It divides the pixels of image on the basis of intensity rants. For the classification purpose, SVM based classifier level. The segmented image is achieved by choosing the value is employed. This technique lacks in terms of performance. of threshold that is assigned to the color which is below or In [65], Tehmina et al. proposed a technique to segment the above that particular threshold level. Selection of the thresh- region of OD and OC. In the pre-processing step, resolution old value is done manually that is based on the features of of the retinal image is upgraded by bilinear interpolation image. This thresholding is categorized in three types which and contrast is improved by histogram equalization. For the are global thresholding, variable thresholding and multiple elimination of the noise from the retinal image, mean and thresholding. median filter are used. For the segmentation of the OD and In [61], for the diagnosis of Glaucoma, Ghafer et al. pro- OC area, Otsu’s thresholding is used. After implementing the posed an approach for the segmentation of OD. In preprocess- convex hull, the exact OD and OC is achieved. Although the ing, from RGB retinal image, green channel is selected and technique worked well but its effectiveness decreases as color sobel operator is used for improving the image quality after varies from person to person. which local thresholding is implemented. Afterward, for the extraction of OD region, circular hough transform (CHT) is C. LEVEL SET BASED TECHNIQUES employed. To get the maximum intensity for OD, threshold- In [66], Wong et al. proposed an approach to segment the ing is implemented on preprocessed retinal image. The draw- region of OD. Initially, ROI is extracted using pixels of back of this technique was that it has not been implemented high intensity from histograms. The ROI was taken as initial on large scale datasets. contour and variational level set based technique are used to In [62], Fuente-Arriaga et al. presented an approach for the segment the OD. OD was not accurately extracted due to the segmentation of OC. In this method, reference points are used existence of retinal vessels in the region of OD. Therefore, and Ostu thresholding is performed. For observing the vessels ellipse fitting was applied. For the segmentation of OC, green movement in the area of the inferior, superior, temporal and channel was selected and level set approach is applied based nasal, different masks are used with the centroid of OD. The on thresholding. Finally, ellipse fitting has been implemented black top hat transform is used for segmentation of vessels to get the OC. along with Ostu thresholding. Then chessboard metric is In [67], Wong et al. further improved the technique by pre- implemented in all regions for computing the displacement senting fusion based methodology, for the estimation of CDR among the vessels centroid which gives the information about to segment the region of OD. Firstly, ROI was achieved using the healthy and unhealthy image. Mila et al. proposed a the information of intensity. From RGB retinal image, red method [63] that is based on multi-level thresholding for the channel is selected and variational level set based technique is segmentation of OD. The retinal blood vessels were elimi- implemented in order to segment the OD followed by ellipse nated in the pre-processing step. The retinal blood vessels fitting. Subsequently, values of CDR were computed which were enhanced by convolving the image with the linear filter were fed to the classifiers. For the classification of image as and ROI was achieved by applying the local entropy thresh- healthy or unhealthy, SVM and neural network (NN) based olding. The bi-level thresholding is applied for the segmenta- classifier were used. In this technique, SVM performed well tion of OD. The valley estimation based on histogram was in comparison with the NN which minimizes the error rate of used for defining the clusters comprised of normalization CDR. of histogram binning and probability estimation. After that, Zhang et al. proposed an algorithm in [51], for the OC to segment the region of OD, multi-level thresholding was segmentation. The level set approach based on thresholding, implemented that is followed by the post-processing step in has been implemented for the segmentation of OC. After which morphological operations were used. In this technique, the segmentation, ellipse fitting is applied that is based segmentation of OC was not taken into account that is also on the least square fitting. The boundary of OC achieved essential for the screening of Glaucoma disease. Ayushi et al. after the implementation of ellipse fitting is optimized by presented a technique in [64] where CDR as well as rim implementation of convex hull. The shortcoming of this tech- to disc ratio (RDR) has been computed for the diagnosis nique is that it is not beneficial for large scale implementation. of Glaucoma disease. Initially ROI is achieved and because of less influence of vessels in red channel, it is used from D. CLUSTERING BASED TECHNIQUES RGB retinal image for the segmentation of OD and then In [68], Xu Yanwu et al. proposed an algorithm that is based Ostu thresholding is implemented. The green channel was on low-rank representation of superpixels to segment the used for the segmentation of OC as the boundary of OC region of OC. Initially, linear iterative clustering was used is perceptible in this channel. Mean and standard deviation to divide the pixels of OD. Classification of superpixels is were estimated and histogram was analyzed for the mean performed as neuroretinal rim or OC on the basis of low-rank intensity level. For the segmentation of OC, thresholding is labeling and then to improve the computational efficiency, 37318 VOLUME 9, 2021
F. Abdullah et al.: A Review on Glaucoma Disease Detection Using Computerized Techniques

linear kernel is used. The squared forbenius norm has been                     an active contour based model is employed and subsequently
employed to save the data from data corruption reconstruction                  spline interpolation is implemented. The sobel gradient direc-
error. In this tactic, N-cut label is used and then for the                    tion and p-tile methodology are used for the detection of
classification of superpixels, majority voting is performed.                   retinal vessels. k-curvature is used for the finding of vessel
Although, this technique minimized the non-overlap ratio, but                  bending. With the help of these detected vessel bends, candi-
it does not perform well due to the existence of large blood                   dates of the OC edges are updated. To get the final OC, spline
vessels.                                                                       interpolation is implemented. For the diagnosis of Glaucoma,
   Umarani Balakrisnan et al. proposed a method in [69]                        CDR and RDR are estimated. The drawback of this technique
which is based on clustering to segment the OD and OC.                         is that the accuracy of classification is not up to the mark.
Preprocessing is performed to improve the quality of reti-                        Megha et al. presented a model in [73], for the detection
nal image and for this purpose, Gaussian mask has been                         of OD that is based on geodesic active contour. Using green
used. The clusters are extracted on the basis of mapping                       channel, ROI is obtained having the size of 200 × 200 pixels
and distances, and then using the location of boundaries and                   followed by the application of median filter. Bottom hat filter
objects for the intensity variation, masking is employed for                   is applied for the removal of retinal blood vessels, and Ostu
the segmentation purpose.                                                      thresholding is used to get the vessels binary image. Intensity
   In [70], Thakur et al. presented a technique to segment the                 values of pixels present in the median mask of the image
region of OD and OC for the screening of Glaucoma disease.                     are replaced by the pixels of the retinal vessels. After that,
In the preprocessing, green and red channels are used for                      adaptive thresholding is implemented. Subsequently, for the
the OD and OC respectively. Then morphological operation                       segmentation of OD, CHT and the geodesic active contour is
(i.e. closing) is used. The fuzzy c-mean clustering is used                    employed. The shortcoming of this technique is that OD with
to segment the OD and OC. Finally, in order to improve the                     smaller and larger size is not taken into account.
performance, canny edge detector and CHT is implemented.                          In [74], Cheng et al. proposed sparse density technique
   Khalid et al. proposed an algorithm in [71], for the seg-                   that is based on dissimilarity. In this technique, three methods
mentation of OD and OC that is based on fuzzy clustering.                      are used which are active contour model, super pixel clas-
At first, ROI is extracted, and values (i.e. min, max) and mean                sification and elliptical hough transform (EHT) used in the
are estimated in the preprocessing step. In the green channel,                 sequence. Super-classification based technique outperformed
contrast is better as compared to other channels. Therefore,                   the other two methods. Initially, blood vessels are eliminated
green channel is used where morphological operations such                      using morphological operations and non-uniform illumina-
as dilation and erosion are used to eliminate the vessels. For                 tion is improved by linear mapping. The surface fitting and
the segmentation, fuzzy c mean clustering is implemented                       the sparsity terms are applied for the dissimilarity score that
based on the sum of square using weighting membership                          is used in the coding of sparse dissimilarity constraint for the
functions. The evaluating parameters including sensitivity,                    segmentation of OD. Least angle regression (LARS) offered
accuracy, specificity and F-score are computed. For the vali-                  by this technique is applied to address the unconstraint opti-
dation, receiver operating characteristics with CDR are used.                  mization problem. Finally, ratio is calculated between the
In this technique, CDR above 0.3 is considered as unhealthy.                   CDRs (i.e. manual and the reference).
The drawback of this technique is that it does not perform
well in terms of accuracy.                                                     F. COMPONENT BASED TECHNIQUES
                                                                               In [75], Kavitha et al. proposed a component based method
E. ACTIVE CONTOUR/SHAPE MODEL BASED TECHNIQUES                                 to segment the region of OD and OC. In the preprocessing,
Charastek et al. presented an algorithm based on active con-                   morphological operations (i.e. dilation and erosion) are used
tour to segment the OD. Initially, to improve the shading,                     for elimination of blood vessels in the red and green channel
retinal image is normalized and non-uniform illumination is                    of the image. Then ROI is extracted and component set based
estimated using median filtering. Then, ROI is extracted from                  technique is applied for the segmentation of OD and OC.
the retinal image. With the help of Euclidean distances that                   In this technique, neuroretinal rim is assessed using ISNT
were used in the thresholding of pre-processed retinal image,                  rule. At the end, CDR and disc damage likelihood (DDLS)
the differences in the geometrical features are estimated for                  are used for the diagnosis of Glaucoma disease.
eliminating the retinal blood vessels and the noise from the                      In [51], Wong et al. presented a fusion based technique
image. Active shape model is implemented for segmenting                        to detect the OC for the analysis of Glaucoma. To segment
the OD followed by CHT for OD extraction. The CTREE,                           the region of OC, histogram is analyzed based on color
LDA and bagging based classifiers are used for the classifi-                   intensity of vascular architecture. Ellipse fitting is performed
cation of healthy and unhealthy retinal images.                                to reshape the boundary of OC and CDR is estimated. Sub-
   In [72], Yuji proposed a methodology which implements                       sequently, classification of healthy and unhealthy segmented
the information of vessel bends for the detection of OC. The                   images are performed using SVM and NN based classifiers.
blood vessels are eliminated from the blue channel of retinal                     In [76], a technique based on vessel curves is presented
image, and then to detect the edges of the OC, zero cross-                     by Wong et al. for the segmentation of OC. ROI is detected
ing is applied. Afterward, for the final segmentation of OC,                   from OD, and wavelet transform for the interested patch is

VOLUME 9, 2021                                                                                                                           37319
F. Abdullah et al.: A Review on Glaucoma Disease Detection Using Computerized Techniques
achieved using wavelet analysis in the green retinal channel. region. It can be computed as
In order to strengthen the weak edges, canny edge detector
2 × Area (A ∩ B)
is used. The values of the wavelet are used to combine the dm = (4)
feature maps that include the information of the color and Area (A) + Area (B)
the gradient in both channels (i.e. red and green). Moreover, where dm shows the dice metric. A shows the segmented
SVM based classifier is used to classify the candidate as region and B show the groundtruth region. The high value of
vessels and non-vessels. The least square technique is used dice shows the better performance of the proposed algorithm.
to get curvature, angular difference of the candidates and the
highest curvature. Then, Angular gradient of the static vessel E. F-SCORE
bends is computed. Subsequently, nasal points, inferior and It is a degree of accuracy that ranges between 0 and 1. The
the superior region are detected in order to mark the curves value that is closer to 1 shows the better performance. It can
in the temporal region, for the segmentation of OC. Finally, be estimated as
to smooth the boundary of OC, ellipse fitting is performed.
2 Areaseg ∩ Areagt
Fscore = (5)
VI. PERFORMANCE METRICS Areaseg + Areagt
There are many evaluation parameters that have been used where Areagt shows the area of groundtruth and the Areaseg
for computing and analyzing the effectiveness of the pro- indicates the segmented area.
posed algorithm. In this section, the evaluation parameters are
described as follows. F. OVERLAP AREA RATIO
It is ratio that provides the information about the overlapping
A. SENSITIVITY of the region that how much segmented region overlaps the
Sensitivity (Se) shows the capability to accurately detect the groundtruth region. Greater value of this ratio shows the
correct pixels. It can be calculated as better performance. It can be calculated as
SN = TP/TP + FN (1) Aseg ∩ Agt
m1 = (6)
Aseg ∪ Agt
where TP shows the true positive and FN shows the false
negative. TP region shows that the region of OD or OC where m1 shows the overlap area ratio. Agt shows the area of
is actually present there, and algorithm detects it correctly. groundtruth and Aseg shows the area of the segmented region
Whereas, FN shows that there is no region of OD or OC but by the proposed algorithm.
algorithms did not detect it correctly. Higher the sensitivity,
better will be the performance of the proposed algorithm. G. NON-OVERLAP AREA RATIO
It is ratio that provides information about the dissimilar area
B. SPECIFICITY between groundtruth region and the segmented region. Lower
Specificity (Sp) shows the capability to accurately detect the value of this ratio shows the better performance. It can be
pixels that are not part of the region. It can be calculated as estimated as
Aseg ∩ Agt
Sp = TN /TN + FP (2) m2 = 1 − (7)
Aseg ∪ Agt
where TN shows the true negative and FP shows the false
where m2 shows the non-overlap area ratio.
positive. TN region shows that the region of OD or OC
does not exit and the system predicts it correctly. FP region
H. CORRELATION COEFFICIENT
shows that the region of OD or OC does not exist and the
system did not predict it correctly. The algorithm shows better It is the degree of strength that shows the linearity in relation-
performance if there will be more value of specificity. ship between the values of two variables and its value ranges
between 0 and 1. If the value is closer to 1, it shows the better
performance of the proposed algorithm. It can be computed
C. ACCURACY
as
Accuracy (Acc) provides the information that how accurately P P P
the groundtruths matches the segmented result. The improved n xy − x y
r=p P (8)
accuracy shows better outcome of the proposed algorithm.
p P
n x 2 − x 2 n y2 − y2
P P
It can be computed as
where r shows the correlation coefficient. The x and y, both
Acc = Se + Sp/2 (3) are the variables, and n shows the total number of observation.
D. DICE I. RELATIVE ABSOLUTE AREA DIFFERENCE
Dice is a measure that provides the information regarding It shows the relative variation among two regions i.e.
the similarity between the groundtruths and the segmented groundtruth and the segmented region. Minimum value of the
37320 VOLUME 9, 2021F. Abdullah et al.: A Review on Glaucoma Disease Detection Using Computerized Techniques
relative area difference shows the better performance by the 98.51% on MESSIDOR, DRIONS-DB and ONHSD datasets
proposed method. respectively.
VDseg - VDref
rad = (9) 3) ILM CONTOUR OPTIMIZATION
VDref To enhance the accuracy for extraction of ILM layers,
where rad shows the relative area difference. The VDref shows Khalil et al. [65] introduced an unprecedented technique.
the vertical diameter of the reference groundtruth and VDseg ILM layer contour is also optimized using a contemporary
shows the vertical diameter of the segmented OD. approach in this technique. Addition to that, RPE level end-
point average values were made base to analyze cup edges as
J. CDR ACCEPTIBILTY a criterion. The method achieves the specificity of 95.00%,
It shows the acceptability difference between the two CDR accuracy of 94.00% and sensitivity of 93.00% on the dataset
i.e. CDR that is clinically acquired and the CDR that is of Armed-Forces-Institute-of-Ophthalmology (AFIO).
computed. The acceptable CDR must be less than 0.2, if it
is above, the deviation among CDRs will not be acceptable. 4) ADAPTIVE HISTOGRAM EQUALIZATION
A computerized diagnostic system which comverts color
CDRacc = CDRclinical − CDRcal ≤ 0.2 (10)
images to gray using adaptive histogram equalization is pre-
where CDRacc shows the acceptable CDR. The CDRclinical sented by Acharya et al. [60]. This novel technique follows
and the CDRcal are clinical and calculated CDR respectively. the filtering banks Schmid (S) MR8, MR4 and Leung-Malik
(LM). Textons are the micro structures found in the typical
K. ERROR images. To extract features of local configuration pattern
The error E between segmented and groundtruth area can be (LCP), these textons are utilized. The (LCP) features are
computed as considered to be important and are picked up by SFFS method
Area (S ∪ G) using the statistical t-test. Different kind of classifiers were
E =1− (11) used for classification of glaucoma and normal classes of
Area (Seg ∩ G)
images. (GRI) Glaucoma index was also enveloped to make
where S represents the segmented region and G represents the the process robust. This method achieved a high classification
ground truth region. accuracies of 95.80%.
VII. STATE-OF-THE-ART METHODS 5) NON-PARAMETRIC AND OPTICAL GIST DESCRIPTOR
A. UNSUPERVISED METHODS Nonparametric and optical GIST descriptor were used as a
1) OD SEGMENTATION USING RANDOM WALK Algorithm technique to detect glaucoma proposed by Raghavendra et al.
On the basis of random walk algorithm, an enhanced version [79]. This method suggests novel segmentation of optical
of OD segmentation was proposed by Panda et al. [77] disc which is achieved on the basis of the space covered
where new weight composite function is measured by the by Rt (radon transformation). Light levels change gets com-
integration of Gabor texture energy feature and finding the pensated through MCT (modified census transformation) of
mean curvature which is the key role of this algorithm. images obtained from Rt (radon transformation). The MCT
Apart from the contortion in the model, suggested algo- images are forwarded to GIST descriptor to conceive spec-
rithm continues with a local energy problem to be minimum trum of energy of spatial envelope. The method achieves the
and without the curve to be initialized. Performance of the specificity of 95.80%, accuracy of 97.00% and sensitivity
suggested method is analyzed with MESSIDOR, DRIVE, of 97.80%.
DRISHTI-GS and DIARETDB1 databases. The method
achieves specificity 99.83%/99.80%/99.66%/99.94%, pre- 6) VARIATIONAL MODES DECOMPOSITION
cision 92.57%/95.74%/94.41%/93.60% and sensitivity Maheshwari et al. [80] automated the diagnosis process.
91.67%/92.03%/95.52%/91.68%. OD detection cases had VMD ( Variational modes decomposition) was utilized for
problems as well, as when the disease was detected the OD the decomposition of images. Several different features were
limit used to become extremely smooth or discontinuous. obtained through VMD elements, such as Yager entropy,
Kapoor entropy, Renyi entropy and fractal dimensions. Clas-
2) CONTOUR ESTIMATES AND OD HOMOGENIZATION sification selection was done through Relief F algorithm.
Naqvi et al. [78] came up with a method to resolve Same features were fed to method classification for least
these issues based on corresponding contour estimates and square support vector machines (LS-SVM). The method
OD homogenization. To achieve this for the unregulated achieves 95%/19% and 94%/79% as classification accuracies
OD boundary detections, gradient independent activates utilizing three-fold and ten-fold CV strategies.
the contour also for the approximation of OD boundary,
and local Laplacian vascular filters are used. The method 7) MULTIPLE DISC DETECTION AND LOCALIZATION
achieves specificity of 98.96%/98.00%/98.85%/ accuracy of Texture and statistical features were utilized on the basis of
94.86%/91.30%/93.64%/ and sensitivity of 98.60%/96.72%/ regions found in retinal fundus images where a multiple disc
VOLUME 9, 2021 37321F. Abdullah et al.: A Review on Glaucoma Disease Detection Using Computerized Techniques TABLE 2. Performance measures of unsupervised methods for optic disc and optic cup extraction. detection and localization was done through a method pro- 8) MULTI-LAYER PERCEPTION WITH 12-D VECTOR posed by Rehman et al. [81]. Analysis and comparisons were A correction of his previous work was presented in done on four of the classifiers where based on common fea- Zahoor et al. [82] where it only showed robust and fast OD tures the most distinctive features were chosen. The method segmentation which is the first step in segmentation pipeline achieves some remarkable accuracies of 98.80%,99.30% and of retinal images. In this corrected article, another phases 99.30% on ONHSD, DRIONS and MESSIDOR databases for glaucoma detection is presented. To emphasize area of respectively. OC and the NRR, preparation of segmented OD is made. 37322 VOLUME 9, 2021
F. Abdullah et al.: A Review on Glaucoma Disease Detection Using Computerized Techniques

Moreover, a 12-D vector with a multi-layer perception was                      method was developed. On the ultimate screening, some great
utilized to classify pixel based OC segmentation. The ratio                    outcomes were received. This approach has low computa-
for cup to disc is determined by OC, OD segmentation which                     tional and maintenance costs and can be applied on Mobile
also extracts the other contextual features. Ensemble sub-                     health systems. The methodology was applied on DRISHTI-
space classifier was utilized on the basis of decision tree to                 GS1 dataset. With the help of trained specialists, fifty reti-
distinguish between non-Glaucomatous and Glaucomatous                          nal images were provided. On final glaucoma diagnosis and
images. The method achieves the specificity, accuracy and                      screening, the method achieves the accuracy of 98%.
sensitivity of 99.87% 99.70% and 84.00% for RIM-ONE
dataset and 98.01%,96.90%, and 91.52% for HRF.                                 13) OD SEGMENTATION USING RED CHANNEL SUPER PIXEL
                                                                               AND CIRCULAR HOUGH PEAK VALUE SECTION
9) ANISOTROPIC COMPLEX DUAL TREE WAVELET                                       Geeta et al. [87] came up with an advanced approach relating
TRANSFORMATION                                                                 to their previous works for localization and segmentations
Based on anisotropic complex dual tree wavelet transforma-                     of retinal fundus images in optic discs. They utilized red
tional features and cup to disc ratio, Kausu et al [83] came                   channel super pixel and circular hough peak value selection
up with a new methodology for identifying glaucoma. Using                      in improved ways for segmentation, while for localization,
Otsu thresholding and Fuzzy C-Means, the process of clus-                      to detect diseases in fundus images, a method of calcu-
tering optic disc segmentation was achieved. With the help of                  lation through pixel density was used. The technique was
multi layered perception model, the proposed technique was                     applied on INSPIRE, CHASE-DB1, viz. HRF, DRISHTI-
able to achieve the sensitivity of 98.00% and the accuracy                     GS1, MESSIDOR, DRIVE, ONHSD and DRIONS datasets.
of 97.67%.                                                                     This technique gave better results when compared to current
                                                                               techniques for localization and segmentations. The proposed
10) OD SEGMENTATION AND LOCALIZATION                                           method achieves high accuracies of 99.5% for segmentation
In another approach introduced by Khan et al. [84], a com-                     and 99.93% for localization of optic discs.
prehensive attention was given to segmentation and OD local-
ization. In the methodology de-hazing phenomena was used                       14) THRESHOLDING BASED DETECTION COMPUTATION
to enhance the image and then was cropped to the OD area.                      Carrillo et al. [88] also came up with an automatic glaucoma
Transformation of image was done to HSV and for the detec-                     detection technique. He designed the algorithm in such a way
tion of OD, V was utilized. Using a Laplace transforming                       that can do all the computations for the detections. This work
cultivated region, the vessels which were extracted from the                   was all new and was based on thresholding of the cup for
Green channel with the help of multi-line detector, were                       segmentation mainly. Moreover, a novel measure was also
removed. In region, growing and local adaptive thresholds                      introduced which calculates the sizes of the discs and cups to
Binarization is always applied. Area and eccentricity, the two                 get more accurate results. This multi-tasking of the algorithm
regions enabled the detection of true OD region. Ellipse fit-                  of getting the thresholds and the sizes simultaneously actually
ting method was used to fill the region. The method achieves                   ended up giving improved results for the segmentation of
the accuracies of 99.00 % and 100% on MESSIER and DRI-                         disc as compared to the techniques available. In collaboar-
ONS databases respectively.                                                    tion with Center of Prevention and Attention of Glaucoma,
                                                                               Bucaramanga in Colombia, the author was able to achieve
11) COMBINATION OF TEXTURAL AND STRUCTURAL                                     the accuracies of 88.50 % for Glaucoma detection.
FEATURES
A new methodology is proposed by Khalil et al. [85] that                       15) CONTRAST LIMITED ADAPTIVE HISTOGRAM
combined textural and structural features which was a more                     EQUALIZATION AND FILTER INTEGRATION
reliable CAD system. The system is designed to make the                        Contrast enhancement and noise removing was achieved in
decision making process more efficient after a detailed anal-                  a work by Sonali et al. [89] for fundus images. CLAHE
ysis of several conditions of glaucoma. The model is based on                  (contrast limited adaptive histogram equalization) and fil-
HTF (Hybrid texture Feature set) and HSF (Hybrid Structural                    ters integration techniques were used to enhace the color,
Feature Set) as the two main modules of the system. This                       moreover, to remove de-noising found in the fundus images.
new system is also capable of detecting damaged cup which                      Proposed methodologies efficacy was analyzed through dif-
resulted super seeding the best sensitivity by reaching 94%.                   ferent parametrs of performance like CoC (Correlation coeffi-
Two different channels are used to segment discs and cups,                     cient, SSIM Structural similarity index, EPI (Egde prevention
none the less, cup to disc ratio comparison method is used to                  index) and PSNR (Peak signal to noise ratio). The presented
get better accuracies. When comparing glaucoma, outstand-                      method achieves some better percentages for all of the men-
ing outcomes were achieved with 100 percent accuracy.                          tioned performance measures when compared with the state
                                                                               of the art methods by applying on MESSIDOR dataset where
12) AUTOMATED GLAUCOMA DIAGNOSIS AND SCREENING                                 0.12% improvement in CoC, 1.19% improvement in SSIM,
In a technique proposed by Amed Mvoulana et al. [86],                          1.28% improvement in EPI and a big improvement of 7.85%
for diagnosis and screening of glaucoma, a fully automated                     in PSNR was achieved.

VOLUME 9, 2021                                                                                                                          37323
You can also read