Broadening Urban Investment to Leverage Transit (BUILT) in Cleveland - Center for Neighborhood Technology April 2011
←
→
Page content transcription
If your browser does not render page correctly, please read the page content below
Broadening Urban Investment to Leverage Transit (BUILT) in Cleveland

Center for Neighborhood Technology
April 2011
Greater Cleveland is at a turning point. Unemployment in the region has remained above 9 percent since 2009.
Declines in automobile manufacturing have sent shockwaves of job loss rippling through the region’s suppliers
and producers. Facing unemployment, rising gas costs, and economic uncertainty, homeowners have fallen
behind on mortgages and entered foreclosure. Now, more than ever, the state’s infrastructure investments
must bolster the economy and save its residents money.

Despite its troubles, the region remains a powerhouse. According to the U.S. Bureau of Economic Analysis,
Greater Cleveland generated $104 billion dollars of economic activity in 2008 – 22 percent of Ohio’s Gross State
Product. Yet investments in automobile-centric infrastructure have undermined this sizable economy, rather
than reinforced it. In an environment where highways have fostered extensive greenfield development, CNT has
found that:
    • Homebuilders constructed 48,831 more units than the market could support, just since 2000.
    • Residents spend more than eight billion dollars per year just to cover their transportation needs — gas
        alone siphons more than one billion dollars of wealth out of the local economy.
    • Foreclosures have spread to neighborhoods with high transportation costs, where as many as one in
        three properties are overleveraged and the possibility of default runs high.
    • National investors rank Greater Cleveland near the very bottom as a market for multifamily and mixed-
        use development.
    • Retirees and younger workers will demand more compact development through 2030, but as a whole
        these kinds of developments are in short supply in Cleveland.

At the same time, Greater Cleveland possesses enviable assets that could be mobilized towards an
environmentally sustainable form of growth:
    • Downtown Cleveland and University Circle anchor the regional economy, with ample room to grow
         within the central business district and along Euclid Avenue,
    • Forty-four miles of rail and bus rapid transit offer connections between downtown and much of the rest
         of the region.
    • The Port of Cleveland could save shippers fuel and spark investment in the form of Cargo-Oriented
         Development.
    • Opportunities for transit-oriented development exist around Public Square, University Circle, and West
         Side Market.

Now is the time to act. The federal commitment to urban sustainability has created long-needed tools to spur
economic development in a fiscally and environmentally responsible way. The federal Sustainable Communities
partnership between USHUD, USDOT and USEPA, the TIGER grant program administered by USDOT, and a
proposed national infrastructure bank all favor urban investments that create jobs while reducing carbon
emissions and improving livability. For communities across Northeast Ohio, these resources represent a new
way forward.

This report presents a policy blueprint to make these opportunities a reality. In a time of strapped budgets,
municipal governments, regional planners, business advocates, foundations, and non-profits must work together
to maximize the impact of their efforts. With coordinated action, Greater Cleveland can forge a new, sustainable
future centered on its transportation assets, economic strengths and resourceful residents.

Sincerely,

Scott Bernstein                  Kathryn Tholin
President                        Chief Executive Officer

BUILT in Cleveland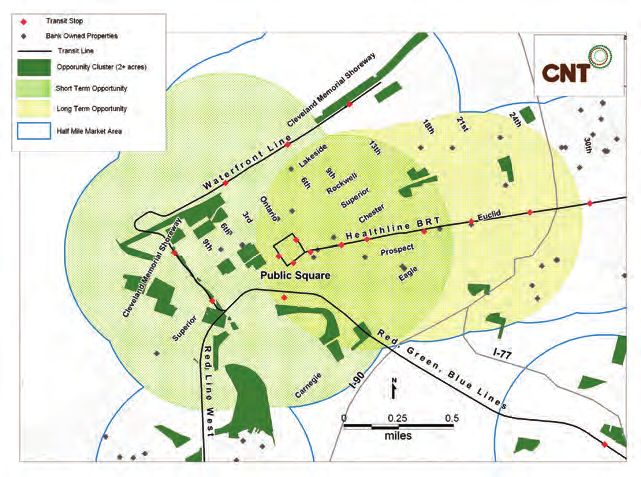
Table of Contents

CLEVELAND’S SUSTAINABLE GROWTH CHALLENGE .................................................................................. 1
   THE WIDENING GAP BETWEEN HOUSING SUPPLY AND DEMAND........................................................................ 1
   SUBURBAN EXPANSION IS STRETCHING GOVERNMENT BUDGETS........................................................................ 2
   TRANSPORTATION COSTS ARE SIPHONING DOLLARS FROM THE LOCAL ECONOMY .................................................. 3
   GAS COSTS EXPOSING CLEVELAND HOMEOWNERS TO MORE FORECLOSURES ........................................................ 6
   2030 FORECASTS PROJECT BUSINESS AS USUAL ............................................................................................. 8
A CHANGING HOUSING MARKET........................................................................................................... 10
   NATIONAL INVESTORS PREFER URBAN DEVELOPMENT ................................................................................... 10
   DEMOGRAPHICS SPUR DEMAND FOR MIXED-USE RENTAL HOUSING ................................................................. 11
   CLEVELAND MARKET FOR MIXED-USE IS UNTAPPED ..................................................................................... 12
RESILIENCE AND GROWTH IN A WEAK ECONOMY ................................................................................. 14
   OPPORTUNITIES FOR GROWTH AMID SYSTEMIC WEAKNESS ............................................................................ 14
   SOME CLEVELAND INDUSTRIES SHOW RESILIENCE AND GROWTH...................................................................... 14
   “OLD” AND “NEW” INDUSTRIES PROVIDE BALANCED ECONOMIC GROWTH ........................................................ 16
   JOB DENSITY CAN LEAD TO INNOVATION .................................................................................................... 16
   ECONOMIC ACTIVITY IS CLUSTERED AROUND JOB CORRIDORS ......................................................................... 17
   JOB CORRIDORS CREATE AND CIRCULATE REGIONAL WEALTH.......................................................................... 18
FREIGHT ASSETS COULD SUPPORT CARGO-ORIENTED DEVELOPMENT.................................................... 20
   THE GREAT LAKES: UNDERUTILIZED ASSET, EMERGING OPPORTUNITY ............................................................... 20
   CLEVELAND’S WATER FREIGHT ADVANTAGE................................................................................................ 21
   CARGO-ORIENTED DEVELOPMENT BUILDS ON EXISTING ASSETS ....................................................................... 21
   CUYAHOGA RIVER, COD ANCHOR ............................................................................................................ 23
STRONGEST MARKETS FOR TRANSIT-ORIENTED DEVELOPMENT ............................................................ 25
   TRANSIT CONNECTIONS CAN SPUR INVESTMENT .......................................................................................... 25
   UNIVERSITY CIRCLE: REGION’S BEST BET FOR TOD ....................................................................................... 27
   DOWNTOWN: CREATING AFFORDABILITY THROUGH REINVESTMENT ................................................................. 28
   OHIO CITY: WEST SIDE MARKET CAN ANCHOR A UNIQUE MARKET DISTRICT ...................................................... 29
A SUSTAINABLE GROWTH STRATEGY FOR CLEVELAND ........................................................................... 30
   SET NEW BENCHMARKS FOR PUBLIC INVESTMENTS AROUND H+T .................................................................... 30
   CONNECT PEOPLE, JOBS, AND TRANSIT ...................................................................................................... 30
   TURN CLEVELAND’S FREIGHT ADVANTAGE INTO COD.................................................................................... 31
   DIVERSIFY THE REGION’S HOUSING CHOICES THROUGH TOD .......................................................................... 32
BIBLIOGRAPHY ..................................................................................................................................... 34

BUILT in Cleveland
Cleveland’s Sustainable Growth Challenge
In 2009 and 2010, the Office of Governor Ted Strickland and the Center
for Neighborhood Technology formed a partnership with regional
leaders in Cincinnati, Cleveland, and Columbus. The project, called
BROADENING URBAN INVESTMENT TO LEVERAGE TRANSIT (BUILT) IN OHIO,
sought to identify smart growth strategies for each region by building
on existing urban assets. Leaders in Northeast Ohio convened twice to
discuss the impact of recent development trends and a policy blueprint
for a new way forward. This report is an outcome of those discussions.

The Widening Gap Between Housing Supply and Demand

Greater Cleveland is building homes without adding people. According to the U.S. Census Bureau, the
Northeast Ohio Areawide Coordinating Agency (NOACA) service area of Cuyahoga, Geauga, Lake, Lorain,
and Medina Counties declined in population from 2.3 million to 2.1 million between 1970 and 2008, a net
loss of 225,362 residents. Like most Americans, Clevelanders have tended to raise smaller families than
previous generations, so the number of households increased by 113,607. These smaller households
needed their own homes and apartments, so the region added new housing units as the population shrank.
This was sustainable so long as the rate of household growth paralleled that of home construction.
Ultimately, new household formation didn’t keep pace and the net growth in housing units numbered
191,034 — more than a unit and a half for every new household.

        Net Population, Household, and Housing Unit Growth, United States Census, 1970 – 2008
                                            30%
                                                   Population %
                                            25%
                                            20%    Household %
                        Rate of Increase

                                            15%    Housing Units %
                                            10%
                                             5%
                                             0%
                                            -5%
                                           -10%
                                           -15%
                                                  1970        1980    1990          2000      2006-2008
                                                                      Year

                              Source: U.S. Census, 2006-2008 American Community Survey 3-Year Estimates

          Since 1970, Greater Cleveland has produced more housing than household growth warranted.
                    After 2000, the gap between supply and demand expanded dramatically.

Out-migration to Geauga, Lake, Lorain, and Medina Counties accompanied this overproduction of housing.
Cuyahoga County lost 16,640 net households, while these surrounding counties added a net 130,247
households. In the City of Cleveland, population declined by 47 percent. As households have moved from
one community to another, they have left behind a glut of abandoned properties and underutilized
infrastructure. A report by the Brookings Institute found that between 1982 and 1997, the amount of
urbanized land in the Cleveland and Akron regions increased by 32 percent, while density decreased by 24
percent.

BUILT in Cleveland                                                                                        1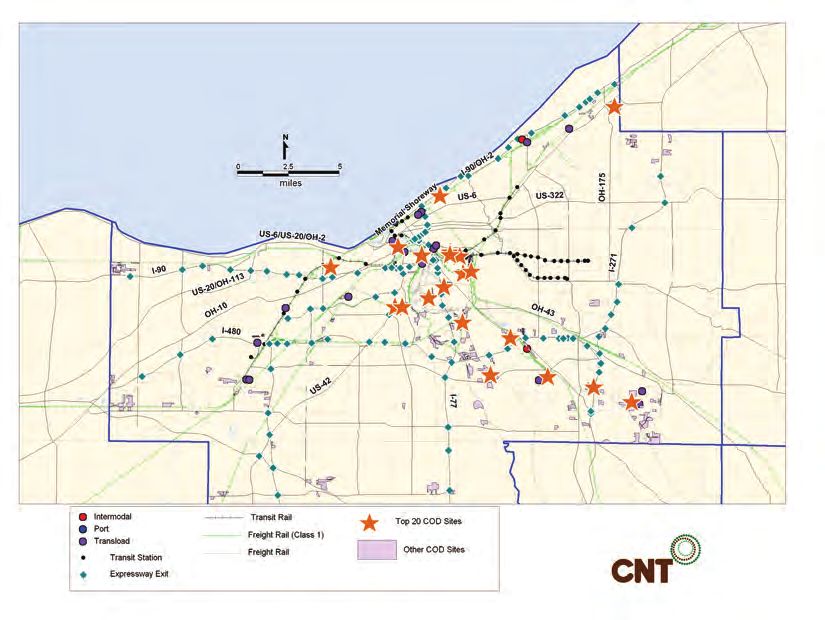
This “development without growth” pattern accelerated after 2000. The U.S. Department of Agriculture’s
Census of Agriculture reports that the area lost 125 square miles of farmland between 2002 and 2007, over
one and a half times the land area of the entire City of Cleveland. But while the region built 32,911 homes
between 2000 and 2007, it lost 51,672 households and 94,407 jobs. As a result, the number of vacant units
doubled in the region and increased in all five counties.

Overproduction of housing was exacerbated by a mismatch in the type of housing supplied and in demand.
Since 2000, every county has added thousands more single family homes than families to occupy them. In
Cuyahoga County, the total number of families dropped by 42,526 but the number of single family
detached properties increased by 11,769. Throughout Greater Cleveland, homebuilders developed
properties out of sync with demographic trends. Even Medina County, which experienced the region’s
largest net increase in families, added more single family homes than it needed.

            Net Change in Total Families and Total Single Family Detached Homes, 2000 –2008

                       20,000
                                      11,769                                    10,755
                                                                                              7,005
                       10,000                       2,651          5,215                  4,652
                                                  197                       1,649
                             0
                                                              -2,151
                       -10,000

                       -20,000

                       -30,000

                       -40,000
                                                                        Families
                                 -42,526
                       -50,000                                          Single Family Detached

                       -60,000
                                  Cuyahoga        Geauga         Lake         Lorain        Medina

                          Source: U.S. Census, 2006-2008 American Community Survey 3-Year Estimates

         The region added 37,395 single family homes even as the number of families dropped by 38,179.

Suburban Expansion Is Stretching Government Budgets

Forty years of development without growth have pushed the Cleveland region to the brink of fiscal crisis.
Although the region lost more than 200,000 people between 1970 and 2008, communities with fewer than
50,000 residents, as well as unincorporated communities, experienced significant gains. This redistribution
has spawned a landscape of small municipalities with limited economic development or land use planning
capacity that often provide duplicative services across arbitrary boundaries and produce a net fiscal drain
on the region, with sixty cities, villages, and townships in Cuyahoga County alone. The Brookings Institute
found that fragmentation of governments creates a “staggering array of costs” with “duplicate
infrastructure, staffing, and municipal services” that could be delivered cheaper at a broader scale. Today,
local governments are the single biggest employer in the Cleveland region.

BUILT in Cleveland                                                                                        2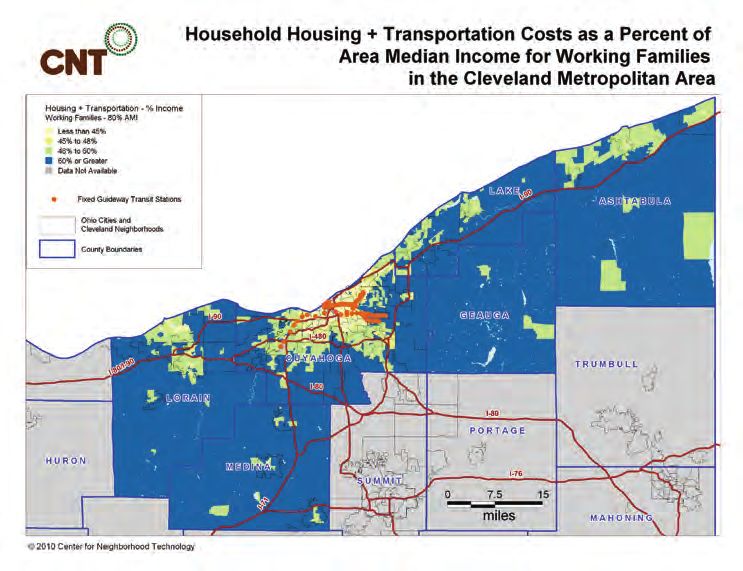
Percent Change in Per Capita Aggregate Government Revenues,
                              Expenditures and Debts by County, 1997 - 2002
                          180%
                                 Revenue
                          160%
                                 Total Expenditures
                          140%
                                 Interest on Debt
                          120%

                          100%

                           80%

                           60%

                           40%

                           20%

                           0%
                                  Cuyahoga          Geauga       Lake          Lorain   Medina
                          -20%
                                             Source: Fund for our Economic Future

   The costs of infrastructure and services for new development cut across county, municipal, and school district
     budgets. No county saw aggregate revenues keep pace with increases in expenditures and debt interest.

Suburban expansion requires new roads, new sewers and new schools, but Greater Cleveland’s local and
county governments have not kept pace with financing that new infrastructure. According to data
compiled by the Fund for Our Economic Future between 1997 and 2002, expenditures and debt payments
outran population increases in every county in the NOACA region when aggregated across different units of
government, up to and including the county. Combined revenues also increased, but it was not enough to
sustain these costs. Across the region, total government debt interest increased by 46 percent. These
trends are not sustainable.

Transportation Costs Are Siphoning Dollars from the Local Economy

Greater Cleveland’s housing market is generally seen as affordable. Several stakeholders interviewed for
this project identified low housing costs as a competitive strength for the regional economy. In the
Cleveland-Lorain-Elyria Primary Metropolitan Statistical Area, which includes the NOACA region as well as
Ashtabula County, a typical household earning the Area Median Income (AMI) of $42,089 spent
approximately 28 percent of its income on housing costs. This sits below the generally accepted 30 percent
affordability benchmark for housing costs as a share of income. In reality, infrastructure investments have
exposed households in Greater Cleveland to escalating transportation costs and little transportation choice.

Of course, housing costs vary greatly from community to community. Virtually every neighborhood in the
City of Cleveland and its older suburbs provide affordable housing to households earning AMI. However,
bedroom communities in Lorain, Geauga, Medina, and Lake Counties may be out of reach for some
Clevelanders. In total, 601,790 (67 percent) of the region’s 892,453 households reside in neighborhoods
with average housing costs affordable to those earning AMI. This places Cleveland right at the average
among the nation’s metropolitan areas.

However, this traditional view of housing affordability fails to consider the cost of transportation, which
represents a household’s second largest expenditure and varies greatly from one neighborhood to another.
In compact, mixed-use, transit-rich communities, where homes are located near schools, shopping, and
work, housing is more expensive but because residents own fewer cars, walk and bike more, and ride public
transit more often, they pay less for the combined cost of housing and transportation. Households living in

BUILT in Cleveland                                                                                                  3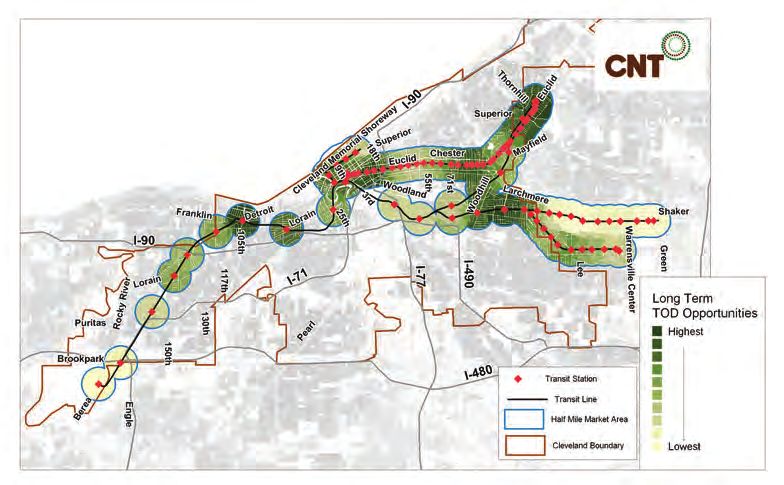
The Housing and Transportation (H+T ®) Affordability
                     Index analyzes the relationship between three dependent
                     variables (auto ownership, auto use, and transit use) and
                     nine main independent household and local environment
                     variables. Census block group level data on household
                     income (both average and median), household size,
                     commuters per household, journey to work time (for all
                     commuters, transit commuters, and non-transit
                     commuters), household density (both residential and
                     gross), block size, transit access, and job access were
                     utilized as the independent, or predictor variables.

                                    Under the traditional
                                    definition of housing
                                    affordability, seven out of ten
                                    households live in
                                    neighborhoods with average
                                    housing costs affordable to a
                                    household making the Area
                                    Median Income.

                                    Only four out of ten Greater
                                    Cleveland households live in
                                    neighborhoods where the
                                    combined cost of housing and
                                    transportation is at or below
                                    the H+T affordability
                                    benchmark of 45 percent of
                                    Area Median Income.

BUILT in Cleveland                                                    4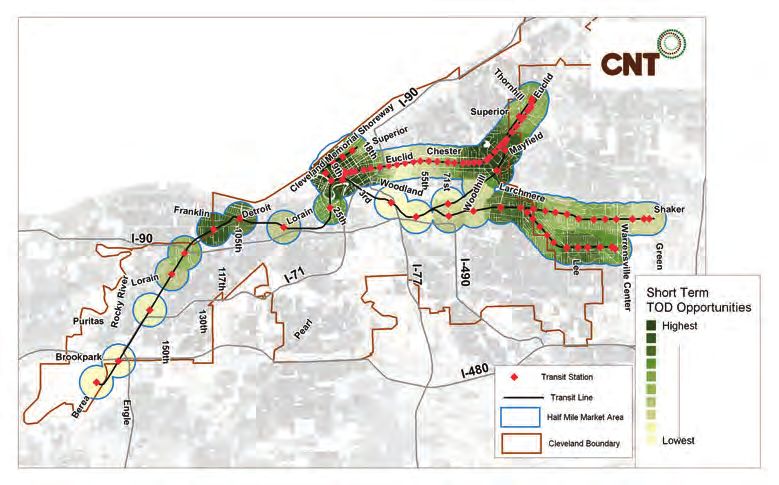
less dense communities lack these transportation options. These residents typically own more cars and
drive them further to commute to work, access commercial centers or run simple errands to the cleaners or
grocery store—dedicating as much as 30 percent or more of their income to transportation.

Based on research in 337 metropolitan areas, ranging from large cities with extensive transit networks like
Chicago, Illinois, to small metros with limited transportation options, such as Fort Wayne, Indiana, CNT
identified 15 percent of Area Median Income to be an attainable goal for transportation affordability.
When combined with housing costs, this translates into an H+T affordability benchmark of 45 percent.

In Greater Cleveland, high transportation costs shrink affordability dramatically. Shifting from the
conventional standard to the H+T definition, the number of households living in affordable communities
falls by 239,641 households, the 15th largest numerical drop in the nation. Neighborhoods with average
H+T costs below 45 percent are concentrated within the City of Cleveland, some of its early suburbs such as
Lakewood and East Cleveland, and other older settlements like Lorain and central Medina. Many of
communities enjoy robust transit service provided by the Greater Cleveland Regional Transit Authority
(GCRTA).

                                  Household Housing + Transportation Costs as a Percent of
                                  Income for Working Families (80 percent of AMI)

 Even fewer affordable options exist for moderate income households earning 80 percent of Area Median Income.
      Only 141,024 of the region’s 892,453 households with annual income of $33,671 live in neighborhoods
                              affordable for both housing and transportation costs.

For the typical working household earning 80 percent of AMI ($33,671), H+T affordability becomes very
difficult to achieve. At this income level, the average household in the region spends 60 percent or more of
their paycheck on housing and transportation. Although Cleveland’s fixed guideway and bus routes provide
ample transportation choice, only 54 percent of the city’s neighborhoods have H+T costs at or below 45
percent of this income level. Much of the city’s West Side exceeds this benchmark, including neighborhoods

BUILT in Cleveland                                                                                         5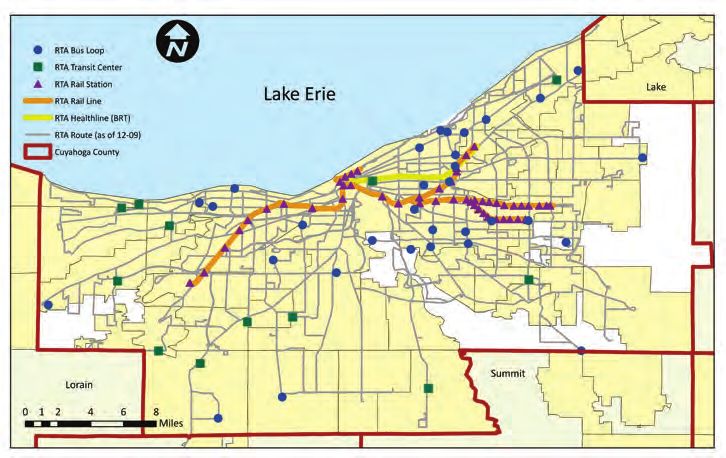
adjacent to the GCRTA Red Line. Outside Cuyahoga County, only 15 out of 586 neighborhoods meet this
affordability threshold, virtually all of which are located in Lorain County.

At 2000 gas prices, Cleveland households spent $8.5 billion in aggregate on private transportation each
year. But assuming the same travel behavior at 2008 gas prices, transportation expenditures would surge
to $10.2 billion annually. These increases stretch household budgets and leave Clevelanders with little
disposable income for investments in better housing, college savings, or retirement.

By 2008, rising fuel costs were siphoning $3.2 billion dollars in consumer spending out of the Cleveland
economy for petroleum products from other parts of the world. By comparison, according to the Bureau of
Economic Analysis, sales by Cleveland retailers accounted for $5.4 billion dollars in economic output in
2008 and 107,324 jobs — one out of eight in the regional economy. As households spend less of their
disposable income at neighborhood businesses and more of it at the pump, tens of thousands of local jobs
are at risk.

Gas Costs Exposing Cleveland Homeowners to More Foreclosures

Easy credit spurred a housing construction boom, allowed households to purchase homes beyond their
means and obscured the outmigration fueling the demand for housing. However, as the economy
weakened and job losses mounted, home foreclosures spilled outward from Cleveland’s weakest markets
into its automobile-oriented exurbs, all of which struggled to absorb the newly vacant units.

The subprime lending that took hold of Cuyahoga County’s low- and moderate-income communities during
the late 1990s and early 2000s offered some lower-income borrowers access to credit for the first time.
Cheap credit and more liberal down payment guidelines allowed first-time owners to purchase homes that
tested their financial wherewithal. But as monthly payments on these adjustable rate loans reset and
moved upward, Cleveland’s East Side, eastern Cuyahoga County, and the city of Lorain saw many properties
enter foreclosure in significant numbers, according to data on foreclosure proceedings and repossessions
provided by RealtyTrac.

BUILT in Cleveland                                                                                    6
Home foreclosures intensified in low and moderate income neighborhoods in Cuyahoga County,
                     but have spread to automobile-dependent communities that are exposed to increases in gas costs.

BUILT in Cleveland                                                                                                     7
As neighbors of these vacant REOs saw their home values fall below the original purchase price, their
options for refinancing dwindled and some of them entered foreclosure as well. In just four years, 41,714
properties entered the foreclosure process in Cuyahoga County alone. Three out of four remained in the
possession of banks as a real estate owned property (REO).
As gas prices rose above $4 per gallon in 2008 and the economy worsened, foreclosure proceedings in
surrounding communities with high transportation costs began to grow. In Geauga County, for example,
the number of foreclosed homes quintupled between 2007 and 2008 and then increased another threefold
between 2008 and 2009. Although the inventory of foreclosed homes in surrounding counties was smaller
than in Cuyahoga County in sheer numbers, these suburban neighborhoods struggled mightily to find new
owners for these properties.
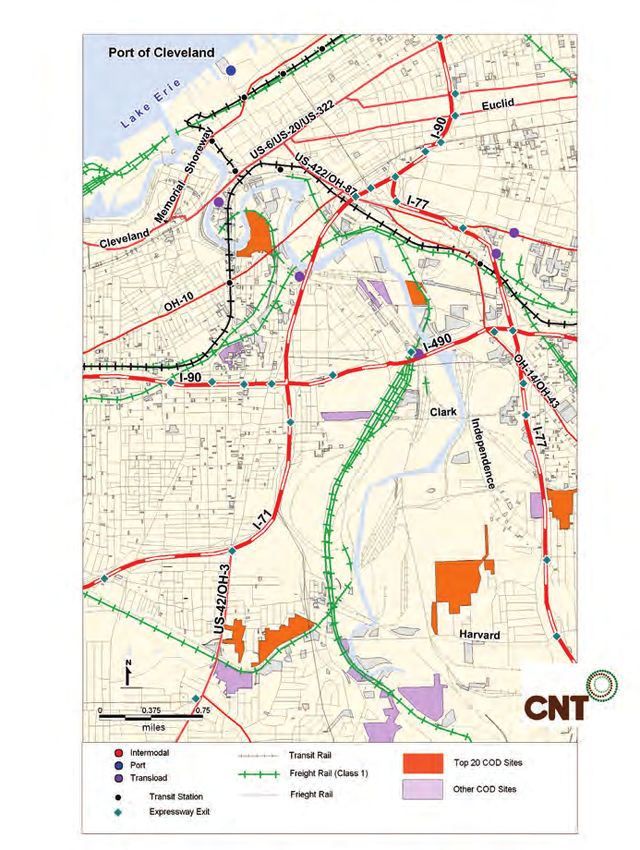
Many homes in these communities are overleveraged. As many as one in five occupied housing units in the
region’s newer neighborhoods holds a second mortgage or home equity loan. This circumstance needs
only a trigger like another spike in gas costs or wave of layoffs to cause a new cycle of home foreclosures
and declining property values.
In many outlying areas in Greater Cleveland, three in ten properties have either a second
mortgage or home equity loan. Should some of these homeowners fall behind on payments
because of job loss or higher fuel costs, another round of home foreclosures could unfold.
2030 Forecasts Project Business as Usual
“Sprawl without growth” has left Greater Cleveland with a legacy of vacant units, mounting transportation
costs, government debt, and tens of thousands of excess properties. Perversely, these development trends
hurt municipal revenues and cripple local capacity to regulate land use development and transportation
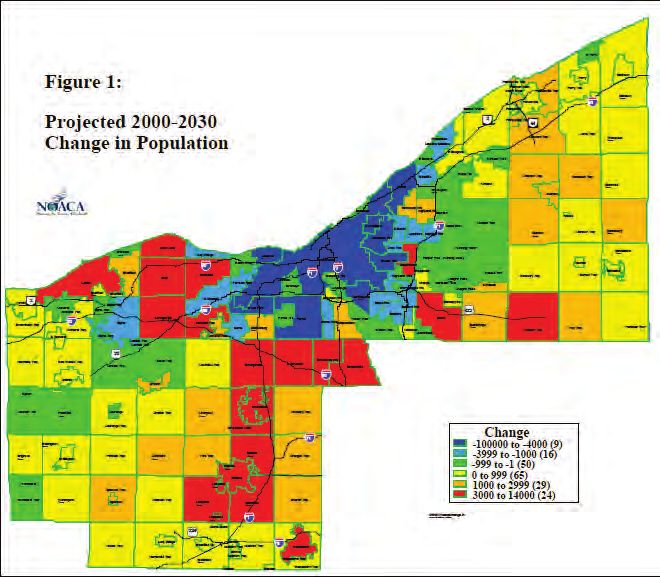
BUILT in Cleveland 8investments. Nevertheless, the Ohio Department of Development and NOACA project these trends to
continue through 2030. ODOD’s Office of Policy Research and Strategic Planning expects population flight
to continue from the core to the periphery, with little growth at the regional level. NOACA projects a
decline of 13,164 people and 5,642 households over the same period, with continued population and
household growth in outlying communities and unincorporated areas.
NOACA’s 2030 Connections plan projects that outmigration trends of the past five decades will continue,
giving the region little relief from ever-growing transportation costs and instability in the housing market.
Given that recent development patterns have put the entire region at risk, NOACA’s 2030 population
projections raise four key questions:
• How much more housing can the market absorb with 100,000 vacant units and tens of thousands of
REOs already on the market?
• Dispersal will continue to drive households, jobs, retail, and schools further apart and boost
dependence on the car. Gasoline price spikes single handedly wiped out a decade’s worth of
income increases. Can household budgets weather the gas price increases that will accompany the
dwindling supply of oil?
• Facilitating population movement requires additional infrastructure and government services at a
time when public costs and debt service increases outrun revenues. Can municipalities collectively
afford new investments out of a declining tax base, and will the region suffer from duplicative
services and infrastructure?
• Will developers consider an alternative set of real estate products given such a gloomy growth
scenario?
Outmigration is not inevitable. It is a historical trend, not a destiny. An inventive and adaptive smart
growth scenario can avoid these outcomes and create a new paradigm of growth in the 21st Century.
BUILT in Cleveland 9A Changing Housing Market
Greater Cleveland has paid the price for its development patterns, but it also has the opportunity to change
course. Nationally, real estate investors and homeowners have been moving away from single family
homes. Locally, demand will emerge for a more diverse mix of real estate products.
National Investors Prefer Urban Development
The national real estate crisis has caused more investors and property developers to focus on compact
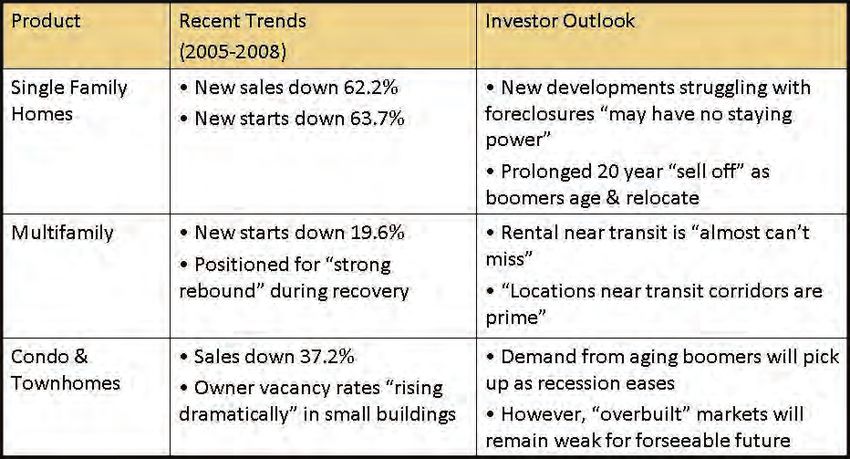
developments and urban neighborhoods. As the national credit bubble burst in 2007 and 2008, single-
family home development crashed nationally, just like it did in Cleveland. According to the Joint Center for
Housing Studies at Harvard University, sales of new single-family homes dropped by three fifths between
2005 and 2008, while the number of new single-family developments fell by slightly more. By contrast,
multifamily starts fell far less over these years.
In late 2009, the Urban Land Institute and PriceWaterhouseCoopers released Emerging Trends In Real
Estate 2010, a survey of developers and investors who believed that as long as the single-family market
remains soft, households will increasingly turn to rental housing. Investors see multifamily properties
strongly positioned in the economic turnaround. Of these, apartment buildings within walking distance of
transit are considered to offer the best return.
National investors see these urban infill and transit-supportive developments as strong bets to hold and
increase their value. Infill housing is projected to have the best development prospects for for-sale housing
in 2010, appealing both to young people striking out on their own and to their retiring parents hoping to
downsize from their family home. Investors also see older suburbs linked to downtowns through mass
transportation as appealing opportunities. Regions that create the environments for these products will be
best positioned to attract national capital. The 2011 edition of this report reinforced these findings.
The Great Recession is changing everything. National real estate professionals think that compact housing and
mixed-use neighborhoods will drive real estate investment once the economy improves.
BUILT in Cleveland 10Demographics Spur Demand for Mixed-Use Rental Housing
The transformation of the housing market will be driven by the preferences of the aging Baby Boomer
generation and the Echo Boomers who are replacing them as workers and homeowners. Many Boomers
have delayed their retirement due to the bad economy, but when they leave the workforce, they will
transform the housing market. Surveys suggest that aging households will want to relocate to walkable
communities, with easy access to retail, services, mass transportation, and families. As Boomers retire over
the next two decades, analysts expect to see more sellers looking for small homes than buyers looking for
large ones. However, good health, diminished home values, and lost retirement savings have all slowed
these trends for the moment.
Meanwhile, younger households show little desire to purchase their parents homes. With low paychecks
and few entry level jobs, this generation is renting longer and delaying home ownership. Because younger
households are expected to marry later and have fewer children, many will eventually look to buy a
different kind of home than their parents did. National surveys sponsored by ULI suggest that Echo
Boomers strongly favor urban, higher density neighborhoods to lower density ones. This highly mobile
generation will shop between cities and regions that offer diverse, distinctive, and active neighborhoods
before choosing where to work. Communities that offer these amenities will position themselves to attract
and retain this new generation of workers.
Segment Outlook
Shrinking ● Childless and single person households fastest growing
Household Size ● 88% of household growth 2005-2030 will be childless
● Seniors to working age ratio means more sellers than buyers
Baby Boomers ● 71% of working older households want to live by transit
(1946 - 1964) ● 75% of retiring boomers want to live in mixed-use areas
● Negative home equity and good health may slow trend
● 77% want to live in urban core
● 1/3 will pay more to walk to shops, work, & entertainment
Echo Boomers
● 50%+ will trade lot size for proximity to shop/work
(1982 - 1999)
● Income constraints will drive demand for rental
● Regions must invest in place to retain them
Immigrants ● Preference for closely connected suburbs, not "cul de sacs"
Changes in the nation’s demographics will shift demand for housing away from single-family homes and towards
compact, mixed-use communities in urban settings.
BUILT in Cleveland 11Cleveland Market for Mixed-Use is Untapped
Cleveland developers have not capitalized on these shifts. Over the last decade, almost nine out of ten new
building permits in Greater Cleveland were for single family homes. As the economy stalled in 2008 and
2009, the region still added single-family units at a 6-to-1 ratio over multi-family housing. Zoning
restrictions in smaller municipalities and townships severely limit the opportunities for multifamily
properties, as 2,220 out of 4,800 square miles are in jurisdictions banning them outright. As a result, the
number of new multifamily units in surrounding counties in the past decade ranged from a high of 1,522
new units in Lorain County to just 8 in Geauga County.
Building Permits in Greater Cleveland, 2000 - 2009
8,000
Single-Family
Number of Housing Unit Building
7,000
Units
6,000 Multifamily
Units
Permits Issued
5,000
4,000
3,000
2,000
1,000
0
2000 2001 2002 2003 2004 2005 2006 2007 2008 2009
Year
Source: U.S. Department of Housing and Urban Development
Over 85 percent of all new homes built since 2000 were single-family and
that trend has continued during the economic slowdown.
Although the market for new condominiums looks weak, multifamily rental appears stronger. Urban
developers focused heavily on condominiums in the 1990s, but that market collapsed due to declining
demand and an abundance of poorly sited properties. This has created a longstanding sense of risk among
national investors, so capital for condo projects is hard to secure. However, the market for multifamily
rental, especially smaller scale apartment buildings and townhomes, appears more viable as the rate of
lending increases for these projects nationwide. For example, the waiting list for Downtown apartments at
668 Euclid Avenue had more than 150 names on it.
Even though Greater Cleveland will experience low or negative population growth, demographic shifts will
drive demand for these kinds of developments. According to ODOD projections, 126,500 Clevelanders will
BUILT in Cleveland 12enter retirement age between 2000 and 2030, increasing the total to 438,070. By 2030, one in five
Clevelanders will be 65 or older. Although ODOD does not project significant gains in residents between 20
and 34 between 2005 and 2030, they will hold steady as other age groups decline. If consumer preferences
hold, the balance of regional housing demand will tilt towards denser, mixed-use districts.
Projected Changes in Select Demographics in Greater Cleveland, 2000 - 2030
20-34
450,000
65+
400,000
Population
350,000
300,000
250,000
200,000
2000 2010 2020 2030
Year
Source: Ohio Department of Development, Population Projections 2005 - 2030
By 2030, ODOD projects that the number of seniors and young residents will represent
40 percent of the regional population, up from 33 percent in 2000. These groups will
form the Cleveland market for compact neighborhoods and mixed-use housing.
Changing demographics, investor preferences, and an underbuilt multifamily market will provide Greater
Cleveland the opportunity to diversify its housing stock, both in the urban core and in surrounding
communities. The Center for Transit-Oriented Development projects that 28,568 additional households
could be captured within a half mile of GCRTA fixed-guideway stations by 2030 on top of the 60,954
households already living within walking distance of transit. Outside Cuyahoga County, additional
investment in denser, mixed-use developments would allow predominantly single-family communities to
weather coming shifts in demand. A diverse building stock can protect municipal budgets from
unexpected declines in value of any single housing type.
BUILT in Cleveland 13Resilience and Growth in a Weak Economy
The sustained decline of American automobile manufacturing has rippled through Northeast Ohio’s
network of auto parts suppliers and the many local businesses that serve them. But even as Northeast
Ohio suffers through the worst recession in a generation, its industrial diversity, transportation
infrastructure, and skilled workforce can help it transition through the recovery.
Opportunities for Growth Amid Systemic Weakness
According to Moody’s Economy.com, declines in automobile production sent layoffs cascading through
almost every sector of the regional economy. Between manufacturing job loss, accumulating debt, and
aging, Clevelanders are spending less, thereby intensifying the downturn. Regional fragmentation
exacerbates this situation. Northeast Ohio’s network of small towns and municipalities compete with one
another for the latest big box store or power center, because those developments greatly boost local
income tax revenue. This dynamic shifts retail activity and lower paying jobs from one town to another but
does little to grow the economy. With retail demand declining, vacant commercial malls and power centers
may not be far behind.
Strengths Opportunities
● Health care infrastructure ● Attracting critical investment in biotech
● Increasing industrial diversity ● Renewable energy component manufacturing
● High tech industries (composite metals, solar panels) ● Infrastructure connections to global markets
● Affordable office rents
Weaknesses Threats
● Declining auto manufacturing and steel ● Lack of regional coordination on economic
● Reduced consumer spending due to aging and job loss development
● Household credit extremely stressed ● Auto industry restructuring on parts
manufacturers
● Lack of projected population growth will hurt
service sector
The decline of the automotive industry significantly destabilized Greater Cleveland’s economy,
but the region’s businesses and infrastructure are enviable assets for new growth.
Despite this gloomy narrative, the economy enjoys significant strengths. Cleveland’s health care
infrastructure has created a critical mass of talented specialists, especially at the Cleveland Clinic.
Investment in biomedical clusters has increased 34 percent since 2003. Greater Cleveland is now home to
over 600 biomedical businesses. The region’s industrial diversity is increasing elsewhere, too, with recent
inroads into high-tech sectors like polymers and composite metals. The infrastructure of the Great Lakes
region could give these exports in growth sectors a competitive edge in reaching domestic and global
markets. Additionally, Downtown Cleveland’s high vacancy rate means low rents on high quality office
space. Against a national storyline of “Rust Belt” decline, investors and stakeholders see strengths for the
future.
Some Cleveland Industries Show Resilience and Growth
Greater Cleveland lost 17,655 jobs between 2002 and 2008, but this overshadows a story of economic
resiliency for some sectors of the economy. CNT examined employment data from the Bureau of Labor
Statistics to assess how different sectors of Greater Cleveland’s economy fared when compared to the
BUILT in Cleveland 14nation and identify which ones performed better or worse than might have been expected. Sometimes, for
example, employment growth in an industry occurs because the entire economy is expanding. Other times,
jobs are gained and lost because that industry is growing or shrinking, like when steel production shrank
nationwide in the 1980s. By adjusting employment changes for these kinds of national trends, a picture of
local competitive advantage emerges.
Cleveland is not a story of inexorable “Rust Belt” decline, but one of incredible local resilience. Auto
manufacturing did shed 6,685 jobs in just 6 years—a steeper drop than in the nation as a whole. Yet the
region’s various metalworking and materials industries, which include steel mills, hand tools, specialized
metal products, and synthetic materials, fared much better. These industries grew from a combined 7,465
jobs in 2002 to 9,162 jobs in 2008, more than double the national rate. This network of firms deserves
Shift Share Analysis of Recent Job Growth in Greater Cleveland, 2002 - 2008
National 0.5 Regional Share National Growth,
Decline,
Handtools
Regional Resilience
Regional
Iron & Steel
Resilience Synthetic Mills
Materials
Trucking Back Office
Paint &
Adhesive Steel
Printing Products
Industry Share
0 Hospitals
-0.5 0 Education 0.5
Legal
Motor Vehicle Machine Shops
Parts Surgical National Growth,
Regional
Supplies Mfg Underperformance
Medical
National Decline, Regional Wholesale
Underperformance -0.5
Source: Bureau of Labor Statistics, Current Employment Statistics, 2002 - 2008
CNT examined the components of job change between 2002 and 2008 for fifteen industry sectors in which the Cleveland region is more
specialized than the nation as a whole. Jobs in these sectors grow or shrink for one of three reasons: general economic conditions,
national trends in the industry, and local competitive advantage or disadvantage. CNT mapped the last two factors against each
other. The size of each circle represents the total number of local jobs in that sector.
Each of the four quadrants tells a different story. Sectors located in the upper right quadrant performed well nationally and locally.
The resilient industries in the upper left quadrant declined nationally, but either grew or shrank less in Cleveland and may be worthy
of additional attention and investment. The lower right quadrant displays national growth industries that underperformed in
Cleveland. Finally, sectors in the lower left quadrant declined more in Cleveland than in the nation as a whole.
BUILT in Cleveland 15public attention as Ohio’s economy shifts away from auto manufacturing and towards emerging industries
like renewable energy or rail car manufacturing. Greater Cleveland is not known for logistics, but the
region’s recent outperformance in the trucking industry suggests some locational advantage in moving
freight that could translate into greater growth in warehousing and distribution.
Professional and medical employment also outperformed the nation. Back office companies, which handle
outsourced managerial and administrative functions from other firms, gained 5,900 jobs over this period
and grew more quickly than the nation as a whole. With its ample and affordable office space, Downtown
Cleveland could become the market where Ohio companies outsource these kinds of functions. Perhaps
unsurprisingly, hospitals and medical institutions have added 5,109 new jobs since 2002. This is about the
same rate of growth as the rest of the country. Biomedical industries, for which data is available, including
medical wholesaling and surgical appliance manufacturing, underperformed those industries nationally.
Nonetheless, the size and scale of employment at the Cleveland Clinic and other hospitals make them an
undeniable asset for job creation and innovation.
Estimates of New Jobs Created Requiring
“Old” and “New” Industries Provide On-the-Job Training, 2002 – 2008
Balanced Economic Growth
3,000
Hospitals
Manufacturing firms, offices, and hospitals not only Trucking
create jobs, they do so across skill levels. Growth in 2,000
these sectors can mean new jobs for all kinds of
residents, from highly educated professionals to those 1,000
Education
workers without a college degree. Specialized medical
Est. Growth in Jobs, 2002 - 2008
procedures require technicians to operate machinery, 0
run computer programs, and handle products like X- 0% 50% 100%
rays and blood. Call centers can provide good pay and -1,000
consistent hours to workers of many different Metalworking;
backgrounds who complete basic training. A successful -2,000 Warehousing
economic development strategy prepares a variety of
workers for these kinds of jobs. -3,000
-4,000
Assuming that the skill level of jobs locally matches the
national experience as reported by the U.S. Census
-5,000
Bureau, Greater Cleveland’s strongest industries all
created substantial numbers of jobs for workers Auto Parts Mfg
-6,000
without a college degree between 2002 and 2008.
These numbers demonstrate that investment in both
-7,000
the manufacturing businesses of the “old” economy
% of Jobs In Industry Requiring On-The-Job
and the medical and service businesses of the “new” Training
economy can build wealth and income for Clevelanders
across all skill and education levels.
Sources: Bureau of Labor Statistics and U.S. Census Bureau
Job Density Can Lead to Innovation
Both “old” and “new” economy businesses created
Economic development occurs in the offices, shops, and jobs across skill sets between 2002 and 2008.
factories that comprise Ohio’s neighborhoods and Metalworking sectors created an estimated 1,180
jobs requiring less than a college degree, back office
cities. With many specialized professions in close
businesses added 2,836 and hospitals such as the
proximity, urban space encourages information Cleveland Clinic created 1,527 such jobs, many of
which pay very well for the skills required.
BUILT in Cleveland 16exchanges and acts as a nursery for new ideas. This accelerated rate of information exchange brings
increases in human capital, technology transfers, and innovation. New ideas mean new products, potential
start-ups, and economic growth. Moreover, informal networking and idea swapping can have a powerful
effect on economic development: Silicon Valley’s engineers and entrepreneurs built the American
semiconductor industry after hours in the bars and coffee shops of Mountain View, CA. A study by the
Federal Reserve Bank of Philadelphia found that as employment density doubles, its patent intensity
increases by 20 percent. The vast majority of this innovation occurs in dense urban environments.
Just as in the Bay Area, Greater Cleveland’s densest job corridors could drive economic growth. Ohio Hub
and Third Frontier programs recognize the importance of innovation, human capital, and new start-ups in
repowering the state economy. However, potential entrepreneurs also need interconnected urban
environments to meet one another and swap ideas before new opportunities materialize. Focusing job
growth in dense, transit served communities can foster economic development by providing the spaces and
venues where collaboration and innovation can happen.
Economic Activity Is Clustered Around Job Corridors
In Greater Cleveland, the urban core could be one such place. In just 5.5 square miles, the combined
corridor of Downtown, University Circle, and Ohio City accounts for one out of six jobs in the region—
168,730 in all—more than anywhere else in Ohio. With 31,146 jobs per square mile, the urban core also
leads the region in employment intensity with job densities that are three and a half times greater than the
next densest districts in Elyria and Lakewood and six and a half times denser than Solon, the second largest
regional center.
The urban core also has room to grow. Euclid Avenue serves as the spine between the two centers of
Downtown and University Circle. In 2008 the Greater Cleveland Regional Transportation Authority
inaugurated the HealthLine, a Bus Rapid Transit service with bus-only lanes and stops similar to train
stations, to connect these centers through the Midtown neighborhood. The HealthLine ties these three
neighborhoods together, pools their human capital, and enhances their economic strength.
CNT identified regional employment centers using Local
.
Employment Dynamics (LED) data from 2002 and 2008.
CNT scanned Ohio for adjacent U.S. Census Block Groups
with employment density above seven jobs per acre and
assembled them into 209 clusters representing almost
1.5 million jobs statewide. These rich employment
networks are best understood as “jobs corridors” that
tie together multiple nodes of activity, like Downtown,
University Circle and Ohio City.
Even though Cleveland’s Downtown-University Circle-
Ohio City corridor experienced net job losses of 3.4
percent between 2002 and 2008, its 168,700 jobs and
density of 31,150 jobs per square mile are unparalleled
in the state of Ohio.
Source: U.S. Census, Local Employment Dynamics
BUILT in Cleveland 17Other employment centers are just as significant. The next fourteen largest job centers in Greater Cleveland
possessed 162,168 jobs in 2008, just about as many as Downtown and University Circle. These centers are
more decentralized and generally require a car for daily commutes. Some, including Solon and
Independence, are nowhere near the GCRTA’s fixed guideway network, while others, such as Lakewood,
Middleburg Heights, Woodmere, and Mayfield Heights, sit just beyond the system’s reach.
Change,
Jobs in Jobs Per Square
Job Center Name 2002 -
2008 Mile, 2008
2008
Downtown-University Circle-Ohio City 168,730 31,146 -3.4%
Solon 32,284 4,771 33.7%
Beachwood 20,025 6,802 18.7%
Middleburg Heights 18,551 4,889 7.8%
Independence 17,772 5,264 7.4%
Mayfield Heights 11,806 6,612 5.5%
Elyria 11,096 8,224 -2.4%
Clark/Fulton 7,935 18,507 -3.1%
Parma 7,681 6,275 1.5%
North Olmsted 7,334 5,317 1.5%
Euclid 6,816 5,087 -1.8%
Lakewood 6,360 8,799 6.0%
Medina 5,055 8,259 -4.6%
Strongsville 4,770 4,721 -0.5%
Westlake 4,713 4,598 8.3%
One out of three regional jobs is located in just fifteen employment centers.
Source: U.S. Census, Local Employment Dynamics
Each one of these centers adds value to the regional economy in its own way. The Cleveland Clinic, two
major universities, many of the region’s law firms, and numerous other business offices contribute to the
urban core’s competitive edge in those areas. Solon and Euclid account for many of the region’s
manufacturing and warehousing jobs. Professional services firms, including back office and management
companies, cluster along the Outerbelt.
Job Corridors Create and Circulate Regional Wealth
Every working day, Clevelanders go to work in these centers, then return home to spend their earnings on
housing, retail, clothing, and taxes. Their commutes spread wealth all over Northeast Ohio and tie the
vitality of their neighborhoods to the success of their workplaces. In the urban core of Cleveland, for
example, 72 percent of the workforce commutes to their jobs from Lakewood, Parma, Cleveland Heights,
Euclid, Shaker Heights, and elsewhere. Every salary earned at a job in University Circle supports a local
business in Parma or Euclid, which in turn boosts local taxes.
BUILT in Cleveland 18Commute Shed for Cleveland’s Urban Core
Almost three-quarters (72.0 percent) of employees in the Downtown-University Circle-Ohio City corridors live
outside the city of Cleveland. Another three out of ten (29 percent) live outside Cuyahoga County altogether.
Source: U.S. Census, Local Employment Dynamics
The same holds true for the other job centers. Ohioans travel from as far as Akron and Youngstown to
manufacturing and logistics jobs in Solon. Other centers, including Lakewood and Parma, tend to primarily
employ nearby residents. Each one creates income for Clevelanders to spend at local businesses.
However, jobs and residents in Greater Cleveland are moving further apart. As Clevelanders burn more fuel
to commute, their earnings disappear as quickly as the gas. Just 5 percent of employees who work in the
urban core live within this district’s boundaries, which encompass several city neighborhoods. Downtown
and University Circle are compact, accessible, and transit-friendly. If households lived closer to their city
jobs and if employers hired more local residents, the region would save hundreds of millions in
transportation dollars each year.
Ultimately, an investment in the economy is an investment in place. Many of the region’s strongest
sectors, from metalworking and composite materials to back office functions and hospitals, cluster around
each other for one reason or another. Whether it’s in Downtown Cleveland, Lakewood, Solon, or Elyria,
economic growth for those industries will require infrastructure for commuters, clients, shippers, and
suppliers. Reinvestment in transportation will make these places more viable, keep firms competitive in
the global economy and enhance the region’s strengths during a time of great duress.
BUILT in Cleveland 19Freight Assets Could Support Cargo-Oriented Development
The Great Lakes: Underutilized Asset, Emerging Opportunity
Gas prices will change the dynamics of the freight industry. Right now, trucks deliver most goods. But
companies in the 21st century expect timely delivery and competitive prices. With more trucks clogging the
Interstate Highway System and fuel costs skyrocketing, businesses will be looking at other modes for
moving freight. One of those alternatives is the nation’s rail system, which is 2.6 times more fuel efficient
than trucking. Berkshire Hathaway’s recent $34 billion purchase of Burlington Northern Santa Fe is
evidence that investors see value in energy-efficient infrastructure.
The Great Lakes waterways haven’t received the same attention, but inland shipping could yield similar
savings. A single barge of containers carries the cargo of 500 trucks and uses about a quarter of the fuel to
do it. The Great Lakes are also congestion free. While trains crawl through Chicago and trucks clog the
Detroit-Windsor Ambassador Bridge, the St. Lawrence Seaway operates at half capacity. One study by the
U.S. Maritime Administration found that a container of goods between Madison, WI and Detroit, MI with a
leg across Lake Michigan could save $200 in costs and arrive two hours earlier. Some shippers think that
the Great Lakes will be especially competitive in semiunfinished goods, where a product is moved from one
business to another for an additional step in the manufacturing process.
These advantages are expected to spur a 243 percent increase in the value of inland freight moved by
water between 2008 and 2035, according to projections by the Federal Highway Administration. Without
additional investment, though, water freight will likely continue to be a niche market and haul only a
fraction of the nation’s goods by value. New infrastructure could change that. As one example, the
construction of the St. Lawrence Seaway shifted North America’s iron and coal shipments away from
congested rail lines and spurred economic growth in the postwar years. Energy costs and highway
congestion could provide a similar impetus in the 21st century. Local investment in ports can lead the way.
Scanning for Cargo-Oriented Development
CNT’s Optimizer tool ranked 147 underutilized and vacant industrial sites in Cuyahoga County to determine the most
desirable sites for COD. The tool used a statistical method to find sites that shine across ten variables in three categories:
• Freight Assets, especially energy
efficient water and intermodal
rail facilities and the truck
connections to other markets
• Available Land, often
strategically located but
contaminated and fragmented
among several owners
• Human Capital in the form of a
skilled labor force made
accessible through mass transit
and a readymade supply chain
of small manufacturers.
BUILT in Cleveland 20Case Study: Toledo/Lucas County Port Authority
Investment around the Port of Toledo has paid dividends in increased freight traffic – and new jobs.
Toledo was not historically known for its intermodal commerce, but the Port has made major improvements recently:
• Acquired 2,000 acres of land around the seaport for logistics developers
• Supported development of 675,000 sq. ft. of covered storage with access to indoor rail docks and three Class I
railroads
• Invested $21 million in modernization and the acquisition of a mobile harbor crane for short sea shipping
Investment has paid off in global trade:
• Between 2002 and 2007, freight activity increased 11 percent, largely driven by Canadian imports
• Kraft Foods established its first marine terminal in 50 years that will handle 12 million pounds of Canadian freight
• Indirect economic impact estimated at $1 billion of economic activity and 19,540 jobs
By contrast, freight activity in Cleveland has decreased by 16 percent, with only a little import traffic, and supports
approximately 10,000 jobs.
Cleveland’s Water Freight Advantage
Cleveland sits on the shores of Lake Erie along
several strategic trade routes. I-80, I-90, and
I-71 all make it possible for trucks to reach
the Midwest, Canada, the Northeast, and
much of the South in a day’s drive. Two Class
I railroad carriers, Norfolk Southern and CSX,
connect the region to Chicago and New York
along the busiest rail route in the eastern
United States. Cleveland also serves as a
midpoint on the Great Lakes system. The
Port of Cleveland is the fourth busiest U.S.
port by tonnage and the only one that
handles bulk materials from as far west as
Duluth and as far east as Halifax.
Cleveland could take advantage of its position in the middle of all this trade. In the shorter term, the
region’s primary metal manufacturers could produce and assemble bulky oversized components like wind
turbines and the Port of Cleveland could deliver them to the Dakotas through Duluth. In the long term, a
market will likely emerge for container shipping through Cleveland, even though neither the Port of
Cleveland nor other inland harbors are equipped for it. New technologies in short sea shipping between
Europe and the Great Lakes, a proposed container feeder service between Halifax and Cleveland, and the
widening of the Panama and Suez Canals are all projected to reduce shipping times to and from Cleveland.
An investment in crane technology now could lead to more traffic as fuel prices go up and travel times go
down.
Cargo-Oriented Development Builds on Existing Assets
Because Cleveland sits at the meeting point of rail, water, and highway infrastructure, the region could
benefit from an economic development strategy founded upon cargo-oriented development (COD). CODs
bring industrial and logistics businesses together with access to multiple modes of freight transportation,
complementary firms, and a ready workforce. By operating in a COD, a company could cut millions of
BUILT in Cleveland 21You can also read