Detection of glaucoma using retinal fundus images: A comprehensive review - AIMS Press
←
→
Page content transcription
If your browser does not render page correctly, please read the page content below
MBE, 18(3): 2033–2076.
                                                                             DOI: 10.3934/mbe.2021106
                                                                             Received: 12 December 2020
                                                                             Accepted: 01 February 2021
    http://www.aimspress.com/journal/MBE                                     Published: 02 March 2021

Review

Detection of glaucoma using retinal fundus images: A comprehensive review

Amsa Shabbir1 , Aqsa Rasheed1 , Huma Shehraz1 , Aliya Saleem1 , Bushra Zafar2 , Muhammad
Sajid3 , Nouman Ali1,∗ , Saadat Hanif Dar1 and Tehmina Shehryar1
1
     Department of Software Engineering, Mirpur University of Science and Technology (MUST),
     Mirpur- AJK 10250, Pakistan
2
     Department of Computer Science, Government College University, Faisalabad 38000, Pakistan
3
     Department of Electrical Engineering, Mirpur University of Science and Technology (MUST),
     Mirpur- AJK 10250, Pakistan

* Correspondence: Email: Nouman.se@must.edu.pk; Tel: 0321-9806098.

Abstract: Content-based image analysis and computer vision techniques are used in various health-
care systems to detect the diseases. The abnormalities in a human eye are detected through fundus
images captured through a fundus camera. Among eye diseases, glaucoma is considered as the second
leading case that can result in neurodegeneration illness. The inappropriate intraocular pressure within
the human eye is reported as the main cause of this disease. There are no symptoms of glaucoma at
earlier stages and if the disease remains unrectified then it can lead to complete blindness. The early
diagnosis of glaucoma can prevent permanent loss of vision. Manual examination of human eye is
a possible solution however it is dependant on human efforts. The automatic detection of glaucoma
by using a combination of image processing, artificial intelligence and computer vision can help to
prevent and detect this disease. In this review article, we aim to present a comprehensive review
about the various types of glaucoma, causes of glaucoma, the details about the possible treatment,
details about the publicly available image benchmarks, performance metrics, and various approaches
based on digital image processing, computer vision, and deep learning. The review article presents a
detailed study of various published research models that aim to detect glaucoma from low-level feature
extraction to recent trends based on deep learning. The pros and cons of each approach are discussed
in detail and tabular representations are used to summarize the results of each category. We report our
findings and provide possible future research directions to detect glaucoma in conclusion.

Keywords: Medical image processing; computers in medicine; CAD for detection of glaucoma; optic
disc abnormalities; retina images; fundus images; review on detection of glaucoma; computer vision
techniques to detect glaucoma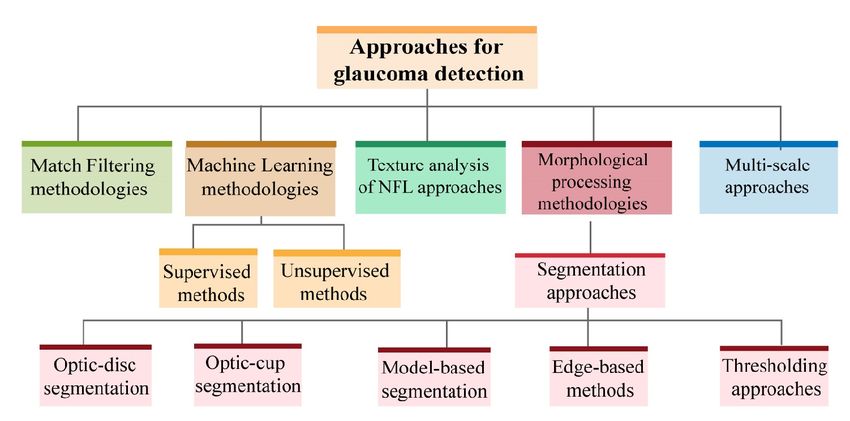
2034

1. Introduction

    Content-based image analysis is applied in different applications of computer vision and digital
images are a major part of multimedia data [1]. In last few decades, significant research is performed on
different applications of medical image analysis. The main aim of research in medical image analysis
is to assist the doctors to detect diseases on the basis of image contents [2, 3]. Glaucoma is a persistent
eye disorder that gradually damages the optic nerve. It is a neurodegeneration illness and contemplates
as a reason for blindness. As debasement of nerves is irrevocable action hence it results in permanent
loss of vision [3,4]. Numerous research studies have been performed to estimate the number of affected
people with this chronic disease [5–7]. Glaucoma is declared as the second leading cause of the loss of
sight [8, 9]. Results indicate an estimate of 60 million people suffered from glaucoma in 2010, while
the number will be increased to approximately 80 million by 2020 [9]. Glaucoma causes irrevocable
vision damage due to elevated Intraocular Pressure (IOP) and optic nerve damage [10]. Glaucoma is
commonly referred to as “hushed burglar of vision” since the symptoms at an early stage of glaucoma
are not explicitly defined and are hard to quantify. If the succession of glaucoma is not stopped at the
initial stages it results in the severe demolition of the optic nerve and as a consequence, it will lead to
incurable blindness [11]. It is necessary to detect glaucoma at an early stage due to following facts:
  1. There are no perceptible indications in its preliminary stages.
  2. It is a severe disorder as the damage it causes is irremediable.
  3. It leads to perpetual loss of sight if not cured promptly.
  4. There is no prophylactic treatment for glaucoma, but it is possible to avoid blindness by detecting,
     treating and managing glaucoma at an initial stage [12]. The list of abbreviations used in this
     paper are shown in the Table 1.
   Computer-Aided Diagnosis(CAD) helps in the rehabilitation of the affected eyes of the disease.
Numerous research studies have been performed on fundus images to detect glaucoma at an early phase
and to avoid any severe damages. Glaucoma alludes to a group of conditions and states characterized
by the variations in the retinal nerve fiber cushion and nervous optics head leading to reduced vision and
imparity [13]. Researchers are attempting to decrease the damage through ameliorate disease detection
and more effective treatment like instant Trabecular Micro-Bypass (TMB). Figure 1 represents an
overview of the anatomy of human eye [14]. The authors [15] gave a brief survey on state of art
techniques of automatic detection of glaucoma in early stages. Critical evaluation of the methods have
been conducted which include Optic cup disc ratio, Retinal Nerve Fiber Layer (RNFL) etc. These
researches add value to the efficient diagnosis of glaucoma. They further summarizes the survey into
2 categories of segmentation based approaches and non-segmentation based approaches. Sarhan et al.
[16] conducted the survey of current approaches to detect glaucoma that are valuable for the researchers
to predict the proficiency and precision. This is an effective survey that lays the guiding details for the
researcher in terms of approach of glaucoma and dataset selection for further research [16].

1.1. Major causes of glaucoma
   Glaucoma is a multiplex ailment and a single test cannot give much information about the detection
of glaucoma. A constant eye assessment habitually necessitates concealing for glaucoma and indicates

Mathematical Biosciences and Engineering                                      Volume 18, Issue 3, 2033–2076.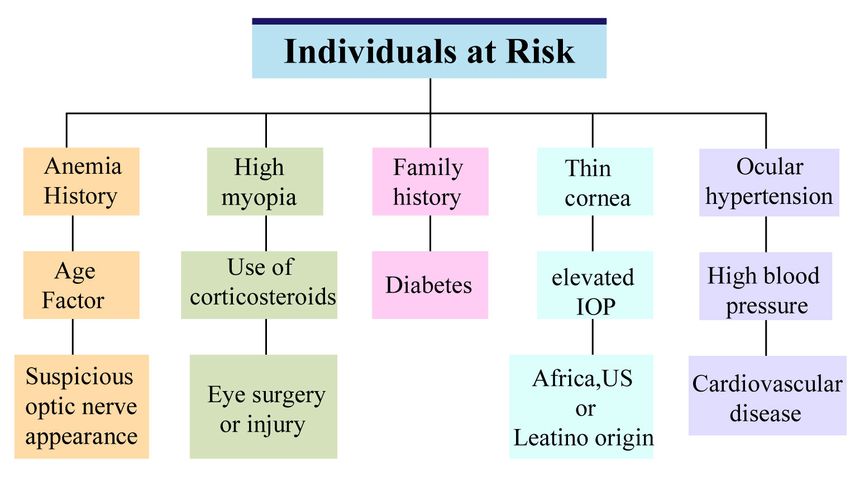
2035

                                       Table 1. List of abbreviations.
         Keywords        Abbreviation             Keywords       Abbreviation
         CAD             Computer-Aided Di-       TMB            Trabecular Micro-Bypass
                         agnosis
         NRR             Neuro-Retinal Rim        NTG            Normal-Tension Glaucoma
         OCT             Optical Coherence        KNN            K-Nearest Neighbours
                         Tomography
         IOP             Intraocular Pressure     ML             Machine Learning
         CDR             Cup to Disc Ratio        AI             Artificial intelligence
         RDR             Rim to Disc Ratio        SVM            Support Vector Machine
         NRR             Neuro Retinal Rim        CNN            Convolutional Neural Networks
         OAG             Open-Angle Glau-         DL             Deep Learning
                         coma
         ACG             Angle-Colure Glau-       ROI            Region of Interest
                         coma
         POAG            Primary Open Angle       OD             Optic Disk
                         Glaucoma
         PACG            Primary Angle Clo-       LFDA           Local Fisher Discriminate
                         sure Glaucoma                           Analysis
         LTG             Low Tension Glau-        MMM            M-Medoids Model
                         coma
         ICE             Irido Corneal En-        GMM            Gaussian Mixture Model
                         dothelial Syn- drome
         RAD             Relative Area Differ-    OC             Optic Cup
                         ence
         DM              Dice metrics             ONH            Optic Nerve Head
         FNN             Feed Forward Neural      FCNN           Fully Connected Neural Net-
                         Network                                 work
         PNN             Probabilistic Neural     GT             Ground Truth
                         Network

that additional inspection is needed. Glaucoma’s sightlessness is inevitable, that is why initial detection
is pivotal as glaucoma cure rescue endure vision but not refine eyesight [17]. Glaucoma can occur due
to the enlarging of IOP, the changes in the inter-papillary, and the para-papillary area of the optic nerve
head [10]. Glaucoma succession directs to few structural alterations in the region of retinal layers and
optic nerve. Cup to Disc Ratio (CDR) and Rim to Disc Ratio (RDR) are numerous structural alterations
that are used for glaucoma detection. Observing the values of these parameters may help in detection
of glaucoma [11]. Figure 2 illustrates the fundus image of normal human eye [18]. The increase in
IOP in the eye is considered as the origin of nerve optics injure. This pertains to mechanical squeezing
or reduces blood passage of the optic nerve and occasionally eye pressure results in glaucoma [19].
Increased pressure changes the CDR and RDR that are considered to be the most important parameter
for glaucoma diagnosis [20]. The circular zone is optic nerve concentred by the optic cup and the area

Mathematical Biosciences and Engineering                                      Volume 18, Issue 3, 2033–2076.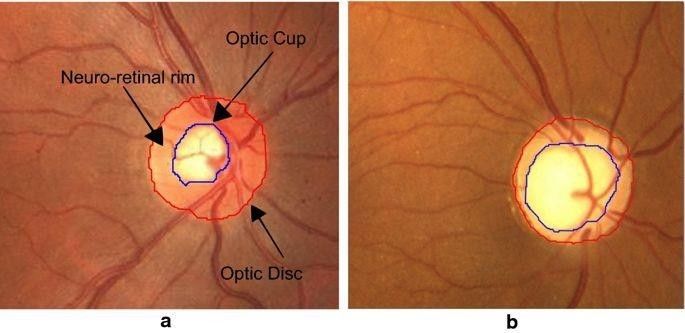
2036

                                Figure 1. The anatomy of human eye [14].

                               Figure 2. Fundus image of normal eye [18].

in middle is called Neuro-Retinal Rim (NRR). CDR and RDR are constructional variations consume
in the detection of glaucoma [21]. In eyes with glaucoma, the growth of IOP results in the enlargement
of an optic cup that causes a reduction in NRR, leading to a large CDR and a small RDR. Figure 3
illustrates a labelled fundus image [22].

                                  Figure 3. A labelled fundus image [22]

   Patients suffering from glaucoma do not have any sort of symptoms at early stages and have no
signal of illness but at the advanced stages people having glaucoma experience vision loss. Optic
nerve is a blemish to work due to high pressure in eye which is affected by the high production of
aqueous humor or degassing system of the liquid gets blocked. Somehow this disease is also occurred

Mathematical Biosciences and Engineering                                    Volume 18, Issue 3, 2033–2076.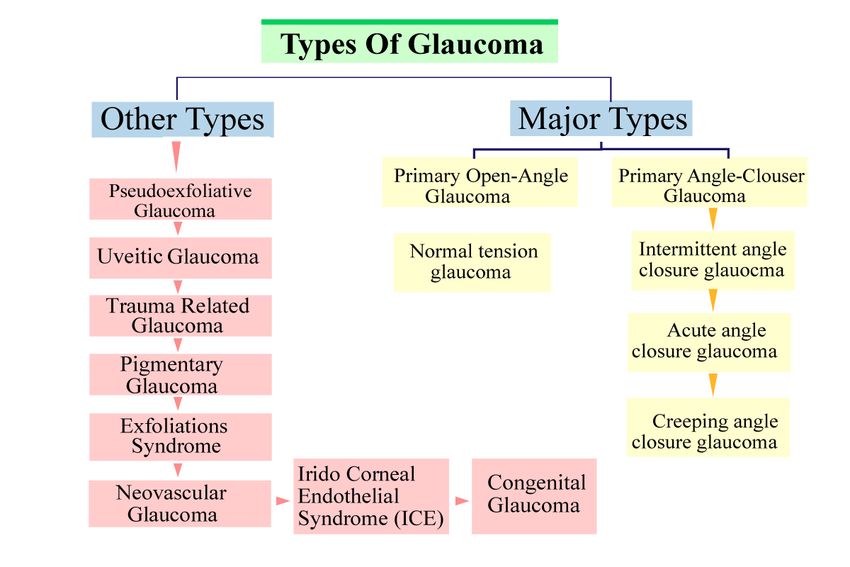
2037

because of genetics having this disease prior in the family. Several tests are performed with patients
having suspected glaucoma like tonometry i.e. used for measuring the pressure of eyes, gonioscopy
is used to check out either the angle is open or closed. Moreover, fundus imaging as well as optical
coherence tomography is used for the optic nerve and the location of the retina. The thickness of retinal
nerve fiber layer is diagnosed by the retinal fundus imaging, it helps in the demonstration of glaucoma.
This technique is very common and used by most of the ophthalmologists. The major advantage of
using this technique is that the size of retina can be measured very easily with little effort and it is
portable to use.

1.2. Risks cognate with glaucoma
   Since last few years, a considerable amount of studies have been conducted and results have been
reported about the risks associated with glaucoma [23]. These studies stated many risk factors and
their adverse effects. Figure 4 represents the risks affiliated with glaucoma. The occurrence of any

                             Figure 4. Risks associated with glaucoma [24].

of these symptoms in an individual does not indicate that the one is infected with glaucoma, only an
ophthalmologist can determine the risk of disease onset and progression. Some of the high risk factors
associated with glaucoma are (i) increased eye pressure (ii) age (iii) thin cornea (iv) hypertensive (v)
diabetic patients (vi) history of injuries to eyes (vii) a family history of glaucoma (viii) nearsightedness
(ix) cardiovascular diseases (x) steroid consumption (xi) rate of blood pressure (xii) severe anemia [25].
Research studies reported that 17% hypertensive, 35% diabetic and 48% individuals suffering from
both diseases are at a high risk of developing Open-Angle Glaucoma (OAG). Commonly associated
conditions associated to the metabolic syndrome’s components comprise of hyperlipidemia (high levels
of triglyceride and cholesterol), hypertension, diabetes and obesity. Research studies indicated that
diabetes and hypertension increase the risk of OAG in individuals. More research efforts are being
made for glaucoma treatment and to assess the impact of hyperlipidemia as glaucoma risk factor. Risk
factors are important to consider since they specify a potential target for a specific treatment.

Mathematical Biosciences and Engineering                                      Volume 18, Issue 3, 2033–2076.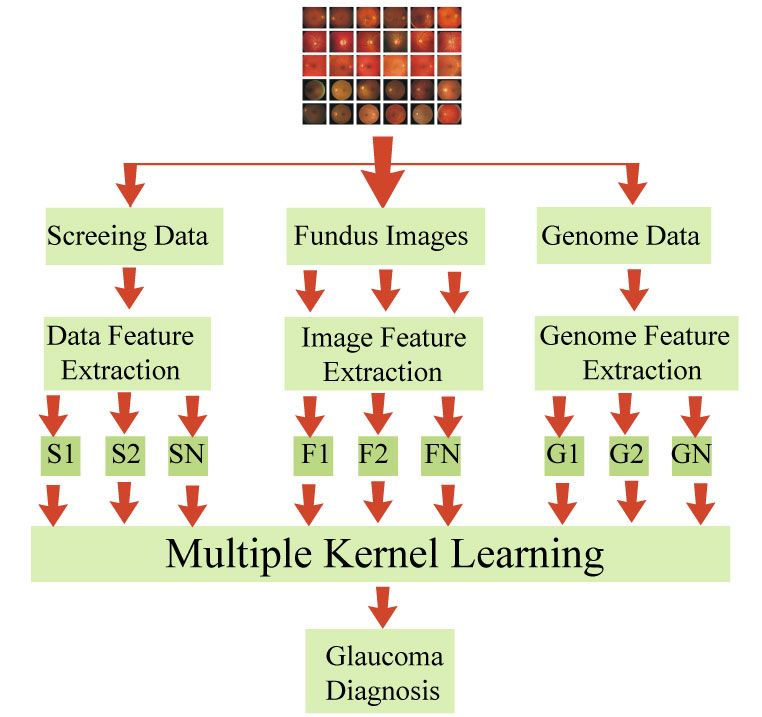
2038

1.3. Types of glaucoma
   Glaucoma is categorized into various types depending on the causes and symptoms as revealed
by the researcher during the last decade. The two pre-eminent types of glaucoma are OAG further
branched as Normal-Tension Glaucoma (NTG) [26] and Angle-Colure Glaucoma (ACG). Figure 5
represents the types of glaucoma. These fundamental types encompasses of 90% among all glaucoma
causes [27]. The types and the causes of glaucoma are described below:

                                    Figure 5. Types of glaucoma [26].

  1. Primary Open Angle Glaucoma (POAG): Freakishness in trabecular reticulum and slow clogging
     of the drainage canals causes IOP to increase which in turn causes open angle glaucoma. It
     develops over the time and is referred to as slow poison that is lifelong lasting. Optic nerve
     damage and optic defect are the measuring metrics for OAG [28].

  2. Primary Angle Closure Glaucoma (PACG): This is less common type of glaucoma as compared
     to open angle glaucoma. The causes include the damage of optic nerve and high IOP. Unlike
     POAG, angle closure glaucoma grows fast and needs immediate medical attention. The metrics
     of detection are almost similar as that of POAG i.e. optic nerve head damage, glaucomatous
     visual filed defect and narrow camber angle. One important measure is occludable angle used to
     estimate glaucoma. An occludable angle correspond to PACG if the rare trabecular meshwork is
     seen in less then 90◦ of the angle boundary [29].

  3. Low Tension Glaucoma (LTG): It is also caused by the optic nerve damage but the elevation
     of IOP is not obligatory. Even though the IOPs of some patients are normal but still they have

Mathematical Biosciences and Engineering                                Volume 18, Issue 3, 2033–2076.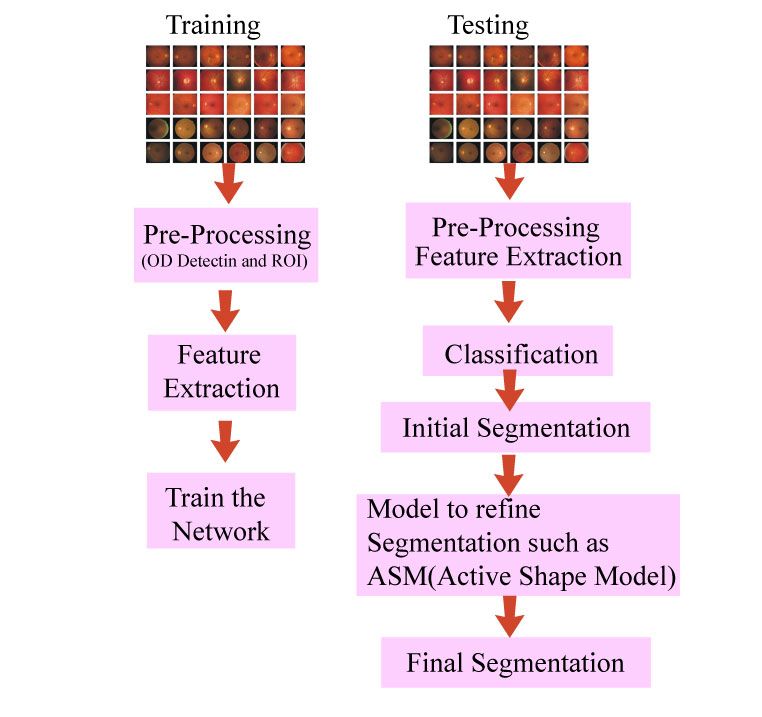
2039

     normal tension glaucoma often called low tension glaucoma. People with normal IOP can suffer
     LTG since they may be sensitive to normal eye pressure. The main cause can be the low blood
     supply to optic nerve head. The metrics of detection are same as the both POAG and PACG [28].
     Table 2 provides an overview of the other types of glaucoma.

                                           Table 2. Types of glaucoma.
 Types of Glaucoma                     Major Causes
 Acute glaucoma [30]                   An abrupt rise in IOP due to surplus propagation of hydrous hu-
                                       mor in hours.
 Pigmentary glaucoma [31] [32]         Nearby glimpse eye has concave the same as iris have that causes
                                       hydrous humor to splatter on trabecular meshwork resulting in its
                                       closure.
 Exfoliations syndrome [33]            Its color is white. Material accelerates on the lens and this causes
                                       closure to the trabecular meshwork.
 Trauma-related glaucoma [34]          Physical changes within an eye drainage canal because of some
 [35]                                  injuries or accidents or inflammatory conditions.
 Uveitic glaucoma [36]                 Ocular inflammatory disorders (uveitis) can occur for various rea-
                                       sons and unfortunately, glaucoma can soften up to 20% of pa-
                                       tients. Some of these disorders tend to affect only one eye. Other
                                       forms can affect both eyes
 Irido Corneal Endothelial Syn-        The backside of cornea contains cells that scatter over the eye
 drome (ICE) [37]                      drainage tissue and across the surface of the iris. This leads to an
                                       increased IOP in an eye that can damage the optic nerve. These
                                       cells form accession that glue the cornea and iris and block the
                                       drainage channel system. And iris and block the drainage channel
                                       system.
 Congenital glaucoma [38]              Normally babies suffer from this type of glaucoma. When a
                                       woman is pregnant than if her baby’s eye drainage canal sys-
                                       tem development is not correctly building this leads to Congenital
                                       Glaucoma.
 Pseudoexfoliative            glau-    Pseudoexfoliative glaucoma occurs when ash-like material peels
 coma [39]                             off from the external side of the lens in the eye. This ash-like
                                       material collects within the angle between the iris and cornea and
                                       damage the whole system of the eye.
 Neovascular glaucoma [40]             This type of glaucoma always related to other abnormalities, most
                                       often diabetes. Blood vessels are blocked and the eye’s fluid can
                                       leave the eye’s drainage canals and this will cause an increase in
                                       IOP and this kind of glaucoma is very hard to treat.

Mathematical Biosciences and Engineering                                       Volume 18, Issue 3, 2033–2076.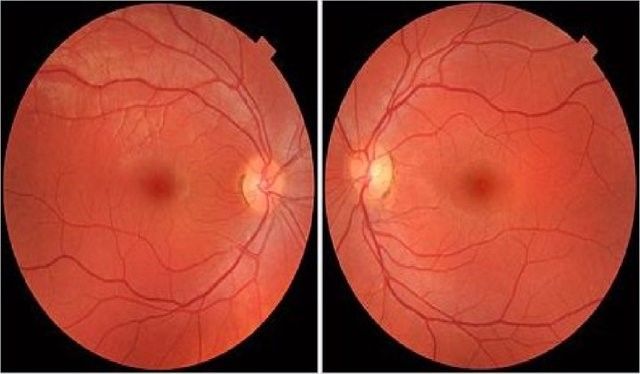
2040

1.4. Ministrations of glaucoma
   Treatment of glaucoma involves certain after-effects and financial expenses. The rudimentary treat-
ment which is also called first-line treatment [41] is the use of eye-drops [42]. Second-line treatments
encompass trabeculectomy or microsurgery [43]. Third-line treatment is given to the patients not re-
sponding to medications and are at a severe stage of glaucoma. These include laser surgery, drainage
implants and other methods that help lower intraocular pressure [44]. Figure 6 demonstrates the differ-
ent types of treatments associated with glaucoma.

                                 Figure 6. Treatments for glaucoma [41].

2. Approaches for the detection of glaucoma

    Glaucoma is considered to be an irremediable blindness in people with an age of more than 40
years. Carrillo et al. [45] proposed a computational tool to assist automatic detection of glaucoma. The
most widely applied technique for glaucoma detection is fundus imaging since it provides a trade-off
between cost, size and portability. The authors reported improved results for disc segmentation as
compared to the related research. Disc segmentation was done by thresholding, vessel segmentation
was done by edge detection and for cup segmentation a strategy is followed that make use of vessels
and cup intensities. Results obtained from a set of fundus images having percentage of glaucoma
detection success was 88.5%. According to authors [45], the future work perturbs to use a larger
dataset of fundus images to ensure a pro-found evaluation. Sengar et al. [46] suggested a method for
the detection of suspected glaucoma by practicing existence or deficiency of hemorrhages in specific
area near optic disc in image having fundus features. This method is considered to be computationally
efficient and provides effective and accurate results on the diagnosis of suspected glaucoma. Salam et
al. [11] proposed procedure that uses an algorithm for the detection of glaucoma having a combination
of CDR and hybrid textual and different intensities features. Image organization is processed using the
result that comes from both CDR as well as the classifier. According to the results [11], the proposed
fusion improved sensitivity, specificity and accuracy. Poshtyar et al. [47] suggested the procedure of
automatic detection of glaucoma i.e. without the aid of consultant and advance machinery. Quantitative
determination is used for glaucoma detection. The method used is efficient. Khan et al. [48] proposed
the techniques for detecting glaucoma in the early stage. In the proposed study [48], glaucoma is
classified by CDR and NRR i.e. ISNT quadrants for the purpose of checking out that it follow or
unfollow ISNT rule. Table 3 provides a description of the datasets and the reported results in term of

Mathematical Biosciences and Engineering                                    Volume 18, Issue 3, 2033–2076.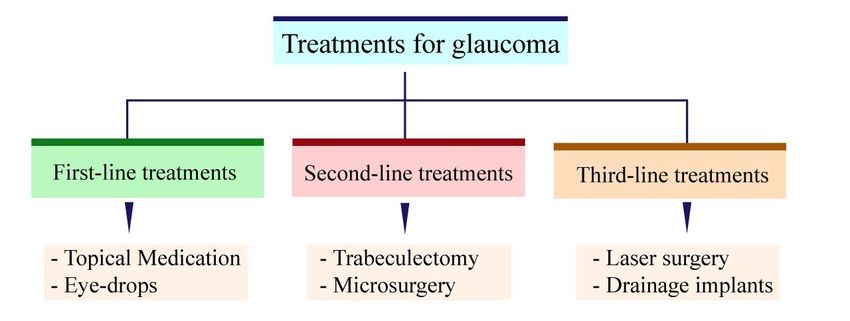
2041

accuracy for the approaches that are discussed above.
                                 Table 3. Glaucoma detection approaches.
        Authors                       Dataset                                Accuracy
        Carrillo et al. [45]          26 fundus images                       88.50%
        Khan et al. [48]              50 retinal images                      94%
        Sengar et al. [46]            140                                    93.57%
        Poshtyar et al. [47]          300 retinal fundus images              N/A
        Salam et al. [11]             50 fundus images                       92%

2.1. Glaucoma detection through peripapillary atrophy
   Peripapillary atrophy is said to be divided into 2 categories [49]. These categories are a-zone and
b-zone. The authors states that b-zone category is associated with glaucoma progression. They further
elaborate that glaucomatous eyes with PPA show faster thinning of retinal nerve then the regular eyes.
In this study OCT B scan images were utilized to gain optic disc sizes. Total of 115 subjects were
examined in the study. The presence of glaucoma was classified in the basis of Peripapillary atrophy.
Authors argue that peripapillary atrophy is considered to be very progressive morphological diagnosis
for open angular glaucoma [50]. Peripapillary atrophy is a variable that can be helpful for the detection
of glaucoma. Eyes with glaucoma show large peripapillary atrophy. The technique used is confocal
scanning laser tomography and automated static threshold perimetry for measurement of peripapillary
atrophy [51]. The test was carried out on 102 eyes samples. Here the entropy was divided into 2
zones. First zone was central zone with visible and large vessel and second zone called peripheral
with hyper pigmentation. The authors concluded that the peripapillary atrophy is associated with optic
nerve damage which is the major cause of glaucoma [51].

2.2. Glaucoma detection through Retinal Nerve fiber
   Here researchers used retinal nerve fiber layer RNFL , optic nerve head and muscular thickness
parameters to classify healthy and effected eyes [52]. The total eyes under examination were 80.
Stratus OCT was used for the scanning of the patients. Authors state that RFNL parameter has higher
AUC then other parameters under consideration [52]. Authors tested 64 patients either with healthy
eyes or glaucomatous eyes [53]. Each patient went through five oct scans. Linear regression slopes of
the patients were measured with glaucoma and non-glaucomatous eyes. Kaplan-Meier survival curve
analysis was done for the patients and a significant progression rate was recorded [53].

2.3. Glaucoma detection through Vessel displacement
   The authors describe the relationship between cup width , cup depth and vessel displacement. The
sample on which the study was conducted consisted of 826 eyes [54]. Fixed image separation method
was used to obtain the colored graphs. The vessel displacement was estimated on a scale from 0 to
4 positive numbers. Finally they conclude that the depth of the cup and the vessel displacement are
very much correlated [54]. The authors studied 16 eyes of minipig. using fundoscopic photography
and fluorescein angiography [55]. The change in glaucomatous eyes was studied. These changes

Mathematical Biosciences and Engineering                                    Volume 18, Issue 3, 2033–2076.
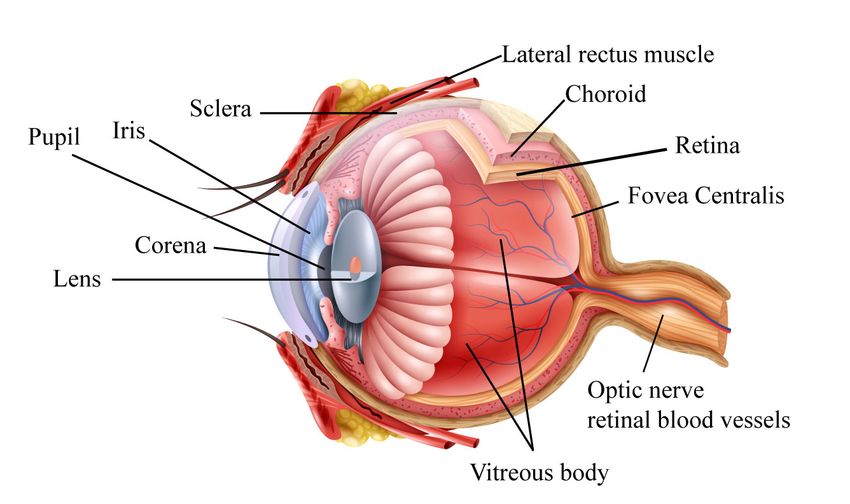
2042

were compared with the previous results. The results found in human and minipig were different and
interesting. Angiography changes in minipig were negligible as compared with human eyes diagnosed
glaucoma. The eyes with glaucoma of minipig showed no changes. However in the eyes of human
with open angle glaucoma both the arterioles and the venues are displaced [55]. The automation of
glaucoma has been an important research area for the researcher for the last two decades. Segmentation
approaches discussed above are being widely used for the detection of glaucoma due to their improved
results. The segmentation approaches have the advantage of being cost effective and providing accurate
result hence the trade-off between size, cost and portability are achieved. Image segmentation is done
by selecting appropriate feature that needs to be examined however, how to select the suitable image
feature and classifier is the challenging issue that are faced by the researchers using segmentation
approaches [56]. Pattern based approaches are very helpful for the detection of glaucoma. Since ONH
have the structural characteristics which are well understood and verified in several studies and medical
institutions [57] [58]. Since the parameters are derived from the structural features and characteristics
the results are very meaningful and efficient. These approaches are low cost, efficient and reliable [59].
   In last few decades great effort has been done on automation of detection of glaucoma using dif-
ferent Machine Learning approaches and techniques. Machine learning deals with the large amount of
data and provides the analysis of data [60]. It is a faster process in acquiring information about the data.
They have a feature of learning from their mistakes and experiences. Detection of glaucoma is been
achieved by using neural networks [61], SVM [62], Naive Bayes classifier, k- nearest neighbor [63],
Canny edge detector [64] Fuzzy min-max neural network [65]. The main advantages of the machine
learning approaches in detection of glaucoma is that they can handle large amount of datasets and can
provide beneficial results. Since the machine learning approaches do not need much human interfer-
ence hence the human resource is saved. The data is handled and is trained and made error free using
AI. The results obtained using machine learning classifiers show significant improvement compared to
the traditional segmentation approaches.
   The diagram 7 illustrates the architecture called AGLAIA-MII to detect the features for glaucoma
detection and pass the features to multiple kernel learning (MKL) framework which will finally make
the diagnosis of Glaucoma. This is a very effective framework used by researchers for glaucoma
detection.
   The only disadvantage associated with ML techniques is the data acquisition, which should be
good quality and unbiased. Some of the glaucoma ML detection techniques do not provide the ex-
cellent results only due to low data quality and less data sometimes. Cost and resources are some
factors which are considered sometimes before using ML classifiers as they require large amount of re-
sources and cost. This section covers the technical information about the image processing techniques,
methodologies and algorithms proposed for the automatic detection of glaucoma. The researchers have
done a lot of work for the diagnostics of glaucoma which resulted in number of types of approaches
and algorithms. Figure 8 precisely demonstrates the commonly used computer vision techniques for
glaucoma detection. In this article, we aim to present a detailed review about recent trends to detect
glaucoma by highlighting the main contributions, available benchmarks for research evaluation, up-
coming challenges. The limitations and drawbacks associated with the published research to detect
glaucoma are discussed in detail and possible future directions are also mentioned. We aim to discuss
the glaucoma detection based on machine learning, simple segmentation approaches, fusion based
approaches, multi-scale-based approaches, texture feature-based approaches, OCT-based approaches,

Mathematical Biosciences and Engineering                                      Volume 18, Issue 3, 2033–2076.
2043

                          Figure 7. Working of AGLAIA-MII architecture [66].

         Figure 8. Classification of computer vision techniques for glaucoma detection [42].

deep-learning-based approaches, a summary about datasets/standard benchmark to evaluate glaucoma-
based research is also presented, and a comparison between deep-learning and traditional approaches
is also presented in this review article. The performance evaluation metrics are also presented and
discussed in detail. At the end of each section, a detailed comparison is presented in the form of tables
that conclude about the research methodology, datasets and performance percentage for each of the
selected research model.

Mathematical Biosciences and Engineering                                    Volume 18, Issue 3, 2033–2076.
2044
3. Machine Learning approaches for glaucoma detection
Machine learning is an entreaty of artificial intelligence that has been given great attention. This
provides the system with the ability to learn and improve the by the experience and in turn enhance
the efficiency of the output without telling it what to do by programming. Since last two decades, ML
approaches are used for the detection of glaucoma [67]. Dey at el. [68] in the year 2016 proposed
ML approach for automatic glaucoma detection using SVM as a classifier. In this approach [68], the
authors applied to pre-processing on the image which improved the contrast of the images and removed
the noise. The authors observed that the pre-processing has a major impact on the overall efficiency of
the method. They took 100 images for tanning while using SVM as classifier. After pre-processing,
image normalization and color conversion were performed. Afterward, feature extraction was done
using the principal component analysis method. Finally, SVM was applied which had the training and
testing data to classify the images as glaucomatous or non-glaucomatous. In this approach, the final
results were stated as follows SVM classifier has accuracy rate 96%, sensitivity 100%, specificity 92%,
positive predictive accuracy 92.59% and negative predictive accuracy 100%. Silve at el. [69] proposed
the use of a hybrid feature set made up of texture and structural features of retinal image for accurate
glaucoma detection. Optical Coherence Tomography (OCT) was used for early-stage detection of
glaucoma and ML approaches were used for automated glaucoma detection whereas KNN shows its
90% accuracy in results.
Akram et al. [70] presented an approach that relies on the extraction of features from the OD region.
Both spatial and spectral features were extracted to construct the multivariate model and LFDA is used
to conduct a supervised intensification of features. The recognition of m-medoids is a cluster of data,
another component that was added to analysis was ROI. The authors erect multifaceted with MMM
to codify glaucoma. The proposed approach was compared to other classifiers such as SVM, GMM,
KNN, and Multilayered Perceptron’s. On average, their approach attained 91.7% accuracy, a positive
predictive value of 78%, 92.7% specificity and a sensitivity of 84.6. Moreover, GMM is another
classifier that achieved almost similar results as LFDA with a Gaussian distribution of 620. The main
focus of the study is to enhance the performance of classification by integrating feature enhancement
through supervised learning using LFDA.
Acharya et al. [5] presented an approach to extract features of the whole image for glaucoma clas-
sification. In the first step, images were converted to gray-scale via adaptive histogram equalization.
Thereafter, to obtain textons, a total of four filter banks were utilized respectively. Then, features were
extracted via local configuration pattern and this was to be done by using previously extracted textons.
Authors used four filters and after extraction of results from all of them authors decided one between
them. The authors obtained a total of 17808 features. Therefore, the authors wants to reduce this
number so they decided to apply a new method. By applying a sequential floating forward search they
decided to select the set of features. Afterwards authors applied student t-test to rank the selected fea-
tures and choose those features that have a p-value of ¡ 0.05. They used total of Five classifiers, namely
discriminate classifier, KNN, decision tree, probabilistic neural network and SVM with 10-fold cross-
validation applied. The proposed approach resulted in 95.7% accuracy, a sensitivity of 96.2% and a
specificity of 93.7%.
In this paper [71], choose mass screening because it would diagnosis glaucoma in early stages in the
vast population. An automated diagnosis technique is required for mass screening. Authors proposed
Mathematical Biosciences and Engineering Volume 18, Issue 3, 2033–2076.2045
an automation that is consists of optimal wavelet transformation ,preprocessing, ,classification modules
and feature extraction. From fundus images statistical features are extracted via hyper analytic wavelet
transformation (HWT). As phase information is preserves by the HWT and is appropriate for feature
extraction. Features are classified via SVM with the help of a Radial Basis Function (RBF) kernel.
To avoid premature convergence area screening and Group Search Optimizer (GSO) are embedded in
Particle Swarm Optimization (PSO) framework. hybrid algorithm increased the fitness by 9.4% and
6.1%, in the test runs as Compare to conventional PSO. This success rate is achieved with the help of
search ability of PSO. Furthermore, algorithm also maintains PSO population’s identity.
In this paper [72], the authors discussed the automatic identification of glaucoma and normal classes
with the help of Discrete Wavelet Transform (DWT) and Higher Order Spectra (HOS) features. Then
features are given to the SVM classifier either in linear or polynomial order that is 1, 2, 3 and Radial
Basis Function (RBF) to select the best kernel function for the selection of automated decision mak-
ing. to identify the normal and glaucoma images automatically. Authors use Support Vector Machine
classifier with the kernel having polynomial order 2 and achieve an accuracy of 95%, sensitivity and
specificity of 93.33% and 96.67% respectively. In this paper [73], the authors used automatic screening
of Glaucoma from fundal retinal images in a person via complex wavelet features and trispectrum. At
first, gray-scale conversion is done and then Random transform and histogram equalization is done to
enhance the input retinal image. optic disk segmentation is carried out using region separation and
binary conversion. After that features are extracted with the compensation of trispectrum, complex
wavelet and segmented area features. For the classification of the images to check whether it’s normal
or glaucoma training of neural network will be processed via conjugate gradient descent algorithm.
Rim-One database is used in this experiment. comparison was also made in this paper with the exiting
methods and Proposed technique has outperformed existing method by having better accuracy value of
81%.
3.1. Fundus image applications of ML
Lim et al. [74] implemented the deep learning approach on OD segmentation. This technique
allows to obtain correctness of OD segmentation and that is used to govern the most biding situations
for manual examination. Maninis et al. [75] inspected fundus images to segment OD and blood vessels
respectively. Al-Bander et al. [76] segmented both fovea and OD and used the technique based on deep
learning approach with an accuracy of 97.5%. Mitra et al. [77] recently reported some drawbacks of
Al-Bander et al. [76] work while arguing that he uses gray-scale images data loss occurs. To avoid
these drawbacks like in [75] [76] of OD segmentation, the authors used batch-normalization in CNN.
Mitra at el. [77] took fundus images to detect glaucomatous OD. This technique used a trained model
with dataset i-e ImageNet and its output is replaced by the new layer for output 2 nodes for glaucoma
and normal classes respectively. When this work was compared with the pervious work we found out
that this work gathers a large amount of data and is considered the most robust one compared to the
rest of the works.
FCNN [78] is a very famous and re-known technique for classification-based problems associated
with biomedical images [79]. X Sun et al. [80] make use of much faster RCNN architecture for OD
segmentation from fundus images that are based on deep object detection architecture respectively.
Figure 9 below shows the flow of basic neural network and how it works.
Ghassabi et al. [81] integrated approach of cup segmentation and ONH using SOM i-e self-organizing
Mathematical Biosciences and Engineering Volume 18, Issue 3, 2033–2076.2046
Figure 9. Basic neural network architecture.
maps for the assessment of glaucoma.it was an effective approach when there were unclear NRR, low
intensities of OC, and non-obvious para-papillary shrivel. Table 4 represents a summary about various
techniques that are discussed above.
4. Simple segmentation approaches
In this section different segmentation approaches will be discussed i.e. optic disc segmentation
approaches, optic cup segmentation approaches, and a combination of optic disc and optic cup seg-
mentation. While in most of the published research, optic disc segmentation approaches are described
and in others, only optic cup segmentation approaches are used while some other published research
models have only concerned with a mixture of the optic cup and optic disc segmentation approaches.
But here we have focused on the optic disc, optic cup and their mixture of approaches.
4.1. Optic disc segmentation approaches
According to Cheng et al. [84], segmentation of disc is very crucial in the detection of different
applications concerned with computer-aided systems, including detection of glaucoma using fundus
images. Ahmad et al. [85] stated that the segmentation mainly depends on searching disc pixels that
are mostly centered. It has been specially studied for the It has been extensively studied for solicita-
tion in the diabetic shielding procedure in Kavitha et al. [86]. Zhang et al. [87] stated the problems
related to segmentation and the disc is track down. According to experimental results, the proposed re-
search outperformed the state-of-the-art to detection of glaucoma because the segmentation techniques
measures the disc boundary which is a critical task because there are several clotting between blood
vessels.
Welfare et al. [88] proposed an adaptive method for the segmentation of fundus images. In this re-
Mathematical Biosciences and Engineering Volume 18, Issue 3, 2033–2076.2047
Table 4. Summary of glaucoma detection approaches based on ML techniques.
Authors Methodology Datasets Accuracy
Ghassabi et al. SOM NN SEED-DE, DRIVE,RIM-ONE 97.50%
[81]
Lim et al. [74] 3-class CNN N/A N/A
AL-Bander et al. CNN MESSIDOR 96.89%
[76]
Mitra et al. [77] CNN EyePACS, MESSIDOR 99.05%
Maninis et al. CNN DRIU RIM-ONE, DRIVE, DRIONS-DB, N/A
[75]
Tan et al. [82] CNN 7-Hiden DRIVE 92.68%
layers
Zilly et al. [83] Ensemble Learn- DRISHTI-GS, RIM-ONE N/A
ing CNN
Lim et al. [74] ResNet50-FCN STARE, HRF, RIM, ONE, 3 CENTRE 91.60%
Raja et al. [73] Complex wavelet RIM-ONE 81%
features and tri-
spectrum
search the experiments are performed on two different sets of databases i.e. DRIVE and DIARETDB1
with a dataset of 89 images and an accuracy of 100% is achieved. Tjandrasa et al. [89] applied Hough
transform at the initial level for the segmentation of optic disk. According to Tavakoli et al. [90], in
retinal analysis the identification of OD or ONH are important for vessel tracking-ness and for lo-
calization of anatomical objects. In the fundus images ONH are brightest in appearance therefore
localization is done with high intensity pixels with high gray scale values. Tavakoli et al. [90] pre-
sented three retinal vessel segmentation techniques for automatic ONH detection. The three databases
named Mashhad University Medical Science Database (MUMS-DB), DRIVE and CHASE DB1. Al-
though the fundus images are colored images but green channel has been used as it has clear contrast.
Morphological operations have been used to increase the contrast between vessel and background as a
pre-processing [90]. Image is inverted to deal with the background brightness variation in the whole
fundus image so that it doesn’t cause false or missed vessel detection. Multi-overlapping window has
been used, its size and window overlapping have great impact on method’s accuracy. For retinal vessel
segmentation the edge detector used are Laplacian of Gaussian, Canny and Matched filter. Sensitivity
and specificity are used as an evaluation criteria, higher values of both parameter indicates the best
performance.
In an automatic diagnosis, retinal vessel detection and segmentation is a basic step and is very
important subject in the field of medical image processing [91]. Although numerous methods and
techniques have been proposed but none of them is fast enough to be used in real automatic detection
as manual detection is very tedious process. So Bibiloni et al. [91] developed an algorithm for real-time
retinal segmentation based on fuzzy morphological operations by taking into consideration the usage
of cost and operations. Retinal images are being used in the detection of many medical problems such
that glaucoma or diabetic retinopathy. Retinal images are acquired from fundus camera. These images
Mathematical Biosciences and Engineering Volume 18, Issue 3, 2033–2076.2048
are very noisy, blurred and low contrast so there is uncertainty which can cause lack of information
and indefinite. To enhance contrast authors used top-hat transformation and by taking the advantage
from fuzzy logic and set theory in fuzzy mathematical morphology has been used to handle it the
uncertainty present in the images. The DRIVE and STARE databases has been used and precision,
accuracy, specificity and sensitivity are used as a performance evaluation criteria. The results have
been evaluated and compared with other methods of state-of-the-art. According to Bibiloni et al. [91]
proposed method improves segmentation and has better performance when comparing with real-time
systems. Agarwal et al. [92] presented an automatic techniques for strategic OD Segmentation. They
used morphology-based and edge detection techniques for correctly segmentation of OD and snake-
based active contour fitting has been used for exact boundary detection. For experiments 60 fundus
images were used. Computational time and overlapping score have been calculated between segmented
optic disc and ground truth [92]. Results shows that proposed method has more than 90% overlapping
score which shows the accuracy of the method and very helpful for automatic screening of patients.
According to Pal et al. [93], the segmentation of OD in retinal fundus images is important in diagnosis
process for the detection of many diseases. Pal et al. [93] presented a technique for OD segmentation
based on morphological operations that has been applied on different channels of the fundus images.
Contrast Limited Adaptive Histogram Equalization (CLAHE) has been performed and discussed for
the choice of clip limit to enhance the contrast. RIM-ONE dataset of 290 images of glaucoma has been
used. To make segmentation process effective by using simple canny edge detection approach various
morphological techniques have been combined. The performance has been evaluated on ground truth
and the parameters such as sensitivity, specificity, accuracy and overlapping ratio are used [93]. The
comparison has been performed with state-of-art methods. Table 5 below summarizes all the discussed
techniques for OD segmentation.
4.2. Model based segmentation approaches
Wang et al. [94] proposed model based segmentation for early detection of glaucoma. In this method
the images are taken locally not globally as it works efficiently by taking a small region of the defective
area. Fourier transform is used to detect the center of glaucomatous images by taking the linear oper-
ations as dimensional function of gaussian filter while the multiple features are taken as superposition
of the gaussian filter Deng et al. [95]. Then features are separated by K-Means clustering technique.
Different models are selected based upon the size of the block which varies and it depends on the re-
searcher criteria. The akakie information criteria is used to select the best model over the rest. The
dataset used here is 20 and it is obtained by STARE dataset. The image is first converted in to gray
scale. The model used is cheap and easy to use but it has some difficulty as it is quite robust in its
functioning and probably uncertainty occur due to low scale ratio. The algorithm works best with the
specificity of 93% and having a sensitivity factor of 82%.
According to Vermeer et al. [96] there are so many methods that are used for the early detection
of glaucoma in fundus images but the result are not always accurate and satisfactory but he present a
unique model for this purpose. The approach used here is the Laplace. The image used in this model are
selected by Gx, a laser based device and it selected two kinds of images. The blood vessels obtained by
this method are of both types i.e. light as well as dark. A gaussian filter is applied here to smoothen the
corresponding image. This model first find out the dark portion and then comes to the inner portion.
Laplacian filter is applied and objects are divided by thresholding one to one, two or more objects.
Mathematical Biosciences and Engineering Volume 18, Issue 3, 2033–2076.2049
Table 5. Summary of segmentation-based approaches.
Authors Methodology Datasets Accuracy
Cheng et al. [84] Superpixel classifi- 650 N/A
cation
Ahmed et al. [85] Thresholding, 121 97.50%
edge-based
Kavitha et al. [86] Automatic segmen- 36 N/A
tation
Zhang et al. [87] ARGALI approach 1564 96%
Welfer et al. [88] Adaptive morpho- 89 100%
logical approach
Tjandrasa et al. [89] Hough transform 30 75.56%
Tavakoli et al. [90] Automatic OND MUMS- N/A
detection based DB,DRIVE
on segmentation and
based approaches CHASE
and mathematical DB1
morphology
Bibiloni et al. [91] Fuzzy morpholog- DRIVE and 93.8% for
ical algorithm for STARE DRIVE.
real-time system 95.4% for
STARE.
Agarwal et al. [92] Morphological 60 fundus N/A
techniques and images
active contour
fitting
Pal et al. [93] Mathematical mor- RIM-ONE 98%
phology for OD database of
Segmentation 290 fundus
images
Noise is removed by separating small objects but this process will remove fine details of important
features, so to sort out this problem fragment vessels and then perform separation. Orlando et al. [97]
proposed a conditional random field model for the diagnosis of glaucoma. The different parameters
are used here and are learned automatically by the help of vector machine. Different datasets are used
for this purpose. The summary of the model-based approaches is shown in Table 6.
4.3. Optic cup segmentation approaches
Segmentation in the optic cup is more difficult than the segmentation of optic disk because the
density of blood vessels is high in the optic cup compared to the optic disk. Moreover, the gradual
change of intensity in the optic cup and NRR make the segmentation more difficult in optic cup. When
Mathematical Biosciences and Engineering Volume 18, Issue 3, 2033–2076.2050
Table 6. Summary of model-based approaches.
Authors Methodology Dataset Accuracy
Wang at el. [94] Vessel seg- STARE 93%
mentation
algorithm
Deng at el. [95] Adaptive Private dataset N/A
Gaussian
filtering
algorithm
Vermeer et al. Laplace and GX images Sensitivity 92%
[96] thresholding and specificity
segmentation 91%
Orlando et Potts model DRIVE, STARE, N/A
al. [97] CHASEDB1,
and HRF.
a person has glaucoma then due to its presence cup size automatically changes. According to Ingle
et al. [98], the detection of glaucoma CDR is a crucial method having a region of the cup to disc. In
this proposed methodology region of the cup is detected from the dataset. ROI varies differently in
different images. An automatic cup region procedure has been used here in this research [98].
Joshi et al. [99] proposed an automatic technique for early detection of glaucoma. In this research,
an automatic OD parametrization technique is applied to segment monocular retinal images. Cup
segmentation is done by vessel bends which are quite close to the detection of glaucoma. There exist
a variation between the mathematical and photometric changes. The OC segmentation obtained in this
way is quite efficient and effective. Damon et al. [100] proposed a method for automatic detection of
the optic cup fused with kinks Finkelstein et al. [101] approach. Here blotches are extracted from the
OD by the help of kinks and for vessel detection, the color and edges are determined with the help of
patches. Xu et al. [102] proposed super-pixel-based framework by using segmentation of optic cup in
glaucoma detection. Xu et al. [103] applied super pixel and different tasks are formulated with their
solution using LRR approach. Table 7 concludes the above studies.
4.4. Fusion-based approaches
In computer vision and image analysis, fusion-based approaches are used to enhance the perfor-
mance of image classification model [104, 105]. According to Ho et al. [106], many features are
extracted for the identification and detection of glaucoma. To differentiate between optic disc and op-
tic cup histogram, dissemination is calculated from the previous studies of optic images proposed by
Chang et al. [107]. The active contour model is used for early detection using different vessels. Here
for the identification of major peaks erosion and dilation techniques are used. Moreover eroded and
dilated image differentiation was used for the extraction of the main peak using the reverse histogram.
Wong et al. [108] proposed an automatic technique for the detection of glaucoma i.e. ARGALI and it
is used for the segmentation of optic disc and optic cup. This paper makes use of SVM and NN fusion
Mathematical Biosciences and Engineering Volume 18, Issue 3, 2033–2076.2051
Table 7. Summary of optic-cup segmentation approaches.
Authors Methodology Dataset Accuracy
Ingle et al. [98]
Gradient method N/A N/A
Joshi et al. [99]
Automatic OC parameteriza- 138 N/A
tion technique
Damon et al. Vessel kinking 67 N/A
[100]
Xu et al. [102] Super-pixel framework and 482 N/A
domain adaptive technique
Xu et al. [103] Super-pixel framework 650 N/A
Classifier learning process
classification refinement
scheme.
instead of ARGALI. Here the results show that SVM has greater consistency compared to NN which
proves that SVM could be the best option in the replacement of the ARGALI approach. Figure 10
shows the architecture of SVM based technique.
Yin et al. [109] proposed a statistical model-based methodology for performing the segmentation
of OD and OC. This method makes a fusion of Hough transform and optimal channels for OD seg-
mentation. It is then enhanced to OC segmentation which is assumed to be a more critical and time
taking task. Here 325 images are used for testing. The results obtained by using these approaches are
promising efficient because the methods used are quite intelligent. Chandrika et al. [110] proposed
K-means pixel clustering technique and gabor wavelet transform to segment images and CDR is cal-
culated using different parameters of quantitative measures. In this research, the normal CDR ratio is
0.3 and if the CDR ratio enhances from 0.3 then it is considered to be glaucomatous otherwise it is
considered to be non-glaucomatous. Annu et al. [111] proposed a Probabilistic Neural Network(PNN)
for the segmentation of optic cup and optic disc. PNN classification is further divided into two different
phases i.e. training and testing. The accuracy encounter here is 95% which shows the effectiveness
of this approach. Fu et al. [112] proposed a deep learning approach that is M-Net which solves the
problem of OD and OC segmentation together on a single system. It has several layers and these layers
are responsible for the formation of the pyramid of image. Polar transformation Dhar et al. [113] also
used it. The dataset used here was ORIGA.
Wong et al. [114] formulated a morphological attribute for identification of glaucoma which is
termed as kinks. The different features are extracted from the images with help of edge detection
approaches and the different edges of the vessels provide kinks and consequently with the help of these
kinks the cup and disc surroundings are measured. The results show that these kinks provide very little
error in measurement which proves that these methods are quite beneficial to use. Figure 12 illustrates
the basic deep learning architecture that is being used for the detection. Murthi et al. [115] proposed an
automatic approach for the extraction of features from colored images. For the detection of glaucoma,
CDR is a core feature that should be calculated very carefully. An algorithm is proposed here which is
used to enhance the accuracy of the boundary and is known as least square fitting. ARGALI method
is used for the segmentation of optic disc and optic cup together. This algorithm improves the clinical
Mathematical Biosciences and Engineering Volume 18, Issue 3, 2033–2076.2052
Figure 10. Simple SVM based technique architecture.
elucidation of glaucoma and all implementation is done in MATLAB. According to Khalid et al. [116],
CDR or measurement is important for the detection of glaucoma in fundus images and due to the
ambiguous color pattern between the optical cup and the disk and its calculation is difficult. Khalid
et al. [116] proposed Fuzzy c-Mean(FCM) techniques for the segmentation of optic cup and disc with
aim to measure CDR. From the RGB fundus images the green channel has been used as green channel
has better contrast than others. Basic morphological operations such as erosion and dilation are used to
reduce vernacular. The elimination of vernacular part plays vital role to get effective segmented results
and the values of accuracy, sensitivity and specificity are improved. Ground truth and ROC analysis
have been used as an evaluation of proposed method for segmentation [116]. The result shows the
effectiveness of FCM segmentation algorithm with morphology.
According to Nugroho et al. [117], the retinal abnormality such as glaucoma is diagnosed by mea-
suring the CDR (cup-to-disc ratio) so segmentation of both optic cup and disc is important. Two
approaches for segmentation of fundus images are proposed by Nugroho et al. [117]. For optic disc
segmentation active contour with integration of reconstruction of morphology has been used and for
optic cup segmentation reconstruction of morphology with convex hull has been utilized [117]. In
segmentation process retinal vessel removal for cup segmentation and channel extraction with some
Mathematical Biosciences and Engineering Volume 18, Issue 3, 2033–2076.2053
Figure 11. Flow of deep learning architecture.
contrast improvement to reduce noise for optic disc segmentation has been performed. The experiments
have been performed on 50 colored images of DRISHTI-GS dataset. The parameters such as accuracy,
sensitivity and specificity are used to evaluate the performance of the proposed approach [117]. Table
8 summarizes the methodology, datasets and the metrics that are used for the evaluation of the research
models that are discussed here.
5. Multi-scale based approaches
Zhang et al. [118], presented a segmentation algorithm for recognition of vessel or non-vessel pix-
els based on a texton dictionary. In contrast to the previous researches that learned filter parameters
from image pixels that were labeled manually, the proposed approach derived filter parameters from a
small collection of image features termed as keypoints. Gabor Filter bank was used for the extrication
of keypoints that represented features based on a SIFT inspired approach. The keypoints were deter-
mined from the validation set, the seeds derived from the validation set are used to initialize k-means
clustering technique which is ultimately used to create a texton dictionary for some other training set.
Testing is performed using NN classifier and DRIVE database is used for evaluation. The experiments
Mathematical Biosciences and Engineering Volume 18, Issue 3, 2033–2076.2054
Table 8. Summary of fusion based approaches.
Authors Methodology Dataset Accuracy
Ho et al. [106] Active contour N/A N/A
model
Wong et al. [108] ARGALI SVM N/A N/A
Yin et al. [109] Statistical model- 325 N/A
based segmenta-
tion
Chandrika et al. [110] K-Means pixel N/A N/A
clustering tech-
nique, Gabor
wavelet transform
Annu et al. [111] PNN 20 95%
Fu et al. [112] M-Net 650 N/A
Wong et al. [114] Kinks 27 N/A
Murthi et al. [115] ARGALI N/A N/A
Khalid et al. [116] FCM with mor- 27 HRF 90.26% for
phology images OC and
93.70% for
OD
Nugroho et al. [117] Morphological 50 colored 99.13% for
reconstruction- images of OC. 96.30%
based segmenta- DRISHTI- for OD.
tion for OC and GS.
OD
demonstrated that the robustness of extracted clusters based on kerpoints as compared to the manually
labelled pixels. The textons mitigate the problems associated with inter and intra-observer variability
and appeared to be a better representative of vessel/non-vessel classes. According to Li et al. [119],
ground truth is critical for evaluation of segmentation algorithms, however, the ground truth estimation
from manual segmentation collections remains a challenging task. To deal with inter-rater variation
there is a need to create a proper estimation approach. The authors performed an analysis in order to
develop a better understanding and investigate the significance of patterns collected from manual seg-
mentation on ground truth. The authors proposed an approach based on level-set to estimate ground
truth using a probabilistic formulation. Segmentation is considered to be the first step according to the
authors for computer-based applications and its accuracy is also very important. Computer-based skin
lesion procedures that are used for the segmentation also become crucial. Preceding design informa-
tion is used in the model. Experiments were done on both artificial as well as natural data and it is
proved that preceding information gives more close, original and accurate results toward GT.
Ricci et al. [119] introduced vessel segmentation for the diagnosis of the retinal diseases that are
computer-aided i.e. glaucoma. Here a line detector is applied on the green channel from RGP of the
retinal image. The purpose of using the green channel is it provides the best result towards vessel
Mathematical Biosciences and Engineering Volume 18, Issue 3, 2033–2076.2055
background. The vessels have a shiny texture compared to backcloth. Moreover, the vessels seem
blazing over the green channel so it is preferred here to use a green channel. Two different segmentation
procedures are also used here. Both the segmentation procedures give efficient results. Fraz et al. [120]
proposed a supervised algorithm for segmentation of retinal images. A supervised algorithm is used
for the instinctive process of segmentation. Two databases that are DRIVE Niemeijer et al. [121]
and STRIVE Choi et al. [122] are used for image manipulation as well as the segmentation of retinal
fundus images. The algorithm has a training image at the start, then vessel features are extracted from
the training image and samples are labeled. The labeled samples have manual segmentation initially
then these labeled samples are trained with the help of the classifier. Then test images are taken
and again vessels are extracted the same as extracted for the training images. Then vessel features
and classifiers together perform vessel classification and finally the image is segmented. The average
accuracy achieved is 95.79%.
According to Zhang et al. [123], vessel segmentation problems in the retinal fundus images are
considered to be a very challenging and critical scenario. Here machine learning paradigm is proposed
for the identification of the texture features of the retinal images that are termed as texons. This paper
also proposed a filter bank that is used for the extraction of features, edges and different changes that
occur in an image. DRIVE and STARE databases are used and give efficient results when 20 images
are encounter here. Table 9 summarizes the methodology, datasets and the metrics used to evaluate the
research discussed.
Table 9. Summary of multi-scale approaches.
Authors Methodology Database Accuracy
Zhang et al. [118] Retinal vessel segmentation using multi-scale texton. DRIVE 95.05%
Li et al. [119] Manual segmentation, GT algorithm XOR STAPLE N/A
Ricci et al. [119] Retinal vessel segmentation DRIVE 94.52%
Fraz et al. [120] Gaussian mixture model DRIVE 95.79%
STARE
Zhang et al. [123] Machine learning paradigm DRIVE 95.91%
6. Texture feature-based approaches
According to Septiarini et al. [124], the area of RNFL has textured surface with a number of streaks
or ridges of white color and their texture is uniformly disturbed and clear in normal human eye but in
the eyes of person having glaucoma the layer of nerve fiber disoriented. Septiarini et al. [124] proposed
a technique based on texture attributes for automatic detection of RNFL. Co-occurrence matrix has
been acquired from the outer area of optical nerve head and whether to remove blood vessels they
are considered as the detection of RNFL is easy in this part. For the detection of RNFL the different
classifiers are applied but Back Propagation Neural Network (BPNN) classification approach get better
accuracy [124]. 40 retinal fundus images have been used in experiment and for the evaluation purpose
sensitivity, specificity, and accuracy are calculated.
Kirar et al. [125] proposed a computer aided diagnosis (CAD) method for glaucoma from fundus
images based on Empirical Wavelet Transform (EWT) and Discrete Wavelet Transform (DWT). After
Mathematical Biosciences and Engineering Volume 18, Issue 3, 2033–2076.You can also read