Climate Change and Variability - Horizons Region - Horizons Regional Council
←
→
Page content transcription
If your browser does not render page correctly, please read the page content below
Climate Change and Variability
       - Horizons Region

September 2016

Horizons Report 2016/EXT/1499
Prepared for:

Abby Matthews                                                                                     September 2016
Horizons Regional Council                                                                Report No. 2016/EXT/1499
Private Bag 11025                                                                         ISBN 978-1-927259-67-2
Palmerston North 4442

Prepared by:

Petra Pearce, Vijay Paul, Brett Mullan,                                                     Report No. AKL2016-011
Christian Zammit, Abha Sood, Rob Bell, Cliff Law,                                                 Project. ELF16204

For any information regarding this report please contact:
Petra Pearce
Climate Scientist
Climate Applications
+64-9-375 2052
petra.pearce@niwa.co.nz

National Institute of Water & Atmospheric Research Ltd
Private Bag 99940
Viaduct Harbour
Auckland 1010
Phone +64 9 375 2050

         CONTACT    24 hr Freephone 0508 800 800               help@horizons.govt.nz                     www.horizons.govt.nz

                    Kairanga
                    Cnr Rongotea and                                                                     Levin
                    Kairanga-Bunnythorpe                                                                 11 Bruce Road
                    Roads                                      Palmerston North
                    Palmerston North                           11-15 Victoria Avenue                     Taihape
          SERVICE                                REGIONAL
                                                                                             DEPOTS      Torere Road
         CENTRES                                  HOUSES
                    Marton                                     Wanganui                                  Ohotu
                    Hammond Street                             181 Guyton Street
                                                                                                         Woodville
                    Taumarunui                                                                           116 Vogel Street
                    34 Maata Street

          POSTAL
                    Horizons Regional Council, Private Bag 11025, Manawatu Mail Centre, Palmerston North 4442      F 06 9522 929
         ADDRESS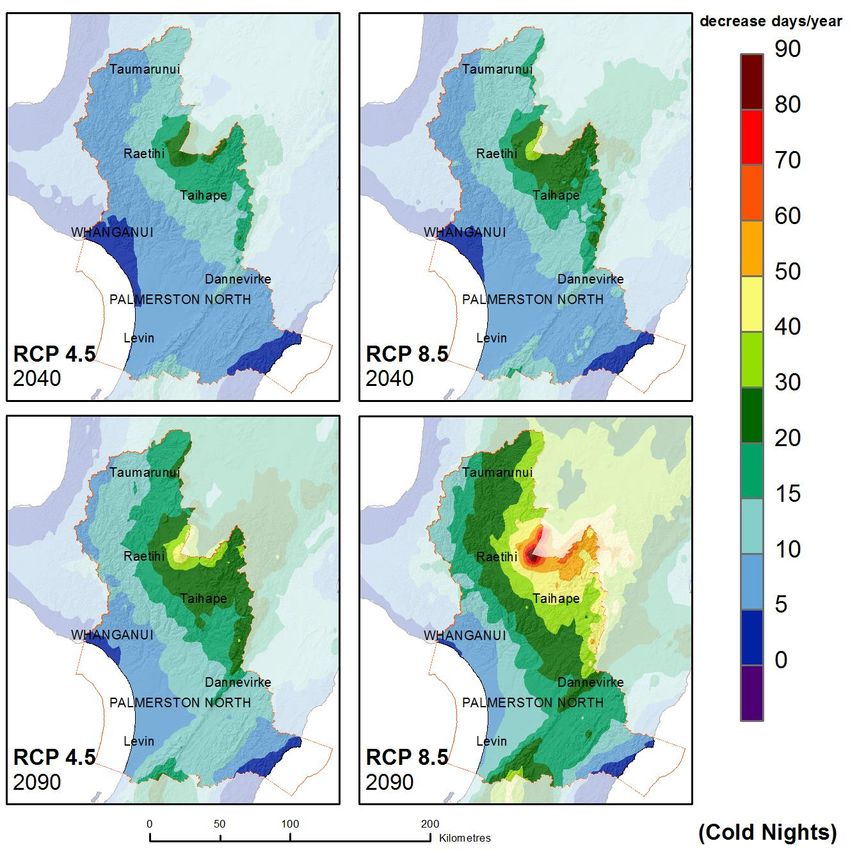
Climate Change and Variability -
       Horizons Region

      Prepared for Horizons Regional Council

                September 2016

                                               8 September 2016 10.22 a.m.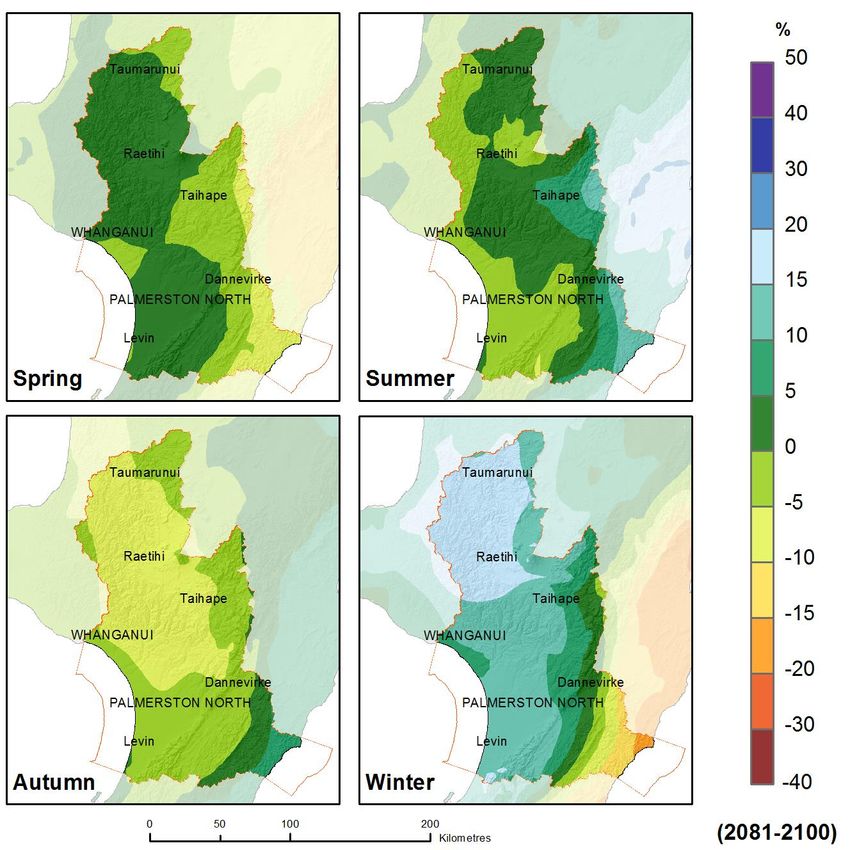
Prepared by:
Petra Pearce
Vijay Paul
Brett Mullan
Christian Zammit
Abha Sood
Rob Bell
Cliff Law

For any information regarding this report please contact:
Petra Pearce
Climate Scientist
Climate Applications
+64-9-375 2052
petra.pearce@niwa.co.nz

National Institute of Water & Atmospheric Research Ltd
Private Bag 99940
Viaduct Harbour
Auckland 1010

Phone +64 9 375 2050

NIWA CLIENT REPORT No:     AKL2016-011
Report date:               September 2016
NIWA Project:              ELF16204

 Quality Assurance Statement
                                                                Andrew Tait – Principal Scientist,
                                Reviewed by:
                                                                Wellington
                                                                Andrew Tait – Principal Scientist,
                                Formatting checked by:
                                                                Wellington
                                                                Ken Becker – Regional Manager,
                                Approved for release by:
                                                                Auckland

© All rights reserved. This publication may not be reproduced or copied in any form without the permission of
the copyright owner(s). Such permission is only to be given in accordance with the terms of the client’s
contract with NIWA. This copyright extends to all forms of copying and any storage of material in any kind of
information retrieval system.

Whilst NIWA has used all reasonable endeavours to ensure that the information contained in this document is
accurate, NIWA does not give any express or implied warranty as to the completeness of the information
contained herein, or that it will be suitable for any purpose(s) other than those specifically contemplated
during the Project or agreed by NIWA and the Client.

8 September 2016 10.22 a.m.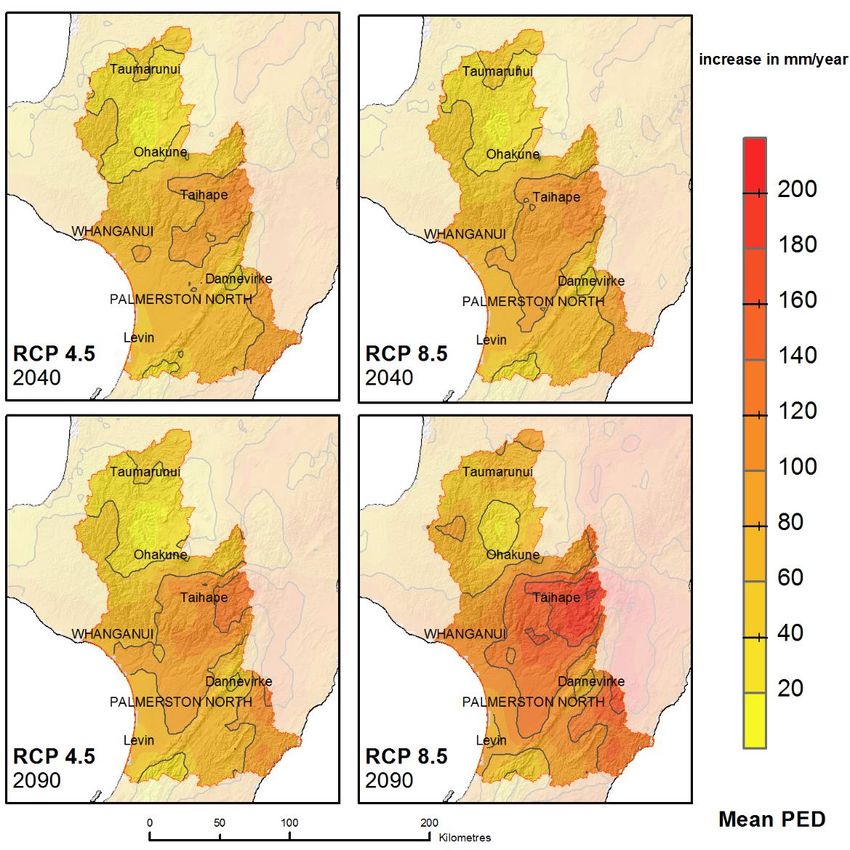
Contents

Executive summary ............................................................................................................. 7

1       Introduction ............................................................................................................ 12

2       Background: Global Climate Change – Science and Impacts ....................................... 14
        2.1      The Physical Science Basis (IPCC Working Group I) ................................................ 14
        2.2      Impacts, Adaptation and Vulnerability (IPCC Working Group II) ............................ 16
        2.3      Mitigation of Climate Change (IPCC Working Group III) ......................................... 17

3       Background: New Zealand Climate Change – Science and Impacts ............................. 18
        3.1      Sectoral Impacts ..................................................................................................... 18

4       Present Climate of Horizons Region .......................................................................... 21
        4.1      Spatial Patterns in Horizons Region’s Climate ........................................................ 21
        4.2      Temporal Variability in Horizon Region’s Climate .................................................. 24
                 4.2.1   Temperature............................................................................................ 24
                 4.2.2   Rainfall ..................................................................................................... 25
                 4.2.3   Drought.................................................................................................... 25
                 4.2.4   Extreme Rainfall Events ........................................................................... 28
                 4.2.5   Growing Degree Days .............................................................................. 29
        4.3      Natural factors causing fluctuation in climate patterns over New Zealand ........... 29
                 4.3.1     The effect of El Niño and La Niña ............................................................ 30
                 4.3.2     The effect of the Interdecadal Pacific Oscillation.................................... 31
                 4.3.3     The effect of the Southern Annular Mode .............................................. 33
        4.4      New Zealand Sea Level Trends and Variability ....................................................... 34

5       Projections of Horizons Region’s Future Climate ....................................................... 36
        5.1      Horizons Climate Change Temperature Projections............................................... 36
                 5.1.1    Projections of Growing Degree-Days ...................................................... 41
                 5.1.2    Water Temperature Trends..................................................................... 41
        5.2      Projections for Frosts and Hot Days under Climate Change ................................... 42
        5.3      Horizons Climate Change Precipitation Projections ............................................... 46
        5.4      Temperature and precipitation projection comparisons within RCPs ................... 54
        5.5      Scenarios for Changes in Extreme Rainfall ............................................................. 58
        5.6      Evaporation, Soil Moisture and Drought ................................................................ 62
        5.7      Pressure and Wind .................................................................................................. 66

Climate Change and Variability - Horizons Region
8 September 2016 10.22 a.m.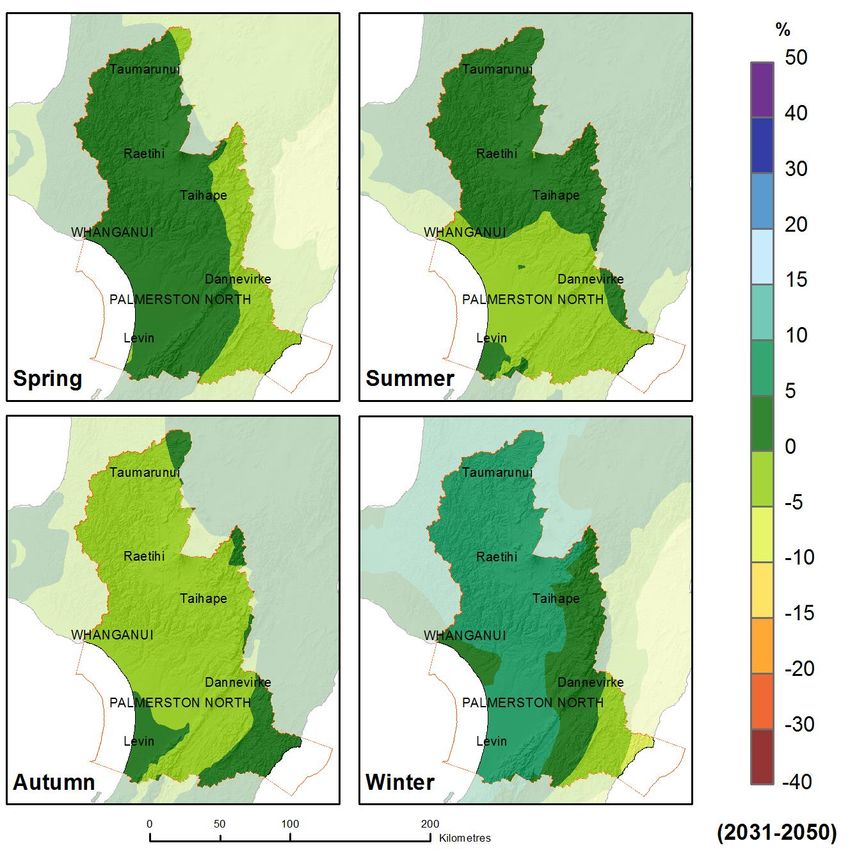
5.8     Hill Country Erosion ................................................................................................ 68
              5.8.1     Climate change impacts on sediment loads in rivers .............................. 70
      5.9     Solar Radiation ........................................................................................................ 70
      5.10 Climate Change and Sea Level ................................................................................ 71
           5.10.1 Effect of Sea-Level Rise on High Tide Exceedance Frequency................. 73
      5.11 Climate Change Impacts on Other Coastal Hazard Drivers .................................... 76
      5.12 Hydrological Impacts of Climate Change ................................................................ 77
      5.13 Ocean Acidification ................................................................................................. 79
           5.13.1 New Zealand-specific Impacts of Ocean Acidification ............................ 82
      5.14 Considering both Anthropogenic and Natural Changes ......................................... 83

6     Horizons Region – Impacts, Vulnerability and Adaptation ......................................... 85

7     Acknowledgements ................................................................................................. 87

8     References............................................................................................................... 88

Tables
Table 4-1:         Historical relative sea-level rise rates.                                     35
Table 5-1:         Projected changes in seasonal and annual mean temperature (in °C) for the
                   Horizons Region for 2040 and 2090.                                            41
Table 5-2:         Projected changes in the number of hot days and cold nights (frosts) at 2040
                   and 2090 for Horizons Region.                                                 45
Table 5-3:         Projected changes in seasonal and annual precipitation (in %) between 1986-
                   2005 and 2031-2050.                                                           50
Table 5-4:         Projected changes in seasonal and annual precipitation (in %) between 1986-
                   2005 and 2081-2100.                                                           51
Table 5-5:         Augmentation factors (percentage increases per degree of warming) used in
                   deriving changes in extreme rainfall for preliminary scenario studies.        59
Table 5-6:         Current rainfall depth-duration-frequency statistics for Palmerston North from
                   HIRDS V3.                                                                     59
Table 5-7:         Projected rainfall depth-duration-frequency statistics for Palmerston North in
                   2100, for a low-range temperature scenario (1°C warming), from HIRDS V3. 60
Table 5-8:         Projected rainfall depth-duration-frequency statistics for Palmerston North in
                   2100 for a mid-range temperature scenario (2°C warming), from HIRDS V3. 60
Table 5-9:         Projected rainfall depth-duration-frequency statistics for Palmerston North in
                   2100, for a higher-end temperature scenario (3°C warming), from HIRDS V3. 60
Table 5-10:        Data analysis of effect of sea-level rise at Foxton on components of tide.    75
Table 5-11:        Projected changes in flow variables of the Manawatu River (in %) between
                   1986-2005 and 2031-2050 (2040) and 2081-2100 (2090).                          77

                                                                                Climate Change and Variability - Horizons Region
8 September 2016 10.22 a.m.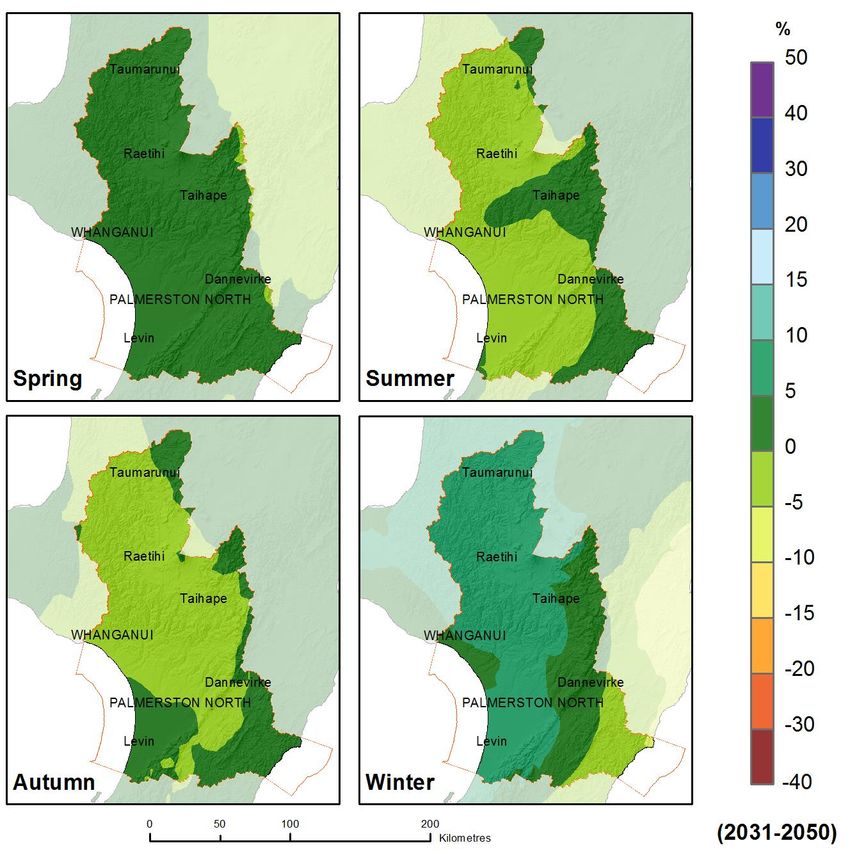
Figures
Figure 1-1:      The Horizons Regional Council area. The region administered by the Council is
                 outlined.                                                                   13
Figure 2-1:      CMIP5 multi-model simulated time series from 1950-2100 for change in global
                 annual mean surface temperature relative to 1986-2005.                      15
Figure 4-1:      Annual average temperature for the Horizons region (median for 1981-2010).
                 ©NIWA.                                                                      22
Figure 4-2:      Annual rainfall for the Horizons region (median for 1981-2010). ©NIWA.      22
Figure 4-3:      Homogenised annual temperature time series for Whanganui from 1938 to
                 2014.                                                                       24
Figure 4-4:      Annual rainfall total (mm) at Whanganui from 1890 to 2014 (top) and
                 Palmerston North from 1944 to 2013 (bottom).                                25
Figure 4-5:      PED accumulation from 1947-2015 (July-June years) for Taumarunui (agent
                 number 2250).                                                               26
Figure 4-6:      PED accumulation from 1939-2015 (July-June years) for Wanganui, Spriggens
                 Park EWS (agent number 3715).                                               27
Figure 4-7:      PED accumulation from 1940-2015 (July-June years) for Palmerston N (agent
                 number 3238) and Palmerston North EWS (agent number 21963) - combined
                 series.                                                                     27
Figure 4-8:      PED accumulation from 1950-2015 (July-June years) for Dannevirke (agent
                 number 2534).                                                               28
Figure 4-9:      Number of days per year with >2mm, >5mm and >10mm rain at Whanganui,
                 Spriggens Park EWS site.                                                    28
Figure 4-10:     Median annual growing degree-days in Horizons Region, 1981-2010. Left: Base
                 5°C, Right: Base 10°C.                                                      29
Figure 4-11:     Time series of the Southern Oscillation Index from 1930 to 2016. Blue shades
                 are indicative of La Niña periods and red shades are indicative of El Niño
                 periods.                                                                    30
Figure 4-12:     Average summer percentage of normal rainfall during El Niño (left) and La Niña
                 (right).                                                                    31
Figure 4-13:     The Interdecadal Pacific Oscillation (IPO) index.                           32
Figure 4-14:     Percentage change in average annual rainfall, for the 1978-1998 period
                 compared to the 1960-1977 period.                                           32
Figure 4-15:     Time series of the Southern Annular Mode from transient experiments forced
                 with time-varying ozone-depleting substances and greenhouse gases.          34
Figure 4-16:     Relative sea-level rise at four main New Zealand ports, 1900-2007. Modified
                 after Hannah and Bell (2012).                                               35
Figure 5-1:      Projected seasonal temperature changes at 2040 (2031-2050 average).         37
Figure 5-2:      Projected seasonal temperature changes at 2090 (2081-2100 average).         38
Figure 5-3:      Projected seasonal temperature changes at 2040 (2031-2050 average).         39
Figure 5-4:      Projected seasonal temperature changes at 2090 (2081-2100 average).         40
Figure 5-5:      Projected increase in number of hot days per year (Tmax >25°C) at 2040 &
                 2090 for RCP 4.5 (left panels) and RCP 8.5 (right panels), for Horizons
                 Region.                                                                     43
Figure 5-6:      Projected decrease in number of cold nights per year (Tmin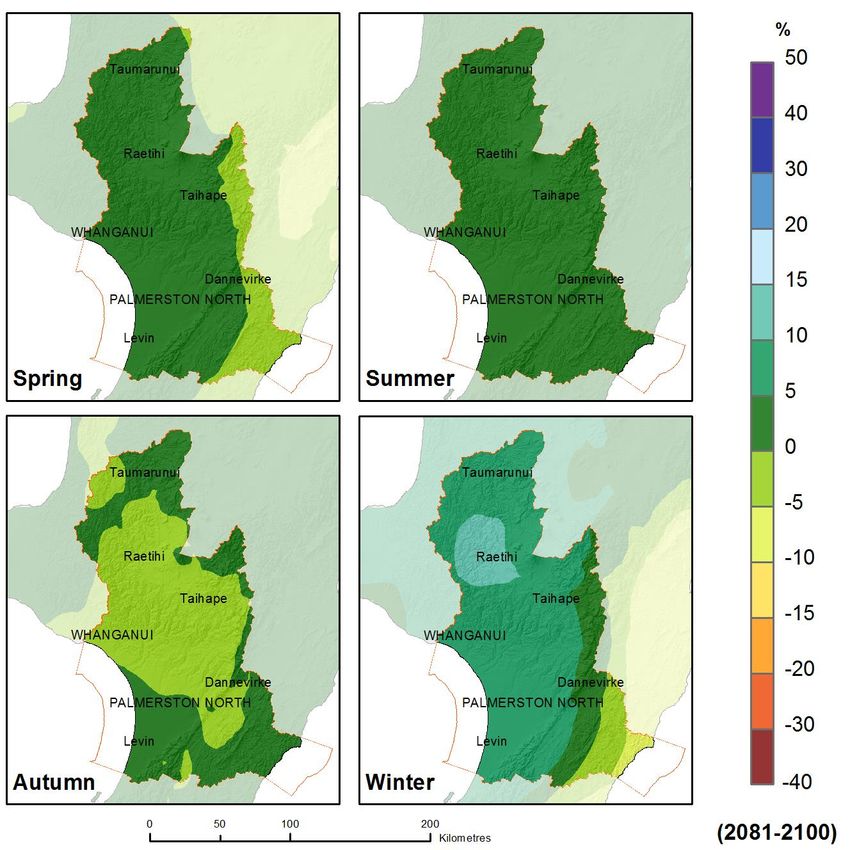
Figure 5-7:    Projected seasonal precipitation changes (in %) at 2040 (2031-2050
               average).                                                                      46
Figure 5-8:    Projected seasonal precipitation changes (in %) at 2090 (2081-2100
               average).                                                                      47
Figure 5-9:    Projected seasonal precipitation changes (in %) at 2040 (2031-2050
               average).                                                                      48
Figure 5-10:   Projected seasonal precipitation changes (in %) at 2090 (2081-2100
               average).                                                                      49
Figure 5-11:   Projected seasonal temperature changes by 2040 (2031-2050) averaged over
               the Horizons Region, for the four RCPs.                                        54
Figure 5-12:   Projected seasonal temperature changes by 2090 (2081-2100) averaged over
               the Horizons Region, for the four RCPs.                                        55
Figure 5-13:   Projected seasonal rainfall changes by 2040 (2081-2100) for Whanganui, for
               the four RCPs.                                                                 56
Figure 5-14:   Projected seasonal rainfall changes by 2090 (2081-2100) for Whanganui, for
               the four RCPs.                                                                 56
Figure 5-15:   Projected seasonal rainfall changes by 2040 (2081-2100) for Dannevirke, for
               the four RCPs.                                                                 57
Figure 5-16:   Projected seasonal rainfall changes by 2090 (2081-2100) for Dannevirke for the
               four RCPs.                                                                     58
Figure 5-17:   Change in the magnitude of the 99th percentile of daily precipitation (in %). 62
Figure 5-18:   RCM-projected changes in Potential Evapotranspiration Deficit (PED, in mm
               accumulation over the July-June ‘water year’) for Horizons Region.             63
Figure 5-19:   RCM-projected changes in the annual number (in days) of “dry days”
               (precipitation below 1 mm/day).                                                66
Figure 5-20:   Change in the magnitude of the 99th percentile of daily-mean wind speed, for
               all four RCPs and three future time periods.                                   68
Figure 5-21:   Projections of global mean sea level rise over the 21st century relative to 1986-
               2005.                                                                          71
Figure 5-22:   AR5 global mean sea-level projections extended to 2120 spliced with annual
               MSL from Wellington and Auckland.                                              72
Figure 5-23:   The frequency of occurrence of high tides exceeding different present day tide
               marks at Foxton.                                                               75
Figure 5-24:   Change in ocean surface pH.                                                    80
Figure 5-25:   Projected mean surface pH for the NZ EEZ open ocean from a suite of six
               CMIP5 models, using the RCP 8.5 scenario.                                      81
Figure 5-26:   Time series of Surface seawater pCO2 (µatm, top panel), pH (middle panel),
               and saturation state of the carbonate mineral, aragonite (lower panel).        81
Figure 5-27:   New Zealand Temperature - historical record and an illustrative schematic
               projection illustrating future year-to-year variability.                       84
Figure 6-1:    Time scales and adaptation. Planning for human-induced climate change
               becomes increasingly important as one moves right along this line.             85

                                                         Climate Change and Variability - Horizons Region
8 September 2016 10.22 a.m.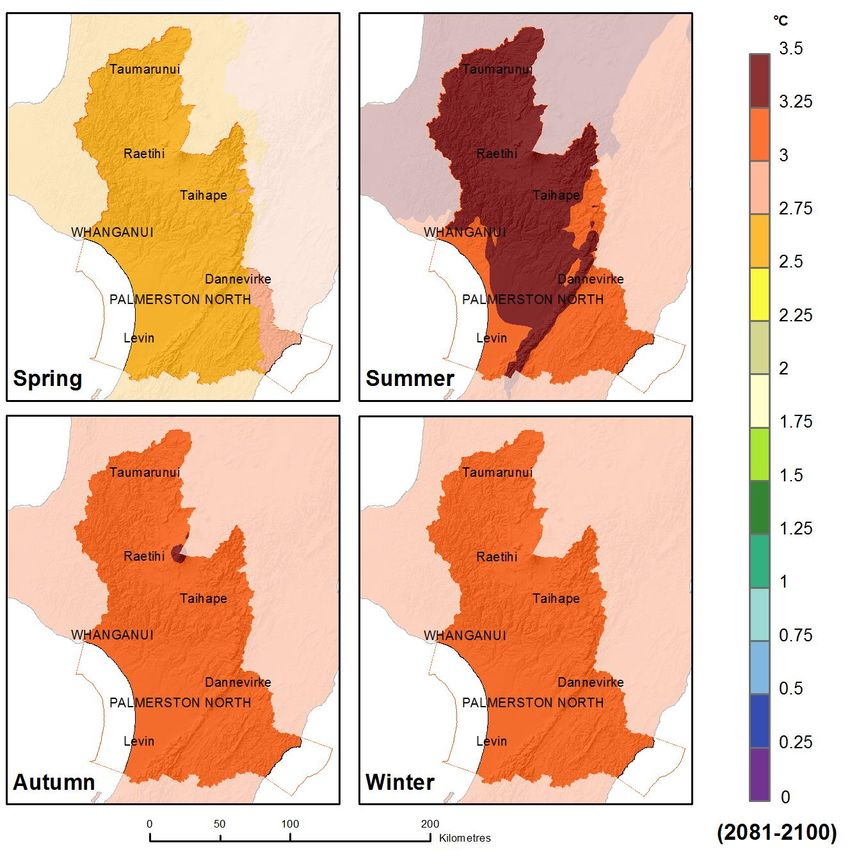
Executive summary
This report describes changes which may occur over the coming century in the climate of the region
administered by the Horizons Regional Council, and outlines some possible impacts of these changes.
To set the context, we summarise key findings of the recent (2013-2014) global climate change
assessment undertaken by the Intergovernmental Panel on Climate Change.
Warming of the climate system is ‘unequivocal’, and most of the observed increase in
globally averaged temperatures since the mid-20th century is very likely due to the increase
in greenhouse gas concentrations caused by human activities.
The IPCC updates projections for global and regional changes in temperature, sea level, and
precipitation for the coming century, and points to an expected increase in the frequency of
heavy rainfall events.
Recent global warming is already having physical and biological effects in many parts of the
world.
Work assessed by the IPCC indicates that limiting future global warming to targets which are
currently being discussed internationally would require substantial reductions in global
greenhouse gas emissions from human activities.
Continued emissions of greenhouse gases will cause further warming and changes in all parts
of the climate system. There are four scenarios named RCPs (Representative Concentration
Pathways) by the IPCC. These RCPs represent different climate change mitigation scenarios –
one (RCP 2.6) leading to a very low emissions level (requiring removal of CO2 from the
atmosphere), two stabilisation scenarios (RCPs 4.5 and 6.0), and one (RCP 8.5) with very high
greenhouse gas concentrations. Therefore, the RCPs represent a range of 21st century
climate policies.
Next, information is summarised about expected New Zealand national and regional impacts of
climate change, from the IPCC chapter on Australia and New Zealand.
New Zealand has warmed by 0.09 ± 0.03°C per decade since 1909, with more heat waves,
fewer frosts, more rain in the south and west of New Zealand, less rain in the north and east
of the North and South Islands, and a rise in sea level since 1900 of 1.7 ± 0.1 mm/yr.
Ongoing vulnerability in New Zealand to extreme events is demonstrated by substantial
economic losses caused by droughts, floods, fire, tropical cyclones, and hail. During the 21st
century, New Zealand’s climate is virtually certain to warm further, with noticeable changes
in extreme events.
Heat waves and fire risk are virtually certain to increase in intensity and frequency. Floods,
landslides, droughts, and storm surges are likely to become more frequent and intense, and
snow and frost to become less frequent.
Climate Change and Variability - Horizons Region 7
8 September 2016 10.22 a.m.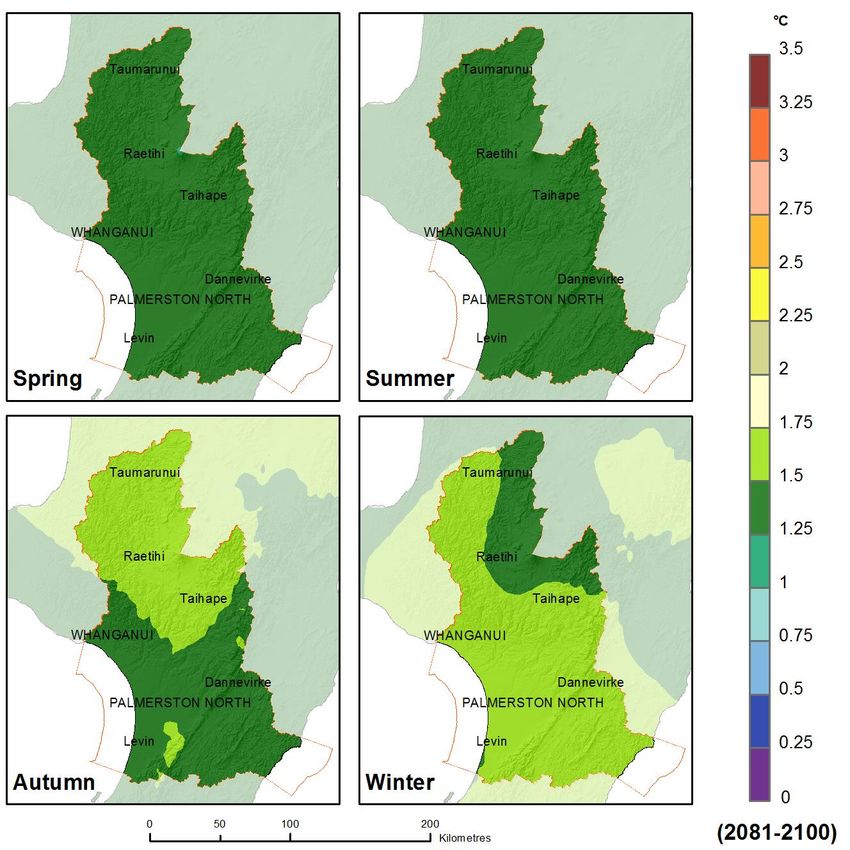
Precipitation changes are projected to lead to increased runoff in the west and south of the
South Island and reduced runoff in the northeast of the South Island, and the east and north
of the North Island.
The potential impacts of climate change on industry are likely to be substantial. New
Zealand’s predominantly hydroelectric power generation is vulnerable to precipitation
variability, changes in snow cover are likely to have a significant impact on the ski industry,
and pasture production may be impacted by warming and elevated CO2.
Horizons Region’s present climate is then described.
An upward trend in mean temperature, consistent with the overall New Zealand warming
through the 20th century, is apparent at the long-term climate monitoring site at Whanganui.
There are substantial year to year fluctuations in temperature superimposed on this long-
term trend, with some years being over 1.5°C different from others.
There is also substantial year to year variation in rainfall. Whanganui exhibits annual rainfall
totals ranging from around 600 mm up to more than 1200 mm, and Palmerston North
rainfall varies from about 700 to 1100mm.
Three natural fluctuations leading to year-to-year variations are the El Niño-Southern
Oscillation (ENSO), the Interdecadal Pacific Oscillation (IPO), and the Southern Annular Mode
(SAM). These factors also lead to fluctuations in sea level.
Projections for Horizons Region’s future climate are then covered:
Future temperature scenarios for 2040 (2031-2050 relative to 1986-2005) show that annual
average temperatures across the region are projected to increase by between 0.7°C (RCP 2.6)
and 1.1°C (RCP 8.5). By 2090 (2081-2100 relative to 1986-2005) annual average temperatures
are projected to increase by between 0.7°C (RCP 2.6) and 3.1°C (RCP 8.5). The greatest
warming is projected for summer or autumn (depending on the RCP) and the least warming
is projected for spring. A slight acceleration in warming is projected for the second 50 years
of the 21st century compared to the first 50 years under the higher emission scenarios, and
inland areas tend to warm more. There are only modest spatial gradients in the warming
relative to the mean increase. By 2090 for RCP 4.5, the greatest warming is expected to occur
in the northern half of Horizons Region in autumn, and in winter in most of the region apart
from the Central Plateau. For RCP 8.5 by 2090, most warming is expected for the part of the
region west of the Ruahine and Tararua Ranges, and inland from the coast, in summer.
Future precipitation projections indicate slightly more rainfall in spring and winter for much
of the region west of the Ruahine and Tararua Ranges to 2040, and less rainfall in autumn
and summer. By 2090 for RCP 4.5, more rainfall is projected for the western part of the
region in spring, summer, and especially winter. By 2090 under RCP 8.5, the north-western
8 Climate Change and Variability - Horizons Region
8 September 2016 10.22 a.m.part of Horizons Region is projected to receive more rainfall (by up to 20%) in winter, and the
eastern part of the region may receive less rainfall (by up to 20%) in winter.
For many of the chosen locations in Horizons Region, there is no clear precipitation signal,
even at 2090 under RCP 8.5. The ensemble-average is often less than ± 5%, with the model
range (the 5th and 95th percentile values) varying between quite large (>10%) increases and
decreases. By 2040 (2031-2050, relative to 1986-2005), winter is the season with the most
precipitation change, with a small increase in the ensemble-average (up to 8% across the
different locations and RCPs). Akitio and Owahanga are the only locations to show a negative
precipitation change by 2040.
By 2090, there is a clearer precipitation signal at most of the chosen locations. For most
places, winter is still the season with the most precipitation change, with some locations
projecting increases in the ensemble-average at around 15% (Ohakune has the highest
projected winter precipitation increase of 18% at RCP 8.5). The direction of projected
precipitation change is not uniform across the region; precipitation for Akitio and Owahanga
is projected to decrease by ~15% by 2090 under RCP 8.5.
Projections for Horizons Region for the coming century also include a substantial decrease in
cold nights, an increase in the number of hot days, and an increase in the frequency of very
heavy rainfall.
For engineering purposes some scenarios for changes in rainfall depth/duration/frequency
statistics are provided for Palmerston North.
Potential Evapotranspiration Deficit (PED) is calculated for the region, and analysis is broken
down into sub-regions. PED, in units of mm, can be thought of as the amount of rainfall
needed in order to keep pastures growing at optimum levels. A larger increase in PED over
time equates to more drought risk in the future. In Horizons Region, central and eastern
parts of the region experience the largest increases in PED by 2040 and 2090 under both RCP
4.5 and RCP 8.5.
An increase in drought frequency is projected for Horizons Region of about 5% for 2030-2050
and 10% for 2070-2090, compared to 1980-1999 levels. The Central Plateau is less likely to
be affected as the remainder of the region by climate change-induced drought. These
projections were calculated from the IPCC Fourth Assessment Report emissions scenarios
and will be updated in due course.
The frequency of extreme winds (99th percentile) over the 21st century is likely to increase in
the lower North Island (including Horizons Region).
Changes in annual rainfall patterns as well as extreme rainfall will impact rates of hillslope
erosion and river sedimentation. The northern and western portions of Horizons Region are
more susceptible to erosion than to the east of the Ruahine and Tararua Ranges. Climate
change will reduce the long-term effectiveness of SLUI (Sustainable Land Use Initiative) if
other management scenarios are not adopted.
Climate Change and Variability - Horizons Region 9
8 September 2016 10.22 a.m. New guidance on planning for sea level is expected in due course from the Ministry for the
Environment (the last update was published in 2008). In the interim we suggest using a
minimum sea-level rise scenario of 0.5 m by the 2090s (2090 to 2099) relative to the 1980-
1999 average for coastal planning, plus an assessment of sensitivity to possible higher mean
sea levels. For longer-term considerations an allowance for further sea-level rise of 10
mm/year beyond 2100 is recommended.
Currently, 10% of high tides at Foxton exceed the MHWS-10 level (Mean High Water Spring
level that 10% of high tides exceed, excluding weather and climate effects). With 0.4 m of
sea-level rise, approximately 60% of high tides will exceed this level and with 0.8 m of sea-
level rise about 99% of high tides will exceed this level, again excluding weather and climate
effects such as storm surge.
The following hydrological projections for the Manawatu River are presented, derived from
the national surface water hydrological model TopNet:
o Negligible change in mean annual flow is expected to occur under all RCPs at both
2040 and 2090.
o Mean annual flood is expected to increase across most RCPs at both time periods,
which is consistent with (small) mean annual precipitation increases for locations
near the Manawatu River.
o Mean annual low flow (Q10) is expected to decrease across all RCPs at both time
periods, except RCP 2.6 at 2090 (median = 1% increase). However, the range of
model results is quite large. The largest median ensemble change is projected for
2090 under RCP 8.5, which is a reduction in mean annual low flow of 12%.
o For average seasonal flows, the median model results for most RCPs at both time
periods are within ±5%, and the ranges of model projections are quite large.
However, under RCP 8.5 at 2090 for summer, flows are projected to decrease by 14%
(median model result). This is consistent with small projected decreases in summer
precipitation for the area around the Manawatu River for the same RCP and time
period. Spring flows are projected to slightly increase by 2040 but decrease by 2090
for most RCPs.
o FRE3 is the average number of high flow events (freshes or floods) per year that
exceed three times the median flow. Small decreases in the median model result for
FRE3 are projected for all RCPs except for RCP 8.5 at 2040 (small increase), and large
increases in FRE3 (>10%) are projected for all RCPs except RCP 2.6 (no change) at
2090.
The pH of the oceans around New Zealand is projected to decrease, consistent with global
trends. The variability and rate of change in pH will differ in coastal waters as these are also
10 Climate Change and Variability - Horizons Region
8 September 2016 10.22 a.m.influenced by terrestrial factors and run-off. Changes in ocean pH may have significant
impacts on New Zealand fisheries and aquaculture into the future.
The Council is referred to material published by the Ministry for the Environment for guidance on
assessing likely vulnerability and impacts for Horizons Region of these projected climate changes, and
for considering adaptation options. Relevant issues could include:
Implications of sea-level rise and coastal change for planning and development in coastal
areas.
Implications of river flow and sedimentation changes, as well as changing flood regimes for
river engineering planning.
Implications of potential changes in rainfall and of drought frequency for water demand,
availability and allocation (including planning for irrigation schemes and storage).
Implications of projected changes in extreme rainfall, erosion risk, and coastal hazards for
council roading and stormwater drainage infrastructure, lifelines planning, and civil defence
and emergency management.
Opportunities which climate change may bring for new horticultural crops – and
infrastructure and land-use issues that might arise.
Implications of climate change (including potential changes in flood frequency, extreme
rainfall (influencing hillslope and riverbank erosion) and in coastal hazards) for land-use
planning (e.g. erosion control measures).
Implications for natural ecosystems and their management, both terrestrial and marine. This
is especially relevant given the two National Parks and a number of forest parks in the region.
Building consideration of climate change impacts and adaptation into council planning as
outlined in MfE guidance. Also important is consultation and discussion with stakeholders
(e.g. groups of farmers, iwi) to help them identify climate-related risks and ways of building
resilience.
This Envirolink Medium Advice Grant did not allow any ‘new’ research to be undertaken. However,
during the compilation of this report, gaps were identified where further research for Horizons
Region would be useful in order to understand potential climate change-related impacts:
Region-specific modelling of climate-induced sea-level rise and coastal hazard drivers such as
storm surge and waves.
River flow projections for additional rivers in Horizons Region.
Climate Change and Variability - Horizons Region 11
8 September 2016 10.22 a.m.1 Introduction Horizons Regional Council applied for and received funding from the Envirolink Fund (Ministry of Business, Innovation, and Employment) for NIWA to undertake a review of climate change projections and potential impacts for the Horizons Region, since the publication of the Intergovernmental Panel on Climate Change (IPCC) Fifth Assessment Report in 2013 and 2014. This report describes climate changes which may occur over the coming century for the region administered by the Horizons Regional Council, and outlines some possible impacts of these changes. The report does not address the issue of mitigation (reducing greenhouse gas emissions, or increasing “sinks” such as areas of growing forest), apart from a brief summary of recent findings of the IPCC. Consideration is given to both natural variations in the climate and to changes which may result from increasing global concentrations of greenhouse gases caused by human activities. Climatic factors discussed include temperature, rainfall, wind, evaporation, and soil moisture. River flow variables are also considered. Possible changes along the coast in sea level are also considered. Figure 1-1 shows the Horizons Regional Council area of administration. Preparation of the report has been supported through an Envirolink medium advice grant. This did not fund any new data analysis, but enabled us to draw on information which is already available from various sources. Much of this information is very new, resulting from the latest assessments of the Intergovernmental Panel on Climate Change (IPCC, 2013, IPCC, 2014a, IPCC, 2014b), and scenarios for New Zealand generated by NIWA scientists based on downscaling from global climate model runs undertaken for these IPCC assessments (undertaken through NIWA’s core-funded Regional Modelling Programme). The climate change information presented in this report is entirely consistent with recently-updated climate change guidance produced for the Ministry of the Environment (Mullan et al., 2016). 12 Climate Change and Variability - Horizons Region 8 September 2016 10.22 a.m.
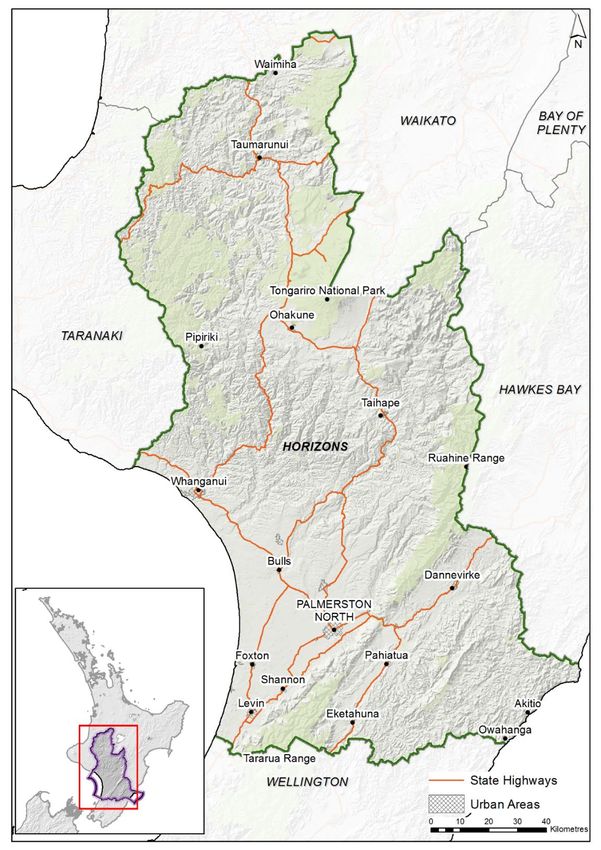
Figure 1-1:   The Horizons Regional Council area. The region administered by the Council is outlined.

Climate Change and Variability - Horizons Region                                                        13
8 September 2016 10.22 a.m.
2 Background: Global Climate Change – Science and Impacts
This section summarises some key findings from the 2013 and 2014 IPCC Fifth Assessment Reports
(AR5) as contextual information for the discussion of past and future climate changes in Horizons
Region to follow in this report.
2.1 The Physical Science Basis (IPCC Working Group I)
The Summary for Policymakers of the IPCC AR5 Working Group I Report (IPCC, 2013) emphasises the
following points regarding changes to the climate system:
Warming of the climate system is ‘unequivocal’, and since the 1950s, many of the
observed climate changes are unprecedented over short and long timescales (decades
to millennia). These changes include warming of the atmosphere and ocean,
diminishing of ice and snow, sea-level rise, and increases in the concentration of
greenhouse gases.
The atmospheric concentrations of carbon dioxide, methane, and nitrous oxide have
increased to levels unprecedented in at least the last 800,000 years. Carbon dioxide
concentrations have increased by 40% since pre-industrial times, primarily from fossil
fuel emissions and secondarily from net land use change emissions. The ocean has
absorbed about 30% of the emitted anthropogenic carbon dioxide, causing ocean
acidification.
Climate change is already influencing the intensity and frequency of many extreme
weather and climate events globally.
It is extremely likely that human influence has been the dominant cause of the
observed warming since the mid-20th century.
Continued emissions of greenhouse gases will cause further warming and changes in all parts of the
climate system. There are four scenarios named RCPs (Representative Concentration Pathways) by
the IPCC. These RCPs represent different climate change mitigation scenarios – one (RCP 2.6) leading
to a very low emissions level (requiring removal of CO2 from the atmosphere), two stabilisation
scenarios (RCPs 4.5 and 6.0), and one (RCP 8.5) with very high greenhouse gas concentrations.
Therefore, the RCPs represent a range of 21st century climate policies.
By the middle of the 21st century, the magnitudes of the projected climate changes are substantially
affected by the choice of scenario. Global surface temperature change for the end of the 21st
century is likely to exceed 1.5°C relative to 1850-1900 for all scenarios except for the lowest
emissions scenario (RCP 2.6).
In contrast to the Fourth IPCC Assessment Report which concentrated on projections for the end of
the 21st century, the Fifth Assessment Report projects climate changes for earlier in the 21st century
as well in its Summary for Policymakers. As such, the global mean surface temperature change for
the period 2016-2035 (relative to 1986-2005) will likely be in the range of 0.3 to 0.7°C. This assumes
that there will be no major volcanic eruptions (which may cause global cooling) and that total solar
irradiance remains similar. Temperature increases are expected to be larger in the tropics and
subtropics than in the southern mid-latitudes (i.e. New Zealand).
14 Climate Change and Variability - Horizons Region
8 September 2016 10.22 a.m.The full range of projected globally averaged temperature increases for all scenarios for 2081-2100 (relative to 1986-2005) is 0.3 to 4.8°C (Figure 2-1). As global temperatures increase, it is virtually certain that there will be more hot and fewer cold temperature extremes over most land areas. It is very likely that heat waves will occur with a higher frequency and duration. Furthermore, in general, the contrast in precipitation between wet and dry regions and wet and dry seasons will increase. With increases in global mean temperature, mid-latitude and wet tropical regions will experience more intense and more frequent extreme precipitation events by the end of the 21st century. Figure 2-1: CMIP5 multi-model simulated time series from 1950-2100 for change in global annual mean surface temperature relative to 1986-2005. Time series of projections and a measure of uncertainty (shading) are shown for scenarios RCP 2.6 (blue) and RCP 8.5 (red). Black (grey shading) is the modelled historical evolution using historical reconstructed forcings. The mean and associated uncertainties averaged over 2081−2100 are given for all RCP scenarios as coloured vertical bars. The numbers of CMIP5 models used to calculate the multi-model mean is indicated. After IPCC (2013). The global ocean will continue to warm during the 21st century. Eventually, heat will penetrate into the deep ocean and affect ocean circulation. Sea ice is projected to shrink and thin in the Arctic. Some scenarios project that late summer Arctic sea ice extent could almost completely disappear by the end of the 21st century, and a nearly ice-free Arctic Ocean in late summer before mid-century is likely under the most extreme scenario. Northern Hemisphere spring snow cover will decrease as global mean surface temperature increases. The global glacier volume (excluding glaciers on the periphery of Antarctica) is projected to decrease by 15-85% by the end of the 21st century under different scenarios. Global mean sea level will continue to rise during the 21st century. All scenarios project that the rate of sea level rise will very likely exceed that observed during 1971-2010 due to increased ocean warming and higher loss of mass from glaciers and ice sheets. For all scenarios, the total range of projected sea level rise for 2081-2100 (relative to 1986-2005) is 0.26-0.82 m. It is virtually certain that global mean sea level rise will continue beyond 2100, with sea level rise due to thermal expansion expected to continue for many centuries. The range for mean sea level rise beyond 2100 for different scenarios is from less than 1 m to more than 3 m, but sustained mass loss by ice sheets would cause larger sea level rise. Sustained warming greater than a critical threshold could lead to the near complete loss of the Greenland ice sheet over a millennium or more, causing a global mean sea level rise of up to 7 m. Current estimates place this threshold between 1 and 4°C global mean warming with respect to pre-industrial mean temperatures. Climate Change and Variability - Horizons Region 15 8 September 2016 10.22 a.m.
Cumulative CO2 emissions largely determine global mean surface warming by the late 21st century
and further into the future. Even if emissions are stopped, most aspects of global climate change will
persist for many centuries.

2.2     Impacts, Adaptation and Vulnerability (IPCC Working Group II)
The IPCC AR5 Working Group II Summary for Policymakers (IPCC, 2014a) concludes that in recent
decades, changes in climate have caused impacts on natural and human systems on all continents
and across the oceans. Specifically, these include impacts to hydrological systems with regards to
snow and ice melt, changing precipitation patterns and resulting river flow and drought, as well as
terrestrial and marine ecosystems, the incidence of wildfire, food production, livelihoods, and
economies.

Changes in precipitation and melting snow and ice are altering hydrological systems and are driving
changes to water resources in terms of quantity and quality. The flow-on effects from this include
impacts to agricultural systems, in particular crop yields, which have experienced more negative
impacts than positive due to recent climate change. In response to changes in climate, many species
have shifted their geographical ranges, migration patterns, and abundances. Some unique and
threatened systems, including ecosystems and cultures, are already at risk from climate change. With
increased warming around 1°C, the number of such systems at risk of severe consequences is higher,
and many species with limited adaptive capacity (e.g. coral reefs and Arctic sea ice) are subject to
very high risks with additional warming of 2°C. In addition, climate change-related risks from extreme
events, such as heat waves, extreme precipitation, and coastal flooding, are already moderate/high
with 1°C additional warming. Risks associated with some types of extreme events (e.g. heat waves)
increase further with higher temperatures.

There is also the risk of physical systems or ecosystems undergoing abrupt and irreversible changes
under increased warming. At present, warm-water coral reef and Arctic ecosystems are showing
warning signs of irreversible regime shifts. With additional warming of 1-2°C, risks increase
disproportionately and become high under additional warming of 3°C due to the threat of global sea
level rise from ice sheet loss.

Global climate change risks are significant with global mean temperature increase of 4°C or more
above pre-industrial levels and include severe and widespread impacts on unique or threatened
systems, substantial species extinction, large risks to global and regional food security, and the
combination of high temperature and humidity compromising normal human activities, including
growing food or working outdoors in some areas for parts of the year.

Impacts of climate change vary regionally, and impacts are exacerbated by uneven development
processes. Marginalised people are especially vulnerable to climate change and also to some
adaptation and mitigation responses. This has been observed during recent climate-related
extremes, such as heat waves, droughts, floods, cyclones, and wildfires, where different ecosystems
and human systems are significantly vulnerable and exposed to climate variability. In addition,
aggregate economic damages accelerate with increasing temperature.

In many regions, climate change adaptation experience is accumulating across the public and private
sector and within communities. Adaptation is becoming embedded in governmental planning and
development processes, but at this stage there has been only limited implementation of responses to
climate change.

16                                                       Climate Change and Variability - Horizons Region
8 September 2016 10.22 a.m.
The overall risks of climate change impacts can be reduced by limiting the rate and magnitude of
climate change.

2.3     Mitigation of Climate Change (IPCC Working Group III)
The IPCC AR5 Working Group III Summary for Policymakers (IPCC, 2014b) notes that total
anthropogenic greenhouse gas emissions have continued to increase over 1970 to 2010 with larger
absolute decadal increases toward the end of this period. Despite a growing number of climate
change mitigation policies, annual emissions grew on average 2.2% per year from 2000 to 2010
compared with 1.3% per year from 1970 to 2000. Total anthropogenic greenhouse gas emissions
were the highest in human history from 2000 to 2010. Globally, economic and population growth
continue to be the most important drivers of increases in CO2 emissions from fossil fuel combustion.

Limiting climate change will require substantial and sustained reductions of greenhouse gas
emissions. The IPCC report considers multiple mitigation scenarios with a range of technological and
behavioural options, with different characteristics and implications for sustainable development.
These emissions scenarios are consistent with different levels of mitigation.

The IPCC report examines mitigation scenarios that would eventually stabilise greenhouse gases in
the atmosphere at various concentration levels, and the expected corresponding changes in global
temperatures. Mitigation scenarios where temperature change caused by anthropogenic greenhouse
gas emissions can be kept to less than 2°C relative to pre-industrial levels involve stabilising
atmospheric concentrations of carbon dioxide equivalent (CO2-eq) at about 450 ppm in 2100. If
concentration levels are not limited to 500 ppm CO2-eq or less, temperature increases are unlikely to
remain below 2°C relative to pre-industrial levels.

Without additional efforts to reduce emissions beyond those in place at present, scenarios project
that global mean surface temperature increases in 2100 will be from 3.7 to 4.8°C compared to pre-
industrial levels. This range is based on the median climate response, but when climate uncertainty is
included the range becomes broader from 2.5 to 7.8°C.

In order to reach atmospheric greenhouse gas concentration levels of about 450 ppm CO2-eq by 2100
(in order to have a likely chance to keep temperature change below 2°C relative to pre-industrial
levels), anthropogenic greenhouse gas emissions would need to be cut by 40-70% globally by 2050
(compared with levels in 2010). Emissions levels would need to be near zero in 2100. The scenarios
describe a wide range of changes to achieve this reduction in emissions, including large-scale
changes in energy systems and land use.

Estimates of the cost of mitigation vary widely. Under scenarios in which all countries begin
mitigation immediately, there is a single carbon price, and all key technologies are available, there
will be losses of global consumption of 1-4% in 2030, 2-6% in 2050, and 3-11% in 2100.

Delaying mitigation efforts beyond those in place today through 2030 is estimated to substantially
increase the difficulty in obtaining a longer term low level of greenhouse gas emissions, as well as
narrowing the range of options available to maintain temperature change below 2°C relative to pre-
industrial levels.

Climate Change and Variability - Horizons Region                                                        17
8 September 2016 10.22 a.m.
3       Background: New Zealand Climate Change – Science and
        Impacts
Published information about the expected impacts of climate change on New Zealand is summarised
and assessed in the Australasia chapter of the IPCC Working Group II assessment report (Reisinger et
al., 2014). Key findings from this chapter include:

The regional climate is changing. The Australasia region continues to demonstrate long-term trends
toward higher surface air and sea surface temperatures, more hot extremes and fewer cold
extremes, and changed rainfall patterns. Over the past 50 years, increasing greenhouse gas
concentrations have contributed to rising average temperatures in New Zealand. Changing
precipitation patterns have resulted in increases in rainfall for the south and west of the South Island
and west of the North Island, and decreases in the northeast of the South Island and the east and
north of the North Island. Some heavy rainfall events already carry the fingerprint of a changed
climate, in that they have become more intense due to higher temperatures allowing the air to carry
more moisture (Dean et al., 2013). Cold extremes have become rarer and hot extremes have become
more common.

The region has exhibited warming to the present and is virtually certain to continue to do so. New
Zealand mean annual temperature has increased by 0.09°C (± 0.03°C) per decade since 1909.

Warming is projected to continue through the 21st century along with other changes in climate.
Warming is expected to be associated with rising snow lines, more frequent hot extremes, less
frequent cold extremes, and increasing extreme rainfall related to flood risk in many locations.
Annual average rainfall is expected to decrease in the northeast South Island and north and east of
the North Island, and to increase in other parts of New Zealand. Fire weather is projected to increase
in many parts of New Zealand. Regional sea level rise will very likely exceed the historical rate,
consistent with global mean trends.

Uncertainty in projected rainfall changes remains large for many parts of New Zealand, which
creates significant challenges for adaptation.

Impacts and vulnerability: Without adaptation, further climate-related changes are projected to
have substantial impacts on water resources, coastal ecosystems, infrastructure, health, agriculture,
and biodiversity. However, uncertainty in projected rainfall changes and other climate-related
changes remains large for many parts of New Zealand, which creates significant challenges for
adaptation.

Additional information about past New Zealand climate change can be found in (Mullan et al., 2016).

3.1     Sectoral Impacts
Some New Zealand sectors have the potential to benefit from projected changes in climate and
increasing CO2, including reduced winter mortality, reduced energy demand for winter heating, and
forest and pasture growth in currently cooler regions.

Freshwater resources: In New Zealand, precipitation changes are projected to lead to increased
runoff in the west and south of the South Island and reduced runoff in the northeast of the South
Island, and the east and north of the North Island. Annual flows of eastward-flowing rivers with
headwaters in the Southern Alps are projected to increase by 5-10% by 2040 in response to higher
alpine precipitation. Most of the increases will occur in winter and spring, as more precipitation falls

18                                                         Climate Change and Variability - Horizons Region
8 September 2016 10.22 a.m.
as rain and snow melts earlier. Climate change will affect groundwater through changes in recharge rates and the relationship between surface waters and aquifers. Natural ecosystems: Existing environmental stresses will interact with, and in many cases be exacerbated by, shifts in mean climatic conditions and associated changes in the frequency or intensity of extreme events, especially fire, drought, and floods. Ongoing impacts of invasive species and habitat loss will dominate climate change signals in the short to medium term. The rich biota of the alpine zone is at risk through increasing shrubby growth and loss of herbs, especially if combined with increased establishment of native species. Some cold water-adapted freshwater fish and invertebrates are vulnerable to warming and increased spring flooding may increase risks for braided river bird species. Coastal and ocean ecosystems: The increasing density of coastal populations and stressors such as pollution and sedimentation from settlements and agriculture will intensify non-climate stressors in coastal areas. Coastal habitats provide many ecosystem services including coastal protection and carbon storage, which could become increasingly important for mitigation. Variability in ocean circulation and temperature plays an important role in local fish abundance, and this could change with climate-related oceanic changes. A strengthening East Auckland Current in northern New Zealand is expected to promote establishment of tropical or subtropical species that currently occur as vagrants, potentially changing the production and profit of both wild fisheries and aquaculture. Estuarine habitats will be affected by changing rainfall or sediment discharges, as well as connectivity to the ocean. Loss of coastal habitats and declines in iconic species will result in substantial impacts on coastal settlements and infrastructure from direct impacts such as storm surge, and will effect tourism. Changes in temperature and rainfall, and sea level rise, are expected to lead to secondary effects, including erosion, landslips, and flooding, affecting coastal habitats and their dependent species, for example loss of habitat for nesting birds. Forestry: Warming is expected to increase Pinus radiata growth in the cooler south, whereas in the warmer north, temperature increases can reduce productivity, but CO2 fertilisation may offset this. Dothistroma blight, a pine disease, has a temperature optimum that coincides with New Zealand’s warmer, but not warmest, pine growing regions; under climate change, its severity is, therefore, expected to reduce in the warm central North Island but increase in the cooler South Island where it could offset temperature-driven improved plantation growth. Agriculture: Projected changes in national pasture production for dairy, sheep, and beef pastures range from an average reduction of 4% across climate scenarios for the 2030s, to increases of up to 4% for two scenarios in the 2050s. Studies modelling seasonal changes in fodder supply show greater sensitivity in animal production to climate change and elevated CO2 than models using annual average production, with some impacts expected even under modest warming. New Zealand agro- ecosystems are subject to erosion processes strongly driven by climate - greater certainty in projections of rainfall, particularly storm frequency, are needed to better understand climate change impacts on erosion and consequent changes in the ecosystem services provided by soils. Energy supply, demand, and transmission: New Zealand’s predominantly hydroelectric power generation is vulnerable to precipitation variability. Increasing winter precipitation and snow melt, and a shift from snowfall to rainfall will reduce this vulnerability as winter/spring inflows to main hydro lakes are projected to increase by 5-10% over the next few decades. Further reductions in seasonal snow and glacial melt as glaciers diminish, however, would compromise this benefit. Increasing wind power generation would benefit from projected increases in mean westerly winds Climate Change and Variability - Horizons Region 19 8 September 2016 10.22 a.m.
but face increased risk of damages and shutdown during extreme winds. Climate warming would
reduce annual average peak electricity demands by 1-2% per degree Celsius across New Zealand.

Tourism: Changes in snow cover are likely to have a significant impact on the ski industry, but tourist
numbers from Australia to New Zealand may increase due to the rapid reduction in snow cover in
Australia, and the greater perceived scenic attractiveness of New Zealand. Warmer and drier
conditions mostly benefit tourism but wetter conditions and extreme climate events undermine
tourism.

20                                                        Climate Change and Variability - Horizons Region
8 September 2016 10.22 a.m.
4       Present Climate of Horizons Region
The climate of the Horizons Region is a reflection of the general disturbed westerly airflow with
interspersed anticyclones, modified in specific places by the local topography (Chappell, 2012). Much
of the region has relatively few climatic extremes, except in the higher elevation areas around the
Central Plateau. The rainfall is usually adequate for pasture growth, except on occasions in the
summer, and temperatures have a relatively small range. Summers are warm and frosts frequent in
sheltered inland areas during winter. The weather is often cloudy about the hills, but sunshine hours
increase toward the west coast. Except at higher elevations, snow and hail are rare occurrences,
although fog occurs at times in coastal areas. The prevailing air flow is from the westerly quarter, and
except during the passage of the occasional depression, or when a depression of tropical origin
passes to the east of the North Island, the day-to-day weather conditions are not severe.

More detailed information about Horizon Region’s present climate can be found in Chappell (2012).

4.1     Spatial Patterns in Horizons Region’s Climate
The spatial variation in annual average temperature over the Horizons Region is shown in Figure 4-1.
Figure 4-2 shows the spatial pattern of annual total rainfall, and also the median seasonal total
rainfalls. Temperature varies with elevation, with the coolest mean annual temperatures of the
Horizons Region experienced in the Central Plateau and the northern Ruahine Ranges. Mean annual
temperatures are highest on the low elevation plains near the coast. Annual rainfall varies
significantly throughout the Horizons Region. The high elevation areas of the Central Plateau,
Ruahine Ranges, Tararua Ranges, as well as the hill country to the west of Taumarunui, receive the
most rain in the region, due to orographic rainfall occurring from the prevailing westerly winds.
These areas receive more than 2000 mm per year, on average. The driest part of the region is a
triangle bounded by Whanganui, Levin, and Palmerston North, and also the area around Taihape.
These parts receive around 850 mm of rainfall per year, on average.

Climate Change and Variability - Horizons Region                                                     21
8 September 2016 10.22 a.m.
Figure 4-1:   Annual average temperature for the Horizons region (median for 1981-2010). ©NIWA.

Figure 4-2:   Annual rainfall for the Horizons region (median for 1981-2010). ©NIWA.

22                                                          Climate Change and Variability - Horizons Region
8 September 2016 10.22 a.m.
Figure 4-2 continued:      Seasonal rainfall totals (medians for spring, summer, autumn, and winter).
©NIWA.

Climate Change and Variability - Horizons Region                                                        23
8 September 2016 10.22 a.m.
4.2         Temporal Variability in Horizon Region’s Climate
4.2.1 Temperature

Figure 4-3: Homogenised annual temperature time series for Whanganui from 1938 to 2014. The purple
line removes the year-to-year variability and shows an upward long-term trend, and the grey shading shows
the 95% confidence interval.

There is significant year-to-year variability in Horizon Region’s climate. For example, Figure 4-3 shows
the average annual temperature for Whanganui from 1938 to 2014. There are substantial differences
between years, with some years having temperatures over 1.5°C different to others.

The temperature trend at Whanganui from 1938 to 2014 (shown on Figure 4-3), is 0.95 ± 0.41 °C. For
comparison, the New Zealand national temperature1 increased by 1.07 ± 0.40 °C over the same
period. A likely explanation for the overall increase in average temperatures over this period is due to
increasing concentrations of anthropogenic greenhouse gases, whereas the short-term variability is
due to natural causes, such as the El Niño-Southern Oscillation and volcanic eruptions, together with
random year-to-year fluctuations (“climate noise”).

1   https://www.niwa.co.nz/our-science/climate/information-and-resources/nz-temp-record/seven-station-series-temperature-data

24                                                                          Climate Change and Variability - Horizons Region
8 September 2016 10.22 a.m.
You can also read