Oil Spill Cost Study - OPOL Financial Limits - Joint study commissioned by OPOL and Oil & Gas UK
←
→
Page content transcription
If your browser does not render page correctly, please read the page content below
Oil Spill Cost Study -
OPOL Financial Limits

        Joint study commissioned
        by OPOL and Oil & Gas UK
Oil Spill Cost Study – OPOL Financial Limits
February 2012

© The United Kingdom Offshore Oil and Gas Industry Association Limited (trading as Oil & Gas UK) and the
Offshore Pollution Liability Association Ltd (trading as OPOL), 2012.

All rights reserved. No part of this publication may be reproduced, stored in a retrieval system, or
transmitted in any form or by any means, including electronic, mechanical, photocopying, recording or
otherwise, without prior written permission of Oil & Gas UK and OPOL.

Any material within this study that has been used has been reproduced with the permission of its owners.

The data and analysis contained herein is given for information only. This report is not intended to replace
professional advice and is not deemed to be exhaustive or prescriptive in nature. Although the authors have
used reasonable endeavours to ensure the accuracy of this information neither Oil & Gas UK, OPOL nor
any of their members assume liability for any use made thereof. In addition, the report has been prepared
on the basis of practice within the UKCS and no guarantee is provided that it will be applicable for other
jurisdictions. All examples given are for illustrative purposes only and are not intended to represent
adequate coverage of liabilities that may be incurred in any real situation.

The cost predictions in this report are estimates only of certain types and amounts of costs and losses
which may arise as the result of specified well blowout scenarios in UK waters and are not intended to be,
and shall not be construed as, any admission or agreement on the part of any operator or of OPOL as to the
nature or amount of costs, losses or other damages in respect of which any person might be liable whether
under the OPOL Agreement, as a matter of law or otherwise as a result of any such scenarios or otherwise.

Where reference is made to a particular organisation for the provision of data or information, this does not
constitute in any form whatsoever an endorsement or recommendation of that organisation, or any model or
product that they may provide.

ISBN: 1 903 003 79 9

PUBLISHED BY OIL & GAS UK

London Office:
6th Floor East, Portland House, Bressenden Place, London, SW1E 5BH
Tel: 020 7802 2400 Fax: 020 7802 2401

Aberdeen Office:
              rd
Exchange 2, 3 Floor, 62 Market Street, Aberdeen, AB11 5PJ
Tel: 01224 577250 Fax: 01224 577251

Email: info@oilandgasuk.co.uk
Website: www.oilandgasuk.co.uk
Oil Spill Cost Study - OPOL
                Financial Limits
                                                      CONTENTS

       1       EXECUTIVE SUMMARY ............................................................................................... 5
       2       INTRODUCTION ........................................................................................................... 6
       3       OPOL AGREEMENT FINANCIAL LIMITS ................................................................... 7
       4       POTENTIAL OIL RELEASE SCENARIOS ................................................................... 8
               4.1     NATURE OF A WELL BLOWOUT .................................................................................. 8
               4.2     CONTROL OF WELL BLOWOUTS ................................................................................ 8
               4.3     DEFINITION OF SCENARIOS USED FOR THIS REPORT .................................................. 9
       5       BACKGROUND TO THE FATE OF OIL IN THE ENVIRONMENT ............................ 11
               5.1 W EATHERING PROCESSES ..................................................................................... 11
               5.2 TRANSPORT PROCESSES ....................................................................................... 12
               5.3 RELEVANT CONSEQUENCES ............................................................................................ 13
       6       MODELLING STUDIES USED TO INFORM THIS REPORT ..................................... 15
               6.1 OVERVIEW ............................................................................................................ 15
               6.2 MODELLING COMMISSIONED UNDER OSPRAG ....................................................... 15
               6.2.1 Description of model used ............................................................................... 15
               6.2.2 Model inputs .................................................................................................... 16
               6.2.3 Modelling of surface oil .................................................................................... 17
               6.2.4 Regional Summaries ....................................................................................... 19
               6.2.5 Conclusions for shoreline oiling predictions .................................................... 24
               6.3 OPERATOR MODELLING ......................................................................................... 25
               6.3.1 Introduction ...................................................................................................... 25
               6.3.2 Description of model used ............................................................................... 25
               6.3.3 Model input data .............................................................................................. 25
               6.3.4 Summary of results ......................................................................................... 26
               6.3.5 Conclusions relating to oil predictions included in cost model ........................ 27
       7       COST PREDICTIONS ................................................................................................. 28
               7.1 METHODOLOGY..................................................................................................... 28
               7.2 BASIS OF COSTS RELATING TO REMEDIAL MEASURES ............................................. 28
               7.2.1 Remedial Measures ........................................................................................ 28
               7.2.2 Cost sources.................................................................................................... 29
               7.2.3 Command Centre Costs .................................................................................. 29
               7.2.4 Offshore dispersant spraying .......................................................................... 29
               7.2.5 Offshore mechanical recovery ......................................................................... 29
               7.2.6 Nearshore mechanical recovery...................................................................... 30
               7.2.7 Protective nearshore booming ........................................................................ 30
               7.2.8 Shoreline Clean-up .......................................................................................... 30

_______________________________________________________________________________________________________
February 2012                                                                                   Page 1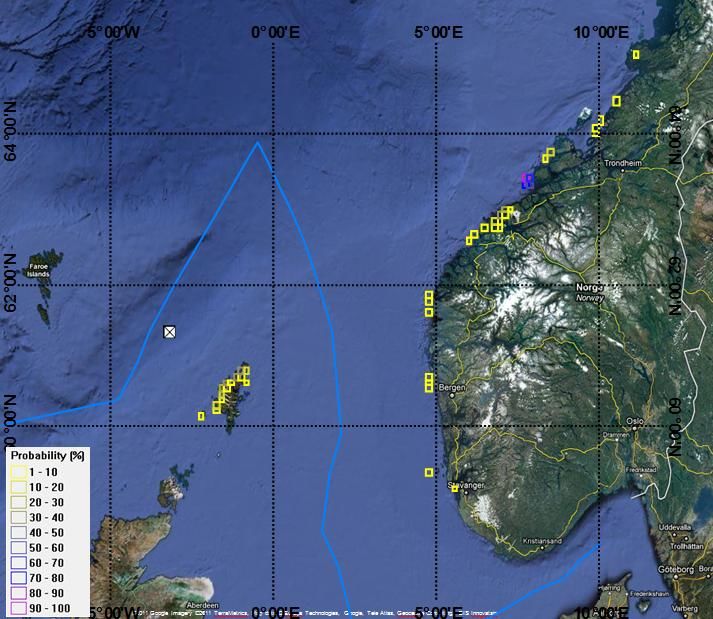
7.2.9 Wildlife clean-up costs ..................................................................................... 31
               7.2.10 SCAT team, media liaison and surveillance. ................................................. 31
               7.2.11 Disposal costs ............................................................................................... 31
               7.3 BASIS OF COSTS RELATING TO ECONOMIC IMPACT .................................................. 33
               7.3.1 Economic Impact ............................................................................................. 33
               7.3.2 Summary of costs of impact on aquaculture ................................................... 33
               7.3.3 Fish Farms ....................................................................................................... 33
               7.3.4 Shellfish ........................................................................................................... 35
               7.3.5 Fishing ............................................................................................................. 36
               7.3.6 Tourism ............................................................................................................ 36
               7.3.7 Other claims .................................................................................................... 37
               7.4 SUMMARY OF COST ESTIMATE OUTPUTS ................................................................. 38
               7.4.1 West of Shetland ............................................................................................. 39
               7.4.2 Moray Firth ...................................................................................................... 40
               7.4.3 Northern North Sea ......................................................................................... 41
               7.4.4 Central North Sea ............................................................................................ 42
       8       DISCUSSION............................................................................................................... 43
               8.1 UNCERTAINTIES .................................................................................................... 43
               8.1.1 Variability of blowout scenario ......................................................................... 43
               8.1.2 Environmental data used in modelling ............................................................ 43
               8.1.3 Techniques used in modelling predictions ...................................................... 43
               8.1.4 Predictions of response measures .................................................................. 44
               8.1.5 Predictions of Economic impacts .................................................................... 44
               8.1.6 Cost bases ....................................................................................................... 44
               8.2 COST COMPARISONS ............................................................................................. 44
       9       CONCLUSIONS .......................................................................................................... 46
       10      REFERENCES ............................................................................................................ 47
       11      APPENDIX 1 – OPERATOR MODELLING USING OSCAR ...................................... 49
               11.1      W EST OF SHETLAND ........................................................................................... 49
               11.2      NORTHERN NORTH SEA ...................................................................................... 52
               11.3      CENTRAL NORTH SEA ......................................................................................... 53
               11.4      REFERENCES ...................................................................................................... 55
       12      APPENDIX 2 – OIL SPILL METHODOLOGY FOR REMEDIAL MEASURES AND
               ECONOMIC IMPACT .................................................................................................. 56
               12.1 MODEL RESULTS ANALYSIS .................................................................................. 56
               12.1.1 Shoreline substrate assessment ................................................................... 56
               12.2 COST ASSESSMENT ............................................................................................. 58
               12.2.1 Command Centre Cost Breakdown............................................................... 58
               12.2.2 Offshore dispersant spraying costs ............................................................... 58
               12.2.3 Offshore mechanical recovery ....................................................................... 59
               12.2.4 Nearshore mechanical recovery.................................................................... 62
               12.2.5 Protective near shore booming ..................................................................... 63
               12.2.6 Shoreline Clean-up ........................................................................................ 65
               12.2.7 Wildlife clean-up costs ................................................................................... 68
               12.2.8 SCAT team, media liaison and surveillance .................................................. 69
               12.2.9 Disposal costs ............................................................................................... 69
               12.2.10 Economic Impact ......................................................................................... 71
               12.3 REFERENCES ...................................................................................................... 77

_______________________________________________________________________________________________________
February 2012                                                                                   Page 2
13      APPENDIX 3 – EXTRAPOLATION OF COST ESTIMATES TO A 90 DAY
               BLOWOUT .................................................................................................................. 80
               13.1      W EST OF SHETLAND ........................................................................................... 80
               13.2      MORAY FIRTH ..................................................................................................... 81
               13.3      NORTHERN NORTH SEA ...................................................................................... 82
               13.4      CENTRAL NORTH SEA ......................................................................................... 83
       14      APPENDIX 4 – BREAKDOWN OF COSTS FOR MAJOR EUROPEAN SHIPPING
               INCIDENTS.................................................................................................................. 84

_______________________________________________________________________________________________________
February 2012                                                                                   Page 3
_______________________________________________________________________________________________________
February 2012                                                                                   Page 4
OPOL Financial Limits

1    Executive Summary

This report examines the potential financial impact resulting from well blowout scenarios in UK
waters with a view to establishing whether the financial liability limit of US$250 million per incident
in the OPOL Agreement is adequate.

The OPOL Agreement has been in existence since 1975. Every operator of an offshore facility in UK
waters used in connection with the exploration for or production of oil, gas or natural gas liquids is
required to be a party to the OPOL Agreement. Signatories of this agreement are required to
demonstrate financial responsibility for costs resulting from the remediation of an oil spill and third
party compensation for pollution damage, up to a certain limit.

The financial limit in the OPOL Agreement is reviewed regularly. It was last increased, to US$250m
per incident, in October 2010 as part of the industry’s response to the Deepwater Horizon incident in
the Gulf of Mexico. Following that increase, the boards of The Offshore Pollution Liability
Association Limited (‘OPOL’) (which administers the OPOL Agreement) and of Oil & Gas UK
(‘O&GUK’) commissioned BMT ARGOSS to undertake a study of the effects of well blowout
scenarios with a view to establishing whether the increased limit is sufficient. This report contains
the results of that study.

It is important to note that the UK has a strong regulatory framework designed to prevent a well
blowout incident and that the measures adopted by operators in the UK, such as the Safety Case
regime and the Design and Construction Regulations, that include independent well examinations,
are seen around the world as a model for robust management of blowout risks.

It is also important to mention the work of the Oil Spill Response Advisory Group (‘OSPRAG’), which
was set up to co-ordinate the UK’s response to the generic safety, environmental and commercial
issues arising from the Deepwater Horizon incident in the Gulf of Mexico. An important outcome of
the work of OSPRAG was the design, construction and successful testing of a subsea well capping
device. Deployment of the capping device is estimated to take place within 30 days, and the spill
scenarios used in this report therefore assume a 30 day release period before the well is capped.

Computer modelling of well blowout scenarios for four representative locations around the UK has
been undertaken for a release duration of 30 days, based on the use of a capping device. Cost
estimates have been made of the oil spills resulting from these scenarios. Pessimistic assumptions
around the blowout scenarios, the behaviour of oil and the associated consequences have been
adopted. Cost estimates have also been undertaken for a 90-day period, a typical period to drill a
relief well. These are referred to in Appendix 3 of this report.

It is concluded from this work that the current financial responsibility limit of US$250 million per
incident in the OPOL Agreement is adequate for the vast majority of UK well operations. For oil
wells in the West of Shetland area the limit is calculated to be adequate in many cases, but the costs
for higher production wells in this area may exceed the current limit. In the case of wells that match

_______________________________________________________________________________________________________
February 2012                                                                                   Page 5

this scenario, the operator and DECC can consider whether additional financial responsibility above
the OPOL limit is appropriate.

2    Introduction
This report has been produced on behalf of Oil and Gas UK (O&GUK) and the Offshore Pollution
Liability Association Ltd. (OPOL) and stems from work undertaken under the Oil Spill Response
Advisory Group (OSPRAG), which was set up to co-ordinate the UK’s response to the generic safety,
environmental and commercial issues arising from the Deepwater Horizon incident in the Gulf of
Mexico. The report examines the potential financial impacts resulting from a set of well blowout
scenarios in UK waters, in terms of the costs of oil spill response and of third party loss or damage
that might result. These costs are discussed in relation to the financial provision that exists in the UK
via the OPOL Agreement, whereby there is an agreement amongst members of OPOL to meet claims
relating to pollution damage and the cost of remedial measures up to a maximum of US$250million
per incident.

Within OSPRAG the Indemnity and Insurance Review Group was set up to assess the potential
control, remediation and compensation costs associated with a large oil spill in the UKCS, to
determine how these are provided for and whether the provisions the UK has in place require any
additional changes. The Group recommended an increase in the maximum sum addressed by OPOL
from US$120million to US$250million per incident – this increase was effected in October 2010. (The
OPOL limit is reviewed regularly, the most recent reviews prior to 2011 having been undertaken in
1995, 2002 and 2006.) BMT ARGOSS have an oil spill model and had made previous cost
assessments for OPOL so were commissioned to review a number of incident scenarios identified by
the Indemnity and Insurance Review Group in order that the US$250million limit could be tested.

In context, there have been no blowouts in UK waters for over 20 years, and the measures adopted
by operators in the UK such as the Safety Case regime and the Design and Construction Regulations
that include independent well examinations are seen around the world as a model for robust
management of blowout risks. Nevertheless, the UK oil industry is committed to minimising risks
and planning robust contingency measures. OSPRAG confirmed that national regulatory procedures
drive the right health, safety and environmental behaviours, it provided the UK’s capping capability,
it enhanced the industry’s preparedness and oil-spill response “tool kit” (testing it in a National
Contingency Plan exercise) and established new forums to sustain progress.

The work of OSPRAG is documented in its interim report, final report and report on the
demonstration of the capping device (OSPRAG, 2011a, b and c), which are published on the Oil and
Gas UK website www.oilandgasuk.co.uk.

This report will be submitted to the Department of Energy and Climate Change who will peer review
its conclusions to inform their requirements for financial responsibility as part of their well
consenting processes.

_______________________________________________________________________________________________________
February 2012                                                                                   Page 6
3    OPOL Agreement Financial Limits

The OPOL Agreement provides that if a discharge of oil occurs from an offshore facility, the operator
of the facility must meet the cost of remedial measures and pay compensation for pollution damage
up to an overall maximum of US$250 million per incident on a strict liability basis, subject to a
limited number of usual exceptions (e.g. war and negligence of the claimant). Pursuant to the
Agreement:

    each operator agrees to be responsible on a strict liability basis for an aggregate amount of up to
    US$250million per incident in respect of remedial measures and pollution damage following a
    discharge of oil from one of its offshore facilities

    each operator is required to provide financial assurance in respect of its ability to pay claims
    under the Agreement

    in the unlikely event that an operator fails to satisfy its obligations to claimants under the
    Agreement, the other operators are required to contribute to enable payment to be made to
    claimants.

The following definitions are given in the OPOL Agreement:

"Remedial Measures" means reasonable measures taken by any Party from any of whose
Designated Offshore Facilities a Discharge of Oil occurs and by any Public Authority to prevent,
mitigate or eliminate Pollution Damage following such Discharge of Oil or to remove or neutralise the
Oil involved in such discharge, excluding however, well control measures and measures taken to
protect, repair or replace any such Designated Offshore Facility.

“Pollution Damage” means direct loss or damage (other than loss of or damage to any Offshore
Facility involved) by contamination which results from a Discharge of Oil.

This report therefore focuses on the costs of remedial measures and the amount of compensation
for pollution damage (excluding well control so as to be consistent with the OPOL agreement) which
could potentially result from a well blowout scenario in UK waters. Other costs and compensation in
excess of the OPOL financial limit and/or outside the scope of OPOL may be recoverable by
claimants as a matter of law. It is important to note that the OPOL Agreement does not act as a limit
on the legal liability of operators. In this context it exists to provide a means of settling claims in an
orderly and expeditious manner without recourse to the courts. It is important to note that
operators make additional financial provision to meet these further liabilities, e.g. insurance.

Further details about the OPOL Agreement (including the full text of the Agreement) and OPOL can
be found at www.opol.org.uk.

_______________________________________________________________________________________________________
February 2012                                                                                   Page 7
4     Potential oil release scenarios

4.1    Nature of a well blowout

A well blowout can be defined as “An incident where formations fluid flows out of the well or
between formation layers after all the predefined technical well barriers or the activation of the
same have failed” (SINTEF, 2009). A blowout does not necessarily mean a release of oil to the
environment, and most blowouts are arrested quickly; historically 94% of blowouts across the North
Sea and the Gulf of Mexico have been arrested within 30 days (Scandpower, 2011). With the
introduction of capping devices, the probability of the well flowing for more than 30 days has been
further reduced. Nevertheless, robust planning for oil spill response and clean-up is essential.

Multiple barriers must all fail for a blowout to occur, including the hydrostatic pressure being
overcome and the blowout preventer (BOP) failing, or failing to be activated. The BOP itself includes
multiple sealing devices including annular preventers and rams. In the UK, a BOP will always include
at least one set of shear rams that can cut through drill pipe that may be present running through
the BOP at the time.

The flow rate from the well can be within a wide range depending on the amount of reservoir
exposed inside the well; restrictions caused by equipment within the well and at the top of the well;
and on the reservoir pressure, which is low in many existing produced fields in the UK reservoirs.
There are several mechanisms by which a blowout is arrested, the main being an intervention by the
crew on the facility and others including natural collapse of the rock formation within the well and a
subsea intervention e.g. activation of the BOP using an underwater remotely operated vehicle (ROV).
In a small minority of cases, these methods are unsuccessful and the blowout is arrested by a relief
well being drilled, into which heavy drilling fluid and subsequently cement is pumped to ‘kill’ the
well. Consequently a prolonged blowout at a high rate is an extremely rare occurrence.

The consequences of a blowout are also very dependent on the location of the well, in terms of the
water depth, the prevailing currents and winds, distance to shore and the environmental and socio-
economic sensitivities present both at sea and along the shoreline. The location can also influence
the type of oil present, for example with the Southern North Sea being predominantly gas fields with
some very light condensate oil. Different oil types can have very different properties when released
at sea.

A blowout occurring from a production platform, or from a jackup rig, has the potential to flow
directly onto the sea surface since there is a stable structure supporting the flow path to surface. A
blowout from a subsea well via a semi-submersible rig or a drillship could begin with a release at the
vessel and onto the sea surface, but will quickly become a subsea release as the vessel will activate
an emergency disconnect procedure and move away for the safety of the crew.

4.2    Control of well blowouts
Through OSPRAG, a new pan-industry group, the Well Life Cycle Practices Forum (WLCPF)
was created under the umbrella of Oil & Gas UK, to allow best practices in well blowout prevention
and management to be shared across the industry. Members of the forum include drilling managers,
well engineers and designers working closely with the HSE, other regulators and trade unions. The
WLCPF will advance recommendations made by OSPRAG and facilitate the dissemination of lessons
from Macondo and other similar events relating to blow-out preventer issues, well examination,
verification, competency, behaviours and human factors, relief well planning requirements and well
life cycle integrity guidance.

_______________________________________________________________________________________________________
February 2012                                                                                   Page 8
An important outcome of OSPRAG was the design, construction and successful testing of a subsea
well capping device that is able to control the flow from the great majority of subsea oil wells in the
UK, including up to 75,000 barrels per day of flow in water depths up to three kilometres (Figure
4-1). Deployment of the capping device is estimated to take up to 30 days considering mobilisation,
weather and other allowances. It is therefore relevant to consider the costs associated with well
blowout cases lasting up to 30 days. The cap can quickly be deployed:
        At a wide range of wells and oil spill
        scenarios which could occur in the
        UKCS, including West of Shetland;
        To various points of the subsea stack;
        At water depths of between 100 m and
        3,048 m;
        In wave heights of up to 5m (16 ft)
        depending on the vessel/rig used;
        From a wide variety of multi-service
        vessels or drilling rigs;
        To wells flowing up to 1,034 bar
        (15,000 psi) in pressure and 121°C;
        Even where there is a high content of
        hydrogen sulphide present;
        On to a well flowing up to 75,000
        barrels per day.                                    Figure 4-1 OSPRAG well capping device

4.3   Definition of scenarios used for this report
As summarised above, there are many variables affecting the nature and scale of an incident and
therefore the financial consequences. For the purposes of this report, the following assumptions
have been made in relation to the effects of a blowout scenario. The possible variability in outcomes
from some of these parameters is discussed further in Section 8.1 concerning uncertainties.

Assumptions used for defining the blowout scenarios for this study:
          Four different geographic locations were considered: Moray Firth, Central North Sea
          (CNS), Northern North Sea (NNS) and West of Shetland (WoS);
          A well blowout in each location lasting for 30 days commensurate with well control
          through use of a capping device;
          A realistic flow rate representing a productive well, that does not diminish over time;
          A representative oil type for the fields in each area;
          While oil spill response measures were costed, their mitigating effects were ignored to
          give an assessment of the maximum impact;
          Account is taken of the subsea nature of the release where appropriate.

The prevailing reservoir geology in the Southern North Sea results in gas fields with small amounts of
light condensate oil. In light of the results from examining the other areas of the North Sea, the
potential impact from a blowout is clearly well within the current OPOL limits, and a Southern North
Sea scenario was therefore not modelled or costed in detail.

Fields in the Irish Sea (Liverpool Bay and Morecambe Bay areas) are either exploited oil fields that
are now of low productivity or consist of gas prospects with relatively minor impacts. These are
similarly considered to be within the current OPOL limits and are not modelled or costed in detail.

_______________________________________________________________________________________________________
February 2012                                                                                   Page 9
A scenario involving an HP/HT well in the Central North Sea was initially modelled, but since the
results showed negligible amounts of oil reaching the shore and very small persistence at sea, this
scenario was judged to be of less impact than the oil well scenario in that region, so was therefore
not considered further.
This leads to the scenarios listed in Table 4-1 immediately below as being those scenarios identified
by the IIRG that are considered in more detail in this report.
Location Oil Type Oil release rate (barrels per day)
WoS Schiehallion 31,000
Moray Firth Captain 18,000
NNS Magnus 58,000
CNS Forties 41,000
Table 4-1 Summary of scenarios examined in this report
_______________________________________________________________________________________________________
February 2012 Page 105 Background to the fate of oil in the environment Processes involved in the weathering of crude oil include evaporation, emulsification, and dissolution, whereas chemical processes focus on oxidation, particularly photo-oxidation. The principal biological process that affects crude oil in the marine environment is microbial oxidation. As crude oil weathers, it may also undergo various transport processes including advection and spreading, dispersion and entrainment, sinking and sedimentation, overwashing, partitioning and bioavailability, and stranding. Predicting the behaviour of oil is central to planning an effective response and determining potential impacts, and therefore to estimating the potential costs of remedial measures and compensation for pollution damage. This section describes the main processes that control the behaviour of oil. The majority of these processes are key elements of the modelling methods that are described in Section 6. Where the available models make approximations to these processes, or where they do not include certain aspects, these generally result in a larger prediction of oil on the surface and on shorelines, which results in a conservative estimate of the associated costs, i.e. the results are conservative. Many variables are involved as described below, many of which are interactive and which depend to a large extent on the metocean conditions (currents, winds and temperatures) that are present. A probabilistic or ‘stochastic’ approach can be used to look at the same release scenario using many different combinations of metocean data, and stochastic simulations have been used in this report to identify the likelihood of a range of outcomes. Individual “worst-case” outcomes from the stochastic simulations can then be examined in more detail using a specific set of conditions (‘deterministic’ modelling). Overall, the results of any oil spill modelling should be considered indicative. 5.1 Weathering processes Following an oil spill or any other event that releases crude oil or crude oil products into the marine environment, weathering processes begin immediately to transform the materials into substances with physical and chemical characteristics that differ from the original source material. Evaporation In many oil spills, evaporation is the most important process in terms of mass balance. Within a few days following a spill, light crude oils can lose up to 75 percent of their initial volume and medium crudes up to 40 percent. In contrast, heavy or residual oils will lose no more than 10 percent of their volume in the first few days following a spill. Emulsification Emulsification is the process of formation of various states of water in oil. These emulsions significantly change the properties and characteristics of spilled oil, and stable emulsions can contain between 60 and 85 percent water thus expanding the volume by three to five times the original volume of spilled material. Together with the associated increase in viscosity and density, emulsification has a great effect on the behaviour of oil spills at sea. Dissolution Dissolution is the chemical stabilization of oil components in water. Dissolution accounts for a small portion of oil loss, but it is still considered an important behaviour parameter because the soluble components of oil, particularly the smaller aromatic compounds, are more toxic to aquatic species than the aliphatic components. _______________________________________________________________________________________________________ February 2012 Page 11
Oxidation
Crude oil is a complex mixture of organic compounds, mostly hydrocarbons. Oxidation alters these
mixtures by creating new compounds and by rearranging the distribution of residual compounds,
based on their susceptibility to the oxidative process. The ultimate oxidative fate of all of the organic
compounds, given an unrestricted supply of oxygen and time, is conversion to carbon dioxide and
water. Oxidation can occur via light (photo-oxidation) or microbial processes. Photo-oxidation plays
a role in altering the composition of the oil and its solubility, but is not significant from a mass-
balance perspective. Microbial oxidation has been considered one of the principal removal
mechanisms in the aquatic environment.

5.2   Transport processes
Spreading and advection
Spreading of oil on the sea surface occurs through inertial, viscous, and surface tension forces,
driving thick oil to spread into a thinner and larger layer. Advection is the transport of oil by the bulk
movement of the water. This movement is characterized by residual currents, tidal currents and
wind-induced surface currents. Empirical studies have established that oil slicks on a sea surface are
transported with the surface current at 2.5 to 4 percent of the wind speed, and a value of 3% or
3.5% is often used a representative value. Wind-driven helix circulation patterns, known as
‘Langmuir cells’ are a common feature in the sea that create convergence and divergence zones on
the sea surface running parallel to the wind. These cause local downwelling regions that can drag
surface pollutants such as oil down into the water column and away from wind-induced currents.

Dispersion and entrainment
Dispersion is a mixing process caused by the turbulence in the ocean originating from eddy
processes at various scales. Dispersion acts to decrease the concentration of oil on the surface or in
the water column. Oil droplets on the sea surface of sizes less than about 100 μm will exhibit
vertical dispersion and entrainment into the water column. This is a crucial aspect when considering
a subsea blowout, and examined at length in the DEEPSPILL JIP experiments (Johansen, et al. 2001).
An oil and gas mixture ejected from a narrow orifice forms a wide range of droplet sizes, many of
which remain suspended in the water column where they are subject to physical, chemical and
biological processes.

Sinking and sedimentation
Sinking is the mechanism by which oil masses that are denser than the receiving water are
transported to the bottom. The oil itself may be denser than water, or it may have incorporated
enough sediment to become denser than water. Sedimentation is the sorption of oil to suspended
sediments that eventually settle out of the water column and accumulate on the seafloor.

Overwashing
Overwashing is the temporary submergence of oil below the water surface. The oil can be described
as “floating” just below the water surface. The principal cause of overwashing is the action of waves
and near-surface turbulence (Clark et al., 1987). Overwashed oil can resurface when the turbulence
of the water surface ceases e.g. when the wind dies down and when the oil becomes stranded on a
shoreline.

Partitioning and bioavailability
Partitioning processes include adsorption where the hydrocarbon attaches to a surface of a solid
(such as seabed sediments) and absorption where the chemical partitions into the interior of a cell
or detrital particle. The distribution of hydrocarbons between the dissolved phase and the variety of
aquatic particles is important for determining the fate of hydrocarbons and their bioavailability.

_______________________________________________________________________________________________________
February 2012                                                                                  Page 12
Organisms are not exposed to the total amount of hydrocarbons in the water and sediment because
some portions of the chemical occur in forms not accessible to the organisms.

Stranding
Persistent oil residues have two major fates: shoreline stranding for spills near to shore and tarball
formation for releases in offshore waters. Oil loading on a shoreline can be highly variable, and the
amount of oil and the rate of natural removal drive the decision to conduct shoreline clean-up.
Tarballs are typically coin-sized masses of weathered oil that are slowly biodegraded, and their fate
is very dependent on entrained solids and density.

5.3   Relevant consequences
The impacts from an oil spill depend on a number of factors including the type and amount of oil and
its behaviour once spilled; the physical characteristics of the affected area; weather conditions and
season; the type and effectiveness of the clean-up response; the biological and economic
characteristics of the area and their sensitivity to oil pollution (ITOPF, 2010).

Described below are typical impacts from oil releases where there may be associated costs that are
relevant to the OPOL financial limits, i.e. relating to remedial measures and pollution damage.

Seabirds
Seabirds are amongst the most vulnerable inhabitants of open waters since they are easily harmed
by floating oil. Species that dive for their food or which congregate on the sea surface are
particularly at risk. Although oil ingested by birds during attempts to clean themselves by preening
may be lethal, the most common cause of death is from drowning, starvation and loss of body heat
following fouling of plumage by oil. Cleaning and rehabilitation after oiling is often attempted, but it
is rare for more than a fraction of oiled birds to survive.

Shallow Coastal Waters
Spill damage in shallow waters is most often caused by oil becoming mixed into the sea by wave
action or by dispersant chemicals used inappropriately. In many circumstances the dilution capacity
is sufficient to keep oil concentrations in the water below harmful levels, but there are examples
where significant impacts on marine organisms such as shellfish have occurred. Post-spill studies
reveal that recovery has taken place in a relatively short timescale.

Shorelines
Shorelines are at risk from the accumulation of oil. The dynamic nature of the shoreline means that
many shoreline species are relatively tolerant to a range of stresses and recovery can be swift.
Rocky and sandy shores exposed to wave action and the scouring effects of tidal currents may self-
clean quite rapidly. In some circumstances, subtle changes to rocky shore communities can be
triggered by a spill that can subsequently be detected for ten or more years although the
functioning, diversity and productivity of the ecosystem may be restored. Soft sediment shores that
are sheltered from wave action tend to be highly biologically productive and oil can become
incorporated in fine sediments.

Amenity
Contamination of coastal amenity areas is a common feature of many oil spills, leading to
interference with recreational activities such as bathing, boating, angling and diving. Hotel and
restaurant owners and others who gain their livelihood from the tourist trade can also suffer
temporary losses. A return to normal requires an effective clean-up programme and the restoration
of public confidence.

_______________________________________________________________________________________________________
February 2012                                                                                  Page 13
Fisheries and Mariculture
An oil spill can directly damage the boats and gear used for catching or cultivating marine species.
Floating equipment and fixed traps extending above the sea surface are more likely to become
contaminated by floating oil. Submerged nets, pots, lines and bottom trawls are usually well
protected provided they are not lifted through an oily sea surface, although they may sometimes be
affected by oil beneath the surface. Mortality of stock, caused by physical contamination or close
contact with freshly spilled oil in shallow waters with poor water exchange, is rare.

A common cause of economic loss to fishermen is interruption to their activities by the presence of
oil or the performance of clean-up operations. Sometimes this results from a precautionary ban on
the catching and sale of fish and shellfish from the area, both to maintain market confidence and to
protect fishing gear and catches from contamination. Cultivated stocks are more at risk from an oil
spill.

Coastal industries
Industries that rely on seawater for their normal operation can also be adversely affected by oil
spills. Power stations and desalination plants which draw large quantities of seawater can be
particularly at risk, especially if their water intakes are located close to the sea surface, thereby
increasing the possibility of drawing in floating oil. The normal operations of other coastal industries,
such as shipyards, ports and harbours, can also be disrupted by oil spills and clean-up operations.

_______________________________________________________________________________________________________
February 2012                                                                                  Page 14
6     Modelling studies used to inform this report

6.1    Overview
Several different oil spill modelling applications are available internationally that incorporate
different aspects of the weathering, transport and impact factors described above. The techniques
for predicting the fate of oil that have become common in any particular area of oil and gas activity
have generally been developed over time through dialogues with industry, regulators and response
agencies and have substantive bodies of research, development and experience to support them.
Often, these oil spill modelling techniques are used for both oil industry spill planning and response,
and also for spills from shipping, since the risks can be similar, and historically the risks from shipping
have proved to more significant. In the UK, two models are currently used to assess and plan for oil
industry risks OSIS (developed by BMT ARGOSS), and OSCAR (developed by SINTEF), and information
from both is incorporated in this report. The use of specific models is not prescribed by the
regulator.

Through OSPRAG, O&GUK and OPOL commissioned BMT ARGOSS to undertake oil spill trajectory
and weathering modelling for the blowout scenarios identified above to directly inform the costing
calculations in this report. The work was then focussed on four main regional scenarios where oil
well drilling takes place in the Moray Firth, Central North Sea, Northern North Sea and West of
Shetland. This was a combination of stochastic (i.e. probabilistic) modelling of a 10-day release, and
then examining the results to identify a particular scenario (i.e. combination of metocean conditions)
that was examined in more detail by deterministic modelling over a period of 30 days, relating to the
time to deploy a capping device. The modelling was undertaken using the program Oil Spill
Information System (OSIS), which is on a consistent basis with earlier evaluations done for OPOL.

The scenarios chosen were considered to be representative pessimistic scenarios for each
geographic location that would be considered “worst-case” for the vast majority of wells in that
region. This report is not intended to cover all possibilities and there may be circumstances where a
well falls outside the scope of this modelling.

6.2    Modelling commissioned under OSPRAG

6.2.1 Description of model used
Modelling was carried out by BMT ARGOSS and this section explains the results and methodology
used in carrying out this work. All figures and tables come from their report. OSIS (the Oil Spill
Information System) is a particle-tracking model that can simulate the fate and dispersion of surface
oil slicks. It can be used to run deterministic model scenarios, considering a specific scenario, which
provides results of slick trajectory, and sea surface, evaporated, dispersed and beached volumes
and, in addition, it can be used to run probabilistic or stochastic model scenarios. In this case, the oil
spill scenario is run several tens of times using random sections from a time-series of metocean
(meteorological and oceanographic) data covering a period of typically a year or more. The results
indicate areas with the highest probability of oiling from the spill scenario, allowing that it may occur
at any time of year. The probabilistic outputs also summarise the results of the individual runs,
enabling “worst-case” runs to be re-conducted in the deterministic model for further analysis.

The OSIS system has been developed, enhanced and validated through a number of R&D programs
in close collaboration with the oil and gas industry. It has been used in numerous studies into the
dispersion and fate of offshore oil spills and is used world-wide by oil companies for oil spill
contingency purposes. Validation of the OSIS model has comprised:

_______________________________________________________________________________________________________
February 2012                                                                                  Page 15
Comparison with 18 separate at-sea releases of 10 different crude oil types (including
         Forties, Flotta, Ekofisk and Arabian Light) and wind speeds ranging from 1 – 12 ms-1
         (Beaufort scale force 1 – 6). Early comparisons focussed on the behaviour of the oil over the
         initial 24 hour period, and the 1997 sea trials provided data for validation against a 3-day
         period.
         Use in the Sea Empress incident of 1996, when approximately 70,000 tonnes of crude oil was
         spilled on the coast of Pembrokeshire.
         Hindcast comparisons against the Rosebay tanker spill in the English Channel (1,100 tonnes
         of crude oil) in 1990.

6.2.2 Model inputs
Hydrocarbon release data
The locations of the release points for the four scenarios considered in detail are shown in Figure
6-1.

Figure 6-1 Locations of spill scenarios considered

_______________________________________________________________________________________________________
February 2012                                                                                  Page 16
Hydrocarbon releases of Schiehallion, Captain, Magnus and Forties crude oil were modelled using
weathering data from AEA Technology contained in the OSIS database. Details of the release
conditions are given in Table 6-1. All releases are assumed to take place on the sea surface.
Release
Release Model run
rate ITOPF group Weathering report
Location Lat\ Long Oil Type Duration duration
(barrels per classification ref.
(days) (days)
day)
60° 25’ N, AEA/CS/16309304
WoS Schiehallion 10 31,000 10 Group 3
4° 6’ W /R/001 Issue 1
Moray 58° 5’ N, 1° AEA/WMES/24411
Captain 10 18,000 10 Group 3
Firth 42’ W 000/R/001 Issue 1
61° 35’ N,
NNS Magnus 10 58,000 10 Group 2 WSL CR-3698
1° 18’ E
57° 45’ N,
CNS Forties 10 41,000 10 Group 2 WSL CR-3698
0° 54 E
Table 6-1 Summary of scenarios modelled
Meteorological data
The meteorological data (wind speed and direction, air and sea surface temperature, and sea state)
used within the model was supplied by BMT ARGOSS in the form of a three year time series from 1st
January 2008 – 31st December 2010 for each location.
Hydrodynamic data
Residual and tidal surface currents for the extended North West Europe region were taken from the
Proudman Oceanographic Laboratory (POL) CS20 database, residual currents from the HYCOM
model, and tidal currents from the BMT ARGOSS in-house tidal information model.
6.2.3 Modelling of surface oil
6.2.3.1 Approach
The overall approach to determining the areas affected by oil and the maximum amount of oil that
might reach shorelines is as follows for each geographical region:
A probabilistic analysis of a continuous blowout release of 10 days was undertaken, which
determined the set of conditions that resulted in the “worst-case” of oil reaching shorelines;
A deterministic analysis was undertaken of the “worst-case” scenario identified above for a
continuous blowout release over a period of 30 days;
An allowance was made for the amount of oil that would be entrained in the water column
as a result of the subsea nature of the release;
A projection of the results to a period of 90 days was undertaken using overlapping and
consecutive 30 day model runs. These results are set out in Appendix 3 to this report.
Probabilistic modelling was conducted based on 100 model runs using random sections of metocean
data covering a 2-year period. Metocean data was specific to each location. The model was
executed for a period of 10 days in each scenario. The results were used to identify the areas with
highest probability of being affected by each of the spills, together with statistics regarding the
volumes involved. The highest beaching volume seen in the individual runs making up each
probabilistic case was from West of Shetland.
The contour plots presented in the following sections demonstrate probability of surface oiling,
and do not indicate the extent of a single spill. At a single point in time, a real slick would present
itself as a thin ribbon of oil within the areas identified in the plots.
_______________________________________________________________________________________________________
February 2012 Page 17In order to provide scenarios against which response and compensation costs could be estimated, deterministic modelling was conducted using OSIS. Of the 100 runs conducted in the probabilistic scenarios, the model run (start time and date) which gave the “worst-case” shoreline oiling after 10 days was selected for deterministic modelling. The total volume of oil beaching at the end of the entire model runs was calculated, and adjusted to allow for any likely entrainment. The full adjusted values for the 30-day prediction of oil reaching shorelines are given in the following Section 6.2.4. 6.2.3.2 Adjustment for entrainment and intervention OSIS is a surface oil spill model that includes emulsification, evaporation and wave-induced natural dispersion but does not consider any other subsurface processes or transport. Oil released from a subsea blowout is very likely to become entrained in the water column and not reach the surface. In order to assess the affect of entrainment, a literature review was conducted and the results used to adjust the volumes applied in the OSIS modelling. Because of uncertainties in the scenario a range of values for entrainment in the water column were considered. Between 16% and 67% of oil was assumed to remain entrained in the water column for the West of Shetland scenario after consideration of the depth observed at the location. Between 0% and 40% of oil was assumed to remain entrained in the water column for the remaining scenarios (Moray Firth, Northern North Sea and Central North Sea), where a lower degree of entrainment would be expected as a result of the water depths. The upper and lower percentages are within the range reported in actual spills or other empirical results. _______________________________________________________________________________________________________ February 2012 Page 18
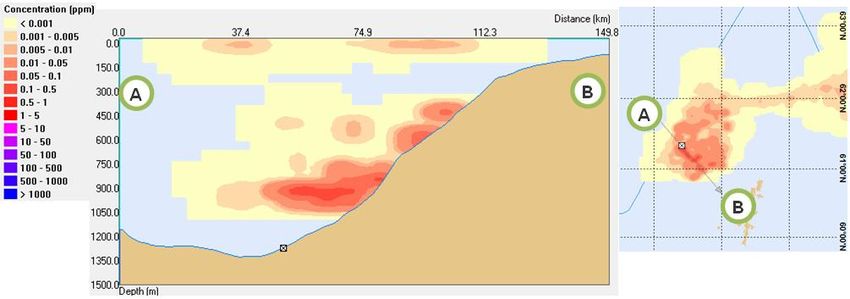
6.2.4 Regional Summaries

6.2.4.1 West of Shetland
Figure 6-2 shows the probability of sea surface oiling after a 10-day continuous spill in the West of
Shetland region.

Figure 6-2 Probability of sea surface oiling 240 hours after onset of spill for the West of Shetland scenario

The following points summarise the results of the West of Shetland probabilistic model run:

                  The shortest time to beaching was predicted to be 58 hours.
                  Western Shetland was predicted to experience between 10 and 20% probability of
                  shoreline oiling. North Orkney and part of the North Scottish mainland had a greater
                  than 5% probability of oiling. South Faroes and parts of the Norwegian coast also
                  demonstrated low probabilities of oiling within 10 days.
                  There was a total 35% probability of beaching occurring within 240 hours of the
                  onset of the oil spill.

Deterministic modelling was then undertaken on the worst conditions identified for shoreline oiling.
Figure 6-3 shows the extent of beaching in the West of Shetland deterministic scenario. Oil beaching
occurs on the coasts of northern Scotland, Orkney, Shetland and Northern Norway. After adjusting
for entrainment in the water column, the total mass expected to beach is 25,700 – 65,300 m3.

_______________________________________________________________________________________________________
February 2012                                                                                  Page 19
Figure 6-3 Summary of shoreline oiling sites for the West of Shetland scenario
6.2.4.2 Moray Firth
Figure 6-4 shows the probability of sea surface oiling after a 10-day continuous spill in the Moray
Firth region.
Figure 6-4 Probability of sea surface oiling 240 hours after onset of spill for the Moray Firth scenario
The following points summarise the results of the Moray Firth probabilistic model run:
The shortest time to beaching was predicted to be 46 hours.
North-east Scotland and east Orkney had a greater than 5% probability of shoreline
oiling after 10 days. The coastline north of Peterhead had a probability of
experiencing oiling greater than 20%.
_______________________________________________________________________________________________________
February 2012 Page 20There was a 29% probability of beaching occurring within 240 hours of the onset of
the oil spill.
Deterministic modelling was then undertaken on the worst conditions identified for shoreline oiling.
Figure 6-5 shows the extent of beaching in the Moray Firth deterministic scenario. Oil beaches on
the north-east of Scotland, Orkney, Shetland and southern Norway. After adjusting for entrainment
in the water column, the total mass expected to beach is 38,591 – 65,021 m3.
Figure 6-5 Summary of shoreline oiling sites for the Moray Firth scenario
6.2.4.3 Northern North Sea
Figure 6-6 shows the probability of sea surface oiling after a 10-day continuous spill in the Northern
North Sea region.
Figure 6-6 Probability of sea surface oiling 240 hours after onset of spill for the Northern North Sea scenario
The following points summarise the results of the Northern North Sea probabilistic model run:
_______________________________________________________________________________________________________
February 2012 Page 21The shortest predicted time to beaching is 126 hours.
Parts of the Norwegian coast have a probability of shoreline oiling of up to 5-10%.
Northern and eastern Shetland has a probability of shoreline oiling of 1-2% after 10
days.
There is a 10% probability of beaching occurring within 240 hours of the onset of the
oil spill.
Deterministic modelling was then undertaken on the worst conditions identified for shoreline oiling.
Figure 6-7 shows that the Norwegian coastline receives all the oil beaching observed in the Northern
North Sea scenario. No beaching occurs along the UK coast. After adjusting for entrainment in the
water column, the total mass expected to beach is 9,867 – 16,445 m3.
Figure 6-7 Summary of shoreline oiling sites for the Northern North Sea scenario
_______________________________________________________________________________________________________
February 2012 Page 22You can also read