DOES PRISON PRIVATIZATION DISTORT JUSTICE? EVIDENCE ON TIME SERVED AND RECIDIVISM
←
→
Page content transcription
If your browser does not render page correctly, please read the page content below
DOES PRISON PRIVATIZATION DISTORT JUSTICE?
         EVIDENCE ON TIME SERVED AND RECIDIVISM

                                       ANITA MUKHERJEE∗

       I contribute new evidence on the impacts of private prison contracting by exploiting
       the entry and exit of private prisons in Mississippi between 1996 and 2004. I find
       that private prison inmates serve an additional 4 to 7 percent of their sentences, which
       equals 60 to 90 days for the average inmate. The mechanism for this delayed release
       appears linked to the widespread use of conduct violations in private prisons: these
       inmates are 15 percent more likely to receive one, and receive twice as many. Despite
       the additional time served, I find no evidence that private prison inmates recidivate
       less.

       JEL Codes: L33, H11, H72, D02

   ∗
    University of Wisconsin-Madison. E-mail: anita.mukherjee@wisc.edu; Mailing Address: 975 University
Avenue, Office 5273, Madison, WI 53706. This paper is a revised version of the first chapter in my disserta-
tion: as such, I am indebted to my doctoral advisers David Abrams, Fernando Ferreira, Olivia Mitchell, and
Jeremy Tobacman for their guidance and support. This paper has benefited from many seminar comments
including those at the NBER Summer Institute (especially from my discussant Anne Piehl) and the Con-
ference on Empirical Legal Studies (especially from my discussant Eric Helland.) I thank Audrey MacAfee,
Lynn Mullen, and Jeff Giles at the Mississippi Department of Corrections (MDOC) for providing the raw
extracts of the prisoner data and for their hospitality during my visit to Mississippi. I gratefully acknowledge
financial assistance from the Pension Research Council and the Population Studies Center at the University
of Pennsylvania. This paper does not reflect the opinions of the MDOC or any of the funding organizations.
All errors are my own.
DOES PRISON PRIVATIZATION DISTORT JUSTICE?                        1

1         Introduction
The United States contains 5 percent of the world’s population but 25 percent of its prison-
ers (Kaeble et al. 2014). The country’s prison population has increased more than sixfold
since 1980, creating concerns about excessive costs and prison overcrowding that have fu-
eled a trend toward private contracting. The phenomenon is also global: while the United
States currently houses about 10 percent of its prisoners in private facilities, other countries
including the United Kingdom, Australia, and New Zealand house even larger fractions of
their prisoner populations in private facilities (Khey 2016). Individuals, advocacy groups,
and state governments have voiced numerous concerns about this $5 billion industry ranging
from human rights violations to the lack of evidence on promised cost savings, but there has
been little retrospective analysis to either verify or dispel these concerns. The underlying
tension is that private prison operators are typically paid a diem for each occupied bed with
few other conditions, creating a potentially perverse incentive for them to maximize the
number of occupied beds (also discussed in Dolovich 2005 and DiIulio Jr. 1988). In a recent
case that highlights the extent to which these incentives can corrupt the justice system, a
private prison operator in Pennsylvania paid two judges over $2.6 million to inflate offender
sentences and assign them to its juvenile facility (Chen 2009). In another case directly
relevant to the current study, two now-former officials from the Mississippi Department of
Corrections are awaiting trial for accepting bribes from private prison companies in exchange
for lucrative contracts (Blinder 2015).
    In this paper, I estimate the impact of private prison assignment on inmate1 time served
and recidivism in an effort to inform the debate on whether and how states should continue
private prison contracting. Time served in prison is the primary punishment that society
imposes on all inmates. This punishment is carried out unfairly, however, if it depends
systematically on whether an inmate serves time in private or public prison, all else equal
(Kyle 2013; Dolovich 2005). Beyond the fairness aspect, the number of days a prisoner is
incarcerated directly contributes to costs, threatening the main appeal of private contracting.
I also study recidivism, which is the rate at which a prisoner re-offends with a new felony.
Analysis on this outcome is necessary because it permits welfare calculations if society is
willing to trade incarceration costs or an unfair penal system for reduced crime; for example,
Levitt 1996a shows that higher prison populations are associated with lower crime. Moreover,
recidivism offers a measure of prison performance, which is important to consider because

    1
        Throughout this paper, I use the terms prisoner and inmate interchangeably.
2
private prison companies argue that they can lower the rate of prisoner re-offending via
high-quality and innovative rehabilitation programs (Spivak and Damphousse 2006; Bales
et al. 2005; Bayer and Pozen 2005).
The lack of existing empirical work on private prisons is attributable to the difficulty
of obtaining the necessary micro-data, along with a concern about selection in prison as-
signment. If prison assignment is based on characteristics unobserved to the researcher,
such as body tattoos indicating a proclivity for violent behavior, a credible research strat-
egy requires a source of experimental or quasi-experimental randomization to draw valid
conclusions about the effect of private prisons on inmate outcomes. Perhaps owing to the
difficulty of finding such variation, the existing research has ignored selection effects and in-
stead conducted simple analyses comparing inmate outcomes in public and private prisons.
In particular, researchers have studied recidivism using data from Florida and Oklahoma
(Spivak and Sharp 2008; Bales et al. 2005; Bayer and Pozen 2005; Lanza-Kaduce, Parker
and Thomas 1999), but the results from these studies are conflicting.2 To the best of my
knowledge, no previous research has compared differences in inmate time served between
public and private prisons.
I address the problem of unobservable selection in prison assignment by exploiting the
staggered entry and exit of private prisons in Mississippi between 1996 and 2004. Together
with several bed expansions and contractions, these large shocks to private prison bed capac-
ity serve as instruments for prison assignment. My empirical setting in Mississippi also has
special significance for studying private prison contracting because the state has a large pres-
ence of private prisons—accounting for about 40 percent of all state prison beds in 2012—and
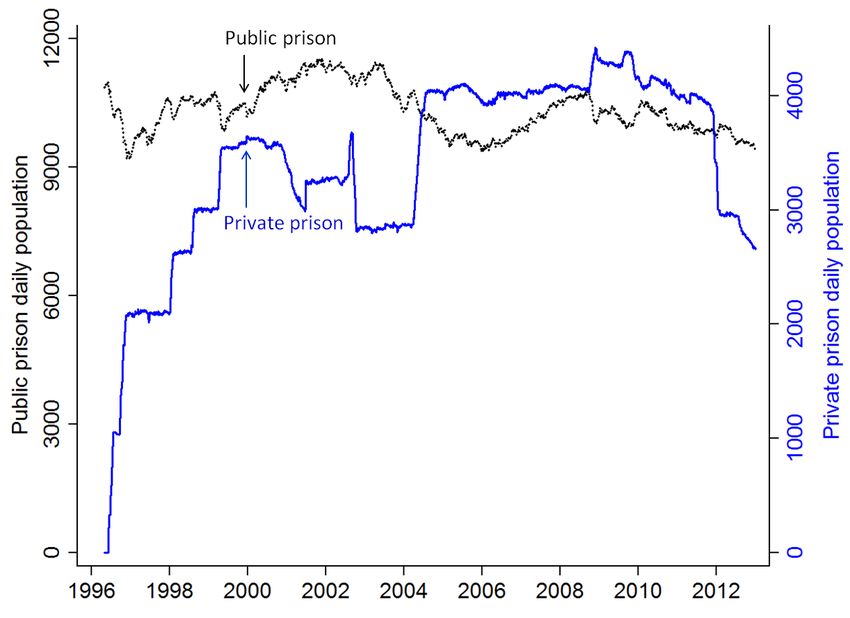
the second highest incarceration rate in the United States (Langan and Levin 2013). Figure
I shows the daily inmate population across all private facilities in Mississippi: the state filled
each private prison within two weeks of the openings (or bed capacity expansions), and then
operated them at about full capacity. In the case of prison closing or bed capacity contrac-
tions, the state emptied the relevant facilities with similar speed. This pattern suggests that
the probability with which a prisoner was assigned to private prison is an increasing function
of private prison bed capacity, a relationship that persists in a formal regression analysis.
I use this finding to implement an instrumental variable analysis in which the identifying
2
Bayer and Pozen (2005) use detailed controls and find that juvenile offenders released from private
prisons have 5 to 8 percent higher rates of one-year recidivism; they also study the role of non-profit private
prisons, which are more prevalent in the juvenile prison system. Bales et al. (2005) and Lanza-Kaduce,
Parker and Thomas (1999), however, use similar data and find no effect of private prison assignment on
recidivism rates for male, female, or juvenile offenders in Florida. Spivak and Sharp (2008) estimate a 16
percent greater recidivism rate using data on adult male offenders in Oklahoma.DOES PRISON PRIVATIZATION DISTORT JUSTICE? 3
assumption is that the sharp shocks to bed capacity did not independently affect inmate
time served or recidivism. I find this assumption plausible given that the rhetoric surround-
ing private prison contracting only deals with cost-cutting (Price and Riccucci 2005), and
moreover, I am able to conduct robustness checks using women and juvenile inmates, who
were not eligible for private prison assignment in Mississippi.
I begin the empirical analysis by studying inmate time served. I estimate the key pa-
rameters of interest using ordinary least squares (OLS) regression and matching on both
the full sample and an “event window” sample, the latter of which limits observations to
those inmates admitted to prison in the months surrounding the bed capacity shocks. I
then conduct an instrumental variable analysis using the capacity-based instrument, which
measures the change in private prison bed capacity over an inmate’s sentence. I show that
ignoring unobservable selection implies that private prisons extend prisoner time served by
about 7 percent, but addressing unobservable selection suggests that the estimate is closer to
4 percent. These results withstand many robustness checks. Despite the nearly 50 percent
reduction in the event window and instrumental variable estimates, however, they are not
significantly different from the OLS estimates. For this reason, I interpret these results to
be suggestive, but not confirmatory, of negative selection of inmates to private prison.
I then explore a key mechanism that explains the observed difference in inmate time
served between public and private prisons. I establish that the widespread use of infractions,
or prison conduct violations, in private prisons causes a distortion in release policies: baseline
infraction rates between public and private prisons are 18 and 47 percent, respectively. Even
after controlling for all covariates, an inmate in private prison is 15 percent more likely to be
cited with an infraction over the course of his sentence. I also estimate a panel regression with
fixed effects for each inmate, where the analysis is at the inmate-month level and controls
for any unobserved inmate characteristics. Using this method, I find that these additional
infractions result directly from time spent in private prison, not public prison. Hence, it is
not the case that the difference in infraction rates results from inmates with high levels of
infractions in the public prison system being transferred to private prison. The difference
in infraction rates could be due to a variety of factors, including worse prison conditions or
higher reporting rates, and I discuss these hypotheses in detail. I also rule out certain other
mechanisms that could explain the difference in prisoner time served, including particular
features of the contract structure and the amount of time elapsed since a prison’s opening.
The final step in the empirical analysis examines recidivism. I apply the same empirical
strategies for studying prisoner time served to this analysis, and I additionally employ hazard4
models in keeping with the literature. Using an inmate’s probability of re-offending with a
new felony three years post-release as my main outcome measure, I find that private prisons
do not significantly affect recidivism risk. The confidence interval on my IV estimate is wide,
however: I cannot rule out effects between -10 and 6 percent, which represent meaningful
effect sizes relative to the base of 24 percent. This result independently contributes to an
unresolved question regarding the relationship between incarceration length and recidivism.
Abstracting away from all the other differences between public and private prisons, my
estimate suggests that additional time served in the order of 60 to 90 days has no effect on
recidivism risk.3 Understanding the relationship between inmate time served and recidivism
is paramount in view of recent policies that promote changes in sentence lengths and parole
guidelines.
Having established three empirical results related to inmate time served, infractions,
and recidivism, I use insights from the literature to construct a model that can explain
these findings. As aforementioned, the standard private prison contract pays a diem per
bed occupied with limited additional contingencies; similar “fee for service” contracts are
pervasive in health care. The theoretical prediction given this type of contract is that
private operators may increase prisoner recidivism because they ignore the benefits of non-
contractible quality, for example, in the form of rehabilitation programs (Hart, Shleifer and
Vishny 1997). In my model, the private operator chooses whether to distort release decisions
based on the marginal profit and the level of government monitoring. I posit that private
prison operators respond to government monitoring because they fear contract termination
and lawsuits, both of which can damage long-term profit. My model also yields implications
for recidivism based on the assumption that recidivism risk declines with time since offense,
and I explore further implications when this assumption is relaxed.
The data I obtained also afford an opportunity to explore the role of prisoner race on
time served and recidivism. One-third of Mississippi’s population is African American, yet
this group makes up two-thirds of the state’s prison population. In my instrumental variable
analysis, I find that compared to all other prisoners, African American inmates serve about
1.4 percent larger fractions of their sentences and are 2.5 percent more likely to be cited with
an infraction. The experience of incarceration on this demographic is large—in fact, Neal
3
The main challenge in studying this relationship is that the mechanisms that induce variation in time
served may exert an independent effect on recidivism risk. For example, current studies leverage idiosyncratic
judge behavior in assigned sentence length (Abrams 2010), state-wide release policy changes (Kuziemko
2013) and mass releases (Kuziemko 2013; Maurin and Ouss 2009). The results from these papers are mixed,
however: they find negative, zero, and positive effects of time served on recidivism.DOES PRISON PRIVATIZATION DISTORT JUSTICE? 5
and Rick (2014) estimate that the practice has left many young, male African Americans
no better off than they were in the late 1960s. The level of incarceration also has spillover
effects on other population groups. For example, Charles and Luoh (2010) find that rising
male incarceration has a large impact on women via the marriage market.
The remainder of this paper is organized as follows. Section 2 provides institutional
background on private prison contracting and the parole system in Mississippi; Section 3
provides a model on release policy; Section 4 describes the data; Section 5 details the em-
pirical strategy; Section 6 discusses the results on time served; Section 7 revisits the model
and discusses the results on recidivism; Section 8 investigates mechanisms, with a focus on
infractions; Section 9 provides robustness checks; and Section 10 concludes.
2 Institutional Background
The main correctional facilities in Mississippi include four private prisons, three state prisons,
and about 50 county jails approved for holding long-term inmates.4 There are also several
community correctional centers which hold low-security inmates to help them reconnect with
their families and obtain pre-release social services. As of August 1, 2013, the endpoint of
my primary data sample, private prisons operated about 40 percent of all prison beds in
the state. The county jails provide a large number of medium-security beds that are direct
substitutes for prison beds, and many of the inmates that go to private prison at the time
of the capacity shocks are drawn from these jails. For my analysis, I group all state prisons
and county jails into “public prison” and group all the private prisons into “private prison.”
The private prisons in Mississippi are comparable to the public prisons on most dimen-
sions: both types of facilities primarily supply a majority of medium-security beds with simi-
lar cell types (“dormitory-style” or “pod-style”), offer a variety of resources including General
Education Development courses and drug rehabilitation programs, and are accredited by the
American Correctional Association. The main difference is the operating structure, and pri-
vate operators are granted control over a wide range of management decisions—from meal
choices to employee hiring—as long as they meet coarse guidelines specified in the contract.
Since 80 percent of a prison’s operating costs are related to labor (McDonald et al. 1998),
the main way in which private prisons are able to earn profit is by hiring lower-wage guards
and programming staff. Private prison guards in Mississippi earn about $15,000 less per year
($50,000 versus $35,000) and have access to fewer benefits like health insurance and matched
4
Figure C.II shows the locations of the public and private prisons.6
pension contributions (Mississippi Department of Corrections 2012).
2.1 Private Prison Contracts
States typically contract with private operators to save costs and expand bed capacity. A
quote from former MDOC Commissioner S.W. Pickett to the State of Mississippi’s Governor
and Legislature dated January 4, 1996, illustrates these core goals (1996 was the year that
Mississippi began private prison contracting):
“The end of the Fiscal Year 1995 was essentially the middle of the largest expan-
sion program in the Mississippi Department of Corrections’ history. Included in
this expansion was the initiation of institutional privatization. This approach will
minimize construction expenditure obligated by the state to relieve overcrowd-
ing, and must show at least a 10 percent cost savings in operational expenses.
Our current expansion program will help ensure that Mississippi has an ade-
quate number of prison beds to house those offenders sentenced to the Agency
(Mississippi Department of Corrections 1996).”
To choose a contractor, the state solicits proposals to provide private prison beds for
specific capacity needs, e.g., medium-security adult male beds. In Mississippi, and in many
states, the private prison beds—also called “per diem” beds—are required to provide a cost
savings of at least 10 percent compared to the public prison. The Mississippi Senate Bill
# 2005 states: “No contract for private incarceration shall be entered into unless the cost
of the private operation, including the state’s cost for monitoring the private operators,
offers a cost savings of at least 10 percent to the Department of Corrections for at least the
same level and quality of service offered by the Department of Corrections.” The contractual
diem payments only depend on the classification of the type of bed supplied (e.g., medium-
security), although separate transfers are made to compensate for prisoner health expenses.
For example, private prison operators in Mississippi are only responsible for providing the
first 72 hours of medical care.
All four private prisons in Mississippi were paid per bed occupied until May 2001. At that
time, the state passed a bill stipulating that two of the these private prisons would receive a
guaranteed payment for 90 percent of the beds. I examine the effect of this contract change
on inmate outcomes in Section 8, but in practice, this guarantee is not binding since the
private prisons typically operate above 90 percent occupancy.DOES PRISON PRIVATIZATION DISTORT JUSTICE? 7
2.2 Parole Process
Parole is the process by which inmates may be released prior to completion of their full
sentence. On average, inmates serve about 70 percent of their sentences, indicating the
significant levels of early release made on judgment of the Parole Board. In Mississippi, the
Parole Board consists of five state employees that serve on a rotating basis. To be parole
eligible, an inmate must serve the greater of either 25 percent of the sentence or certain
statutory minimums.5 In practice, the 25 percent rule is the guiding principle since the
minimum time requirements can be circumvented with earned supervised release.
For each inmate, the chief considerations for early release, or parole, are the amount
of time already served, severity of the main offense, the number of other offenses commit-
ted, community support or opposition to the inmate’s release, prior misdemeanors or felony
convictions, history of drug or alcohol violence, crimes committed while incarcerated, behav-
ior in prison, and participation in rehabilitative programs. Prisoners convicted of murder,
manslaughter, sex crimes, and kidnapping became ineligible for parole in Mississippi as of
June 30, 1995. In practice, however, these criminals could still be released long before the
sentence end date under a special type of parole called “earned supervised release.” I include
indicator variables for all the parole-ineligible crimes in the empirical analysis, but most of
them are excluded from the sample due to restrictions on sentence length and classification.
A useful feature of the Mississippi parole system is that the primary determinant of
parole, apart from observed admission factors, is the inmate’s behavior in prison. This
behavior is measured via infractions, or conduct violation reports given for actions ranging
from being too loud to possessing contraband (e.g., cell phones). The availability of the
infractions data allows me to uncover the mechanism by which parole outcomes differ for
inmates in private versus public prison. Previous research, including Kuziemko (2013) and
Bernhardt, Mongrain and Roberts (2012), have studied how in-prison behavior is affected
by other institutional structures such as discretionary parole.
3 A Model of Prisoner Release Decisions
I develop a model of prisoner release decisions to illustrate the distortion that can result
from private contracting. The model is based on Kuziemko (2013), who studied the costs and
5
These statutory minimums are: if the sentence is from one to two years he must serve at least nine
months; if the sentence is two to five years he must serve at least ten months; if the sentence is more than
five years but less than thirty years he must serve at least one year; if the sentence is thirty years or more
he must serve at least 10 years.8
benefits of discretionary parole regimes. The basic setup is also constructed to incorporate an
important aspect of the incomplete contracting model in Hart, Shleifer and Vishny (1997),
which argues that private prison operators may undertake excessive cost cutting because
they ignore the impact of these cost reductions on non-contractible quality.6 In my model,
changes in release policies that occur systematically in private prisons represent distortions
of justice because they differ from the public norm.
3.1 Baseline Model without Private Contracting
I posit that a state chooses an optimal release policy based on the trade-off between in-
carceration costs and the cost of severity-weighted recidivism risk. As in Kuziemko (2013),
incarcerating a prisoner for an additional day costs some amount C, but society benefits
from a reduction in crime due to both an incapacitation effect (i.e., the prisoner cannot com-
mit crime while incarcerated), and an aging or specific deterrence effect (i.e., a prisoner’s
recidivism risk may decline with time since the original offense).7
Let prisoner i pose a severity-weighted cost of recidivism ri that is a function of his
individual-specific risk, Ri , and a parameter βi that captures the rate at which his recidivism
risk changes with the number of days since his offense:
ri (t) = Ri − βi t. (1)
If the daily cost of incarceration to the state is C, and the prisoner time served is si , the
state’s cost minimization problem is given by:
Recidivism costs
Incarceration costs zZ }| {
z}|{ ∞
min Csi + ri (t) dt . (2)
si si
6
Specifically, Hart, Shleifer and Vishny (1997) outline a model in which the manager of the prison (public
or private) produces a “modified good”, B = B0 − b(e) + β(i), with cost structure C = C0 − c(e). The private
operator chooses effort levels e∗ and i∗ , which are the effort provisions for innovating on cost reduction and
quality improvement, respectively. The broad implication is that the private operator over-invests in cost
reduction, e∗ , and under-invests in quality innovation, i∗ , because the operator profits from cost innovations
but is not compensated for quality innovations.
7
There may also be a general deterrence effect in which criminals decide to engage in less crime because
of an increase in the expected incarceration length. This effect follows directly from Becker (1968), where
the rational criminal bases his decision to commit crime based on the probability of punishment and the
size of the punishment. This paper ignores the general deterrence effect because the analysis only concerns
prisoner outcomes conditional on court-ordered sentences.DOES PRISON PRIVATIZATION DISTORT JUSTICE? 9
In this cost minimization problem, the first order condition is C −ri (s∗i ) = 0, and the optimal
policy for the state is to release prisoner i at s∗i , which is the point at which the prisoner’s
expected risk ri , or marginal social benefit, equals C, the marginal social cost.8 Rewriting
and rearranging this equality in terms of the components of ri yields:
Ri − C
s∗i = . (3)
βi
Accordingly, the optimal time served in prison is an increasing function of the prisoner’s
initial risk Ri and a decreasing function of the rehabilitation rate βi . Figure II shows the
recidivism cost and daily incarceration curves.9 The optimal number of days served, s∗i , has
a natural upper bound at the court-ordered sentence. This framework can also be used to
study optimal release policies measured by fractions of sentences that served, in which case
si ∈ [0, 1] has a natural upper bound at 1. By law, as described in Section 2, the state holds
inmates for a minimum of 25 percent of the court-ordered sentence. In this setup, the state
R s∗
pays Cs∗i in incarceration costs in exchange for social benefit 0 i ri (t)dt from incapacitation.
R∞
At this optimum, the state still faces an expected cost of s∗ ri (t)dt in severity-weighted
i
potential recidivism resulting from prisoner i’s release.
3.2 Distortion of the Release Decision by the Private Operator
As established in Section 2, private prison operators must provide cost savings to obtain
the contract. Let the private operator charge C 0 < C for each day that a bed is occupied.
Friction arises in this setting because the private contractor treats C 0 as its marginal revenue;
it does not care about minimizing the risk of recidivism. Since C 0 is the negotiated payment
made by the state to the private prison operator for each bed occupied, the private operator
must incur marginal cost C 00 < C 0 , else it would not generate profit. The private operator’s
marginal cost, C 00 , need not be constant, although it is useful (without loss of generality) to
think of C 00 as a fixed marginal cost saving at least until the private contractor holds the
prisoner for s∗i number of days.10
When a private operator holds a prisoner beyond the number of days expected by the
state, it must exert effort to “hide” this action from the government. For example, this
8
The marginal social cost C abstracts from the prisoner’s own value of freedom, but I incorporate this
cost in the next section.
9
Kuziemko (2013) provides robustness of these results to several modeling assumptions.
10
The case where the private firm faces marginal cost C 00 but seeks to reduce recidivism risk as its objective
describes non-profit prisons, which are studied in (Bayer and Pozen, 2005).10
effort could take the form of distributing excessive infractions that delay an inmate’s release.
A slight change to this model would allow this effort to take the form of excessive cost
reductions such as hiring fewer guards than required or shirking on required prison conditions,
e.g., poor heating or cooling in the cells, which were examples of complaints lodged by the
MDOC against the private prison operators (Mississippi Department of Corrections 2012).
Formally, let the private prison’s daily cost of incarcerating an inmate be:
C 00 if di ≤ 0
M Cp = (4)
C 00 + Kd2 if di > 0
i
where di is the amount of distortion (in days) and K is a scalar capturing the cost of distorting
an inmate’s length of stay. This distortion allows the private prison operator to realize profit
on each prisoner i in the amount:
Z s∗i +di
C 0 − C 00 dt. (5)
0
This model assumes that the private operator only faces a cost for positive distortions (simple
extensions can be carried out for distortions in either direction.) Figure II illustrates how
equation (4) affects the equilibrium outcomes in the broader framework.
The cost function in equation (4) can easily be endogenized to allow the private operator
to select an optimal level of distortion d̂i . Consider that the private operator faces the profit
function:
(C 0 − C 00 )(s∗i + di ) − Kd2i . (6)
The private operator decides on the optimal level of distortion, d̂i , based on the first
order condition:
C 0 − C 00
d̂i = , (7)
2K
which, as expected, is decreasing in the cost of distortion. The distortion in the number of
prisoner days served is always positive as long as the marginal revenue, C 0 , exceeds the daily
cost to the private operator, C 00 .
3.3 Assessing Welfare
Distortion of the release decision has direct implications regarding the fairness of the criminal
justice system: conditional on all available information, the state, acting as the social planner,DOES PRISON PRIVATIZATION DISTORT JUSTICE? 11
does not seek differential punishment of inmates by assigning them to private or public
facilities. This will occur, however, if prison assignment is based on extraneous factors such
as prison capacity. The primary welfare loss from release policy distortion is due to injustice,
but society may also care about the eroded cost savings and the prisoner’s value of freedom.
Quantifying the value of prisoner freedom is difficult. Using experimental evidence on
bail setting in Philadelphia, Abrams and Rohlfs (2011) offer an estimate of about $1,000
($1,270 in today’s dollars) for 90 days of freedom, but their estimates are noisy and may not
be relevant for inmates who have already served a substantial number of days in prison. If
the daily value of a prisoner i’s freedom is constant at Fi , then distortions in release policy
induces a welfare loss to inmates of the amount:
X
d̂i Fi , (8)
i∈I
where d̂i represents the distortion (in number of days) that a prisoner is kept beyond his
expected number of days in prison, s∗i .
The erosion in cost saving is important for social welfare. The state pays an extra d̂i C 0
in incarceration costs for each prisoner i, and loses all the expected cost savings from private
contracting if d̂i C 0 > (C − C 0 )s∗i . If the cost savings offered by private operators is (1 − γ)
percent per occupied bed (by Mississippi state law, (1−γ) ≥ 10 percent), then the inequality
becomes d̂i γC > (1 − γ)Cs∗i , which simplifies to:
d̂i
> 1 − γ. (9)
d̂i + s∗i
Equation (9) shows that any distortion in time served directly erodes the cost savings ex-
pected from private contracting.11
4 Mississippi Felony Data and Sample Definition
I study Mississippi felonies from May 1, 1996 to July 31, 2013. This state’s prison data
are rich, and several private prison bed expansions and contractions provide useful quasi-
experimental sources of variation in prison assignment. Administrative records were obtained
11
An extension to this model that allows for the state to re-optimize release policies is provided in Sec-
tion A.3. The intuition is that if the state views private prison contracting as a technology that reduces
the marginal cost of daily incarceration, then it may re-optimize release decisions accordingly. However,
distortion may still occur because the state and the private operator maximize different objective functions.12
directly from the MDOC. The MDOC manages an “inmate data file” that covers every
inmate who served time in a state prison since 1981, although some variables, such as the
timing of transfers between facilities, are available only from May 1, 1996. The felony-
level files contain standard criminal justice data on the offender’s demographics, offense,
infractions, and release type. A special feature of this data is that I am able to observe the
movement of inmates between facilities over the course of their sentences—this allows me to
determine the amount of time that a prisoner spent in private prison, as opposed to several
existing studies that only look at whether the releasing facility was a private prison.
The demographic variables in the MDOC dataset include the offender’s age, gender,
race, county of conviction, and prior felonies. Classification data include information on the
offender’s bed security level (ranging from minimum to maximum), medical score (ranging
from values A, healthy, to E, extremely sick) and the “level of care” score (ranging from 1,
indicating a prisoner who is normally functioning and able to work, to 5, indicating a prisoner
who is severely physically or mentally constrained). The data also include information on
the crime committed, court-ordered sentence length, and the number of days served while
the case was under trial. Using these data, I construct three variables of interest: whether a
prisoner was ever assigned to private prison (the main independent variable in my analyses),
whether the prisoner had a prior incarceration in the five years prior to the admission date,
and whether the prisoner recidivated within three years of release with a new sentence.12
My primary sample consists of felonies that occurred in Mississippi between May 1,
1996 and July 31, 2004. Each observation is an inmate-sentence; on average, there are 1.1
sentences per offender. There were initially 34,571 inmates contributing 40,195 observations
between May 1, 1996 and July 31, 2004. I omit sentences that occur after July 31, 2004
to allow for a three-year recidivism window for the 85 percent of sentences that are less
than or equal to six years. Between August 1, 2004 and August 1, 2013, I observe an
additional 39,059 sentences for 34,620 inmates, from which I calculate whether an inmate
returns to prison in the three years following release. My sample is further restricted to
adult inmates (age ≥ 18) because the juvenile correctional system is wholly different from
the adult correctional system.13
12
I only observe recidivism if the new felony occurs in Mississippi. This is a common censoring problem,
but the problem is ameliorated by the observation that most recidivating cases tend to occur in the same
state (Beck and Shipley 2013; Langan and Levin 2013).
13
A few other inconsequential restrictions are imposed to reduce the noise in the final sample. I omit a few
sentences that are shorter than one year because the MDOC states that all felonies must carry a minimum
sentence of one year. In rare cases, however, the judge may award up-front meritorious time to reduce the
sentence. The sample also excludes inmate with life or death penalty sentences because the outcomes I studyDOES PRISON PRIVATIZATION DISTORT JUSTICE? 13
Table I shows summary statistics for inmates by whether they are assigned to public or
private prison, for the full sample as well as an “event window” sample; the latter group
limits observations to those inmates admitted in the few months surrounding the bed capacity
shocks. Specifically, I include only inmates with admission dates at least 30 days before a
capacity shock who have release dates at least 90 days following the capacity shock since
these are restrictions used by the MDOC in prison assignment. My full analysis sample
therefore consists of 26,593 inmates, about 19 percent of whom go to private prison over
the time period examined. The event window sample consists of 13,282 inmates—for this
sample, I define the inmate as being assigned to private prison only for the 1,054 inmates
that are sent to a private prison within the first six months of the prison opening or bed
expansion.14 The purpose of this categorization is to leverage the quasi-random variation
in prison assignment induced by the capacity shocks on the event window sample in the
empirical analysis.
The descriptive statistics in columns (1) to (3) of Table I foreshadow the main results.
First, inmates in public prison serve 70 percent of their sentences on average, but inmates
that go to private prison serve 73 percent of their sentences. This difference sustains through
every category of sentence length and offense, suggesting that release policies may differ
systematically between public and private prison.15 Interestingly, some of this difference is
attributable to inmates who serve exactly 100 percent of their sentences: whereas 11 percent
of inmates in public prison serve the maximum number of days in prison, about 17 percent
of their counterparts in private prison do so. Recidivism rates are similar for the two groups
(25 versus 26 percent), and are very close to the national average of 24 percent (Langan
and Levin 2013). The higher average sentence length among privately incarcerated inmates
reflects both the state’s preferences in prison assignment, and the fact that inmates with
longer sentences experience more private prison openings and bed expansions.
Table I also reveals a considerable degree of difference along observed characteristics
are not relevant in the context of life or death penalty sentences—the sentence length restriction of 1 to 6
years is enough to exclude these inmates. Finally, I limit the sample to those offenders who serve at least
25 percent of their sentences, since this is the minimum required by the Mississippi law and exceptions are
only made under exceptional circumstances.
14
The reason my sample does not include more inmates going to private prison during the capacity shocks
is because many of them have not yet been released. Additionally, many of these inmates were admitted to
the system before 1996, and are excluded from the sample because their movement data are unavailable.
15
Figure C.III shows the cumulative distribution function (CDF) plots of the fraction of sentence served
by offense category, and Figure C.IV shows the same plots by bins of sentence length. For both variables,
the CDFs of fraction of sentence served for inmates that go to private prison stochastically dominates the
CDFs for those inmates in public prison almost every instance. The CDFs also show peaks at the 50, 85
and 100 percent, which are common release points.14
between those in public versus private prison. Echoing the anecdotal evidence provided in
Spivak and Sharp (2008), I find that inmates in private prison are more likely to be black
(71 versus 67 percent), single (67 versus 55 percent), young (mean age of 28 versus 32) and
less educated (56 versus 53 percent are high school dropouts).16 Figure III shows the CDFs
of some of these variables divided by whether the prisoner was assigned to private prison:
variables such as age and sentence length are different across the two groups for the entire
distribution, not just at the mean. This degree of observable selection raises concerns about
unobservable selection, suggesting an instrumental variable approach is required to obtain
an unbiased estimate of the impact of private prisons on prisoner outcomes.
The other variables shown in Table I relate to inmate movements, offenses and release
types. I observe that the typical path for an offender is to serve “court days” while his case
is deliberated and then, if he is found guilty, he is transferred to the corrections system.
Offenders who are found guilty are given full credit for days served while in court. At that
point, the inmate is classified at a public facility and then assigned to long-term placement
in either a public or private prison, though he can be moved several times again afterward.
The classification process is lengthy: on average, column (1) reveals that it takes 8.4 months.
There are some differences by offense category in the types of inmates that are assigned to
private prison; for example, fewer have drug possession and felony DUI charges, and more
have robbery and assault charges. Prisoner release types also differ slightly between the two
types of facilities, with more inmates in private prison released under “earned supervised
release”, which is a type of release granted to inmates who have served large fractions of
their sentences. The descriptive statistics for the event window sample, in columns (4) to (6)
of Table I, largely mirror those in the overall sample. The main differences in the summary
statistics between the full sample and the event window sample are due to time trends—the
full sample spans a larger time period than the event window sample. 17
5 Empirical Strategy
16
Spivak and Sharp (2008) also find evidence of this type of selection in Oklahoma: “Private prison inmates
tended to be younger, had fewer years in prison, were often minority and drug offenders who were reputed to
be associated with gangs, and often appeared to be seeking social status through violent confrontations with
other inmates and by adverse interactions with security and management staff....These offenders may have
differed qualitatively from inmates less troublesome to staff (and thus less likely to be transferred) in ways
that would enhance their hazard of recidivism but not be adequately captured by the control variables.”
17
I also provide the prison-by-prison summary statistics in Table C.I, but present the pooled analysis in
the main text since the prison-by-prison analysis does not provide additional insights.DOES PRISON PRIVATIZATION DISTORT JUSTICE? 15
I offer four sets of estimates relating prisoner time served to private prison assignment. The
first two sets of estimates use ordinary least squares (OLS) on the full and event window
samples to characterize the underlying relationships in the data. A third set of estimates—
my preferred set—is generated by an instrumental variable analysis that exploits capacity
shocks to private prison bed capacity to obtain quasi-random assignment of inmates to
private prison. The fourth approach employs a “leave-one-out” instrumental variable that
equals, for each inmate, the number of other inmates admitted in the same month-year
that are assigned to private prison. Robustness analyses, including matching and a control
function approach, are provided in Section 9. I leave the recidivism analysis for Section 7.
5.1 Benchmark: OLS Using the Full Sample
The first OLS regression that links the effect of private prison assignment on prisoner outcome
Yi is as follows:
Yi = βP rivatei + θXi + i , (10)
where P rivatei is a binary variable indicating whether the prisoner serves any time in pri-
vate prison. I measure time served as either the fraction of sentence served, or the number
of days served. The vector Xi captures demographic, classification, offense, admission time
and crime-related information. Demographic information includes prisoner age at admis-
sion date, race, marital status, and education level; these variables are included because
they may inform the pattern of selection if there is one. I also use the inmate’s county of
conviction, which is typically identical to the prisoner’s county of residence (Thomas and
Torrone 2008). For crime-related information, I control for sentence length, offense type, and
criminal history; these variables are important as they inform the amount of time served.
To control for policies that may be changing over time, I include both linear and quadratic
terms for admission time, where admission time is calculated as days since January 1, 1990.
Hence, if an inmate begins his sentence on January 1, 1999, his value of admission time is
9 ∗ 365 = 3, 285.
The parameter of most interest, β, measures the effect of private prison assignment on
outcome Yi . The two outcomes I study have natural interpretations in the face of selection.
If there is negative selection, β will be biased upward since inmates who would typically
serve larger fractions of their sentences or recidivate at higher rates would be systematically
assigned to private prison. The opposite is true in the presence of positive selection, i.e.,
the world in which unobservedly “better” inmates are assigned to private prison. Based on16
Spivak and Sharp (2008) and my own interactions with the MDOC system, I expect that
negative selection on unobservables is probable in private prison assignment.
5.2 OLS Using the Event Window Sample
If the capacity shocks to private prison bed capacity exogenously shift the probability of
private prison assignment, then the OLS analysis on the full sample can be improved by
constructing a better control group for the inmates that go to private prison. I implement
an event window research design to achieve this goal and isolate the effect of private prison
assignment on prisoner outcomes using variation only from the inmates who are induced to
private prison assignment by the private prison capacity shocks.
The event window design I use addresses one of the key challenges in leveraging the
capacity shocks to private prison capacity as an instrument for private prison assignment:
new inmates are rarely assigned to private prison. In fact, the average time served in jail or
public prison prior to private prison assignment is just over eight months (see Table I)—due
to this institutional feature, it is not possible to conduct a conventional “before and after”
analysis. Instead, I limit the sample to inmates that have an admission date at least 30 days
prior to the date of the capacity shock, and a release date at least 90 days after the capacity
shock; the reason I use the 30 and 90 day cutoffs is because these are explicit guidelines
used by the MDOC in prison assignment. Within this sample, for each capacity shock, the
variable Private equals one if the prisoner is assigned specifically to the prison with the
capacity shock (“ramp up”) within the time period. Because there may still be selection
concerns in this event window period, however, the instrumental variables estimates that
follow represent my preferred estimates.
5.3 Instrumental Variable Analysis Using Bed Capacity Shocks
To extend the event window analysis, I adopt an instrumental variable approach in which
inmates are assigned to private prison depending on a measure of private prison capacity.
This method extends the event window analysis in two ways. First, I am able to use prison
closings as an additional source of variation in private prison bed capacity. Second, this
analysis measures the “intensity” with which a prisoner is exposed to private prison openings
and closings and hence uses variation in sentence length.
Estimating the first stage equation requires care because the endogenous variable, whetherDOES PRISON PRIVATIZATION DISTORT JUSTICE? 17
the prisoner is assigned to private prison, is binary and has a low mean.18 To instrument for
a prisoner’s likelihood of private prison assignment, I operationalize the bed capacity shocks
illustrated in Figure I using the following formula:
J
X
RAM Pi = rampij , (11)
j=1
where J is the number of capacity shocks and rampij is defined as:
C
j if ai ≤ tj − 30 and vi ≥ tj + 90,
rampij = (12)
0 otherwise,
where ai is the prisoner’s admission date, vi is his maximum release date (i.e., the prisoner’s
admission date plus his court-ordered sentence), tj is the date of the private prison bed
capacity shock, Cj is the number of beds opening or closing. Variation in the instrument is
induced by differences in prisoner admission date and sentence length.
I also adopt a conventional leave-one-out instrument that equals the fraction of other
inmates with the same admission month and year who go to private prison. For prisoner i
admitted in month m of year y, the instrument is defined as:
N
Pmy
Private my − 1
i=1
Leave-one-out imy = ,
Nmy − 1
where Nmy represents the number of inmates admitted in month m of year y. Figure IV shows
scatter plots of these instruments by prisoner admission date. The two instruments that I
use differ from each other in important ways. The capacity shock instrument is a function
of both the prisoner’s admission date and sentence length. The leave-one-out instrument is
a only a function of the prisoner’s admission date.
To address the nonlinearity of the first stage, I adopt the probit correction outlined in
Wooldridge (2002). This method leverages the probit model to capture the nonlinearity of
the first stage, and the predicted probabilities from this model are used as instruments in a
standard two-stage least squares (2SLS) framework. An advantage of this method is that it
18
Using the variables in my preferred specifications shown in Table C.IX, I find that a linear probability
model fits the data poorly and predicts mostly negative probabilities for whether an inmate goes to private
prison. Based on Wooldridge (2002), this is not surprising since the mean of the dependent variables is less
than 30%.18
is robust to misspecification of the probit model (one of the drawbacks of a control function
approach), and the standard errors are the same as the usual 2SLS standard errors. The
probit model is given by Pi = Φ(κZi +βXi ), where Xi is the same as in the OLS specification
and Zi refers to the instrument. The first stage equation is given by:
Private i = αS + βS P̂i + δS Xi + ηi (13)
The second stage equation uses as an instrument the predicted probability, Private:
\
Yi = αIV + βIV Private
\ i + δIV Xi + i . (14)
Identification requires three assumptions. First, the instrument Zi must be a good pre-
dictor of prison assignment, and I show this in the regression analysis. Second, there should
be monotonicity: the instrument should affect private prison assignment in the expected
direction. Expansions should increase the probability of private prison assignment, while
contractions should decrease the probability of private prison assignment. Finally, the exclu-
sion restriction should be satisfied—the instrument should be otherwise unrelated to prisoner
outcomes. Formally, the exclusion restriction requires that ηi , the first stage regression er-
ror, is independent of i , the second stage regression error. While one can never “prove” the
exclusion restriction, to the extent that we believe that policies that could change around
the time of private prison openings would also affect women and juveniles, I show that the
reduced form equations are not significant for these two placebo groups who are not eligible
for private prison assignment.19
6 Results on Time Served
This section presents the estimates of the effect of private prison assignment on prisoner
time served. I find suggestive evidence of negative selection of inmates to private prison
because the event window and instrumental variable (IV) estimates are smaller, though not
statistically significantly different from, the benchmark OLS estimates (4 versus 7 percent,
or 60 versus 90 “extra” days).
19
A remaining threat to my identification strategy would assume differential outcomes for inmates in
private versus public prison, but that seems unlikely given that the rhetoric surrounding private prison
contracting only deals with cost-cutting and bed capacity. Even if the state re-optimizes release decisions
simultaneously with capacity shocks, I show in Section A.3 that the theoretical predictions about release
policy distortion are still relevant.DOES PRISON PRIVATIZATION DISTORT JUSTICE? 19
Table II presents the OLS and event window results—in particular, columns (3) and
(6) report the saturated regression estimates with all the controls discussed in Section 5.
These results show that inmates in private prison appear to serve 6 to 7 percent larger
fractions of their sentences than inmates in public prison. The coefficient of 6 to 7 percent
is remarkably stable: moving from column (1) which only controls for offense, admission
time trends, and county of conviction, to column (3) which includes all the demographic
and classification information, does not change the point estimate. Since the mean sentence
length for inmates in private prison is 3.68 years, an increase of 6.8% in the fraction of
sentence served translates to 91.3 additional days.20 Given that the mean fraction served is
about 70 percent, my OLS estimate translates to an effect size of about 10 percent.
The other covariates in columns (1) to (6) of Table II have the expected sign: inmates
with larger sentences serve smaller fractions of their sentences, and the number of prior
incarcerations increases the fraction of sentence served by about one percent. Even after
controlling for all covariates, I find that single, black, and older inmates each serve signif-
icantly larger fractions of their sentences. The estimates in column (3) suggest that single
inmates serve 2.4 percent and black inmates serve 1.4 percent larger fractions of their sen-
tences. Some of these differences may be due to in-prison behavior, which I discuss further in
Section 8. I find no effect of education level, as measured by whether the prisoner completed
high school, on the release decision.
Table III shows the instrumental variable estimates of private prison assignment on the
fraction of sentence served. The two instrumental variables are the capacity-based instru-
ment, shown in columns (2) to (4), and the leave-one-out instrument, shown in columns (5)
to (7). Columns (3) and (6) report the first stage regressions: the F-statistic is 37 for Ramp
and above 100 for Leave-one-out. Both sets of instrumental variable estimates reveal a much
smaller relationship between private prison assignment and fraction of sentence served than
that indicated by the OLS and event window estimates, but the standard errors on the IV
estimates are large and cannot rule out the earlier estimates. According the to IV analysis,
the true effect of private prison on prisoner time served is closer to 4 percent, which equals
about 60 additional days.21
20
Table C.II presents estimates using days served as the dependent variable. The estimate from this
regression is 93.2 additional days for inmates assigned to private prison.
21
This result is corroborated by the specification in which the dependent variable is measured as days
served instead of fraction of sentence served, shown in Table C.III.20
7 Recidivism Analysis
7.1 Assessing Welfare Impacts Considering Recidivism
I return to the model in Section 3 and discuss the welfare impacts of private prisons con-
sidering recidivism as an outcome. The empirical work thus far has established that private
prisons cause a distortion in a prisoner’s time served. If the additional days in prison decrease
recidivism, then the distortion may not be harmful from a social welfare perspective. In this
section, I relax the notion that distortions to inmate time served are welfare-decreasing for
society. Specifically, I allow for reductions in recidivism to outweigh the increased incar-
ceration cost, and derive a new set of welfare calculations to assess the impact of private
prisons.
The time elapsed since an inmate’s offense may affect his risk of recidivism, as shown in
equation (2). Therefore, while it is unfair for inmates in private prison to receive differential
punishment, society may benefit from the distortion if it is willing to trade incarceration
costs and unfair punishment for reduced crime.22 Figure V depicts this trade-off: distortions
to time served are beneficial as long as they are sufficiently small and the recidivism risk
curve is sufficiently flat. The total social cost of incarcerating an individual without private
prison contracting is given by:
βi ∗ 2
(C − Ri )s∗i + (s ) + ∆, (15)
2 i
where the parameters C, Ri , βi , and s∗i are the same as in equation (2), and ∆ = Ri t −
βi 2
2
t .
t=∞
For the case where the government contracts with private prisons, the total social cost of
incarcerating an individual depends on the amount of distortion d̂i , and the extent to which
the per-diem C 0 is less than the state’s daily cost C. The total social cost is given by:
β 2
i
(C 0 − Ri ) s∗i + d̂i + s∗i + d̂i + ∆. (16)
2
22
The prisoner’s value of daily freedom Fi , as discussed in Abrams and Rohlfs (2011), remains part of the
calculation.DOES PRISON PRIVATIZATION DISTORT JUSTICE? 21
Total social welfare improves under private prison contracting if the following is true:
2
βi ∗ 2 β
i
(C − Ri )s∗i 0 ∗
+ (si ) − (C − Ri ) si + d̂i + ∗
s + d̂i ≥ 0, (17)
2 2 i
or, equivalently, if:
βi 2
(C − C 0 )s∗i − (C 0 − Ri )d̂i − βi d̂i s∗i − d̂i ≥ 0, (18)
2
Ri −C
where, from equation (3), s∗i = βi
.
Before showing the conditions under which equation (18) is positive, a few observations
are in order. First, absent distortion (i.e., d̂i = 0), social welfare is guaranteed to improve
under private contracting, and this improvement is equal to (C − C 0 )s∗i , which is the cost
saving offered by private prisons. Indeed, policy discussions surrounding private prison
contracting strongly suggest that this is its overarching goal. Second, if recidivism risk does
not respond to time elapsed since offense (i.e., βi = 0), the increase in social welfare from
private prison contracting is (C −C 0 )s∗i −(C 0 −Ri )d̂i . In this case, social welfare is actually an
increasing function of distortions, as long as the criminal justice system chooses to incarcerate
individuals with recidivism risk greater than the marginal cost of incarceration.
Returning to equation (18), I find that social welfare increases if:
q
(C − C 0 )2 + (C − C 0 )2 + 2(C − C 0 )(Ri − C)
d̂i ≤ . (19)
βi
The intuition from equation (19) is as follows. If the amount of distortion from private
prison contracting is sufficiently low, then there is a gain in social welfare. If βi = 0, the
condition requires only that d̂i < ∞, which is always the case since the private prison cannot
hold a prisoner beyond his court-ordered sentence length. If private prisons offer no cost
saving, i.e., if C = C 0 , then equation (19) shows that social welfare is unchanged only if
there is no distortion.
Two testable implications emerge from this framework. First, if recidivism risk is truly
falling in time since offense, and if private prisons have no other impact on recidivism risk,
then recidivism risk should be lower for inmates who go to private prison. Using prisoner
data from Georgia and an instrumental variable analysis based on parole guidelines, along
with the same definition of recidivism used in this paper, Kuziemko (2013) estimates thatYou can also read