Impact assessment of Learnerships, Apprenticeships and Bursaries
←
→
Page content transcription
If your browser does not render page correctly, please read the page content below
Impact assessment of                                                0

Learnerships, Apprenticeships
        and Bursaries

 A Tracking and Tracing study of the
 impact of learnerships, apprenticeships
 and bursaries funded by FP&M SETA

 December 2014

                            FP&M SETA Tracking and Tracing study of
                        Learnerships, Apprenticeships and Bursaries - 2014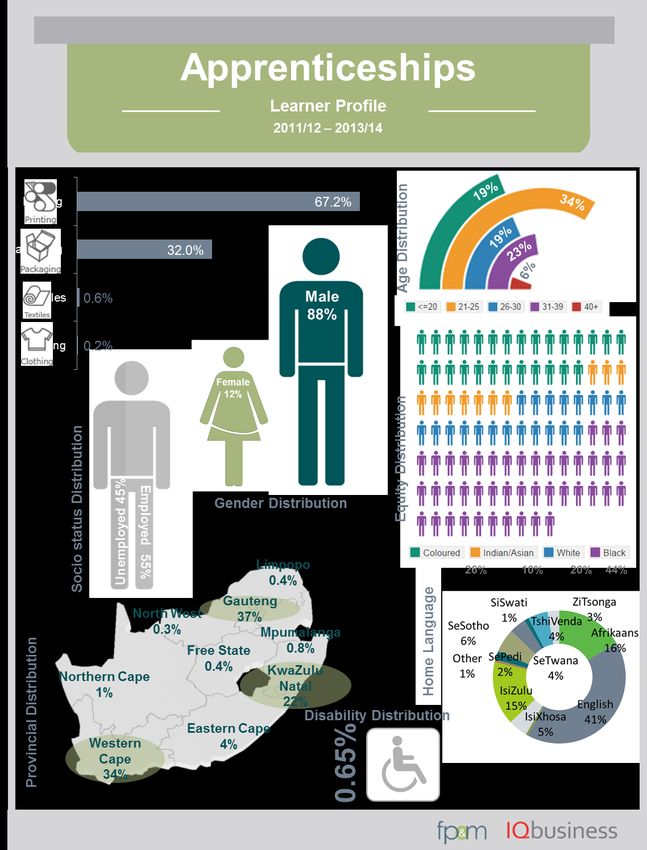
1

                                                                                                                    Contents
                                                                                                                                           Chapter 1
                                                                                          Profile of Learners Enrolled for
                                                                               Learnerships, Apprenticeships and Bursaries
Executive Summary ................................................................................................................................ 7
1.     Objective ........................................................................................................................................ 12
2.     Methodology .................................................................................................................................. 12
     2.1       Process of compiling data ..................................................................................................... 12
      2.1.1       Compiling Data for Learnerships and Apprenticeships ..................................................... 12
      2.1.2       Compiling Data for Bursaries ............................................................................................ 13
      2.1.3       Fields of interest for analysis ............................................................................................. 13
      2.1.4       Missing data in variables ................................................................................................... 16
     2.2       Analysis of data ..................................................................................................................... 16
3.     Results: Description of the population ........................................................................................... 17
     3.1       Summary ............................................................................................................................... 17
     3.2       Qualifications ......................................................................................................................... 17
     3.3       Learnership Profile ................................................................................................................ 19
      3.3.1       Geographical distribution for learnerships ........................................................................ 20
      3.3.2       Age distribution for learnerships ........................................................................................ 20
      3.3.3       Socio-status distribution for learnerships .......................................................................... 21
      3.3.4       Equity distribution .............................................................................................................. 21
      3.3.5       Home language distribution .............................................................................................. 22
     3.4       Apprenticeships ..................................................................................................................... 23
      3.4.1       Geographical distribution for apprenticeships ................................................................... 24
      3.4.2       Age distribution for apprenticeships .................................................................................. 24
      3.4.3       Socio-status distribution for apprenticeships .................................................................... 25
      3.4.4       Equity distribution for apprenticeships .............................................................................. 25
      3.4.5       Home language distribution for apprenticeships ............................................................... 26
     3.5       Bursaries ............................................................................................................................... 27
      3.5.1       Age distribution.................................................................................................................. 28
      3.5.2       Equity distribution .............................................................................................................. 29

                                                                                                                                          Chapter 2
                                                                                                              Geographic Distribution of
                                                                                                                   SETA funded projects
1.     Objective ........................................................................................................................................ 30
2.     Methodology .................................................................................................................................. 30
3.     Detailed results of geographic distribution of SETA funded projects ............................................ 30

                                                                                                   FP&M SETA Tracking and Tracing study of
                                                                                             Learnerships, Apprenticeships and Bursaries - 2014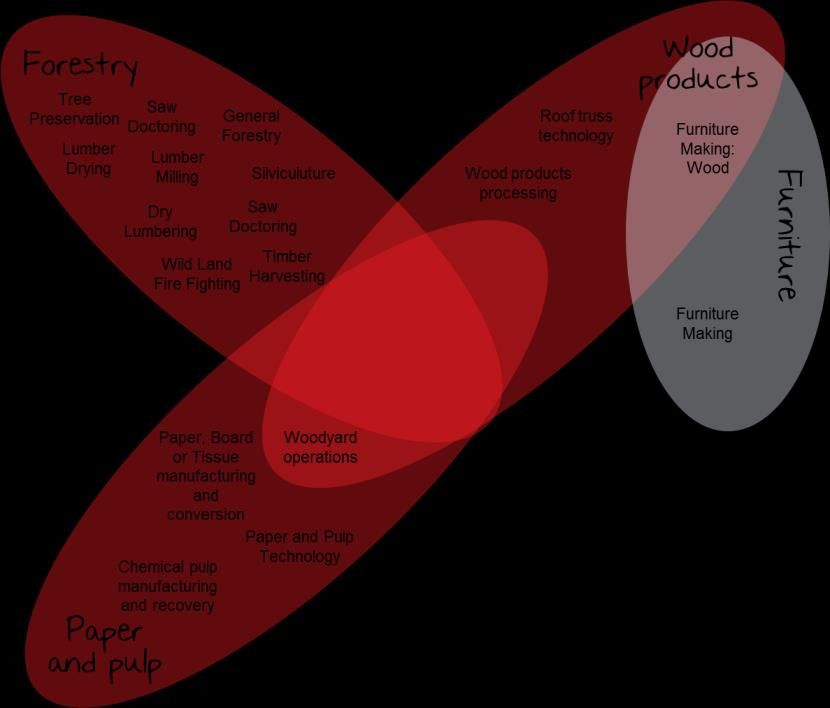
2

     3.1       Summary of geographic distribution of funding ..................................................................... 30
     3.2       Geographic distribution of funding for Learnerships ............................................................. 31
     3.3       Geographic distribution of funding for Apprenticeships ........................................................ 33
     3.4       Geographic distribution of funding for Bursaries ................................................................... 34
                                                                                                                    Chapter 3
                                                                                         The success of learning interventions
                                                                                                       in creating an impact
1.     Objective ........................................................................................................................................ 37
2.     Methodology .................................................................................................................................. 37
     2.1       Primary research design to collect the opinions of learners ................................................. 37
      2.1.1       Objectives of the learner surveys ...................................................................................... 37
      2.1.2       Population and sample for the learners surveys ............................................................... 38
      2.1.3       Data collection for the learner surveys .............................................................................. 38
      2.1.4       Data analysis of the learner surveys ................................................................................. 38
      2.1.5       Methodology for the qualitative focus groups ................................................................... 38
     2.2       Primary research to collect the opinions of employers ......................................................... 39
      2.2.1       Objectives of the employer survey .................................................................................... 39
      2.2.2       Population and sampling for employer survey .................................................................. 39
      2.2.3       Data collection for employer survey .................................................................................. 39
      2.2.4       Data Analysis .................................................................................................................... 40
3.     Detailed results of impact study ..................................................................................................... 40
     3.1       Completion rates ................................................................................................................... 40
     3.2       Alignment of skills to needs ................................................................................................... 41
     3.3       The impact of learning interventions on learners .................................................................. 43
      3.3.1       Creating employment for the unemployed ........................................................................ 44
      3.3.2       Increased earnings potential ............................................................................................. 45
      3.3.3       Improving inter-personal skills ........................................................................................... 47
      3.3.4       Improving chances of promotion and career advancement .............................................. 47
      3.3.5       Increased interest in future study and further improvement ............................................. 48
      3.3.6       Providing the disadvantaged with access to training ........................................................ 48
      3.3.7       Learning skills that can assist in self-employment ............................................................ 48
     3.4       The impact of learning interventions on employers .............................................................. 49
      3.4.1       Well-trained employees that are multi-skilled and efficient ............................................... 49
      3.4.2       Employees show improved workplace behaviour ............................................................. 49
      3.4.3       Positive effect on productivity ............................................................................................ 50
      3.4.4       Improves company morale and assists in staff retention and career planning ................. 50
     3.5       Challenges faced by employers and learners ....................................................................... 50
      3.5.1       Long training hours ........................................................................................................... 50
      3.5.2       Challenge of insufficient funding and slow grant disbursement ........................................ 51

                                                                                                   FP&M SETA Tracking and Tracing study of
                                                                                             Learnerships, Apprenticeships and Bursaries - 2014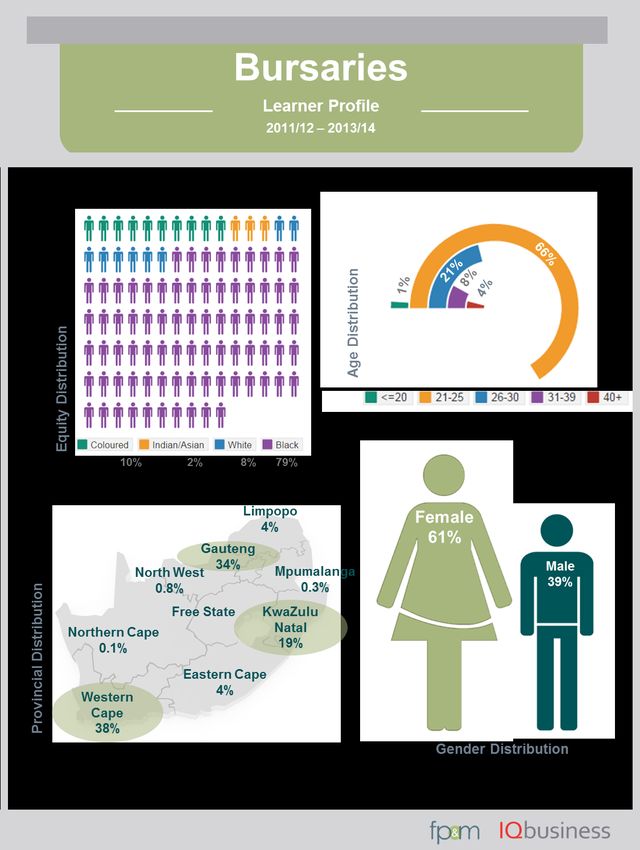
3

        3.5.3       Challenge of slow and inefficient communication with FP&M SETA ................................ 53
        3.5.4       Lack of training providers in certain geographic areas ..................................................... 53
        3.5.5       Approving training ............................................................................................................. 53
        3.5.6       Certification ....................................................................................................................... 54
     3.6        Suggestions for improvement ............................................................................................... 54
        3.6.1       Suggestions for changes in funding structures and payment of stipends ......................... 54
        3.6.2       Improvements to the grants application process .............................................................. 55
        3.6.3       Assist smaller companies .................................................................................................. 55
        3.6.4       Consider supporting more rural areas .............................................................................. 56
                                                                                                                 Chapter 4
                                                                                                   Key Trends and Challenges
                                                                                       for Education and FP&M Sub-sectors
1.      Objective ........................................................................................................................................ 57
2.      Methodology .................................................................................................................................. 57
3.      The South African educational context .......................................................................................... 57
     3.1        Skills Challenges in South Africa .......................................................................................... 58
4.      FP&M Sector Trends ..................................................................................................................... 61
     4.1    Closing the gap: Gap between education and being able to transfer skills in into the
     workplace .......................................................................................................................................... 61
     4.2        Trends in the sub-sectors ...................................................................................................... 62
     4.3        Challenges in the sub-sectors ............................................................................................... 63
     4.4        Drivers for change in the sub-sectors ................................................................................... 63
                                                                                                                                           Chapter 5
                                                                                                                                           Conclusion
1.      Summary of activities ..................................................................................................................... 64
2.      Conclusions ................................................................................................................................... 65
3.      The way forward ............................................................................................................................ 65
                                                                                                                       Appendix
     APPENDIX 1: Codes from MIS database ......................................................................................... 67
     APPENDIX 2: Detailed description of the South African Context ..................................................... 68
        2.1.1       Challenges identified by DHET ......................................................................................... 69
        2.1.2       General challenges ........................................................................................................... 69
     2.2        Closing the gap ..................................................................................................................... 70
        2.2.1       Gap between education and being able to transfer skills into workplace ......................... 70
     2.3        Education levels in South Africa............................................................................................ 72
        2.3.1       Literacy in South Africa: Completion of Grade 7 and higher ............................................. 72
     2.4        Educational institutions ......................................................................................................... 73
        2.4.1       Attendance of educational institutions............................................................................... 75
        2.4.2       The causes of non-attendance.......................................................................................... 76

                                                                                                    FP&M SETA Tracking and Tracing study of
                                                                                              Learnerships, Apprenticeships and Bursaries - 2014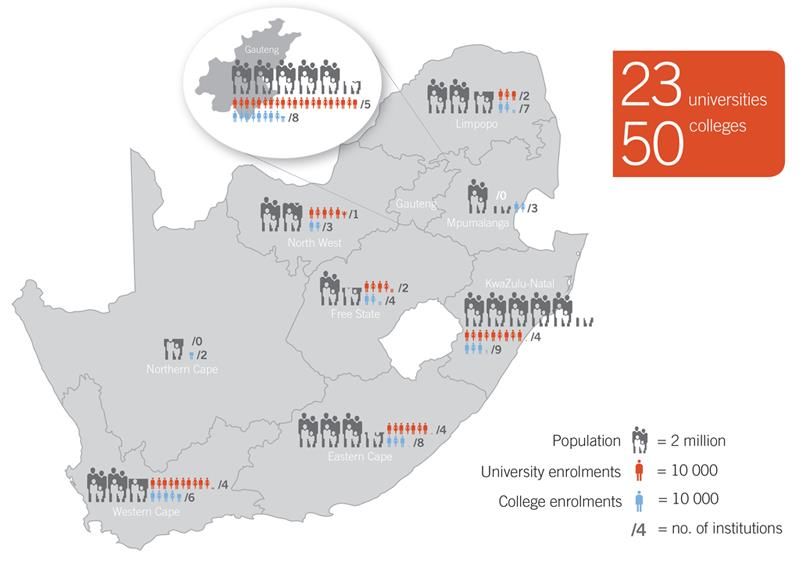
4
2.4.3 Problems at educational institutions.................................................................................. 77
2.4.4 Repeaters .......................................................................................................................... 78
2.5 Delivery of Education ............................................................................................................ 78
2.5.1 FET Colleges ..................................................................................................................... 78
2.5.2 Pass and throughput rates for NC (V) Levels at FET Colleges ........................................ 79
2.5.3 Pass and throughput rate for Report 191 at FET Colleges ............................................... 79
2.5.4 Adult Education and training (AET) ................................................................................... 80
Bibliography .......................................................................................................................................... 84
List of Figures
Figure 1: Summary of methodologies per learning intervention ............................................................. 9
Figure 2: FP&M SETA Sub-sector relationship..................................................................................... 14
Figure 3: CTFL Sector Course Overlap ................................................................................................ 14
Figure 4: Forestry, Wood Products, Pulp and Paper and Furniture sectors course overlap ................ 15
Figure 5: Packaging, Printing, Publishing and Print Media sectors course overlap ............................. 15
Figure 6: Percentage Data Unknown in Fields of Interest .................................................................... 16
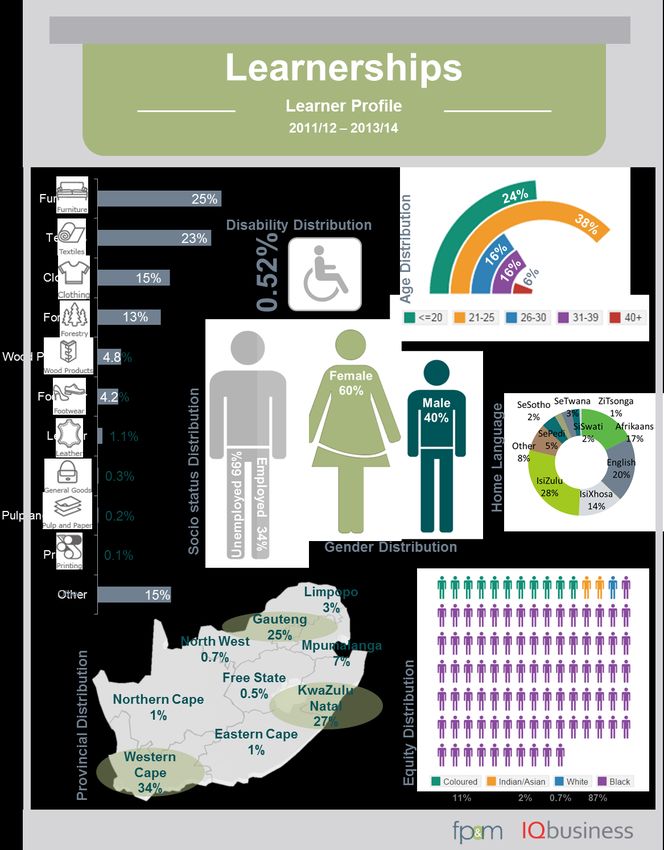
Figure 7: Infographic showing the profile of those enrolled for a learnership ....................................... 19
Figure 8: Learnerships - Geographical distribution by sector ............................................................... 20
Figure 9: Learnerships - Age distribution at enrolment date by sector ................................................. 20
Figure 10: Learnership - Socio-status by sector ................................................................................... 21
Figure 11: Learnership - Equity distribution by sector .......................................................................... 21
Figure 12: Learnerships - Home language by sector ............................................................................ 22
Figure 13: Infographic showing the profile of those enrolled for an apprenticeship ............................. 23
Figure 14: Apprenticeships - Geographical distribution by sector ........................................................ 24
Figure 15: Apprenticeships - Age distribution at enrolment date by sector .......................................... 24
Figure 16: Apprenticeships - Socio-status by sector ............................................................................ 25
Figure 17: Apprenticeships - Equity distribution by sector .................................................................... 25
Figure 18: Apprenticeships - Home language by sector ....................................................................... 26
Figure 19: Infographic showing the profile of those enrolled for a bursary ........................................... 27
Figure 20: Bursaries - Age distribution by province .............................................................................. 28
Figure 21: Bursaries - Gender by age interval at enrolment ................................................................. 28
Figure 22: Bursaries – Equity distribution ............................................................................................. 29
Figure 23: Bursaries - Gender distribution by equity ............................................................................ 29
Figure 24: Learnership commitment register by year ........................................................................... 31
Figure 25: Learnership commitment register total - by province and year ........................................... 31
Figure 26: Learnership commitment register total - by province........................................................... 32
Figure 27: Apprenticeship commitment register by year ...................................................................... 33
Figure 28: Apprenticeships commitment register - by province and year ............................................. 33
Figure 29: Apprenticeship commitment register total – by province ..................................................... 34
Figure 30: Bursaries commitment register - by year ............................................................................. 35
Figure 31: Bursary commitment register - by province and year .......................................................... 35
Figure 32: Bursaries commitment register total - by province .............................................................. 36
Figure 33: Employers who offer apprenticeships and learnerships rating the skills of graduate learners
.............................................................................................................................................................. 41
Figure 34: Employers’ rating of theory component of learnerships ...................................................... 41
Figure 35: Summary relevance of training to FP&M subsectors .......................................................... 43
Figure 36: Employment created by learnerships for the unemployed .................................................. 44
FP&M SETA Tracking and Tracing study of
Learnerships, Apprenticeships and Bursaries - 2014
5

Figure 37: Employer survey - Earnings potential for new hires, as well as experienced learners with a
learnership certificate ............................................................................................................................ 46
Figure 38: Increase in income from before to after completing the apprenticeship .............................. 46
Figure 39: Learner surveys – Improved communication skills .............................................................. 47
Figure 40: Employer survey - Improved chances of promotion according of learnership graduates ... 47
Figure 41: Learner Surveys: Impact of training initiatives on the motivation to further studies ............ 48
Figure 42: Employer Survey - Perceived improvement of learners’ attitude towards work .................. 49
Figure 43: Employer Survey - Influence of learnership on getting up to speed in the workplace ......... 50
Figure 44: Employer Survey - Influence of learning interventions on company productivity ................ 50
Figure 45: Employer Survey - Working hours during learnership and apprenticeships ....................... 51
Figure 46: Employer Survey - Stipend sufficiency as rated by learnership students............................ 52
Figure 47: Percentage of population group between the age of 18 and 24: Highest level of education
achieved ................................................................................................................................................ 58
Figure 48: Percentage 15-24 y/o who completed Gr7 and above, 2002 – 2012 .................................. 59
Figure 49: AET Pass and Throughput rates ......................................................................................... 59
Figure 50: Post-secondary education sector ........................................................................................ 60
Figure 51: FP&M Sub-sector reports .................................................................................................... 61
Figure 52: Summary of research activities ............................................................................................ 64
Figure 53: Data code classifications ..................................................................................................... 67
Figure 54: Type of educational institution attended by youth aged 18–24, by population group, 2002
and 2012 ............................................................................................................................................... 69
Figure 55: Unemployment rate by level of education ........................................................................... 71
Figure 56: Skills mismatch and little or no skills.................................................................................... 72
Figure 57: Percentage of the population aged 20 years and above who completed Grade 7 and above
by gender, 1995 to 2012 ....................................................................................................................... 72
Figure 58: Percentage of 15 to 24 year old youth who have completed Grade 7 and above, 2002-2012
 .............................................................................................................................................................. 73
Figure 59: Post-secondary education sector ........................................................................................ 73
Figure 60: CHET undergraduate throughput ........................................................................................ 74
Figure 61: Geographical spread of learning institutions ....................................................................... 74
Figure 62: Percentage of youth that attended an educational institution by population group and age,
2012 (StatsSA, 2013) ............................................................................................................................ 75
Figure 63: 16- to 18-year-olds attending educational institutions, 2002 to 2012 .................................. 75
Figure 64: Reason for non-attendance of educational institute ............................................................ 77
Figure 65: Problems experienced at schools ........................................................................................ 77
Figure 66: Percentage repeaters .......................................................................................................... 78
Figure 67: Average pass and throughput rates for NC(V) .................................................................... 79
Figure 68: Average pass and throughput rates or Report 191 ............................................................. 80
Figure 69: AET Pass and Throughput rates 2011 ................................................................................ 81

                                                                                                                   List of Tables
Table 1: FP&M SETA learner frequency per course – 2011/12 to 2013/14 ......................................... 17
Table 2: Completion rates of learners as recorded in MIS ................................................................... 40
Table 3: Completion rates of apprentices as recorded in MIS .............................................................. 41
Table 4: Sectors not offering any learnerships, apprenticeships or bursaries ...................................... 42
Table 5: Employment increase by sector (based on those who completed a learnership): ................. 44
Table 6: Employment increase by sector (based on those who completed the apprenticeship) .......... 45
Table 7: Average salary and income by sector ..................................................................................... 45
Table 8: Workplace conduct of learnership graduates once appointed ................................................ 49
Table 9: Average monthly stipend paid to learners on a learnership.................................................... 52
Table 10: Average monthly stipend for learnerships by sector ............................................................. 52

                                                                                                       FP&M SETA Tracking and Tracing study of
                                                                                                 Learnerships, Apprenticeships and Bursaries - 2014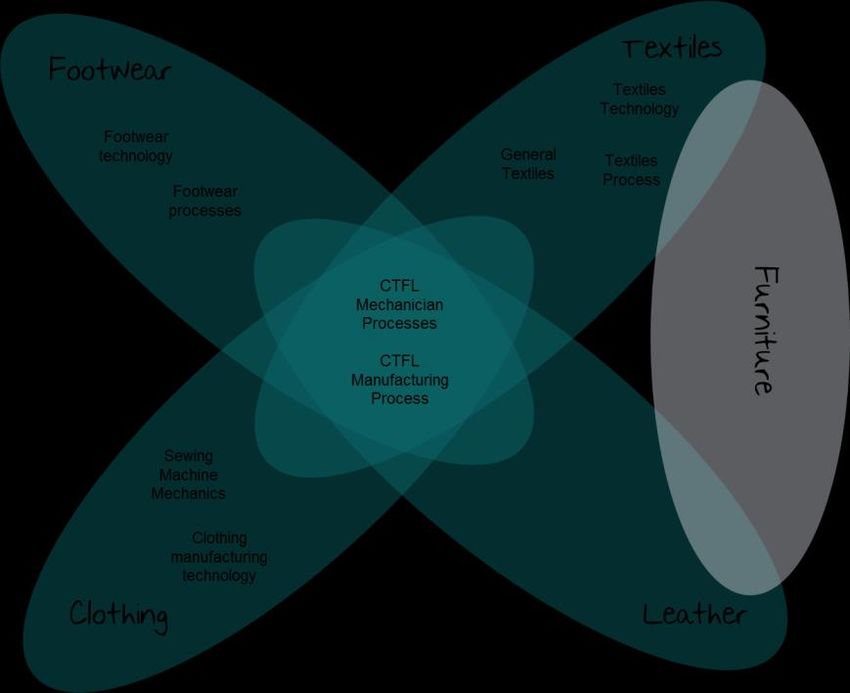
6

Table 11: Level of education, 18-24 and 25-34 .................................................................................... 68
Table 12: Breakdown of attendance per province ................................................................................ 76
Table 13: Reason for non-attendance of educational institute ............................................................. 76
Table 14: Number and percentage of students in public and private FET Colleges who wrote and
passed, by qualification type, from 2011 to 2012 ................................................................................. 78
Table 15: Number of public and private FET College students who entered, wrote and passed NC (V)
examination in 2012 .............................................................................................................................. 79
Table 16: Number of public and private FET College students who entered, wrote and passed the
Report 191 N1-N3 December 2012 examinations for engineering studies, by province in 2012 ...... 79
Table 17: Number of learners, educators and institutions in AET Centres by province: 2011 ............. 80
Table 18: Number of learners entered, wrote and passed, per province: 2011 ................................... 81

                                                                                             List of Acronyms
                                                                                           Abbreviation Description
AET                    Adult Education and Training
AOE                    African Economic Outlook
DHET                   Department of Higher Education and Training
DPE                    Department of Public Enterprises
DoL                    Department of Labour
FET                    Further Education and Training
GHS                    General Household Survey
HRD                    Human resource development
IPAPA                  Industrial Policy Action Plan
LIC                    Low income countries
NAMB                   New policy on Artisan Development & Strengthening of National Artisan Moderation
                       Body
NEET                   Not in employment, education or training
NDP                    National Development Plan
NGP                    New Growth Path
NFAS                   National Student Financing Scheme
NQF                     National Qualifications Framework
MIC                    Medium income countries
MOA                    Memorandum of agreement
MoU                    Memorandum of understanding
PIVOTAL                Professional, Vocational, Technical and Academic Learning (PIVOTAL) Programmes;
SABC                   South African Broadcasting Corporation
SAQA                   South African Qualifications Authority
SIC                    Standard Industrial Classification
SDA                    Skills Development Act
SETA                   Sector Education and Training Authority
SMME                   Small, Micro and Medium Enterprise
SOC                    State owned company
WSP                     Workplace Skills Plan

                                                                                              FP&M SETA Tracking and Tracing study of
                                                                                         Learnerships, Apprenticeships and Bursaries - 2014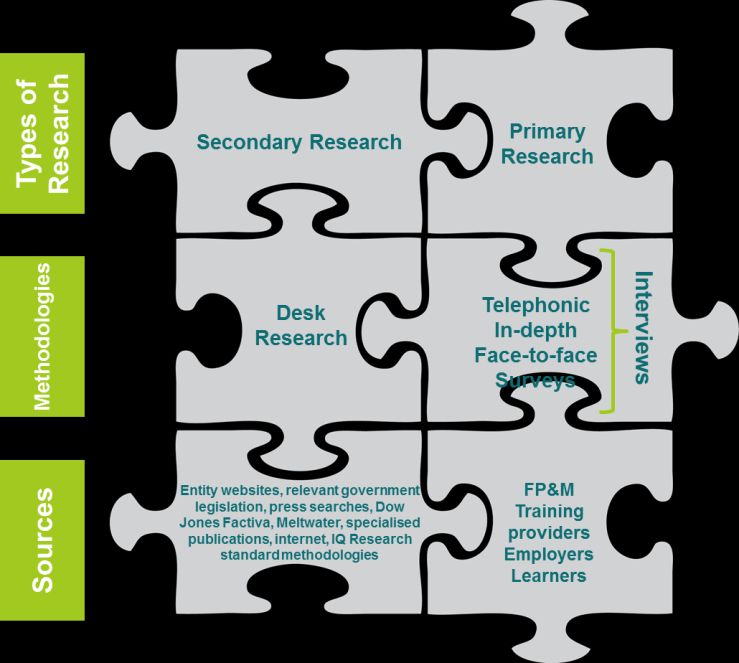
7
Executive Summary
Introduction and aim of the study
The Fibre, Processing and Manufacturing (FP&M) SETA was established by the Minister of Higher
Education and Training on 1 April 2011. The FP&M SETA is a result of the amalgamation of the
Clothing, Textiles, Footwear and Leather (CTFL) SETA, Forest Industries Education and Training
Authority (FIETA) and the Printing, Packaging and Publishing sectors of the Media, Advertising,
Publishing, Printing and Packaging (MAPPP) SETA. The FP&M SETA facilitates skills development in
the following sub-sectors: Clothing, Footwear, Forestry, Furniture, General Goods, Leather,
Packaging, Print Media, Printing, Publishing, Pulp and Paper, Textile and Wood.
The FP&M SETA commissioned a Tracking and Tracing study that would empirically examine the
impact of Learnerships, Apprenticeships and Bursaries on learners, and determine the extent to which
these programmes are achieving their objectives. This project served to understand, explore and
document key features, trends, challenges and the impact of these three skills interventions in the
different FP&M sub-sectors. This project was undertaken to assist in the further development of a
sustainable skills development strategy for the FP&M SETA.
The objectives of the study can be summarised in terms of four key aspects, with their related sub-
objectives. These include:
a) Report on the profile of learners enrolled for learnerships, apprenticeships and bursaries
incentivised by the FP&M SETA for the financial years 2011/12 to 2013/14.
Provide an understanding of the characteristics of the learner in terms of demographics, skills,
qualifications and employment profile (employed versus unemployed).
b) Ascertain the geographic distribution of SETA-funded projects / activities.
c) Determine the success of these learning interventions in creating the desired impact.
Determine the rate for completion of learnerships and apprenticeships.
Evaluate the alignment of the skills provided with industry needs.
Determine the impact of the training initiatives on the student, with specific reference to
understanding the absorption of learners into the labour market and the economic value that
is created.
Determining the main impact of these training interventions on the employers in the FP&M
subsectors.
Highlighting challenges and making suggestions for improvements.
d) Assess the career path opportunities for learners within the FP&M SETA sub-sectors
through understanding key trends and challenges in the sub-sectors.
The report will be structured around these main objectives, and a summary of the results will be
presented in chapters addressing each of these objectives.
FP&M SETA Tracking and Tracing study of
Learnerships, Apprenticeships and Bursaries - 2014
8
Communication strategy
IQ Business and FP&M SETA worked together to create a communication strategy for the Tracking
and Tracing Study. The main purpose of the communication strategy was to ensure a consistent
approach when communicating to both FP&M internal and external stakeholders. The communication
strategy outlined all stakeholders involved in the project, the regularity with which they were to receive
the communications, the type of communication, including the party responsible for distributing the
message.
Methodology
As mentioned, this report addresses each of the main objectives in subsequent chapters and each of
these chapters provide a detailed methodology, applicable to the objective addressed. This section
provides an overview of the methodology by describing the stakeholders that were targeted, and the
different types of research designs used.
Stakeholders
The stakeholders identified for this study were the FP&M SETA, the learners (apprenticeships and
learnerships), the employers, as well as the training providers. There is an overlap of training
providers and employers as a number of employers are also training providers. There are various
ways of classifying learners; for example, according to their employment status on entering the
training programme or after completion of the training. Learners could be classified as employed, self-
employed or unemployed. The learner stakeholder group can also be classified according to status of
training; either completed, still studying or terminated.
Methodologies
To address the first objective, of understanding the characteristics of learners, data received from the
FP&M Management Information System (MIS) was analysed and reported on. This data contained
information for learnership and apprenticeship students in terms of many demographic variables, and
a few of interest, such as age and sector, were added using ID numbers or cross-referencing South
African Qualifications Authority (SAQA) codes with sector information. A total of 6 207 learners were
considered to fall within scope for this analysis, having either enrolled during 2011/12 to 2013/14, or
were reasonably expected to be studying during this period. Bursary data is not housed inside the
MIS, and a separate spreadsheet, containing fewer demographic variables, was used to analyse
bursary students.
The second objective of the study was to understand the geographic spread of the FP&M SETA
funding. This objective was met by analysing the commitment register, which keeps a record of all
approved funding.
To address the objective of determining the success and impact of
the learning interventions, both qualitative and quantitative research
methodologies were employed to contact students, employers and
training providers.
The two main qualitative methodologies used in this study were:
Focus groups: In this study, two mini-focus groups were conducted; one with employed
graduate learners, the other with unemployed graduate learners. Recruitment of respondents
for these groups was limited to all who live geographically close to the research venue in
Johannesburg. It was possible to recruit three employed and two unemployed learners, within
the timeframe of this study.
Personal interviews: Personal interviews were conducted with employers and training
providers in many of the FP&M sub-sectors. A total of ten employer interviews were possible
in the timeframe of this study.
FP&M SETA Tracking and Tracing study of
Learnerships, Apprenticeships and Bursaries - 2014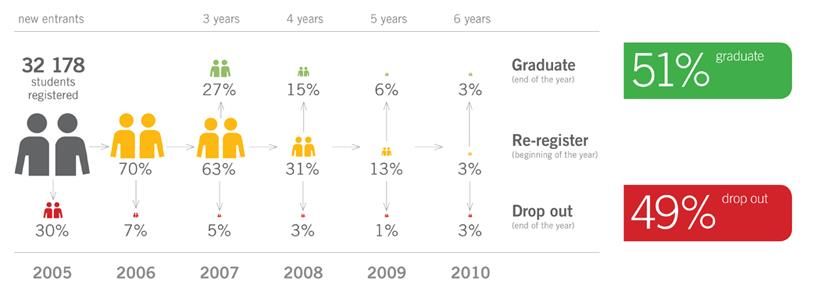
9
Two forms of quantitative research were conducted: telephone surveys with learners and
online surveys with employers.
Telephone surveys with learners: A structured questionnaire was created with the aim of
determining the impact of learnerships and apprenticeships on employment and other aspects
of the learners’ lives.
Trained interviewers, fluent in a number of vernacular languages, conducted telephone
interviews with learners for whom contact details were available. Contact details were
available for approximately 24% of the total population. A final sample of 303 learnership
students and 81 apprentices were achieved. This represents a 25% response rate for the
learnership sample and 28% for the apprenticeship sample. Full analysis of the findings of
these telephone surveys are provided in separate reports; namely “The Voice of the
Learner” and “The Voice of the Apprentice”. This report provides a summary of results
from these two reports.
Online survey with employers: A web-based survey was created that would allow
employers to provide their opinions on the value of the learning interventions. The survey
focused on aspects such as training practices, absorption of learners into the market and
value perceived. A final sample of 259 employers was achieved, with 71 employers rating
learnerships, 67 rating apprenticeships and 23 rating bursaries. A further 121 employers did
not offer any of these training initiatives over the last few years.
The Tracking and Tracking study focused on three learning interventions; Learnerships,
Apprenticeships and Bursaries. Figure 1 presents a summary of how the above methodologies
relate to the three learning interventions in this study. No contact details were available for bursary
students and therefore they were not contacted directly.
Learnerships Apprenticeships Bursaries
Profile as per Profile as per Profile as per
MIS database MIS database MIS database
Impact as per
Impact as per
survey and focus
survey with N/A
groups with
apprentices
learners
Impact as per Impact as per Impact as per
employers survey employers survey employers survey
and in-depth and in-depth and in-depth
interviews interviews interviews
Figure 1: Summary of methodologies per learning intervention
The final objectives were addressed through secondary research (also known as desk research). This
includes the summary, collation and synthesis of existing research. In the case of the Tracking and
Tracing study, secondary research was utilised to gain further insights into the 13 industries in which
FP&M SETA operates. Various industry analyst commentaries and discussion papers were
researched in addition to recent news articles on the relevant industries. This provided an insight into
the opportunities and challenges that these industries are currently facing. The secondary research
was also used in the preliminary stages of the research to inform some of the research design.
An analysis of the Management Information Database (MIS) shows that many of the courses offered
by the FP&M SETA are very popular whilst there is hardly any take-up for others. The most popular
FP&M SETA Tracking and Tracing study of
Learnerships, Apprenticeships and Bursaries - 201410
course offered is the National Certificate: Clothing, Textiles, Footwear and Leather
Manufacturing Process (43%), followed by a two national certificate in furniture making (SAQA ID
49091 at 12% and 49105 at 7%). On the other hand Knitting Machine Mechanician and Technical
Dyer-Finisher are courses where only one student is listed as having enrolled over the last three
years.
The commitment registers, as well as the profile of enrolled students, show the most training is
offered in Gauteng, KwaZulu Natal and the Western Cape. Learnerships are training initiatives mostly
taken up by young black South African men or women. While Apprenticeships offer opportunities to a
wider range of ethnic and age groups, it is mostly men who enrol for these (88%). Bursaries students
are mostly black, female South Africans between the ages of 21 and 25, living in the Western Cape or
Gauteng.
A combination of sources, such as data from the MIS system as well as the surveys conducted,
shows that a fair estimation of completion rates for learnerships is between 70-80% and between 40-
50% for apprentices. Apprenticeships do take longer to complete than learnerships, typically 3 to 4
years, and would naturally have a higher dropout rate.
One objective of a SETA is the continuous improvement of education at workplaces in order to
address the mismatches and shortages of skills in the most efficient manner. This study has found
that among employers who offer training, there is high agreement that the skills of graduate learners
meet the requirements of the workplace. In addition, qualitative interviews highlight the role that
training initiatives play in improving the basic levels of literacy and numeracy.
Employers and learners are positive about the value of learnerships, apprenticeships and bursaries.
These skills interventions create multi-skilled employees who contribute positively to the productivity
of the companies who employ them. Unfortunately employers can not employ all learners trained, due
to economic and other pressures. A positive outcome is that trained employees are now exposed to
the market, which benefits smaller companies who cannot afford, or do not qualify to train employees.
The learner surveys showed that unemployment dropped from 72% to 44% among those unemployed
on entering the learnership program. Those still unemployed remain positive about their future
prospects. The employment statistics for apprenticeships are even more impressive with 71% of the
unemployed, who graduated from apprenticeship programmes, having found employment at the time
of the survey. Data gathered through discussions with employers in different sectors revealed that
employers are cautions about hiring as a result of economic conditions but that employee numbers
remain fairly stable. Survey results confirm that employee numbers are stable in many sectors, with
the most opportunities for learners coming from growth in staff numbers in Clothing, Textiles,
Footwear, Furniture and Forestry. While the Printing and Publishing sectors report fairly stable
employee numbers, with limited growth opportunities, 50% of Print Media companies report a decline
in staff numbers.
This study has found that the earnings of a learner increases on completion of training with even
greater increases to be expected once more work experience has been gained. On average,
employees with a learnership earned R1 400 more per month after completion of their training while
apprentices earned, on average, more than double what they use to at R9 810 per month.
In addition to the above mentioned benefits, students show great improvement in personal
development. Learnership graduates who took part in the focus groups expressed their gratitude for
the improved soft skills, financial skills, attitude towards life, confidence and self-esteem that they saw
upon completing their learnership. The results from the learner and employer surveys also confirmed
that students leave the programs with better communication skills and improved self-esteem.
FP&M SETA Tracking and Tracing study of
Learnerships, Apprenticeships and Bursaries - 201411
Employers and learners do face challenges during the course of training, and have made suggestions
for improvements. They would however greatly regret not having access to these training initiatives,
and overall consider it worth the effort. Learners are challenged by a low stipend and some find it
difficult to afford food and transport during their training. Employers agree that the funding is too low
and attribute some of the dropout to this. Some learners question the long hours they work during
their practical training and felt a few employers might misuse the learnership to obtain cheap labour. A
critical concern for many learnership graduates is the fact that they have not received their certificates
on completion, even as much as three years later. Steps are already underway to address this
concern.
Employers are challenged by slow and inefficient communication from the FP&M SETA as well as by
slow grant disbursement. The new MIS system is noted as being an improvement yet many more
recommendations are made for improving the application process.
Recommendations
The MIS system provides process improvements and employers are seeing the value. The
FP&M SETA should consider increasing the speed at which it is adopted as to move away
from using the old and the new system simultaneously. The SETA would benefit from a
dedicated data manager tasked with ensuring an effective change management process. A
data manager could also review the current processes for collecting and holding student data
in light of the new PoPI (Protection of Personal Information) act. The SETA might be at risk of
breaching the act.
While the increased adoption of the MIS system would address some of the concerns around
the certification of completed learners, the SETA should consider further investigation of the
process flow to highlight any additional areas that could be hindering the process. Learners
who are not employed after the learnership might lose touch with the employer after leaving
the company and the SETA should consider a system of delivering the certificates to learners
directly, as opposed via the employers, or, at the very least, following up directly with learners
on the receipt of their certificates.
The SETA might consider investigating the reasons why certain courses have low
attendances, and whether it is economically advisable to continue to offer these.
The SETA could benefit from improving the transparency of grant approvals
Small and rural enterprises could benefit from additional support. While many are ignorant of
the process, others simply do not qualify. They do however operate in areas where possible
learners could benefit greatly from an opportunity at training.
A review of internal processes could be considered, where an improvement would result in a
reduction in administration. Likewise, a review of current communication structures could
results in improved communication with stakeholders.
FP&M SETA Tracking and Tracing study of
Learnerships, Apprenticeships and Bursaries - 201412
Chapter 1
Profile of Learners Enrolled for
Learnerships, Apprenticeships and Bursaries
1. Objective
The purpose of this chapter is to report on the profiles of enrolled learners for learnerships,
apprenticeships and bursaries incentivised by the FP&M SETA for the period 2011-2013. This
includes details of characteristics of the learners regarding demographics and qualifications.
2. Methodology
2.1 Process of compiling data
2.1.1 Compiling Data for Learnerships and Apprenticeships
The FP&M SETA supplied two datasets from their Management Information System
(MIS), containing 23 209 and 18 131 entries respectively. The datasets included learners entered
from as far back as the year 2000, and therefore needed to be merged and cleaned before
commencement of analysis. After merging the datasets, duplicate values were removed by creating a
unique variable, which combined ID number and SAQA ID number. Thereafter 19 632 unique entries
remained in the single, new dataset.
This study is limited to students studying in the financial years of 2011/12, 2012/13 and 2013/14. In an
attempt to limit the number of cases to the appropriate years of focus, a unique variable was created,
using the month and year of study to create a financial year indicator spanning from April to March of
each year. Learnership students who enrolled in the financial year of 2010/11 were included, as they
could foreseeably still have been studying and/or enrolled in 2011/12. Likewise, apprentices who
started their studies in 2008/09 were included, as they would still form part of the 2011/12 group.
The study focuses only on the apprenticeships, learnerships and bursaries skills programmes. The
data received from the FP&M SETA had to be limited to these training interventions only. However,
no field existed in the data to classify intervention type, so the SAQA ID field was used to create this
variable. Skills programmes and other courses that fall outside of the scope of this study were deleted
from the dataset. The following training programmes were removed from the data, since it was
concluded that these training interventions are not in the FP&M SETA’s subsectors:
General Education and Training Certificate: Business Practice
Further Education and Training Certificate: Contact Centre Operations
National Certificate: New Venture Creation (SMME)
A total number of 6 290 learners remained after the above procedures were carried out. These
learners could be considered as “in scope”. However, a few duplicate cases where the same learners
were enrolled for multiple courses in the same year were identified and excluded. Out of 6 290
learners remaining in the dataset at this stage, 253 (506 entries) learners appeared twice and 12 (36
entries) learners appeared three times. This is a duplicate error rate of (506+36) / 6290 = 8.6%. It was
decided to keep learners in the dataset who enrolled for different courses in different years, but not if
the learner enrolled for multiple courses in the same financial year. Therefore, 83 duplicate students
were removed, leaving a final number of 6 207 learners for analysis in this study.
FP&M SETA Tracking and Tracing study of
Learnerships, Apprenticeships and Bursaries - 201413
2.1.2 Compiling Data for Bursaries
Bursary data was received separately from the FP&M SETA, as it is not kept in the MIS system. The
excel spread sheet consisted of four sheets namely:
Outcome 4.2.1: middle and high level skills needs are identified and addressed in all sectors
(workers learning programmes entered - excluding artisans - workers)
o 171 entries
Outcome 4.2.1: middle and high level skills needs are identified and addressed in all sectors
(workers learning programmes certificated - excluding artisans - workers)
o 20 entries
Outcome 4.2.1: middle and high level skills needs are identified and addressed in all sectors
(unemployed learning programmes entered - excluding artisans - workers)
o 776 entries
Outcome 4.2.1: middle and high level skills needs are identified and addressed in all sectors
(all learning programmes entered - excluding artisans - workers)
o 127 entries
These sheets were combined to add up to 1 094 learners from four sheets. 32 learners were
excluded, which included 22 whose commencement field was not populated, and ten who completed
their course between 2007 and 2010. There were 1 062 learners in the data set remaining.
In order to find duplicate values, the ID number, year and learning institute was combined and 46
duplicates were found. 23 line items were manually deleted to bring the total learners in the bursary
data to 1 039 for the period 2011-2014. A summary of these duplicates can be found in Appendix 2.
2.1.3 Fields of interest for analysis
The data obtained from the MIS contained coded information in the following fields: equity, province,
disability status, home language, gender and socio-economic status. See Appendix 1 for a list of all
codes. 191 learners with the equity code ‘BI’ was assumed to be ‘BL’ which refers to ‘Black: Indian /
Asian’. The province codes ‘0’, ‘15’ and ‘X’ were assumed to be undefined. Industry, intervention,
province and equity status classifications were supplemented by cross referencing SQMR data with
MIS data.
Age at time of enrolment was calculated by taking into account the enrolment date of learners. (I.e. if
enrolled in 2011, current age was reduced by three years in order to calculate age at time of
enrolment). The age at time of enrolment is henceforth referred to simply as “age”.
A variable of great significance to the study is that of industry classification. This variable was not
provided in the MIS data received from the FP&M SETA, and this field was also created by using the
SAQA code as a reference point. 43% of learners could only be classified as Clothing, Textiles,
Footwear and Leather (CTFL) when using this method. An attempt was made to further classify this
43% into a sector, by attempting to link an employer to a learner and then cross-reference the
employer with a sector using a number of other FP&M databases. It was possible to further classify
31% into a sector based on the employer they are linked to.
Classifying the learners based on qualification might not be a 100% accurate due to the overlap
between the different subsectors. Figure 2 visually depicts how the FP&M SETA sub sectors overlap.
The sectors form three large clusters, with the furniture sector bridging two clusters and the other
clusters being very closely related. The centre cluster is related to both of the other clusters.
FP&M SETA Tracking and Tracing study of
Learnerships, Apprenticeships and Bursaries - 201414
Figure 2: FP&M SETA Sub-sector relationship
Figures 3 to 5 show the overlap of sectors, as well as the SAQA courses and the sectors into which
they are formally classified by the FP&M. It is based on this classification that the majority of learners
were allocated into a sector. The inter-relatedness of the sectors could mean that a learner is doing a
course classified into a specific sector, whilst in reality working in another related sector.
Clothing, Textiles, Footwear and Leather sectors
Figure 3: CTFL Sector Course Overlap
Forestry, Wood Products, Pulp and Paper and Furniture sectors
FP&M SETA Tracking and Tracing study of
Learnerships, Apprenticeships and Bursaries - 201415
Figure 4: Forestry, Wood Products, Pulp and Paper and Furniture sectors course overlap
Packaging, Printing, Publishing and Print Media sectors
Figure 5: Packaging, Printing, Publishing and Print Media sectors course overlap
FP&M SETA Tracking and Tracing study of
Learnerships, Apprenticeships and Bursaries - 201416
2.1.4 Missing data in variables
The variables of interest that were analysed were not all fully populated in the MIS system, and the
analysis performed in this chapter rebases the percentages to exclude missing data. The percentage
of missing data for each variable is presented in the figure below.
Percentage data unknown
52% 51% 50%
32% 32%
12%
Industry Equity status Socio economic Home language Disability status Province
classification as status
CTFL
Figure 6: Percentage Data Unknown in Fields of Interest
2.2 Analysis of data
Once cleaned using the process described above, the data was analysed in Excel, using pivot tables
to create frequency distributions and cross tabulations of the variables of interest.
Fields of interest include:
Equity distribution: ethnic group of the learner
Socio-economic status: employed or unemployed
Disability status: being disabled, this includes sight - even with glasses
Age at time of enrolment: age was calculated off of the learner’s ID number and worked
back to reflect his/her age at the time they entered the course
Home language
Gender
Geographical distribution
Intervention
Sub-sector
Qualification
Learnerships and apprenticeships could be analysed in terms of all of the above fields, while only a
few fields were available for the bursaries students. Each of the learning interventions were analysed
separately and the profile of learners are presented graphically in the next section.
FP&M SETA Tracking and Tracing study of
Learnerships, Apprenticeships and Bursaries - 201417
3. Results: Description of the population
FP&M SETA data was analysed subsequent to the procedure described in the preceding section. The
proceeding section discusses learnerships, apprenticeships and bursaries learners’ characteristics, in
order to provide a comprehensive description of the population.
1
A one page infographic summary showing the profile of learners who were assumed to be enrolled in
the 2011/12, 2012/13 and 2013/14 financial years, is included for learnerships, apprenticeships and
bursaries. In addition, a detailed breakdown of geographical, age, socio-status, equity and home
language distribution is also included in this section.
3.1 Summary
The most popular course offered by FP&M SETA is the National Certificate: Clothing, Textiles,
Footwear and Leather Manufacturing Process (43%), followed by two national certificates in furniture
making (SAQA ID 49091 at 12% and 49105 at 7%). Some courses, such as Knitting Machine
Mechanician and the Technical Dyer-Finisher have only one student listed on the MIS system.
The profile of students enrolling for a learnership shows that students are mostly black South Africans
under the age of 25. The gender ratio is 60:40 female to male, with most students completing their
learnerships in Gauteng, KwaZulu-Natal or the Western Cape. The MIS data records 66% as
unemployed on entering their learnership. Apprentices are more likely to be from a range of ethnic
groups and, although most are still aged 25 or younger, are also more likely than learnerships to
include older learners. The gender split is skewed towards males with a ratio of 12:88 women to men.
Apprentices are more likely to be employed at the time of enrolment than learnership students (55%
employed). Bursaries students are mostly black, female South Africans between the ages of 21 and
25, living in the Western Cape or Gauteng.
3.2 Qualifications
The table below lists the SAQA qualifications that are present in the learner data as disused in the
preceding section. 43% of learners entered for the 58227 National Certificate course in Clothing,
Textiles, Footwear and Leather Manufacturing Process.
Table 1: FP&M SETA learner frequency per course – 2011/12 to 2013/14
SAQA ID SAQA qualification Frequency Frequency (%)
National Certificate: Clothing, Textile, Footwear and Leather
58227 2665 42.94%
Manufacturing Processes
49091 National Certificate: Furniture Making: Wood 747 12.03%
49105 National Certificate: Furniture Making: Wood 442 7.12%
General Education and Training Certificate: Clothing Manufacturing
50584 246 3.96%
Processes
General Education and Training Certificate: Wood Products
49082 222 3.58%
Processing
11263 National Craft Diploma: Lithography (Paper Section) 216 3.48%
11271 National Craft Diploma: Rotary Offset Machine Minding 170 2.74%
50225 General Education and Training Certificate: General Forestry 169 2.72%
21489 National Certificate: Lumber Drying 168 2.71%
11243 National Craft Diploma: Electronic Origination 123 1.98%
1
A visual representation of information or data, e.g. as a chart or diagram.
FP&M SETA Tracking and Tracing study of
Learnerships, Apprenticeships and Bursaries - 2014You can also read