Apprenticeships in London - Boosting Skills in a City Economy with Comment on Lessons from Germany - OECD
←
→
Page content transcription
If your browser does not render page correctly, please read the page content below

Apprenticeships in London
Boosting Skills in a City Economy with Comment on Lessons

from Germany

                             skills.oecd: building the right skills and turning them into better jobs and better lives
OECD LEED Programme: Local skills strategies

    Apprenticeships in London:
 Boosting skills in a city economy

                Stephen Evans

With comment on lessons from Germany

                Gerhard Bosch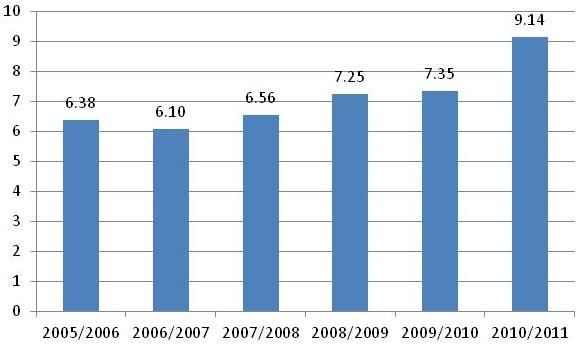
ABOUT THE OECD

     The OECD is a multi-disciplinary inter-governmental organisation of 34 member countries which
engages in its work an increasing number of non-members from all regions of the world. The
Organisation‟s core mission today is to help governments work together towards a stronger, cleaner, fairer
global economy. Through its network of 250 specialised committees and working groups, the OECD
provides a setting where governments compare policy experiences, seek answers to common problems,
identify good practice, and co-ordinate domestic and international policies.

      The OECD member countries are: Australia, Austria, Belgium, Canada, Chile, the Czech Republic,
Denmark, Estonia, Finland, France, Germany, Greece, Hungary, Iceland, Ireland, Israel, Italy, Japan,
Korea, Luxembourg, Mexico, the Netherlands, New Zealand, Norway, Poland, Portugal, the Slovak
Republic, Slovenia, Spain, Sweden, Switzerland, Turkey, the United Kingdom and the United States. The
European Commission takes part in the work of the OECD. For more information on the OECD, please
visit www.oecd.org/about.

                                                   ABOUT LEED

      The OECD Programme on Local Economic and Employment Development (LEED) has advised
governments and communities since 1982 on how to respond to economic change and tackle complex
problems in a fast-changing world. Its mission is to contribute to the creation of more and better quality
jobs through more effective policy implementation, innovative practices, stronger capacities and integrated
strategies at the local level. LEED draws on a comparative analysis of experience from the five continents
in fostering economic growth, employment and inclusion. For more information on the LEED Programme,
please visit www.oecd.org/cfe/leed.

This work is published on the responsibility of the Secretary-General of the OECD. The opinions expressed and
arguments employed herein do not necessarily reflect the official views of the Organisation or of the governments of
its member countries.

© OECD 2012

You can copy, download or print OECD content for your own use, and you can include excerpts from OECD
publications, databases and multimedia products in your own documents, presentations, blogs, websites and teaching
materials, provided that suitable acknowledgment of OECD as source and copyright owner is given. All requests for
public or commercial use and translation rights should be submitted to rights@oecd.org. Requests for permission to
photocopy portions of this material for public or commercial use shall be addressed directly to the Copyright
Clearance Center (CCC) at info@copyright.com or the Centre français d'exploitation du droit de copie (CFC)
contact@cfcopies.com.
INTRODUCTION - 3

                                                        TABLE OF CONTENTS

INTRODUCTION ......................................................................................................................... 5
   Overview.................................................................................................................................... 5
   Authors and acknowledgements ................................................................................................ 6
SECTION 1: OVERVIEW OF NATIONAL VOCATIONAL SYSTEMS AND THE
APPRENTICESHIP MODEL ....................................................................................................... 7
   Overview of national VET systems ........................................................................................... 7
   Aiding the school to work transition.......................................................................................... 8
SECTION 2: SETTING THE EMPLOYMENT AND SKILLS CONTEXT IN THE UK
AND LONDON .......................................................................................................................... 11
   The UK‟s skills challenges ...................................................................................................... 11
   London‟s unique labour market ............................................................................................... 12
   A changing training policy context .......................................................................................... 14
SECTION 3: APPRENTICESHIPS IN ENGLAND AND THE LONDON CAMPAIGN ........ 17
   Reviving apprenticeships ......................................................................................................... 17
   The London Apprenticeship Campaign ................................................................................... 20
   Outcomes ................................................................................................................................. 21
   Governance structure ............................................................................................................... 23
SECTION 4: HOW THE LONDON CAMPAIGN DELIVERED ............................................. 25
   Public sector contribution ........................................................................................................ 25
   Public procurement .................................................................................................................. 25
   Growth sectors and engaging employers ................................................................................. 26
   A changing age profile............................................................................................................. 28
   Focus on quality: raising the level of apprenticeships ............................................................. 29
   Apprenticeship completion and progression............................................................................ 30
   Critical response to the London Apprenticeship Campaign .................................................... 31
SECTION 5: THE APPRENTICESHIP FRAMEWORK IN GERMANY ................................ 34
   Good practice in strengthening the apprenticeship framework in Germany ........................... 34
BIBLIOGRAPHY ....................................................................................................................... 40

Tables

   Table 1.           A heuristic typology of VET systems of EU15 countries ..................................... 8
   Table 2.           The UK‟s qualification profile ranking, forecast and ambition ........................... 11
   Table 3.           Qualifications of the UK workforce, 2008-2020 ................................................. 12
   Table 4.           Employment projections by sector in London (in thousands) ............................. 13
   Table 5.           Apprenticeship starts by English region .............................................................. 22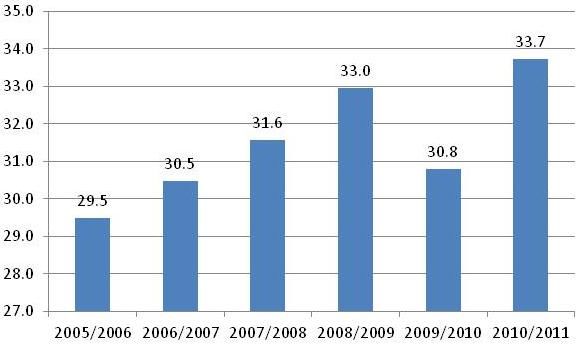
4 - INTRODUCTION

Figures
  Figure 1.         Increase of youth unemployment rates in percentage points, 2008 to 2011.......... 9
  Figure 2.         London workforce skills structure relative to the UK ......................................... 13
  Figure 3.         Numbers of apprenticeship starts in London and England .................................. 22
  Figure 4.         Apprenticeship starts in London as percentage of total apprenticeships in England                                        23
  Figure 5.         Governance of apprenticeship delivery in London.............................................. 24
  Figure 6.         Apprenticeship starts as a proportion of employees, London versus England .... 27
  Figure 7.         Apprenticeship starts by age in London, 2005 to 2011 ....................................... 28
  Figure 8.         Share of Advanced Apprenticeship (Level 3) in London, 2005 to 2011 ............. 30

Boxes

  Box 1. Apprenticeship typologies .............................................................................................. 8
  Box 2. Status changes as young people move from education to work ................................... 10
  Box 3. English apprenticeship levels ....................................................................................... 19
  Box 4. Apprentice wages and training contributions ............................................................... 20
  Box 5. Triple role of London boroughs ................................................................................... 25
  Box 6. Leveraging the public supply chain ............................................................................. 26
  Box 7. Matching employers and apprentices ........................................................................... 31
  Box 8. How to generate more apprenticeships in a large city economy: success factors
         from London ................................................................................................................ 33
  Box 9. Ability of firms to adapt to change: better in market-led or consensus-led systems? . 35
  Box 10. Training Consensus between social partners at the local level, North-Rhine ...............
          Westphalia .................................................................................................................. 37
  Box 11. Success factors from the German model .................................................................... 38
INTRODUCTION - 5
INTRODUCTION
Overview
The London Apprenticeship Campaign was launched in 2010 to boost the number of apprentices
in London, in particular at higher level apprenticeships, and is one of many recent attempts to
revitalise and reinvent apprenticeships in OECD countries. It was developed as part of an ongoing
policy focus on how best to tackle long-standing skill shortfalls in the city at the intermediate level,
shortages which have been constraining employment, social opportunity and productivity. A critical
element of the campaign was to establish more apprenticeship frameworks outside the traditional
apprenticeship sectors and in growth sectors which dominate the local economy, such as finance. As a
result of the initiative, the number of apprentices in London doubled from 2009-10 to 2010-11 to reach
over 40 000.
A remarkable innovation evident in the London campaign, delivered in keeping with the British
market-based approach to apprenticeships, has been supplementing the supply-side approach with a
demand-side policy by working closely to engage more private sector employers. London‟s local
authorities and political figures, such as the Mayor, have also played a strong role in raising
apprenticeship numbers by increasing public sector commitment to apprenticeships, and in the process
showing leadership to local employers. Emphasis has been placed on maximising the public sector
supply chain as a means to take on more apprentices, seeking to compensate to some extent for the
weak role of employers‟ organisations and unions. The campaign serves as an example of a sub-
national approach to skills policy taken at city level. The model, however, has faced criticism for
producing low quality apprenticeships and acting as a mechanism for incumbent employee training
rather than one to ease the transition for young people from education to the workplace.
Germany can provide good learning lessons on putting in place effective apprenticeship policy
and practice at the national, regional and local level. There has been transitioning to broader
apprenticeships occupations, moving away from tightly defined trades and specialisations, as well as
providing training in joint core and occupation specific competences. Broadening occupations
increases workers‟ internal and external flexibility, thereby enabling more mobility and employability
over working life. The German apprenticeship system also supplements initial training with
opportunities for standardised career advancement training to enable apprentices to advance to higher
grades, and over time this has ensured a greater mix of management types. Social partners play an
active role through national, regional and local training pacts and these have served to keep employers
committed to taking on apprentices and have also proved to be particularly effective in maintaining
apprenticeship numbers during the economic crisis. Apprenticeships are highly valued by German
employers and by ensuring that apprenticeships contain real career possibilities, many capable and
talented young people are attracted to the apprenticeship stream as a first choice.
This paper is divided into five sections. Section 1 gives an overview of national VET and
apprenticeship typologies in some OECD countries, and the impact of the apprenticeship model on
youth employment. Section 2 outlines the UK and London labour market context and the changing
nature of the training and skills policy debate. Section 3 discusses the England apprenticeship model
and introduces the London Apprenticeship Campaign, looking at its outcomes and governance
framework. In Section 4 how the campaign delivered is looked at, discussing critical components, and
it addresses common criticisms and how these have been overcome. It provides key learning points,
and concludes with a critical response from a German perspective. Finally, Section 5 concludes by
looking at a number of good practice examples from Germany in strengthening the apprenticeship6 - INTRODUCTION
framework, considering improvements to work organisation and broadening apprenticeship
occupations, ensuring the commitment of employers and the role of national, regional and local
training pacts, and putting in place measures to ensure that apprentices are kept on in difficult
economic times.
Authors and acknowledgements
This report has been written by the Local Economic and Employment Development (LEED)
Programme of the Organisation for Economic Co-operation and Development (OECD) as part of the
project on “Local Skills Strategies”. Stephen Evans contributed Sections 2, 3 and 4. Mr Evans is
Business Development Director at Working Links and former Director of Employment and Skills at
the London Development Agency. Professor Gerhard Bosch contributed Sections 1 and 5. Professor
Bosch is Director of the Institute for Work, Skills and Training at the University of Duisburg-Essen,
Institut Arbeit und Qualifikation (IAQ), Duisburg. The report was prepared under the supervision of
Lucy Pyne of the OECD Secretariat, with input by Francesca Froy. The authors wish to extend their
thanks to Michela Meghnagi and Jonathan Barr and other team members from the OECD Secretariat
for their assistance with the report.SECTION 4: COMPARING VET AND APPRENTICESHIP SYSTEMS AND GOOD PRACTICE INITIATIVES IN GERMANY - 7
SECTION 1: OVERVIEW OF NATIONAL VOCATIONAL SYSTEMS AND THE
APPRENTICESHIP MODEL
Overview of national VET systems
Activities to drive up the number of apprenticeship in the UK and London reflect a renewed interest in
apprenticeships across OECD countries. Apprenticeships are considered a skilling and up-skilling
mechanism to tackle skill shortages at the intermediate level and can provide a means to tackle low
productivity levels, high unemployment rates, and difficult transitions from education to work for young
people. The reinvention of apprenticeship training in many countries has been motivated by two main
positive outcomes: i) the smooth transition of young people from education to work, and ii) its positive
impact on productivity as a result of better skills and work organisation, a combination which has made
apprenticeships increasingly attractive to governments in light of rising youth worklessness and growing
competitiveness between regions and firms.
The German, Austrian, Swiss and Danish apprenticeship systems are often regarded as good examples
of apprenticeship models from which countries like the UK can learn. However, while there is room for
cross-learning and adapting different elements of varying systems, each VET (Vocational Education and
Training) and apprenticeship typology is deeply embedded in specific national and regional education,
labour market, industrial relations and status systems, each with local variations, and cannot easily be
transplanted into a different institutional context.
VET systems are dynamic processes that may change over time. Like other institutional arrangements,
national VET systems are the result of historical processes in which specific constellations of social actors
pursue their interests (Ashton and Green, 1996). It has almost been forgotten that after World War II the
USA, Canada, Australia and the UK had highly developed apprenticeship systems (see for example
Marsden 1995, Gospel 1995), however, in the last 40 years, VET systems in developed countries have
become increasingly diverse. In the liberal market economies of the English-speaking world, traditional
apprenticeship systems have declined in significance. At the same time, there has been an unprecedented
expansion of general education at upper secondary and tertiary level, which has given employers the option
of recruiting young people with good general skills and training them in the workplace in order to equip
them with intermediate skills. In Germany, the dominant role of the dual system of vocational training is a
quite recent phenomenon. Up to the 1960s, the share of employees with a vocational certificate was only
about 20% but this subsequently increased as a result of institutional reforms, and the dual system
expanded to a peak of about 60% in the late 1980s (Geissler, 2002).
The UK has adopted a market-led approach to VET systems, similar to Ireland. In the general
education system in Southern European countries (Greece, Spain, Portugal and Italy) general education is
the prevailing education strand and if VET does take place it is usually in the form of on-the-job training.
In the egalitarian school-based system (Finland and Sweden) the VET system is embedded in a national
system of education that strives for equal opportunities for all citizens regarding access to education. The
trade-off from integrating VET into the school system is weakening links with the labour market.
Continental school-based systems (as in France, Belgium and the Netherlands1) have a high degree of
1.
Winterton and Sabates et al. have different classifications for the Netherlands. As most vocational training
in the Netherlands takes place in vocational schools, Sabates et al. classify it as a school-based system8 - SECTION 4: COMPARING VET AND APPRENTICESHIP SYSTEMS AND GOOD PRACTICE INITIATIVES IN GERMANY
national standardisation and central coordination which emanates from a strong meritocratic belief and a
deeply rooted ideal of academic education. In these countries there is a pronounced hierarchy of
qualification levels, with formal VET featuring at the bottom of this hierarchy, and there is generally little
vocational education and training in the workplace.
Table 1. A heuristic typology of VET systems of EU15 countries
Type of VET system Countries
Apprenticeship-based Austria, Germany, Denmark, Luxembourg
Market-led UK, Ireland
Continental School-based Netherlands, Belgium, France
General Education Greece, Spain, Portugal, Italy
Egalitarian School-based Finland, Sweden
Source: Sabates et al. (2010), p.33.
Only in countries with strong trade unions and a tradition of corporatist cooperation (Germany,
Austria, Switzerland, Denmark and Norway) have new apprenticeship programmes been successfully
established in the manufacturing industry as well as in the expanding service sector.
Box 1. Apprenticeship typologies
Defining what constitutes an apprenticeship is not easy and typologies vary between countries. The
apprenticeship system is regarded as a distinct form of VET and consists of the following elements:
Involvement of the social partners in the regulation of apprenticeships systems;
Standardisation of occupational profiles and training curricula with minimum training periods of two to four
years;
Links with occupational labour markets and work organisation in the company;
Dual training within the company and vocational schools;
Employers’ responsibility and commitment;
The high reputation of an apprenticeship among employers, parents and young people.
Source : Bosch, 2012
Aiding the school to work transition
The financial crisis is exacerbating long-term structural problems that affect the transition from
education and training to work. Youth unemployment rose disproportionately in countries with school-
based education and training systems while it remained low in countries with strong apprenticeship
systems. The young have been particularly hard hit by the crisis. Between 2008 and 2011 youth
unemployment rose more than twice as fast as adult unemployment in the EU and in some countries like
while Winterton classifies it as a workplace system because of the high importance of internships in
companies.SECTION 4: COMPARING VET AND APPRENTICESHIP SYSTEMS AND GOOD PRACTICE INITIATIVES IN GERMANY - 9
Sweden and Italy even three times as fast – see Figure 1. Only in Luxemburg, Turkey and Germany,
countries with strong apprenticeship systems, did youth unemployment decline.
Figure 1. Increase of youth unemployment rates in percentage points, 2008 to 2011
Source: Eurostat.
Myriad studies have shown that occupational competencies acquired in apprenticeship systems with
generally recognised standards make transitions into the labour market easier than competencies learned in
school-based systems. Müller and Gangl (2003) analyse the transition from education to work over ten
years in Western European countries. The virtuous circle between vocational training and the upgrading of
job structures in strong apprenticeship systems was found to support the rapid integration of young people.
In countries with school-based vocational training (Belgium and France) and in the liberal economies
(Ireland and UK) the transition takes longer but the labour markets are open enough to support integration
for the vast majority of young people over a reasonable time. Southern European countries with
predominant general education systems and closed internal labour markets are concentrating labour market
risks on young people. As a result they are facing many years of unstable employment as well as both open
and hidden unemployment. See Box 2 for information on the bumpy and often unsuccessful roads for
young people into employment (Brzinsky-Fay, 2007).10 - SECTION 1: SETTING THE EMPLOYMENT AND SKILLS CONTEXT IN THE UK AND LONDON
Box 2. Status changes as young people move from education to work
The most recent research on transitions from education to work is focusing on using longitudinal data to measure
the different status changes which young people go through over time. Since young people often change between
education, inactivity, unemployment and work before they get into a stable job, sequence analyses seem to be the
appropriate methodological approach. It helps to understand the often bumpy or unsuccessful road into employment
and has detected a number of distinct pathways. Brzinsky-Fay (2007), for example, differentiates the following eight
types of status changes over 60 months:
Link: High concentration of education at the beginning and high transitions into work at the end
Return: After short periods of employment or NEET, a return to education
Failure: Mainly unemployment
Detour: After considerable unemployment, finally transition into employment
Dropout: Long lasting inactivity
Bridge: Apprenticeship and fast transition into employment
Break: Short inactivity and transition into employment
Express: Fast transition into work
All types are to be found in different countries in different proportions. Italy, Spain and Greece have high shares
of “failure”. Germany has by far the highest share of “bridge” into skilled jobs while Denmark with its open education
system has the highest share of “return”. UK and Belgium with their open labour markets have the highest share of
“express” but in the UK especially this is often into low skilled jobs. The “express” route is also strong in France but is
combined with high shares of “break” which reflect the difficulties of the less educated.
Source: Based on work carried out by Brzinsky-Fay, 2007.SECTION 1: SETTING THE EMPLOYMENT AND SKILLS CONTEXT IN THE UK AND LONDON - 11
SECTION 2: SETTING THE EMPLOYMENT AND SKILLS CONTEXT IN THE UK AND
LONDON
The UK’s skills challenges
The Leitch Review found that poor skills and a mismatch between the skills base and employers‟
needs was the UK‟s “Achilles heel” (2006). Indeed, almost 250 years ago the economist Adam Smith
argued that „the greater part of what is taught in schools and universities…does not seem to be the proper
preparation for that of business‟ (Smith, 1776). These skills shortfalls are seen across the board.
International comparisons of skills profiles (with qualifications used as a proxy for skills) have shown that
the United Kingdom ranked mid-table at best among OECD countries at most qualification levels (Leitch
Review, 2005). Low skill levels were identified by government as one of the key reasons for the UK‟s
relatively poor productivity levels in comparison to other countries, as well as constraining employment
chances and social inclusion. For example, by 1999 around one fifth of the UK‟s productivity gap with
France and Germany was the result of relatively poor skills at the lower and intermediate levels
(O‟Mahoney and de Boer, 2002). Many comparative macroeconomic studies support this finding (Mason
et. al 2008; O'Mahony and Wagner, 1995 in Bosch, 2012). The government commissioned an independent
review to examine what ambitions should be set for skills and how these could best be delivered - the
Leitch Review. The Review recommended that the UK aims for a “world class skills base” by 2020,
benchmarked by being in the upper quartile (top eight) of the OECD for all qualification levels, and that
the number of apprenticeships would be doubled to 500 000 by 2020 (Leitch Review, 2006).
The UK‟s skills base has been improving over the last decade, albeit from a lower base than in many
other countries and in many cases at a slower rate. The UK‟s qualification profile has increased
significantly over time and is projected to continue to do so as a result of a combination of better qualified
entrants to the labour market, the exit of older workers who are likely to be less qualified, and training of
the existing workforce. There has been progress in reducing the share of workers without an upper
secondary qualification, and indeed the UK has been more successful in this than other countries. While in
1997, 41% of 25 to 64 year olds in the UK had not attained an upper secondary qualification; by 2010 this
has dropped to 25%, slightly below the OECD average of 26% (OECD, 2012). However, continuing
improvements in other countries mean that the UK‟s international ranking is unlikely to improve. As Table
1 below shows, the UK is running to stand still. Ranking for low, intermediate and high level skills (based
on trends in OECD countries‟ adult skills from 1998 to 2007) shows that the UK is on course to miss the
Leitch 2020 skills targets by some distance. According to the UK Commission for Employment and Skills
report (2010), the UK will not reach its world class ambition in low and intermediate level skills and will
remain at the bottom half of OECD countries, however, it expects to almost achieve the skills ambition
regarding high level skills. It is important to note that the projections in Table 2 were compiled before the
2010 Spending Review announced a 25% reduction in public funding for adult skills over a four year
period, which could reduce the UK‟s likely improvement over the coming decade.2
Table 2. The UK’s qualification profile relative to OECD countries
Skill level 2007 rank 2020 forecasted rank 2020 ambition
2.
Indeed, this paper has been written in a time of significant policy reform in the UK since the election of the
coalition government in May 2010. There has been considerable change in both policy mechanisms and
governance structures, which includes ongoing cutbacks in public spending and the dismantling of a
number of key organisations and agencies in the skills arena, all of which has impacted on skills policy in
London.12 - SECTION 1: SETTING THE EMPLOYMENT AND SKILLS CONTEXT IN THE UK AND LONDON
Low skills 19 20 Top 8
Intermediate skills 21 21 Top 8
High skills 12 11 Top 8
Source: UK Commission for Employment and Skills, 2010.
The biggest shortfall in qualifications of the UK workforce is projected to be in intermediate skills
(Level 3) as Table 3 shows. In 2008, 20% of the UK workforce had Level 3 skills, with the ambition of
raising this to 28% by 2020, however projections showed that this is more likely to reach 19% (again, this
is not taking into account the spending cuts). The percentage of the population with low skills (below
Level 2) will see a much smaller drop than sought. According to these trends, the UK is not on track to
deliver a step change and significantly improve its international ranking, however for the projection for
higher level skills (Level 4+) the UK is set to overreach its target.
Table 3. Qualifications of the UK workforce, 2008-2020
Skill level 2008 (%) 2020 ambition (%) 2020 projection (%)
Level 4+ 31 40 42
Level 3 20 28 19
Level 2 20 22 20
Below Level 2 17 6 14
No qualifications 12 4 5
Source: Labour Force Survey and UK Commission for Employment and Skills, 2010.
The ongoing economic downturn since the financial crisis has had an effect. Employment has fallen
and employers have cut back on training expenditure. Total annual employer expenditure in England on
skills was £39bn in 2009, a fall of 5% in real terms since 2007 (UKCES, 2010). Public sector employment
is also being reduced and this is likely to have a particular impact on training given that public sector
employers are, on average, more likely to train than private sector employers.
London’s unique labour market
London‟s labour market is in many respects unique. London is the engine of the UK economy,
generating one fifth of the UK‟s tax revenues, and draws in the best and brightest from across the country
and around the world (GLA, 2010a). This in turn creates jobs and opportunities: London created 380 000
additional jobs in the decade to 2010. The shift to a more service-based economy, as seen across many
OECD countries, has been even sharper in London than the UK generally and today the London labour
market is dominated by the service sector.
The city‟s labour market is very polarised and even more so than the national average, with a higher
proportion of high skill (degree level or equivalent) jobs and fewer intermediate jobs. There are three low
skilled residents for every low skilled job in London (HM Treasury, 2007). Figure 2 shows London‟s skills
structure relative to that of the UK as a whole. London has a higher proportion of people with degree level
qualifications, but fewer at intermediate level and marginally fewer with low skills (LDA, 2010). This
“hollowing out” of the labour market is projected to continue.SECTION 1: SETTING THE EMPLOYMENT AND SKILLS CONTEXT IN THE UK AND LONDON - 13
Figure 2. London workforce skills structure relative to the UK, 2007 – 09 (% working age population)
Source: Labour Force Survey in London Development Agency and Oxford Economics, 2010.
The make-up of London‟s major employment sectors will continue to change in the coming decade.
The biggest fall in employment by sector will be in manufacturing (employment is projected to fall by
20%), with declines also in primary and utilities, financial services and public administration and defence.
The largest projected growth will be in business services, with the number of jobs projected to rise by 18%
(LDA, 2010).
Table 4. Employment projections by sector in London (in thousands)
2008 Level 2020 Level
Primary & utilities 17 14
Manufacturing 225 151
Public administration & defence 226 212
Construction 230 232
Hotel & restaurant 319 341
Financial services 342 340
Transport & communications 352 374
Other personal services 408 470
Retail & distribution 618 625
Education & health & social work 753 783
Business services 1 249 1 628
Total employment 4 779 5 181
Source: London Development Agency, 2010.
Despite London‟s overall economic strength and high skilled employment, it has one of the lowest
employment rates in the UK. London‟s employment rate is 69% compared to 72% for the UK as a whole
(ONS, 2011) and noticeable is the major variation in employment rates between boroughs in London itself.
This dichotomy between London as the country‟s economic powerhouse and low employment rates has
existed for around 20 years. Essentially, while London has had strong economic growth that has created14 - SECTION 1: SETTING THE EMPLOYMENT AND SKILLS CONTEXT IN THE UK AND LONDON
jobs, these jobs have not been filled by resident Londoners for several reasons. London‟s employers have
access to a global labour market which means they can find the skills they need either from elsewhere in
the world (particularly at high skill levels) or the UK, which can lessen the imperative to employ and train
local workers. This creates higher competition for jobs which in turn means that employers do not need to
pay a premium wage for entry level jobs, despite London‟s higher cost of living and as a result, gains from
working for unemployed Londoners can be weak. What is more, London has a higher proportion of people
from groups disadvantaged in the labour market (such as lone parents and people with disabilities) and
greater levels of multiple disadvantages (HM Treasury, 2007). The city also has one of the worst records in
England on measures of youth unemployment, educational attainment3 and the proportion of young people
not in education, employment or training and the situation is particularly severe in certain local authorities.
In addition, government employment programmes for job seekers (such as the previous New Deal
programme4) generally perform worse in London. This is partly because of the demand-side factors
outlined above (namely employers‟ access to a global labour market) and partly due to insufficient
resourcing (for example, funding for many programmes does not reflect London‟s higher cost of delivery).
London has also historically experienced lower take-up of work-based learning. Train to Gain is one such
example - a national work-based learning and apprenticeship service designed to support employers to
improve the skills of their employees in order to drive up business performance (Learning Skills Council,
2006).5 The suggestion is that London‟s workforce concentration, a less stable and often more casual
labour market, and the wealth of talent which flocks to London of its own accord, provides a poor
infrastructure for work-based learning schemes (Brockman, Clarke and Winch, 2010).
A changing training policy context
As a result of the UK‟s and London‟s skills challenges, encouraging employers to increase their
training efforts has been a priority for some time. Efforts to boost skills in the UK can broadly be seen to
fall into two main categories:
Compulsion/collectivist. Approaches have included compulsory levies and licenses to practice,
and have often been focused on particular sectors and occupations. In practice, collectivist
approaches have often worked best in sectors with a history of working together e.g.
construction.
Voluntarist. Approaches have focused on greater incentives (e.g. subsidised training) and
information for employers to encourage them to train their workforce, coupled with greater
control over the skills system. Voluntarist approaches have sometimes been seen as “preaching to
the converted” rather than bringing about a wider change in employer culture.
Over the period of the Labour government (1997-2010), skills policy involved a mix of both
collectivist and voluntarist approaches. Employers were supported to introduce compulsion in their sector
through their Sector Skills Council, if there was a majority support for it. This led, for example, to the
introduction of a compulsory levy in the creative industries (where a large number of small sub-contractors
3.
For example, 68% of young people in London achieve Level 2 qualifications by age 19 compared to the
national average of 70% (LSC, 2007 in Brockman, Clarke and Winch, 2010).
4.
The New Deal programme was replaced by the Work Programme under the coalition government in mid-
2011. The single largest employment programme ever contracted, it replaced a number of separate welfare-
to-work programmes (CESI, 2012).
5.
Train to Gain, via the Skills Funding Agency (formerly the Learning and Skills Council) sought to upskill
those in employment aged 25 and over and offered subsidised in-work training up to Level 3. The Train to
Gain programme was abolished as part of the 2010 Spending Review.SECTION 1: SETTING THE EMPLOYMENT AND SKILLS CONTEXT IN THE UK AND LONDON - 15
reduce the incentive for employers to train individually) and the continuation of such arrangements in the
construction sector. It also included greater use of licenses to train - for example a requirement for all
workers in the care sector to have at least a Level 2 qualification. At the same time, greater incentives were
introduced which included increasing the level of public subsidy for a range of courses and adding a new
legal entitlement to Level 2 training. A new employer training programme, Train to Gain, was introduced
which offered free (where eligible) training to low skill employees. Employers picked the training - as long
as it was accredited - and were offered wage compensation to cover the cost of replacing staff while they
were training.
The skills policy approach since 2010
Two key drivers have affected the coalition government‟s approach to skills policy since coming into
power: public spending cuts and public service reform. The government has embarked on a programme of
cuts to reduce the budget deficit - overall levels of public funding for adult skills will fall from £4.3bn in
2010-11 to £3.2bn in 2014-15, a fall of 25% (HM Treasury, 2010). Within this, there are significant
changes to how funding is used. National targets and planning undertaken by the Skills Funding Agency
have been downscaled (Department for Business, Innovation and Skills, 2011) and there have been
attempts to simplify what is seen as a notoriously complex system.
While previously skills policy was supply-side focused, with less emphasis on skills utilisation by
employers, the current government has adopted a more market-based approach to public services with no
additional compulsion or incentives. This aims to give training providers, colleges and other providers
greater freedom in delivery, and providers are freer to use budgets to meet local need rather than national
targets. The decisions of employers and individuals are playing a far greater role in driving funding flows
and the expectation is that employers will lead the skills system in a decentralised way. The flipside of this
is that there is a much greater expectation that employers and individuals availing of training programmes
will make a financial contribution and in this sense represents a move away from the widening of full
government funding as seen up to 2010. However, the potential conflict between boosting skills to benefit
businesses (leading to a focus on bespoke and short courses) and measuring the impact of public
investment (leading to a focus on qualifications) means the risk of a trade off between quantity and quality.
Devolving and re-centralising skills system
Traditionally the English skills system has, like many public services, been highly centralised. There
was a relatively small role for sub-national authorities, such as London, and relatively little flexibility for
providers to act outside their budget lines and plans. Targets were set by central government and the
Learning and Skills Council (LSC – forerunner of the Skills Funding Agency) agreed delivery plans with
colleges and other skills providers. The Labour government introduced a degree of devolution to London,
passing a law that the LSC must pay due regard to the strategy of the London Skills and Employment
Board6 in its adult skills plans. This was largely a supply-side role – scrutinising adult skills allocations
between providers, levels and type of qualifications of the LSC. Subsequently, similar powers were
introduced for a small number of other English cities. In practice, however, the national strategy still took
primacy, giving London relatively little room for manoeuvre although one area in which London sought to
6.
The London Skills and Employment Board began work in December 2006. Chaired by the Mayor and
made up of leading employers, it had statutory responsibility to set the framework for Learning and Skills
Council adult skills expenditure (around £650m per year at the time). It published its first strategy,
London‟s Future, in July 2008 and a renewed strategy, From Recession to Recovery, in December 2009,
which both set out the principles that the London employment and skills system should be focused on the
needs of its customers (employers and individuals) and work in a more integrated way.16 - SECTION 1: SETTING THE EMPLOYMENT AND SKILLS CONTEXT IN THE UK AND LONDON
influence the budget was in shifting resources to support growth in apprenticeships and other employer-
focused training.
Post-2010, the government repealed the devolved powers to London and other cities as part of a move
to give skill providers greater freedom to deliver to local needs. This was also part of a broader
philosophical shift away from what was seen as an overly strong focus on supply-side planning. In
addition, the coalition government removed the LSEB‟s statutory role in mid-2011 and introduced new
Local Economic Partnerships around the country, with the intention that through them the voice of
employers on skills (though without statutory powers) will be heard.SECTION 2: APPRENTICESHIPS IN ENGLAND AND THE LONDON CAMPAIGN - 17
SECTION 3: APPRENTICESHIPS IN ENGLAND AND THE LONDON CAMPAIGN
Reviving apprenticeships
Britain has had a long history of apprenticeships, dating back to the guilds of the Middle Ages. By the
late nineteenth century, apprenticeships had spread from artisan trades such as building and printing to the
newer industries of engineering and shipbuilding, and later to plumbing and electrical work. By the 1960s
there were around 240 000 apprentices and apprenticeships were seen as the “gold standard” in vocational
training. However, this had fallen to 53 000 by 1990, a product both of increasing participation in full-time
education post-16, reductions in public funding, and declines in industries, such as manufacturing, which
traditionally had higher numbers of apprentices.
Since the mid-1990s, governments have aimed to reinvigorate apprenticeships as a way to increase
skills levels and ease the transition from education to the labour market. A Modern Apprenticeship Scheme
was launched in 1995 by the Conservative government, born out of continuing concerns about the
country‟s poor skills supply system at craft, supervisory and technician (intermediate) level and
“employers‟ retreat” from apprenticeships as training places declined (Keep, 2002 in Brockman, Clarke
and Winch, 2010). The minimum qualification level was set at NVQ Level 3.
Apprenticeships continued to be promoted under the Labour government in the late 1990s and the
2000s as the primary work-based vocational route for young people (Harris, 2003). The government
carried forward the Conservative model and rebranded the Youth Training Scheme 7 as a Level 2
apprenticeship in response to employers‟ claims that young people applying for apprenticeships lacked the
educational prerequisites for Level 3. Thus, while the number of young people selecting apprenticeships
rose dramatically between 1996 and 2009, this was at Level 2 and the numbers completing Level 3 fell
(Steedman, 2011). A National Apprenticeship Service (NAS) was created in 2008 with end-to-end
responsibility for apprenticeships to provide a more joined-up approach for individuals and employers.
Promoting and strengthening the apprenticeship route has included additional public funding and the
development of apprenticeship frameworks in „non-traditional‟ sectors through Sector Skills Councils in
sectors such as retail and business administration. The result was a sharp rise in the number of apprentices
nationally to 279 900 in 2009/10, with a rise in completion rates to 74% (double what they were five years
before).
Toward the end of the Labour government, however, concerns over the approach began to crystallise,
with the main fear being that quality had been sacrificed in the pursuit of quantity. The major boost in
numbers had come at Level 2 rather than Advanced Level 3 apprenticeships, and existing jobs were being
converted to apprenticeships rather than signalling new jobs at a higher skills level, which may have
affected apprenticeships‟ status. Evidence showed that there was a high degree of deadweight in training
programmes, such as Train to Gain where oftentimes training was simply accrediting existing skills rather
than boosting skills (Dolphin and Lanning, 2011). At the same time, it was often public and private sector
employers with an already good record on training that were taking up training offers. Improvements in the
UK‟s skills profile had been delivered by significant increases in public investment and policy changes, but
7.
The Youth Training Scheme was an on-the-job training scheme for young people. It faced criticisms for
failing to provide training of an adequate quality and was generally seen as a low status option.18 - SECTION 2: APPRENTICESHIPS IN ENGLAND AND THE LONDON CAMPAIGN
their combined impact had not been to change the culture of employers regarding training (hence employer
demand for and utilisation of skills) and indeed this lack of change meant these skills approaches may not
be sustained.
Apprenticeship policy under the coalition government
London‟s skill shortages and high unemployment are of major concern to the government and are
being addressed as part of efforts to improve competitiveness and social inclusion. A core component of
this is increasing the number of apprenticeships as part of more general work-based learning, by engaging
more with employers and better promoting apprenticeships to young people (Brockman, Clarke and
Winch, 2010). The influential Leitch Review had recommended substantial expansion of the
apprenticeship system in England to 500 000 a year by 2020 and stated that “The Government should build
on the success of the Apprenticeship route, expanding it to become a pathway which is open to every
suitably qualified 16-19 year old” (HM Treasury, 2006, paragraph 66).
The coalition government set out in its skills strategy, Skills for Sustainable Growth, expanded
provision for apprenticeships as its flagship programme. The 2010 budget announced a £180m package for
a further 50 000 apprentices, aimed at helping young people into work or training. The Train to Gain
programme was abolished and funding was transferred to apprenticeships to create additional places.
Indeed, the apprenticeship programme is one of the few programmes to have received additional
government funding in recent public expenditure announcements (LSEO, 2011). Between 2011/12 and
2013/14 funding for apprenticeships (within the overall declining FE budget) will rise from £644m to
£726m. Apprenticeships are now the key route for public investment in employer training and continue to
be promoted as the “gold standard” employer-orientated training route. The government has sought to
accelerate the development of Higher Apprenticeships and focus growth in numbers on Advanced
Apprenticeships, with clear progression pathways from Level 3 to Level 4 and higher education. There is a
greater requirement for employer and individual financial contributions within a more market-based
system.
Apprenticeships in England are work-based training programmes designed to suit the needs of
employers and lead to nationally recognised qualifications. Apprenticeships generally consist of four key
elements:
Knowledge-based. The theoretical knowledge underpinning a job, accredited by a Technical
Certificate;
Competence-based. The ability to undertake an occupation, usually assessed by an NVQ;
Transferable skills. Including literacy and numeracy and other key skills; and
Module on employment rights and responsibilities.
An apprenticeship can take between one and four years to complete depending on the sector, the job
role, level of apprenticeship (see Box 3) and the ability of the individual apprentice.SECTION 2: APPRENTICESHIPS IN ENGLAND AND THE LONDON CAMPAIGN - 19
Box 3. English apprenticeship levels
In England, there are three apprenticeship levels, corresponding to the National Vocational Qualification
framework:
Higher Apprenticeships (Level 4 and 5). These are the equivalent of a foundation degree. Average
length: three to four years. They were introduced in 2009 and are only available in a limited number of
areas.
Advanced Apprenticeships (Level 3). These are the level of apprenticeship traditionally associated
with apprenticeships in the past. The equivalent qualification is two A-level passes. Average length: two
years (one year if following an apprenticeship).
Intermediate Apprenticeships (Level 2). These are equivalent to 5 GCSEs at grade C or above.
Average length: nine to 12 months.
Source : Capital Ambition et al, 2011.
An apprentice may be a new or existing employee, works at least 30 hours a week and many
apprentices are offered a permanent job at the completion of their apprenticeship, though this is not
guaranteed. Sector Skills Councils design apprenticeships, working closely with representatives from the
particular industry sector to ensure that training will be relevant. Apprenticeship frameworks in England
now cover most sectors and occupations, beyond their original concentration in manufacturing and craft
industries and there are 156 apprenticeship frameworks (as of November 2011). Apprentices receive a
wage and are initially entitled to no less than £95 a week, with this rising for London. Employers are
advised to review apprentices‟ pay every six months and also to have different salary scales for Level 2
and 3 to reward progression. The English apprenticeship model has faced criticisms for paying apprentices
too much compared to other payment systems in OECD countries, thereby classifying them less as
“learners” and more as “employees” (see Ryan, 2011). Funding is available for training, partly provided by
the National Apprenticeship Service, with the contribution depending on apprentice age and the framework
being undertaken, and funding is generally provided directly to the organisation providing training.
Significant changes to the funding mechanisms will take place in the coming year and there will be a
greater obligation on apprentices to pay for their own training through income contingent loans (see Box
4).20 - SECTION 2: APPRENTICESHIPS IN ENGLAND AND THE LONDON CAMPAIGN
Box 4. Apprentice wages and training contributions
Apprentices must receive a wage and are entitled to earn an amount of no less than £95 a week. Once they
have worked as an apprentice for a year, if they have reached the age of 19 and are still working for the same
employer, they are entitled to the national minimum wage for their age. Amongst London boroughs, the
apprenticeship salary ranges from £110 per week up to £300 per week, depending on what has been agreed
corporately and with trade unions. Net pay across different industries varies, for example with hairdressing at
£109, construction and retail at £168, and hospitality reaching £187. Employers are advised to review
apprentices’ pay on a six monthly basis to encourage retention and motivation and reward progress. It is also
recommended to have different salary scales for Level 2 and Level 3 apprenticeships to demonstrate progression
and increase in responsibility and experience.
The National Apprenticeship Service provides funding, with the contribution size depending on the age of
the apprentice and framework being undertaken. In general, between the ages of 16 to 18 the National
Apprenticeship contribution is 100%, dropping to 50% for those aged 19 to 24. For those 25 and over there are
contributions for specified places. The funding is provided directly to the organisation providing the training i.e. a
college or training provider. In some cases large employers may receive funding themselves when they deliver in-
house training. Funding is not available from the NAS for Higher Apprenticeships. There is currently on offer a
grant for small and medium sized employers to help with the cost of hiring an apprentice.
From 2013-14 there will be significant changes to the funding for apprenticeships, in some cases requiring
the apprentice themselves to pay for their training through an income-contingent loan. Funding will be structured
to encourage Level 3 qualifications, with learners aged 25 and above expected to contribute 50% of the cost of
their learning through a loan. This will be a significant change to the current model where apprentices are not
expected to contribute to the costs of their training.
Source : Capital Ambition et al, 2011.
According to Ryan (2011) it is often difficult to differentiate between apprenticeships, on-the-job
training and labour market programmes in Britain and the use of the term apprenticeship is often
“confusing, cosmetic and objectionable”. “Apprenticeship has in effect come to denote in contemporary
England any publicly-funded programme of work-based learning that satisfies the (frequently
undemanding) requirements for public subsidy, however limited its educational content” (Ryan, 2011; p.6).
The British apprenticeship model is characterised as market-led and work-based and has faced criticism for
being low standard, low status and offering varying quality of provision. The lack of continual general
education has also been criticised, with young people spending most of their time in the workplace with
“perhaps occasional excursions into the premises of a training organisation” (Brockman, Clarke and
Winch, 2010, p.121). The governance framework has been criticised for the lack of social partner
involvement by unions, further education colleges and sub-national stakeholders.
The recent apprenticeship drive across Britain and resulting growth in the model has also faced
criticisms that this growth has not necessarily resulted from additional apprenticeship places being created
because of extra demand but rather from rebranding recently abolished training schemes or classifying
existing schemes as apprenticeships and claiming the rise in apprenticeships as a result (McKinnell, 2012;
Ryan, 2011). Also noticeable is that the current expansion has been driven significantly by training existing
employees (and thereby impacting on the age profile) rather than creating new employment. It has proven
difficult to stimulate new demand for apprenticeship jobs while also encouraging employers to recruit
unemployed young people in this capacity (LSEO, 2011).
The London Apprenticeship Campaign
The London Apprenticeship Campaign was introduced in November 2010 by the Greater London
Authority (GLA) and the National Apprenticeship Service to increase London‟s apprenticeship numbers bySECTION 2: APPRENTICESHIPS IN ENGLAND AND THE LONDON CAMPAIGN - 21
20 000 by September 2011. The aim was to generate an overall increase in the number of apprentices in
London to 30 000 - 35 000. The campaign sought to improve the city‟s take-up relative to other English
regions: London had 14% of the UK‟s population but only provided 5% of the annual total of new
apprenticeships. Growth was planned as part of a national policy shift to invest more in creating additional
apprenticeship places and the city target was set in addition to national targets. The capital‟s top companies
were contacted to urge them to help Londoners into work and boost the economy by creating the new
apprenticeships (coinciding with the launch of the NAS‟ London campaign which contacted 54 000
business across the city to encourage them to take on apprentices). In addition to improving the capital‟s
training record, it also sought to raise awareness that opportunities are available across a range of sectors
from hospitality and travel to fashion and media (GLA, 2010b).
The campaign was also a way to respond to increasing demand among young people for
apprenticeship places: on average there are 16 applications for every apprenticeship vacancy and for some
apprenticeship places there is more demand than for Oxford University places (GLA, 2010b). The drive
was part of a move towards a more demand-led system in which overall allocations would depend to a
greater extent on employer demand and participation, and lower demand would mean that funding would
be moved elsewhere. While a certain proportion of the increase would come from participants transferring
from existing training programmes, nonetheless delivering an additional 20 000 places would be
challenging.
Around 20% of total employment in London is in the public sector which gives significant
opportunities to boost apprenticeships. In addition, the highest take-up of apprenticeships in Level 2 and 3
are predominantly in public sector organisations - for example, childcare, health and social care (LSEB,
2010). While this demonstrates public sector leadership, it also indicates a relatively low take-up in some
of the service sectors which dominate the London economy and suggests a need to improve levels of
employer training in large and growing sectors. The recent cuts in public sector expenditure have also
meant in many cases significant public sector job losses, but high levels of job turnover meant employment
opportunities were still there.
It was expected that the public sector would play a significant role in delivering the apprenticeship
growth and lead by example. Two key commitments were made to increase the number of apprentices
employed in London‟s public sector. London Councils (a cross-party organisation, funded and run by
London‟s 33 boroughs) agreed to deliver 2 000 apprenticeships in London‟s boroughs and partner
organisations. The second commitment was by the Mayor of London to employ 2 000 apprentices both
directly and through supply chains over two years. Much of this would be delivered by GLA Group
procurement but it also included direct employment within the GLA and its agencies. The London Skills
and Employment Board won an additional £14m to fund the extra 4 000 apprenticeship places in London
above the SFA London Apprenticeship allocation for 2010/11. The additional funding came with the
proviso that London‟s local stakeholders would need to work together to generate sufficient employer
demand to fill the places as if not, the money would flow elsewhere. Specific targets were also built in to
maximise the potential benefits of the Olympic Games.
Outcomes
By 2010/11 the number of apprentices in London doubled to 41 400, with significant increases
occurring across England as well, as shown in Figure 3. This was a near doubling in the number of
apprenticeship starts between 2005/06 and 2009/10 and again between 2009/10 to 2010/11. The London
campaign had significantly exceeded its target and the specific targets set by the public sector have been
met and, in many cases, exceeded. A self-evaluation of the jointly funded LDA-NAS campaign showed
that it had also gained valuable learning about which approaches worked best in a range of sectors.You can also read