AN INTRODUCTION TO NUTRIENT MANAGEMENT IN AGRICULTURE - MASSEY UNIVERSITY - Reading material and self-assessment
←
→
Page content transcription
If your browser does not render page correctly, please read the page content below
MASSEY UNIVERSITY

 AN INTRODUCTION TO

NUTRIENT MANAGEMENT

     IN AGRICULTURE

Reading material and self-assessment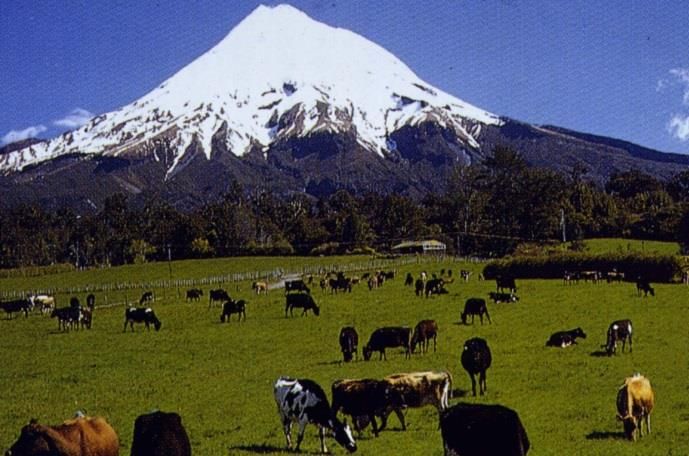
Contact Details:

                                                            Farmed Landscapes Research Centre
                                                              School of Agriculture & Environment
                                                                      Massey University (PN 432)
                                                                               Private Bag 11 222
                                                            Palmerston North 4442, New Zealand
                                                                            Phone: (06) 356 9099
                                                                 Email: J.A.Hanly@massey.ac.nz
                                                                           http://flrc.massey.ac.nz

© Notice of copyright:
All rights reserved. No part of this document may be reproduced or transmitted in any form without the
prior written permission of the Director, Farmed Landscapes Research Centre, Massey University.

                                                                               Revised January 2021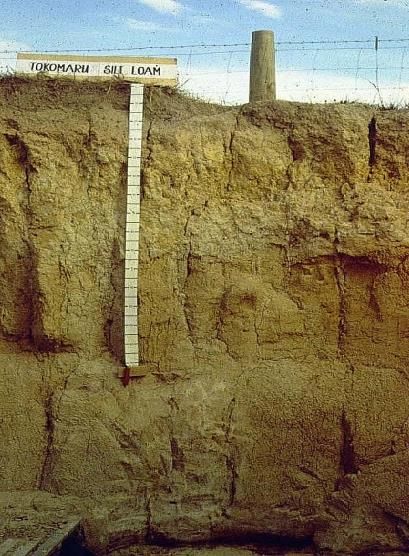
Table of Contents
1. Introduction to Nutrient Management for Dairy Farms
1.1 Introduction to farm nutrient balances .................................................................... 1-1
1.2 The influence of the grazing cow on nutrient recycling in grazing systems ........... 1-6
1.3 Conclusion ............................................................................................................. 1-9
References ..................................................................................................................... 1-10
Test Your Knowledge – Section 1.................................................................................. 1-10
2. Introduction to Soils Used for Dairy Farming in New Zealand
2.1 Introduction to soils ................................................................................................ 2-1
References ..................................................................................................................... 2-19
Test Your Knowledge – Section 2.................................................................................. 2-19
3. Nutrient uptake by pasture from soils
3.1 The pasture and its nutrition .................................................................................. 3-2
3.2 The Form of Nutrients Taken Up by Pasture Plants .............................................. 3-3
3.3 The Role of the Soil Water ..................................................................................... 3-5
3.4 Sources of Elements in Soils ................................................................................. 3-7
3.6 Factors Influencing Nutrient Retention and Plant Availability. ............................. 3-15
Recommended Reading ................................................................................................ 3-22
Test Your Knowledge – Section 3.................................................................................. 3-23
4. Introduction to Fertiliser Materials
4.1 Basic Introduction to Fertiliser Materials ................................................................ 4-1
4.2 Common Nitrogen Fertilisers ................................................................................. 4-3
4.3 Common Phosphorus Fertilisers ............................................................................ 4-4
4.4 Common Potassium Fertilisers .............................................................................. 4-5
4.5 Common Sulphur Fertilisers .................................................................................. 4-6
Calculating fertiliser application rates .............................................................................. 4-7
Fertiliser mixtures ............................................................................................................. 4-8
References ....................................................................................................................... 4-9
Test Your Knowledge – Section 4.................................................................................. 4-10
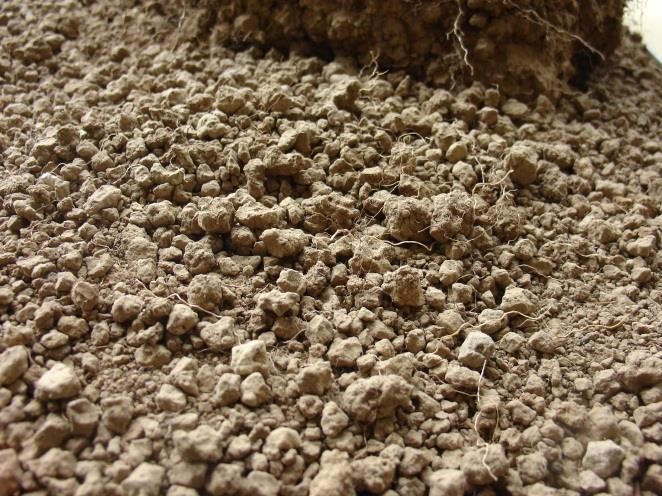
5. Introduction to Soil Physical Properties
5.1 Soil Texture ............................................................................................................ 5-1
5.2 Soil Structure .......................................................................................................... 5-3
5.3 Soil Water ............................................................................................................... 5-6
References and Recommended Readings: ................................................................... 5-12
Test Your Knowledge – Section 5.................................................................................. 5-13
Test Your Knowledge – Answers......................................................................... Answers-1
Multi-choice Self-Assessment .................................................................. Self-Assessment-1
Multi-choice Self-Assessment: Answer score sheet ......................... Self-Assessment-8
i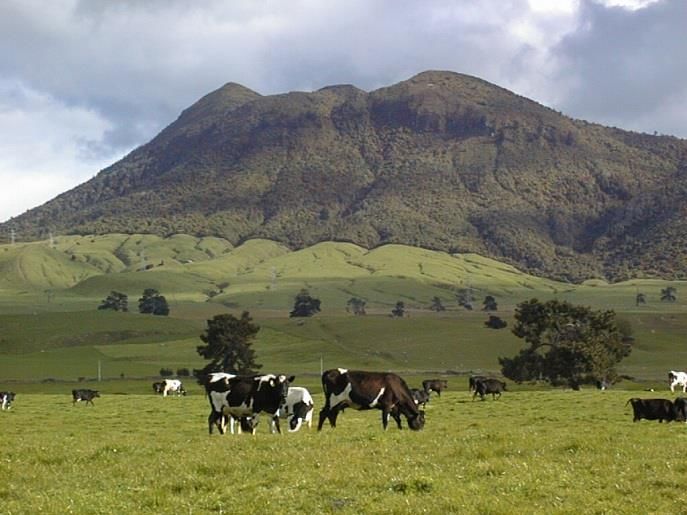
Introduction
Aim of this guide
To prepare your background knowledge on soils, fertilisers and nutrient flows in grazing
systems in preparation for undertaking the Professional Development Course, Sustainable
Nutrient Management in New Zealand Agriculture.

Analysing farm nutrient budgets and developing nutrient management plans to enable the
efficient use of nutrients on farms are skills required by farm consultants, fertiliser company
field officers and regional council staff.

The Farmed Landscapes Research Centre (FLRC) at Massey University in conjunction with
the Fertiliser Association of NZ and AgResearch have developed courses in Sustainable
Nutrient Management (SNM - Intermediate and Advanced) that provide rural professionals with
skills and training in the operation and interpretation of nutrient budgeting software.

Preparing a nutrient budget for a farm requires use of nutrient budgeting software such as
OverseerFM1, and a good knowledge of the properties and distribution of New Zealand soils,
pasture nutrition and how farm management influences the cycling of nutrients in grazed
pasture systems. An introductory level of this knowledge is required for those attending the
Intermediate Sustainable Nutrient Management course, in New Zealand Agriculture. This
introductory level of knowledge is normally gained either through tertiary study of soil science,
pasture agronomy and land resource management, or “on the job experience”.

If you are a rural professional wishing to embark on the course of study for a Massey University
Certificate of Completion in Sustainable Nutrient Management in New Zealand Agriculture, it
is advisable that you use this ‘Introduction to nutrient management in agriculture’ and the self-
assessment to refresh and enhance your knowledge in the following areas:

1.         Introduction to Nutrient Management
2.         Introduction to Soils Used for Dairy Farming in New Zealand
3.         Nutrient uptake by pasture/crops from soils
4.         Introduction to Fertiliser Materials
5.         Introduction to Soil Physical Properties

1   Download or register for online use at https://www.overseer.org.nz/overseerfm

                                                                                               ii
The way to use these study notes
Sections 1 and 2 contain information that you are required to be familiar with on nutrient flows
(Section 1) and New Zealand soils and their properties (Section 2). Sections 3 to 5 provide
the background knowledge to understand Sections 1 and 2.

We assume that most people embarking on the Intermediate SNM course are already familiar
with some aspects of soil fertility, fertilisers and plant and animal nutrition. If this is the case
with you then read the Sections from 1 to 5. If however, you have limited understanding of
soils, fertilisers and nutrient uptake, you may wish to read Sections 3-5 first before reading
Sections 1 and 2.

Learning objectives and question and answer sections
Learning objectives are clearly stated at the beginning of each section. Questions to assist
learning are placed at the end of each section with appropriate answers listed at the end of the
study notes.

Multichoice self-assessment
You can ‘self-test’ by completing the multichoice test at the end of each section in this guide.
An answer score sheet is provided on the final page.

You should be able to gauge from how well you answer the questions at the end of each
section and your outcome in the self-assessment whether you need to undertake more study
before you progress to the Intermediate Sustainable Nutrient Management Course.

Other study options
If you decide these introductory notes are a starting point that is too advanced for your current
level of experience or understanding, you are welcome to enquire about other study options,
both formal and informal, that you can embark on to allow you to progress to the Professional
Development courses offered by FLRC. Please email James Hanly: J.A.Hanly@massey.ac.nz

                                                                                                  iii
SECTION 1
1. Introduction to Nutrient Management
Key Learning Objectives
After studying this section you should be able to:
1. Describe 4 ways nutrients enter a New Zealand farm and 2 ways they leave.
2. Explain what is meant by a capital fertiliser application.
3. Explain the nutrient losses that are commonly used to calculate a maintenance
fertiliser requirement.
4. Describe 3 soil tests useful for indicating the plant supply of nutrients in soils.
5. Describe the range of values of the Olsen P test that may indicate surplus, inefficient
use of Phosphorus (P) inputs.
6. Explain why nutrient budgeting software is required to estimate nutrient losses from
farms or paddocks and calculate maintenance fertiliser requirements.
7. Describe how patterns of grazing and excretion lead to inefficient recycling of
nitrogen (N) in grazed pastures.
1.1 Introduction to farm nutrient balances
Inputs, transformations and losses from the soil-plant- animal system
Read the following section in conjunction with the following reading to apply nutrient
balances to a dairy farm:
https://www.dairynz.co.nz/environment/nutrient-management/
“Maintaining healthy
waterways is beneficial for
the dairy sector, its
international reputation and
for all current and future
New Zealanders.”
© FLRC (Massey University) 1-1
Dairy farming is one of New Zealand’s more intensive uses of our lowland, high quality
soils. To be profitable, dairy farms must operate near optimum soil fertility. Increasing milk
production on traditional ‘all grass’ New Zealand dairy farms has required the regular use
of lime, fertilisers and/or manures to maintain and improve the soil’s ability to supply the
nutrients phosphorus (P), sulphur (S), nitrogen (N), potassium (K) and to a lesser extent
calcium (Ca), magnesium (Mg) and trace elements (Figure 1.1).

Addition of nutrients through fertiliser can fulfil two requirements:
(a) a capital application that raises the plant-available pool of a nutrient in the soil to a
      level that does not inhibit grass and clover (pasture legume) growth. Vigorous clover
      (legume) growth is required to provide the major input of nitrogen through biological
      fixation.
(b) a maintenance application of nutrients that replaces losses of major nutrients
      created by the farming system. These include (Figures 1.1 and 1.2) losses in
      produce (milk and meat), leaching of nutrients in drainage waters and within-farm
      transfer of nutrients to non-productive areas (e.g. deposition of cattle excreta on
      raceways and yards and deposition of cattle excreta or crop residues on land areas
      with soil fertility status already greater than optimum). The maintenance fertiliser rate
      will increase with increasing soil fertility and farm productivity (see later explanation).

Figure 1.1      The physical attributes that contribute to inputs (▬), transfers (▬) and losses
                (▬) of nutrients from the soil-pasture system on a typical dairy farm.

© FLRC (Massey University)                                                                   1-2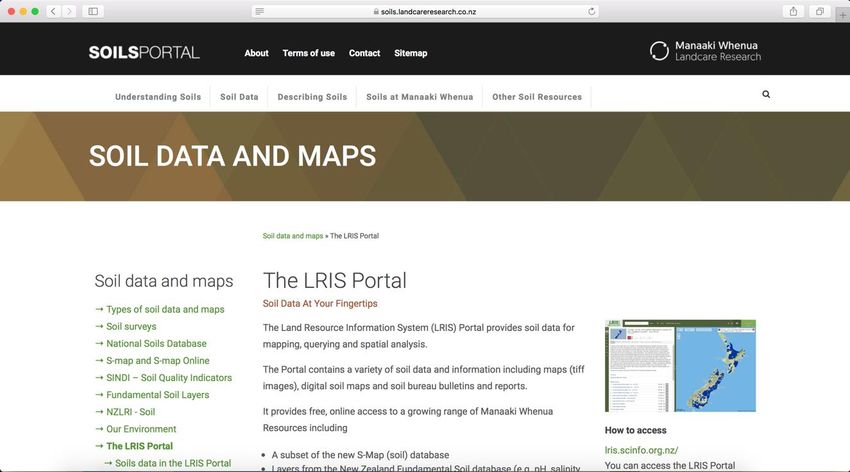
Using capital applications of fertiliser to raise the plant available pool of nutrients in the soil
to near optimum levels increases pasture growth and nutrient concentration, stock carrying
capacity per hectare, and the amounts of nutrients lost in produce and returned in excreta
(Figure 1.2). Buying in supplementary feeds such as hay, silages and concentrates can
also increase farm stocking rates and productivity. Nutrients brought onto the farm in
supplementary feeds enter the soil’s available nutrient pool through the animal’s excreta
(Figure 1.2, dung and urine excreted on the paddock plus farm dairy and feed pad effluent
re-applied in spray irrigation).

The capacity to recycle nutrients is controlled by the complex relationship between the
quantities of nutrient applied in fertiliser and returned in excreta (Figure 1.2) and the ability
of the soil to hold available nutrients for re-use by actively growing pasture. Key factors
are the soil’s physical, chemical (see Sections 2 and 3) and biological condition and the
interaction of the soil-plant system with the weather (see Section 5). Warm, moist
conditions lead to rapid excreta decomposition, rapid nutrient uptake and pasture growth;
cool, wet conditions may lead to nutrient loss in drainage and runoff, slow nutrient uptake
and slow pasture growth.

           INPUTS             INDICATORS              LOSSES

                                   Soil Test

                                                      Milk,culled
                                                     cows, calves,
           Fertilisers
                                                      crops sold.

          Slow release                                   Excretal
                                 Available Soil
           (RPR, So)                                     Transfer
                                 Nutrient Pool
                               (N,P,K,S,Ca,Mg,..)
                                                        Farm Dairy
                                                         Effluent
           Mineral
          Weathering

                                                      Drainage and
         Atmospheric N,
                                                      surface runoff
         Coastal rain S,K,
             Mg,Na

                                                      Immobilisation of
                                                      nutrients in soils
                                    Pasture             (i.e. P fixation,
                                                        organic matter)

         Supplements                                      Excreta
        (feed and minerals)      Dairy Cow
                                                         Milk, Meat

Figure 1.2       Inputs, transfers and losses of nutrients from the soil-pasture system on a
                 standard dairy farm.

© FLRC (Massey University)                                                                     1-3
Exceeding the capacity of the soil-plant system to hold and recycle nutrients

Productivity gains through the use of capital fertiliser and/or supplementary feeds increase
the effective stocking rate and increases the rate of nutrient cycling per land area unit.
Unfortunately this leads to increased loss of nutrients in drainage water and run-off (Figure
1.1). The amounts of nutrient lost in drainage and run-off can accelerate when the sum of
nutrient inputs to the farm exceed the sum of nutrients in milk and meat plus those easily
immobilised in the soil (i.e. the soils’ ability to hold nutrients via phosphorus fixation and
accumulation of semi-decomposed plant litter and dung as soil organic matter). Nutrient
losses are higher from soils that have a low capacity to hold nutrients in the pasture root
zone. These include coarse textured, sandy soils and soils with low phosphate retention
(see description of soils in Section 2 and see notes on % P retention, anion sorption
capacity, and cation exchange capacity, CEC in Section 3).

The role of soil tests - agronomic optimum or environmental risk
Read the following section in conjunction with:

        http://www.fertiliser.org.nz/Site/resource_center/Booklets.aspx

                                          - Assessing soil nutrients status

                                          - Target soil test ranges

                                          - Raising soil fertility status

                                          - Maintaining soil fertility status

Soil and plant testing has been used to monitor soil and plant nutrient status. If soil (Table
1.1) and plant tests are below recommended agronomic optimum values then a capital
input of fertiliser may be recommended to increase pasture yield, stocking rate and
economic gross margin per hectare. If soil and plant test values are already in the
recommended range for the optimum growth of pastures, only maintenance fertiliser
application is recommended because soil fertility is not limiting pasture production.

For some nutrients (P, S and exchangeable cations) situations when the soils’ ability to
hold nutrients is exceeded can be indicated by soil test values (Table 1.1). For example,
accelerated phosphate loss is indicated by an Olsen P test value significantly above the

© FLRC (Massey University)                                                                 1-4
prescribed optimums for pasture growth. Olsen values on Pallic soils and Allophanic soils
(soils formed on volcanic ash) above optimum are greater than 30 and 40 mg P/L soil,
respectively. The difference in values reflects the greater phosphate retention
characteristics of Allophanic soils (see Section 2 for information on soils and Section 3 for
information on nutrient retention in soils). Soil test values above agronomic optimums
(Table 1.1) indicate that costly nutrients purchased in fertiliser for pastures and forage
crops are not being re-used (recycled) efficiently by farming practice.
Table 1.1 Target soil test ranges for near maximum production
(source: Overseer)
Overseer soil name Sedimentary Ash Pumice Peat
Pallic and
NZ soil name Allophanic Pumice Organic
Brown
Soil Test
Olsen P 20-30 20-30 35-45 35-45
Olsen P high * 30-40 30-40 45-55 45-55
Soil test K 5-8 7-10 7-10 5-7
Sulphate-S 10-12 10-12 10-12 10-12
Organic-S 15-20 15-20 15-20 15-20
pasture 8-10 pasture 8-10 pasture 8-10 pasture 8-10
Soil test Mg
animal 25-30 animal 25-30 animal 25-30 animal 25-30
pH 5.8-6.0 5.8-6.0 5.8-6.0 5.0-5.5 (0-75 mm)
4.5-5.0 (75-100 mm)
* target ranges for high producing dairy farms (current milk solids production/ha is in the top 25 % for the supply
area)
Unfortunately there is no useful soil test readout for N. Topsoil nitrate concentrations are
always low because plant competition for nitrate uptake is high, and soils do not have the
ability to hold nitrate (the form of N most commonly taken up by pasture plants) and it is
easily lost as water drains through the soil. Soil nitrate levels decrease after each rain and
drainage event and then increase slightly in warm moist soils as nitrate is released by
decomposition of dung and soil organic matter (humus).
The role of Nutrient Budgeting in nutrient management
To manage soil fertility and any environmental risk that comes from nutrient surpluses it is
necessary to know how much nutrient is entering and leaving the farm or paddock. Soil
test values for a paddock or farm may indicate whether a low, optimum, or surplus supply
of nutrients is available in the soil, but the soil test does not indicate how that situation
arose. A nutrient surplus arises when the inputs of nutrients exceed both losses (Figure
1.2) and the soils’ ability to immobilise nutrients. Processes causing nutrient loss, such as
drainage, runoff, and immobilisation of nutrients in soil, involve complex interactions
between soils, plants, animals and climate. Past research has provided an understanding
© FLRC (Massey University) 1-5of how these processes function, but, to estimate these losses requires complex
calculations. These complex calculations can only be done using specially developed
nutrient budgeting software that simulates nutrient cycles on the farm. Overseer has been
designed to simulate the processes outlined in Figures 1.1 and 1.2. Overseer will provide
estimates of nutrient inputs, transfers within the system and losses from paddocks,
paddock blocks and the farm. It calculates the maintenance fertiliser requirement to
replace those losses at paddock or farm level. It will estimate the losses of nitrate to ground
water and phosphate in surface runoff that can have adverse environmental
consequences.
With a good understanding of the farming system, and soil – plant – animal processes that
lead to nutrient transfer, retention and loss, it is possible for a skilled user of Overseer to
prepare an audit of a farm’s nutrient budget and develop a nutrient management plan that
avoids excessive inputs of nutrients into dairy farm soils and recycles nutrients efficiently
within the farm, thereby reducing off-farm impacts of nutrient loss.
1.2 The influence of the grazing cow on nutrient recycling in
grazing systems
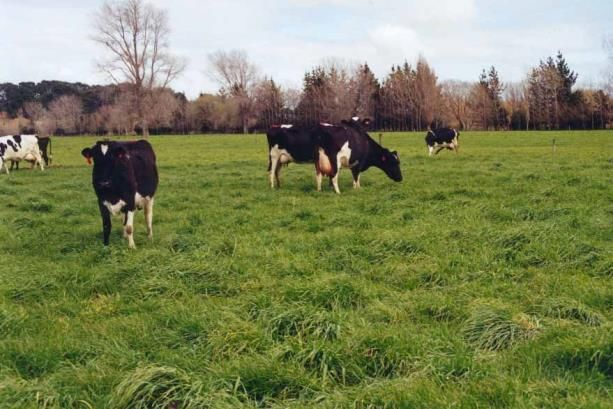
The pasture harvesting ability of stock is measured in standard stock units (ssu). A
standard stock unit is a 50 kg ewe weaning one lamb, requiring 550 kg DM as pasture per
year. A Friesian/Jersey cross cow (450 kg live weight) is approximately 6.8-7.0 ssu and
requires approximately 3,700-3,900 kg DM per year.
The grazing cow rapidly recycles nutrients from ingested grass to the soil surface through
excreta return. Unfortunately the return is to a small area of dung and urine patches and
not to the whole grazed area. In one grazing, nutrients in a hectare of lush pasture are
recycled as dung and urine on less than 0.02 ha (2 % of the grazed area). This leads to
nutrient surplus in dung and urine patches, from which mobile nutrients like nitrate,
sulphate and exchangeable cations may leach in drainage water. Immobile nutrients, like
phosphate, are less affected by this process because after deposition on the soil in dung
patches these nutrients are re-adsorbed to the soil particles.
Example – the inefficient recycling of nitrogen
A Friesian/Jersey cross cow (450 kg live weight) producing an average of 1.6 kg milk solids
(MS) per day needs approximately 15.5 kg dry matter (DM) of good quality (11.3 MJME/kg
DM) pasture per day to maintain body condition and milk production. The energy,
carbohydrate and protein composition of good quality pasture is shown in Table 1.2.
© FLRC (Massey University) 1-6Table 1.2 The protein, fibre, carbohydrate, fat and metabolisable (MJME) energy
content of high and low quality pasture (adapted from Kuperus, 2002)
Low quality, mature,
High quality, leafy
Component stemmy late summer
spring pasture
pasture
% DM
Protein 26 12
Total fibre (NDF)1 40 56
Soluble Carbohydrates 18 13
Fat 6 4
MJME/kg DM
Metabolisable energy
12 8.9
(MJME/kg DM)
1 NDF (Neutral detergent Fibre) A method of measuring total fibre content (the digestible and indigestible
parts). This indicates how bulky the feed is, and is important when allocating feed.
The leafy high quality pasture has the nutrient concentrations shown in Table 1.3.
Table 1.3 The chemical analysis of high quality dairy pasture (source: Overseer )
High Quality Pasture
Element % of DM
N 4.7
P 0.37
K 2.7
S 0.32
Mg 0.2
Ca 0.4
ppm
Fe 58
Mn 28
Zn 17
Cu 7
B* 15
Mo * 0.15
The majority (60-90 %) of nutrients consumed in pasture and supplements by a cow
(Figure 1.2 and Figure 1.3) are returned in excreta (Table 1.4), therefore, the greatest
movement of nutrients is controlled by the pattern of feeding and deposition of dung and
urine.
© FLRC (Massey University) 1-7Table 1.4 The fate of minerals ingested by a lactating dairy cow (ingesting
15.5 kg DM/day) (adapted from During 1984).
Element Consumption Percentage in
kg /week Faeces Urine Milk Retained
N 5.1 26 53 17 4
P 0.4 66 - 26 8
K 2.9 11 81 5 3
Mg 0.2 80 12 3 5
Ca 0.4 77 3 11 9
Na 0.4 30 56 8 6
Between the two milkings that take ~4 hours, the cows may spend 20 hours per day in a
paddock grazing pasture and resting. Therefore, time in the paddock represents 80 % of
the day, which results in approximately 80 % of the excreta being deposited in the paddock.
The implications of the large return of N to the paddock as urine (Table 1.4) is best
illustrated by considering early summer grazing events.
Product loss Transfer loss 4.3
7.3
Ammonia (NH3 )
Biologically fixed N 0.25 Excreta
volatilisation 1
24.4
Ingestion 36
Urine
N in dung and urine
Run-off from rolling land to
DUNG 7.3
streams and lakes ~ 0.5
Plant uptake of mineral NH4+ and NO3 -
Decomposer
Soil water organisms
Earthworms NH4+ and NO3 -
Soil
Nematodes Released to
Bacteria
fungi etc.
soil water
Solid Decay of litter,roots
and dung
Sand, silt and clay
Soil organic nitrogen in
and humus humus made from litter and
dung by the action of
decomposer organisms
NO3 leached in drainage DAIRY FARM N CYCLE
water mostly from urine Transfer rates kg/ha/grazing
patches ?
Figure 1.3. The transfers and losses of nitrogen from the soil-pasture system when 100
cows/ha eat 7.75 kg DM/cow/grazing.
Two grazings per day will be required for the cow to ingest the daily ration of 15.5 kg
DM/cow/day. For one grazing, the Friesian/Jersey cross cows (450 kg live weight) will be
stocked at 100 cows per hectare. Each cow will eat grass at a rate of 7.75 kg DM per
grazing; 100 cows will eat 775 kg DM/ha/grazing containing 36 kg N/ha (Figure 1.3). They
return 24.4 kg N as excreta, 7.3 kg N as dung and 17.1 kg N in urine.
© FLRC (Massey University) 1-8On average each cow will urinate 11 times per day (or 5.5 times per grazing) and will produce 12.5 dung patches per day (Haynes and Williams 1993). Eighty percent of the urine and dung patches will be deposited in the paddock and 20 % in the time taken to go to the milking shed and yards (Transfer loss, Figure 1.3). As 70 % of the excreta N (100 X 17.1/24.4) is returned in the urine patches, we will concentrate on the fate of the N in the urine patches. The average size of a urine patch is 0.28 m2 and the total area covered by the urine patches deposited by the 100 cows in one grazing is 0.012 ha (80 % of 5.5 urinations @ 0.28 m2 for 100 cows/10,000 m2 = 0.012ha or 1.2% of the grazed area). The 17 kg urine N deposited on 0.012 ha/grazing is equivalent to an application rate of 1390 kg N/ha within the area affected by urine. Annually, the N rich pasture (5 % N) in urine patches can be expected to take up around 700 kg N/ha. This equates to the annual pasture growth taking up 8.4 kg N in the area (0.012 ha) covered by urine patches from one grazing. Therefore after a year’s pasture growth, the area of pasture affected by urine (0.012 ha) still has an excess nitrogen load of 17.1 - 8.4 = 8.7 kg N, which has the potential to leach. If a hectare of pasture is grazed 10 times per year then urine patches will potentially generate an annual excess of 10 x 8.7 kg N/ha. This excess, 87 kg N/ha, has the potential to be leached with winter drainage as nitrate. This problem of nitrogen loads in urine patches being excess to soil and pasture N requirements is a problem that is being addressed by current research. It is the central cause of winter nitrate leaching from dairy farms. So far no-one has found an economic solution to this problem – can you think of possible solutions? 1.3 Conclusion There are many factors affecting nutrient cycling within the dairy production system. The interactions between the soil-plant-animal are complex. From soil tests fertiliser recommendations, both capital dressings and maintenance applications can be made. Nutrient budgeting software can assist in determining these recommendations and also highlight environmental issues concerning the farming system. The grazing animal has a strong influence on nutrient cycling within the system, particularly in nutrient transfer. This section has given a brief introduction to factors affecting nutrient cycling and the roles of nutrient management. The following sections will highlight the different soils and characteristics of soils used for dairying, the nutrient cycles within these soils, the fertilisers used on these farms, and information about soil water. © FLRC (Massey University) 1-9
References

During C. 1984. Fertilisers and soils in New Zealand farming. 361 pp.

Haynes R. J.; Williams P. H. 1993. Nutrient cycling and soil fertility in the grazed pasture
       ecosystem. Advances in Agronomy 49, 119-199.

Kuperus      W. 2002, Is Pasture Enough? South Island Dairy Event 2002.
           www.side.org.nz/index.cfm/Papers/2002/Trigger%20levels%20for%20utilising%
           20feed –

Test Your Knowledge – Section 1

Questions

1.    Is the return of phosphorus in cow dung viewed as a nutrient input to a farm or a
      potential transfer event?

2.    A dairy farmer on an Allophanic (Ash) soil in Taranaki has a paddock with an Olsen
      soil test of 22 mg P/L. Would you interpret this as :
      a.      Posing an environmental risk
      b.      Below the optimum target level for pasture growth on Allophanic soils.
      c.      A paddock that may need a capital input of P fertiliser.

3.    Describe two nutrient losses that do not leave the farm but make up a component of
      the P losses used to calculate a maintenance fertiliser requirement.

4.    List 3 soil tests useful for indicating the plant supply of nutrients in soils.

5.    Briefly explain why there is no useful N soil test.

6.    Briefly describe how cows grazing pasture lead to inefficient N recycling that leads
      to nitrate leaching losses.

Answers at back of this book.

© FLRC (Massey University)                                                              1-10
SECTION 2
2. Introduction to Soils Used for Dairy Farming
in New Zealand
Key Learning Objectives
After studying this section you should be able to:
1. Name the major soil orders used for dairy farming in New Zealand.
2. Explain the landscapes and climates associated with the major soil orders used for
dairy farming.
3. Describe some of the more important features of the profiles of these soils.
4. Explain the major limitations to dairy farming imposed by soil physical properties.
5. Discuss the management practices that may be employed to mitigate the impact of
these limitations.
6. Discuss the general nature of some of the environmental risks associated with dairy
farming.
7. Explain the primary physical limitations and strengths in each of the major soil orders
for dairy farming.
8. Explain the primary chemical limitations and strengths in each of the major soil
orders for dairy farming.
9. Provide recommendations on soil, fertiliser and grazing management strategies to
minimise the above limitations.
10. Explain the optimum soil fertility indices for each of the soil orders.
11. Describe the target rates of fertilisers to raise P, K, and S to adequate levels.
2.1 Introduction to soils
Dairy farming is dependent on reliable pasture growth to feed milking cows throughout the
year. Sustainable dairy farming requires land of flat to rolling contours with reliable rainfall
or water supply, and soils with good chemical, physical and biological properties. If the
soils are poor with respect to any of these properties, proper management practices should
be adopted to improve these properties. This section of the study guide presents the
important chemical and physical properties of the major soil orders in New Zealand where
dairy farming is practised. The soil limitations and strengths for sustainable dairying in
© FLRC (Massey University) 2-1these soils are highlighted and recommendations for minimising these limitations, if any, are presented. © FLRC (Massey University) 2-2
A confusing array of soil names are used to describe soils, depending upon who is
describing the soil. Agricultural advisers use the terms Sedimentary, Pumice, Volcanic
(Ash), Peats and Clays and Recent alluvial soils. These terms refer to soil parent materials
rather than the soil that has formed from the parent materials. In contrast, soil scientists
used old nomenclature (NZ Genetic Classification) to describe the soil that had formed
such as Yellow-Grey Earths, Yellow-Brown Earths, Yellow Brown loam soils etc., but
recently have changed their descriptions to Pallic soils, Brown soils and Allophanic soils,
respectively (NZ Soil Classification). All these terms are available in the Overseer drop
down lists.

When enrolled on one of Massey University’s Sustainable Nutrient Management or Farm
Environment Planning courses, you will be given a student login for the education version
of Overseer (called OverseerED).
        https://edu.overseer.org.nz/#/
Once you have set up the farm management blocks, you will be able to click any one of
these blocks to see the context in which the model requires soil information.

© FLRC (Massey University)                                                               2-3
The major orders of soils used for dairying are listed as follows. Allophanic Soils. Commonly formed from volcanic ash deposits. Formerly known as Yellow Brown loam soils (Waikato, Taranaki); Red and Brown loams and Brown Granular clays and loams (Northland, Waikato), and poorly drained (Gley) soils formed from volcanic ash (Waikato). Brown Soils. Formerly known as Yellow-Brown Earths. These are terrace soils with reasonable drainage under moderate (Southland) to high rainfall (West Coast) or free- draining stony-plains soils under low rainfall (Canterbury/North Otago); or moderately to highly leached soils under moderate rainfall (Northland). These soils have been mainly formed from sedimentary rocks such as greywacke, sandstone and mudstone and is the most common soil order in NZ. Pallic Soils. Formerly known as Yellow-Grey Earths. These are poorly drained terrace (Manawatu) or rolling (South Otago) soils under moderate rainfall. These soils have been mainly formed on wind-blown loess from eroded sedimentary rocks such as greywacke, sandstone and mudstone. Recent Soils. These soils have been mainly formed on alluvial and fluvial material deposited by rivers and streams that have eroded sedimentary rocks such as greywacke, sandstone and mudstone. Pumice Soils. Formerly known as Yellow Brown Pumice Soils and the Gley soils formed from pumice (Bay of Plenty, Central Plateau). These soils, although volcanic in origin, have different properties to the Allophanic soils above. Peat or Organic Soils. Not included in this section. These soils have little or no mineral matter, and are made up of plant residues. They occur predominantly in the greater Waikato region. © FLRC (Massey University) 2-4
New Zealand Soils Portal
This can be found at: https://soils.landcareresearch.co.nz/soil-data/the-lris-portal/

Soil names and the distribution of soils
Within the NZ Soils Portal, go to: https://soils.landcareresearch.co.nz/describing-
soils/nzsc/soil-order/

© FLRC (Massey University)                                                              2-5
How to study this section

The information on soils in this section is given in tabular form. For each soil create your
own table of key points. You may need to refer to Sections 4 and 5 to interpret the fertiliser
and soil terms.

  Soil Property                     Value

  Soil Name

  Rainfall regime

  Dominant parent material
  (see pages 2-2 to 2-3)

  Topography

  Key physical limitations

  Key soil fertility limitations

  Optimum Olsen P soil test

© FLRC (Massey University)                                                                 2-6
Pallic Soils
                             Climate, landscape and soil profile
                             • Pallic Soils often form under sub-humid climates (500 to
                               1100 mm rainfall) where the winters are wet and the
                               summers are dry.
                             • Pallic Soils are found predominately on flat and
                               undulating landscapes.
                             • There is a marked contrast between the textures of the
                               topsoil and the subsoil of Pallic Soils. The surface soil
                               (0 to 18 cm) is silt loam in texture and it has a weak to
                               moderate nut and block structure with friable
                               consistence. At approximately 30 cm, the soil grades
                               into a strongly mottled silty clay loam with coarse block
                               structure and firm consistence. The very impermeable
                               nature of the subsoil is one of the defining
                               characteristics of Pallic Soils.

                             Limitations/advantages of soil physical properties
                             • Pallic Soils tend to have very poor natural drainage
                               (perched water table).
                             • Where these soils are used for intensive grazing,
                               treading damage is invariably a major problem.
                             • These soils are prone to compaction if they are routinely
                               tilled for crop production.
                             • They tend to be dry in summer and bake hard. Available
                               water holding capacity of these soils is moderate (e.g.
                               70 mm in the root zone).

                             Overcoming the limitations of soil physical properties
                             • Artificial drainage systems (typically mole-pipe
                               networks) are required if Pallic Soils are to be used for
                               intensive farming.
                             • In addition, farmers often practise different forms of ‘on-
                               off’ grazing to minimise treading damage. On dairy
                               farms, feedpads can be used to keep cows off wet
                               paddocks. A number of farmers irrigate these soils to
                               great effect.
                             • All of the field operations associated with tillage and
                               harvesting of crops need to be carefully timed and kept
                               to a minimum.

                             Environmental issues
                             • Rapid drainage through the cracks in the soil
                               generated by the mole plough may transport nutrients
                               to surface water bodies. The impermeable nature of
                               the soil and the susceptibility to treading damage
                               means that excess water, which is rich in P, can run off
                               the surface of these soils. Managing land application
                               of FDE to these soils is a challenge.

© FLRC (Massey University)                                                        2-7
Soil Fertility in Pallic Soils
Soil Property Low- Optimum Soil Chemical Properties
medium
Soil pH 5.7–5.9 5.8–6.0 Low P retention
Olsen P (mg P/L) 11–13 20–30 Low available P and S
Sulphate-S 4–5 10–12
QT K 8 6–8 Adequate K and Mg
QT Mg 30–33 Pasture 8–10,
Animal 25–30
% P retention 10 - 20
(Anion Sorption
capacity)
The relationship between relative pasture Amount of nutrient to add as fertiliser to
production and Olsen P for Pallic Soils raise soil test values by one unit.
(Sedimentary soils – Overseer).
Type of Range (kg Common
soil test element/ha) fertiliser
Olsen P 20 P to raise
4–7 SSP
Olsen 1 unit
K to raise KCl in
(Recent, Pallic 100-250
Quick Test SSP
and Brown Soils)
S to
overcome 30-40 SSP/S0
deficiency
On average, near maximum pasture production
is achieved at Olsen P 20.
Figure 2.1
Pallic Soil distribution
Pallic Soils or Yellow-Grey Earths– poorly
drained terrace (Manawatu) or rolling (South
Otago) soils under moderate rainfall. Other soil
groups of lesser area include Yellow Brown
sands (Manawatu, Northland), Recent alluvial
(all regions) and Gley podzol (pakihi) soils.
These soils have been mainly formed on wind
blown loess from sedimentary rocks such as
greywacke, sandstone and mudstone.
© FLRC (Massey University) 2-8Brown Soils
Climate, landscape and soil profile
• Brown Soils are generally found in
humid areas i.e. more than 1000 mm
rainfall.
• Brown Soils are found on a wider
range of landscapes from flat river
terraces to hill country.
• The profile of most Brown Soil is
relatively uniform with depth. The soil
texture is typically silt loam and the
structure is strong nut with friable
consistence. Some Brown Soils have
greater clay contents in the subsoil.
Limitations/advantages of soil physical
properties
• Generally, Brown Soils are free
draining. However, those Brown Soils
with larger clay contents may require
artificial drainage systems (mole –
pipe).
• The moderate structure of Brown Soils
makes them suitable for cultivation.
• Organic matter content is generally
low.
• These soils tend to be moist most
seasons and have a relatively large
available water holding capacity (e.g.
100 mm in the root zone).
Overcoming the limitations of soil
physical properties
• Generally speaking soil physical
properties are relatively easy to
manage on Brown Soils as they are
reasonably well structured, have free
drainage and tend to form in moist
environments.
• Some Brown Soils have a wetness
limitation and will need artificial
drainage and careful management.
Environmental issues
• The fertile nature of Brown Soils lends
them to intensive use (e.g. high
stocking rates). There is a large
quantity of drainage from these soils.
These features are likely to result in
significant losses of nutrients in
drainage water (e.g. upwards of 50 kg
N ha-1 per year).
© FLRC (Massey University) 2-9Soil Fertility in Brown Soils
Low-
Soil Property Optimum
medium Soil Chemical Properties
Soil pH 5.7–5.8 5.8–6.0
Medium P retention
Olsen P (mg P/L) 12–14 20–30
Sulphate-S 4–6 10–12 Low available P and S
QT K 6–8 6–8
Adequate K and Mg
Pasture 8–10,
QT Mg 17–31
Animal 25–30
% P retention
(Anion Sorption 30- 60
capacity)
The relationship between relative pasture Amount of nutrient to add as fertiliser
production and Olsen P for Brown Soils to raise soil test values by one unit.
(Sedimentary soils – Overseer).
Type of Range Common
soil test (kg element/ha) fertiliser
Olsen P 20
P to raise
Olsen 1 4–7 SSP
unit
(Recent, Pallic
and Brown Soils) K to raise KCl in
100-250
Quick Test SSP
S to
overcome 30-40 SSP/S0
On average, near maximum pasture production is deficiency
achieved at Olsen P 20.
Figure 2.2
Brown Soil distribution
Brown Soils or Yellow-Brown Earths – terrace
soils with reasonable drainage under moderate
(Southland) to high rainfall (West Coast) or free
draining stony plains soils under low rainfall
(Canterbury/North Otago); moderately to highly
leached soils under moderate rainfall
(Northland). These soils have been mainly
formed from sedimentary rocks such as
greywacke, sandstone and mudstone.
© FLRC (Massey University) 2-10Recent Soils (from alluvium)
Climate, landscape and soil profile
• Recent Soils are found on floodplains, low
terraces and young fans.
• Recent Soils form under a wide range of
climates from relatively dry through to
moist.
• Recent Soils also vary greatly in texture.
Some Recent Soils are coarse textured
(e.g. sandy loam), very shallow and
underlain by stones whilst others are quite
fine textured (silty clay loam) and are
impermeable (not unlike Pallic Soils in
some ways).
• Recent Soils from alluvium are one of
NZ’s most valuable soil resources.
Limitations/advantages of soil physical
properties
• Coarse textured, Recent Soils often have
excessive drainage, which is an
advantage in wet winters but is a decided
limitation in summer (they may store as
little as 25 mm RAW [readily available
water] in the root zone).
• Fine textured Recent Soils may have poor
natural drainage.
• As a general rule, Recent Soils lend
themselves to intensive use.
Overcoming the limitations of soil physical
properties
• Irrigation has been used very successfully
on coarse textured Recent Soils. Very
large responses to irrigation have been
measured on shallow Recent Soils.
• Recent Soils with fine textures often
benefit from artificial drainage systems.
Environmental issues
• As Recent Soils are often subjected to
intensive use, the input of nutrients into
production systems is high. In shallow
coarse textured Recent Soils, rapid
nutrient movement can occur to
groundwater.
• In fine textured Recent Soils with artificial
drainage systems, nutrients may be
conveyed to surface waters.
© FLRC (Massey University) 2-11Soil Fertility in Recent Soils
Low-
Soil Property Optimum
medium Soil Chemical Properties
Soil pH 5.8–5.9 5.8–6.0
Low P retention
Olsen P (mg P/L) 15–17 20–30
Sulphate-S 4–7 10–12 Low available P and S
QT K 5–9 6–8
Adequate K and Mg
Pasture 8–10,
QT Mg 23–34
Animal 25–30
% P retention
(Anion Sorption 10 - 20
capacity)
The relationship between relative pasture Amount of nutrient to add as fertiliser to
production and Olsen P for Recent Soils raise soil test values by one unit
(Sedimentary soils – Overseer).
Type of soil Range Common
test (kg element/ha) fertiliser
Olsen P 20
P to raise
4-7 SSP
Olsen 1 unit
(Recent, Pallic K to raise KCl in
and Brown Soils) 100-250
Quick Test SSP
S to
overcome 30-40 SSP/S0
deficiency
On average, near maximum pasture production is
achieved at Olsen P 20.
© FLRC (Massey University) 2-12Figure 2.3
Recent Soil distribution
Recent Soils. These soils have been mainly
formed on alluvial and fluvial material deposited
by rivers and streams eroded from sedimentary
rocks such as greywacke, sandstone and
mudstone.
© FLRC (Massey University) 2-13Allophanic Soils
Climate, landscape and soil profile
• These Allophanic Soils are associated,
principally, with humid areas (1000-2000
mm of rainfall). The soil is moist for most
of the year.
• These Allophanic Soils are found on a
wide range of landscapes from flat, river
and marine terraces to rolling hill country.
• The surface soils are often loam to sandy
loam in texture. They are friable with
strong fine nut and granule structures.
• The subsoils are of similar textures and
have moderate to strong fine nut, granule
or crumb structures.
Limitations/advantages of soil physical
properties
• Allophane stabilises organic matter
allowing it to accumulate in the topsoil.
• Allophane also promotes good soil
structure.
• These soils are free draining.
• They also store large amounts of
available water (80 – 100 mm in the root
zone).
Management of physical properties
• Grazing and soil tillage can safely take
place at a wide range of soil moisture
contents. These soils are said to be
‘resilient’.
Environmental issues
• As for Brown Soils, the fertile nature of
Allophanic Soils lends them to very
intensive use. There is a large quantity of
drainage from these soils. These
features are likely to result in significant
losses of nutrients in drainage water (e.g.
upwards of 50 kg N ha-1 per year).
© FLRC (Massey University) 2-14Soil Fertility in Allophanic Soils
Low-
Soil Property Optimum
medium Soil Chemical Properties
Soil pH 5.7–5.8 5.8–6.0
Very high P retention
Olsen P (mg P/L) 14–17 20–30
Sulphate-S 6–12 10–12 Low available P, K and Mg
QT K 3–7 7–10
Pasture 8–10,
QT Mg 11–19
Animal 25–30
% P retention
(Anion Sorption 85-95
capacity)
The relationship between relative pasture Amount of nutrient to add as fertiliser to
production and Olsen P for Allophanic Soils raise soil test values by one unit
(Ash soils – Overseer).
Type of soil Range Common
test (kg element/ha) fertiliser
P to raise
7-18 SSP
Olsen 1 unit
K to raise KCl in
45-80
Quick Test SSP
S to
overcome 20-30 SSP/S0
deficiency
On average, near maximum pasture production
is achieved at Olsen P 22.
Figure 2.4
Allophanic Soil distribution
Allophanic Soils (Ash soils) such as Yellow
Brown loam soils (Waikato, Taranaki), Red and
Brown loams; Brown Granular clays and loams
(Northland, Waikato), and the poorly drained
(gley) soils formed from volcanic ash (Waikato).
© FLRC (Massey University) 2-15Pumice Soils
Climate, landscape and soil profile
• Pumice Soils are formed in a range of
climates (rainfalls of 1000 to 2000 mm;
cool in the vicinity of Lake Taupo and
warm in the Bay of Plenty).
• These soils are found on flat to rolling
landscapes.
• Pumice Soils are formed in coarse,
gravelly deposits. These soils have thin
dark surface soil (0-15 cm) with
moderate crumb and granule structure
over yellowish brown soil with weak
crumb structure (to a depth of 45 cm).
Limitations/advantages of soil physical
properties
• Pumice Soils store only very small
quantities of available water (as little as
20 to 30 mm in the root zone).
• These soils are excessively well drained
and so are, generally speaking, relatively
easy soils to manage in winter months.
Overcoming the limitations of soil
physical properties
• Plant production on Pumice Soils will
often benefit enormously from irrigation.
Environmental issues
• Pumice Soils are often in environmentally
sensitive areas and the nutrients lost
from these soils may impact upon some
of our most pristine and valuable surface
water bodies (the central North Island
lakes being the most obvious example).
© FLRC (Massey University) 2-16Soil Fertility in Pumice Soils
Low-
Soil Property mediu Optimum Soil Chemical Properties
m
Soil pH 5.7 5.8–6.0 Medium P retention
Olsen P (mg P/L) 9 35–45
Low available P, S, K, Mg
Sulphate-S 3 10–12
QT K 5 7–10 Generally cobalt deficiency in animals
Pasture 8–10,
QT Mg 11
Animal 25–30
% P retention
(Anion Sorption 50 -60
capacity)
The relationship between relative pasture Amount of nutrient to add as fertiliser to
production and Olsen P for Pumice soils. raise soil test values by one unit
Type of soil Range Common
test (kg element/ha) fertiliser
P to raise
4-15 SSP
Olsen 1 unit
K to raise KCl in
35-60
Quick Test SSP
S to
overcome 40-50 SSP/S0
deficiency
On average, near maximum pasture production is
achieved at Olsen P 38.
© FLRC (Massey University) 2-17Figure 2.5
Pumice Soil distribution
Pumice Soils such as Yellow Brown Pumice
Soils and Gley Soils formed from pumice (Bay
of Plenty, Central Plateau). These soils,
although volcanic in origin, have different
properties to the Allophanic Soils above.
© FLRC (Massey University) 2-18References
During C (1984) Fertilisers and soils in New Zealand farming. P. D. Hasselberg,
Government Printer, Wellington, New Zealand.
Roberts AHC, Morton JD (1999) Fertiliser use on New Zealand dairy farms. New Zealand
Fertiliser Manufacturers’ Association, Auckland, New Zealand.
Wheeler DM, Roberts AHC (1997) Soil fertility status of sheep/beef and dairy farms in NZ:
1988–91. New Zealand Soil News 45: 90–97.
Test Your Knowledge – Section 2
Questions
1. Select a farm with which you are familiar. Describe the important features of the
landscape, climate and soil of this farm.
2. Discuss how these features impact on production levels on this farm and on key
management decisions.
3. Arrange the following soil groups in order of increasing phosphate retention:
Allophanic Soil, Pallic Soil, Brown Soil, Recent Soil, Pumice Soil
4. A farm on a Pallic Soil has an Olsen P of 18 mg/L. For optimum pasture production
in this soil type the Olsen P needs to be 25 mg/L. How much single superphosphate
needs to be applied to reach this optimum production?
Answers at back of this book.
© FLRC (Massey University) 2-19SECTION 3
3. Nutrient uptake by pasture from soils.
Key Learning Objectives
After studying this section you should be able to:
1. Describe the sources (soil or atmosphere) of four (4) major and two (2) minor
essential elements required for pasture growth.
2. Write the chemical symbols for the ions of phosphate, nitrate, sulphate, potassium ,
calcium and magnesium that are taken up during pasture growth.
3. Briefly describe the role of three (3) major and two (2) minor elements in plant
nutrition.
4. Briefly describe how exchangeable magnesium and potassium are held in soils.
5. Describe the reserve, slow soluble sources of potassium and nitrogen in soils.
6. Explain the term cation exchange capacity (CEC) and identify soil properties that
lead to differences in CEC.
7. Briefly describe the process of phosphate sorption.
8. Identify soil groups that have differing phosphate retention capacities.
9. Describe the optimum pHs for pasture growth in mineral and peat soils.
10. Describe 2 elements that may become toxic to plants if soils become more acidic.
11. Explain why the addition of lime raises soil pH and increases biological activity in
soils.
12. List two of New Zealand’s most common liming materials and their calcium
carbonate equivalents.
© FLRC (Massey University) 3-13.1 The pasture and its nutrition
In New Zealand we have an international reputation for producing milk from grazed
pastures. In Section 1, we described how a Friesian/Jersey cross cow (450 kg liveweight)
producing an average of 1.6 kg milk solids (MS) per day needs approximately 15.5 kg dry
matter (DM) of good quality (11.3 MJME/ kg DM) pasture per day to maintain body
condition and milk production. The energy, carbohydrate and protein composition of good
quality pasture was shown in Table 1.2.
This good quality pasture requires 18 essential elements to grow.
The non- mineral elements carbon (chemical symbol, C), hydrogen (H) and oxygen (O)
are derived from carbon dioxide (CO2) gas in the atmosphere or water (H2O). In leaves
of pasture plants C, H and O are synthesised into carbohydrates (CH2O) using energy
from sunlight in the process called photosynthesis, which can be summarised as follows:
light energy
Carbon dioxide + water oxygen + carbohydrates
or, using chemical formulae, we may write:
6CO2 + 6H2O 6O2 + 6 (CH2O)
The carbohydrates are used as the building blocks for pasture plants to manufacture
proteins, lipids and other organic compounds, which combined contribute to 85-90 % of
pasture dry matter (Table 1.2). Particularly important plant compounds, the proteins, are
made when the essential element nitrogen (N) is chemically combined with organic
compounds. For legumes such as clover and lotus, N can also be obtained by biological
nitrogen fixation from the nitrogen gas (N2) that makes up 80 % of the atmosphere.
Mineral elements from the soil
For pasture grasses and herbs (non- legumes), however, N must be derived from the soil.
Nitrogen is just one of 16 mineral elements essential for plant growth (see Table 3.2) that
must be taken up from the soil by plant roots (that is, unless foliar fertilisers are used). For
plant uptake to occur the essential element must be in a water soluble form in order to
pass from the soil, through the root to the growing areas of the plant.
© FLRC (Massey University) 3-23.2 The Form of Nutrients Taken Up by Pasture Plants
For mineral elements to be soluble in the soil water, they must be present as extremely
small particles called ions before they can pass across the membranes of the plant root
cells and enter the plant. The mineral salts in the soil (and most fertilisers) are ionic
compounds such as potassium nitrate (symbols KNO3). These ionic compounds dissolve
in water to form their component charged ions. The ions separate in water because the
polar nature of the water molecules (positively charged hydrogens and negatively charged
oxygen) act to ‘pull’ the ionic components apart. Each ion becomes surrounded with a
cloud of oriented water molecules keeping them apart. The attraction between a polar
water molecule and a nutrient ion is greater than the attraction of the two ions for each
other.
H 2O
KNO3 _ K+ + NO3–
salt in water solution of ions in water
+
H H
O
-
H H
+
H
O- K+ - O H
+ -O
-O
H H
+
H H
H H
+ -O + NO3- + O-
H H
+
H H
O
-
Such K+ and NO3– ions surrounded by water molecules are said to be hydrated ions.
Positively charged ions of elements such as K+ are called cations and negatively charged
ions of elements such as chloride (Cl–) are called anions. Compounds such as ammonium
(NH4+), phosphate (H2PO4–) and nitrate (NO3–) also form water soluble cations and anions.
It is these hydrated ions which are taken up by plant roots. The forms of ions taken up are
listed in Table 3.1.
© FLRC (Massey University) 3-3Table 3.1 Essential Mineral Elements and Role in Plants
Element Ion forms taken
Role in Plants
(Chemical Symbol) up by plants
Macronutrients
Constituent of all proteins, chlorophyll, and in
Nitrogen (N) NH4+, NO3–
coenzymes and nucleic acids
Important in energy transfer as part of adenosine
triphosphate. Constituent of many proteins,
Phosphorus (P) H2PO4–, HPO42–
coenzymes, nucleic acids and metabolic
substrates.
Involved in osmotic pressure control. Functions in
Potassium (K) regulatory mechanisms such as photosynthesis, K+
carbohydrate translocation, protein synthesis etc.
Cell wall component. Plays role in the structure
Calcium (Ca) Ca2+
and permeability of membranes.
Magnesium (Mg) Constituent of chlorophyll and enzyme activator Mg2+
Sulphur (S) Important constituent of plant proteins SO42–, SO2 g
Essential for some C4 plants (e.g. guinea grass)
Sodium (Na) but not essential for the low concentrations found Na+
in common pasture grasses
Micronutrients
Boron (B) Important for reproductive processes, sugar H3BO3, Boric acid
translocation and carbohydrate metabolism.
Iron (Fe) Chlorophyll synthesis and in enzymes for electron Fe2+
transfer
Manganese (Mn) Controls several oxidation-reduction systems, Mn2+
formation of O2 in photosynthesis
Copper (Cu) Catalyst for respiration, enzyme constituent. Cu2+
Zinc (Zn) In enzyme systems that regulate various Zn2+
metabolic activities
Molybdenum (Mo) In nitrogenase needed for nitrogen fixation MoO42–
Cobalt (Co) Essential for symbiotic nitrogen fixation by Co2+
Rhizobium
Chlorine (Cl) Activities system for production of O2 in Cl–
photosynthesis
Silicon (Si) Si improves plant resistance to fungal attack and H4SiO4 ,Silicic acid
appears to have roles in heavy metal and drought
tolerance
© FLRC (Massey University) 3-43.3 The Role of the Soil Water
Up to 50 % of topsoil volume in the field is pore space (Figure 3.1). Plant roots grow through
this pore space. Generally the soil pore space is very irregular in shape, while plant roots
and root hairs are cylindrical.
Transpiration
95% of water transpired is
Solar radiation used to cool the leaves as
they absorb solar radiation
CO2
Shoot
Soil organo-mineral particles Soil air
Roots absorb water Soil water
and inorganic ions e.g.
Anions Cations
NO3- K+
SO42- Ca2+
H2 PO4- Mg2+
Figure 3.1 The uptake of nutrient ions and water from soil
Figure 3.2 provides a cartoon concept of how the different nutrient ions are held on the soil
particles in relation to a root hair. This difference in shapes leads to poor contact between
soil surfaces and root surfaces. Commonly less than 40 % of the root surface directly
contacts a soil surface. Fortunately in a moist soil the small gaps between soil particles
and between roots and soil particles are readily filled with water by the process called
capillarity (the attraction of polar water molecules to the electrically charged soil surfaces).
This thin soil water film connects the root surface, the sink for nutrient ions, with the soil
mineral and soil organic matter surfaces that are the sources of nutrient ions (Figure 3.2).
Thus as soil water is sucked up by plant roots to replace water evaporated from leaves
(Figure 3.1) nutrients are transported from the soil to the leaf.
© FLRC (Massey University) 3-5You can also read