Transit-Oriented for All: The Case for Mixed-Income Transit-Oriented Communities in the Bay Area - Center for Community Innovation
←
→
Page content transcription
If your browser does not render page correctly, please read the page content below
Transit-Oriented for All:
The Case for Mixed-Income Transit-Oriented Communities in the Bay Area

                                A Great Communities Collaborative Framing Paper

                                                     The Non-Profit Housing Association of Northern California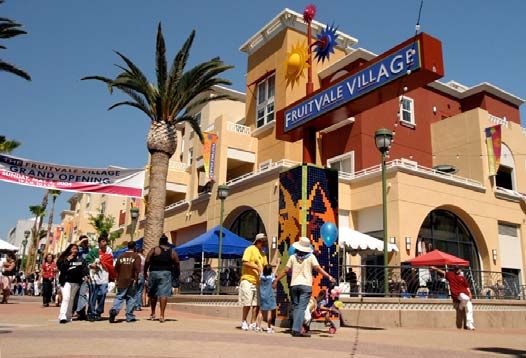
Transit-Oriented for All:
The Case for Mixed-Income Transit-Oriented Communities in the Bay Area
The Great Communities Collaborative
The Great Communities Collaborative is a unique cooperative relationship between four Bay
Area nonprofit organizations – Greenbelt Alliance, the Nonprofit Housing Association of
Northern California, the Transportation and Land Use Coalition, and Urban Habitat – along
with the national nonprofit Reconnecting America, and UC Berkeley’s Center for Community
Innovation. The goal of the Collaborative is for half of the Bay Area’s new homes between now
and 2030 to be located in walkable neighborhoods near transit.

This paper was funded by:
The San Francisco Foundation
The East Bay Community Foundation
University of California Transportation Center

June 2007
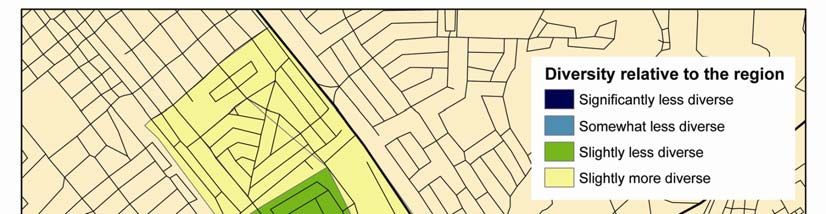
Table of Contents
I. INTRODUCTION.......................................................................................................4
II. THE REGIONAL CONTEXT......................................................................................6
How Traffic Congestion and Unaffordable Housing are Related........................................................... 6
“Driving to Affordability” Undercuts Housing Savings......................................................................... 7
Income Diversity is Declining in the Bay Area ..................................................................................... 8
III. CHALLENGES AND OPPORTUNITIES................................................................... 12
The Potential of New Transit Investments........................................................................................... 13
The Growing Demand for Housing near Transit – A Challenge and an Opportunity........................... 13
A Closing Window for Low and Moderate Income Households.......................................................... 14
IV. THE SYNERGIES OF MIXED-INCOME TRANSIT-ORIENTED COMMUNITIES ....... 16
The Benefits of Transit-Oriented Communities................................................................................... 17
The Benefits of Mixed-Income Neighborhoods .................................................................................. 19
Joining Forces: Bringing Mixed-Income and Transit-Oriented Communities Together ...................... 21
V. ELEMENTS OF STABLE MIXED-INCOME NEIGHBORHOODS ............................... 25
VI. CASE STUDIES..................................................................................................... 27
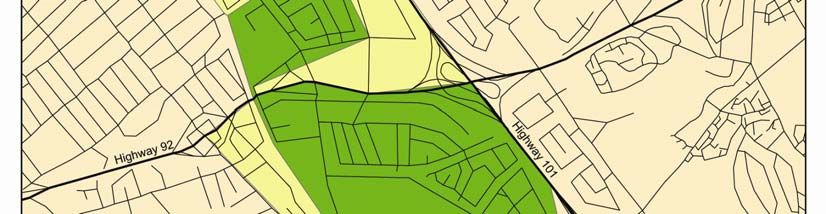
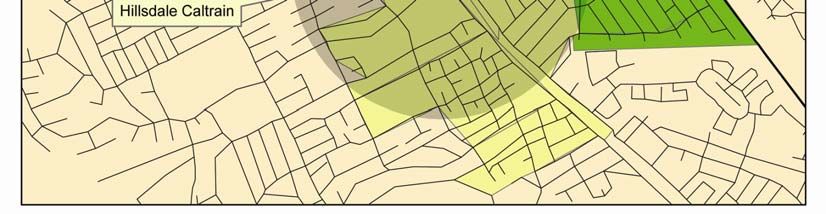
Case Study 1: San Mateo Bay Meadows ............................................................................................. 27
Case Study 2: Fruitvale Transit Village .............................................................................................. 33
VII. LESSONS FOR MOVING FORWARD.................................................................... 41
3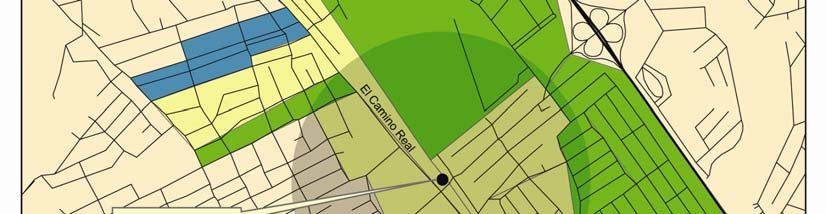
I. Introduction

The San Francisco Bay Area is expected to grow significantly over the next 30 years, with an
additional 1.9 million people and 1.8 million jobs projected by 2035. 1 This growth is driven by a
remarkably resilient Bay Area economy. New industries drawing investment capital, including
biotech and emerging green industries, demonstrate the region’s ability to reinvent itself, spur
innovation and remain integral to the global economy. Given the ongoing strength of the Bay
Area economy, and the continued appeal of the region’s natural amenities and cultural richness,
there is increasing need to find appropriate locations for housing the economy’s workforce and
to ensure all Bay Area residents can participate in the regional economy.

Four leading Bay Area nonprofits, two foundations, and a national nonprofit have joined
together to form the Great Communities Collaborative, with the aim of shifting regional growth
so it is more equitable and sustainable. To address the region’s housing crisis, improve
neighborhoods, and make the best possible use of new public transit investments, the
Collaborative seeks to ensure half of all new homes built by 2030 are in walkable communities
located near transit, at a range of prices affordable to families of all income levels.

In support of these efforts, this paper articulates the rationale for expanding mixed-income
transit-oriented development (TOD) across the Bay Area region. With considerable new
regional investments in transit planned for the coming decade, now is a particularly ripe
moment to plan for more supportive land uses and to maximize opportunities for housing for a
full range of income levels in areas with easy access to transit. Regional investments in transit
have the potential to help alleviate housing affordability pressures, provide wider access to jobs
and address mounting traffic congestion. But much hinges on the kind of development, and the
affordability of housing, that grows up around new and future transit stations.

This paper summarizes the case for mixed-income TOD in the Bay Area, and outlines factors to
consider for achieving sustainable mixed-income TOD in multiple contexts. It is written for a
range of actors, sharing a vested interest in making regional growth more equitable and
sustainable – from nonprofit housing developers to city elected officials, transit agency staff,
for-profit developers, regional advocacy coalitions and local community organizations.

1   Association of Bay Area Governments, Projections 2007.

                                                             4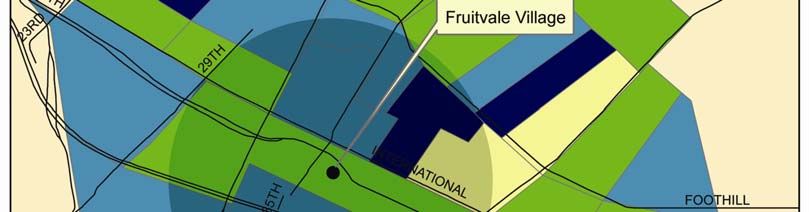
Report Overview

This report begins by looking at the need for mixed-income transit-oriented communities in the
Bay Area. Chapter II discusses the combined housing plus transportation cost burden faced by
lower-income households in the Bay Area, and the need to provide affordable housing in
locations where transportation costs don’t undercut housing savings. Chapter II also tracks the
region’s declining income diversity and the costs that accompany income segregation.

Chapter III reviews the challenges to mixed-income TOD presented by the high costs of new
TOD development and the potential for displacement of nearby low-income residents. The
chapter also looks at the opportunities embodied in increasing demand for TOD and in the
substantial new investments being made in regional transit service and TOD-supportive
infrastructure.

Chapter IV examines the separate benefits of transit-oriented communities and mixed-income
neighborhoods, and the synergies that result from bringing the two together.

The paper concludes with an initial discussion of what it will take to achieve mixed-income
TOD in various contexts. Chapter V discusses common traits of stable mixed-income
neighborhoods that avoid “tipping” into places that are predominantly high or low income.
Chapter VI reviews the experience of two, recent, high-profile TOD projects – San Mateo’s Bay
Meadows and the Fruitvale Transit Village – to explore their impact in creating a stable mix of
incomes near transit, and the lessons they may offer for other cities. Chapter VII concludes with
general lessons for achieving stable, mixed-income, transit-oriented communities in various
contexts.

                                                5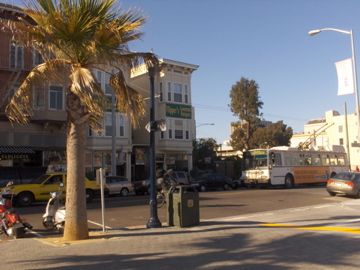
II. The Regional Context

How Traffic Congestion and Unaffordable Housing are Related

Living in the Bay Area comes at a steep price. The combination of unaffordable housing, traffic
congestion and long commutes take a heavy toll on the region’s residents, with the heaviest
burden shouldered by lower-income households. For the 10th straight year, Bay Area residents
named “road congestion, transit and road conditions” the most important problem facing the
region in 2007, followed closely by “housing costs and availability.” 2

Indeed, the Bay Area is one of the most expensive and difficult housing markets in the country. 3
While a third of all households nationwide pay more than the recommended 30 percent of
income on housing, nearly half of Bay Area households pay too much. 4 In the past seven years,
the percentage of Bay Area residents who can afford the median priced home has dropped
steadily – from 27 percent in 1999 to 12 percent in 2005. 5 A minimum wage employee would
have to work at least 106 hours per week to afford a Bay Area studio at fair market rent, 6 and
more than 126 hours per week for a one-bedroom. 7 Many Bay Area households escape
unaffordable housing payments by living in overcrowded conditions, with Santa Clara, San
Francisco, San Mateo and Alameda counties ranking among the top 100 counties in the US for
overcrowding. 8

Meanwhile the Bay Area experiences the second worst annual delay per commuter in the
country. The average Bay Area traveler loses three days (72 hours) per year in stalled traffic, to
say nothing of long commutes that steal time from family, education and other pursuits – even
when traffic is moving freely. 9 The percent of commuters traveling more than 45 minutes to
work is the second highest in the nation (21 percent). 10

The Bay Area’s worsening traffic conditions are fundamentally linked to the limited supply of
quality affordable housing near the region’s employment centers and near high-quality transit.

2 Bay Area Council, Bay Area Council Poll – General Trends (1995-2007), 2007.
3 National Association of Realtors; National Low-Income Housing Coalition, Out of Reach 2006.
4 American Community Survey, 2004.
5 ABAG, A Place to Call Home: Housing in the San Francisco Bay Area, 2006, p.2. “Affordable” housing costs are defined here as 30

percent of income – the prevailing standard used by the US Department of Housing (HUD).
6 Fair Market Rents typically represent the 40th percentile of combined shelter and utility costs by recent movers, as calculated by the

US Department of Housing and Urban Development (HUD).
7 California Budget Project, The Rising Tide Left Some Boats Behind: Boom, Bust & Beyond in the San Francisco Bay Area, December 2005.
8 ABAG, A Place to Call Home: Housing in the San Francisco Bay Area, 2006.

9 Schrank, David and Tim Lomax, “The 2005 Urban Mobility Report,” Texas Transportation Institute, May 2005.
10 Bay Area Council, Bay Area Economic Forum and the Association of Bay Area Governments, 2006.

                                                                   6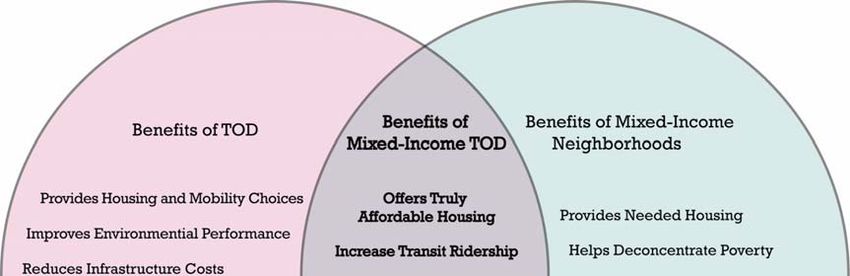
As the region’s population grew dramatically over the past ten years, housing production failed
to keep pace, particularly in the region’s employment core. The California Department of
Housing and Community Development estimates the Bay Area region needed to produce
230,000 housing units between 1999 and 2006 to meet the region’s housing needs. Only 73
percent of these units were produced. 11

Relatively affordable housing is increasingly built outside the region altogether – if not at the
region’s edges – in cities like Tracy and other parts of the Central Valley, as well as Brentwood,
Oakley, Antioch and Fairfield – where regional transit is limited and employment centers
distant. In job-rich areas, cities have consistently under-produced their share of regional
housing demand, contributing to surging prices and shortages of housing affordable to
moderate, low and very-low income households. 12

As a whole, between 1999 and 2006, the Bay Area produced only:

     •   72 percent of needed low-income housing,
     •   29 percent of needed moderate income housing, and
     •   35 percent of needed very low-income housing. 13

Affordable housing for moderate-income households is particularly uncommon in the Bay
Area, due in part to the fact that affordable housing assistance is frequently targeted at low-
income households, while market rate homeownership opportunities are priced out of reach.

“Driving to Affordability” Undercuts Housing Savings

With much of the region’s affordable housing being built at the periphery, many Bay Area
households are forced to endure long commutes, coupled with high transportation costs, to find
housing they can afford. But for many households, long commutes and greater reliance on the
car eat up much of what is saved on housing, especially when car payments, insurance, gas,
parking and car repairs are considered.

Lower-income households are already hit particularly hard by the region’s affordable housing
crisis. The scope of the affordability crisis broadens when we consider the combined housing
plus transportation cost burden faced by lower-income households.

11 ABAG, A Place to Call Home: Housing in the San Francisco Bay Area, 2006.
12 “Moderate-income” households are defined here as earning between 80 and 120 percent of Area Median Income (AMI), “low-
income” as those earning between 50 and 80 percent of AMI, and “very low-income” as those earning less than 50 percent of AMI.
13 ABAG, A Place to Call Home: Housing in the San Francisco Bay Area, 2006.

                                                               7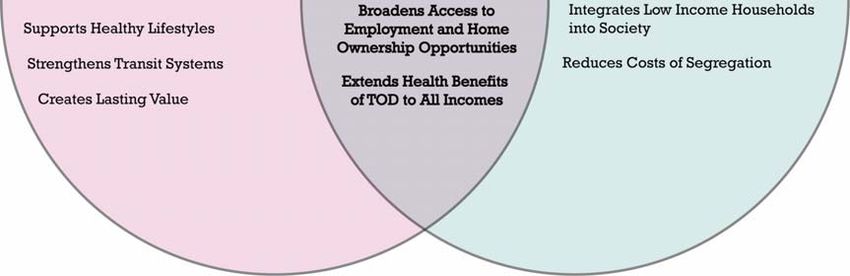
High transportation costs consume a greater percentage of income for low-income households
than for wealthier households, especially in auto-dependent areas. As a result, most low-
income Bay Area households end up with a combined housing and transportation burden that
is beyond their means. 14 The Center for Neighborhood Technology (CNT) and Center for
Transit-Oriented Development (CTOD) have created an Affordability Index to help characterize
this burden. For families earning between $20,000 and $50,000, CNT and CTOD found
combined housing and transportation costs average 63 percent of household income in the Bay
Area – the highest combined housing/transportation burden for this income bracket anywhere
in the country. With an average of 35 percent of income dedicated to housing plus an additional
27 percent for transportation, very little income remains for other household necessities,
including food, education and health care. 15 Figure 1 shows how housing and transportation
costs vary for other income brackets.

Figure 1: Percentage of Income Spent on Housing and Transportation in the Bay Area

     Household
Using an absolute measure of income diversity, which measures the extent to which
neighborhoods show equal representation in all income categories, 18 the CCI found the median
income diversity level in the Bay Area declined slightly from 1980 to 2000. Figure 2 shows
where income segregation was greatest in the Bay Area in 1980, with the darkest shades
representing the highest levels of income segregation and the lightest shades representing high
diversity; cross-hatching highlights low-income areas (with family median income below 80
percent of the regional median income).
Figure 2: In 1980, income segregation in the Bay Area was limited to core and outer ring neighborhoods.
Source: Data from the Neighborhood Change Database (Geolytics); Simpson’s D calculations by the Center for Community Innovation.
By 2000, the areas of high economic segregation had expanded considerably, spreading across
more of San Francisco, Oakland and outer Contra Costa and Alameda counties, and
encompassing most of populated Marin County and Silicon Valley (Figure 3). Relatively few of
these segregated areas are low-income; although the number of low-income areas grew overall,
low-income segregated areas remain for the most part confined to the region’s central cities.
18 The statistic employed for this analysis is Simpson’s D, which ranges from 0 (complete segregation) to 1 (full diversity). The index
represents the probability that if we randomly choose two individuals, they will belong to two distinct income groups.
9Figure 3: By 2000, income segregation had spread through much more of the core and outer ring.
Source: Data from the Neighborhood Change Database (Geolytics); Simpson’s D calculations by the Center for Community Innovation.
The number of tracts that are highly segregated (in the two darkest categories on the map)
increased from 141 (10 percent of the total) to 237 (16 percent of the total) from 1980 to 2000.
Yet, a large proportion of tracts also have a stable mix of incomes: 568 tracts, or 40 percent of the
total, have diversity indices over the median in both 1980 and 2000.
Figure 4 summarizes changes in neighborhood income diversity between 1980 and 2000. Areas
in yellow and blue are generally losing diversity, while areas in green are gaining diversity.
Once again, cross-hatching identifies low-income areas. Red triangles identify transit stations
(including rail and ferry).
The map indicates very different patterns across the region. In San Francisco and Silicon Valley,
transit stations are generally located in areas that are becoming less diverse (or more income
segregated) over time; although some stations are adjacent to low-income areas, almost all are
located in areas with median income above 80 percent of the regional median. In contrast, in
the East Bay, transit stations are located in both diversifying and segregating areas, most of
which are low-income. This variation means that in order to develop mixed-income TODs
10throughout the region, planners will need to use a diverse set of strategies (as discussed in
Chapter VI, the Bay Meadows and Fruitvale cases).
Figure 4: Trends from 1980 to 2000 reveal that few areas near transit stations are becoming more diverse
over time.
Source: Data from the Neighborhood Change Database (Geolytics); calculations by the CCI.
The Costs of Income Segregation
Mixed-income neighborhoods are important in part because of the costs of segregation and how
they are borne disproportionately by low-income groups concentrated in neighborhoods—
ultimately raising costs for all the region’s residents. As the incomes of neighborhood residents
decline to levels unable to support a viable retail sector or to maintain housing, a spiraling of
abandonment and decay begins. 19 Once the area becomes a high-poverty neighborhood, 20
19 J Jencks, C. & S. Mayer, “Residential segregation, job proximity, and black job opportunities,” Inner-City Poverty in the U.S.,
Laurence Lynn and Michael McGeary, eds., 1990.
20 Typically with 40 percent or more households living in poverty.
11average educational attainment levels decrease, 21 and teenage pregnancy and high school drop
out rates may increase dramatically. 22
Concentrated poverty is highly correlated with racial segregation, which itself causes poverty.
Racial segregation increases, by as much as 33 percent, the probability that a young black man
does not work. 23 Were segregation to decrease, so would the poverty rate, the high school
dropout rate, the unemployment rate, and the homicide rate. 24 While segregation can be shown
to have a direct role in poverty, it also contributes to poverty in more indirect ways. Segregated
communities suffer from the depletion of financial, informational, and human resources that
hinder the development of human capital and the transmission of information about job
opportunities, thereby increasing discriminatory barriers. 25 Segregation also increases the costs
of goods (such as groceries), services (such as car insurance), and access to capital (such as
mortgage loans) for low-income communities. 26
Overall, these regional trends are creating new costs for all Bay Area communities and
residents. As the supply of affordable housing dwindles, low-income households are pushed
out to the region’s perimeter, increasing their transportation costs. Residents of communities
that are increasingly segregated by income find themselves paying more for goods and services,
while their municipalities experience new fiscal strains. New transit infrastructure, if built
together with permanently affordable housing, has the potential to alleviate many of these
costs.
21 Datcher, L., “Effects of Community and Family Background on Achievement,” The Review of Economics and Statistics. 64(1), 32-41.
Corcoran, M., Gordon, R., Laren, D. and Solon, G., Intergenerational Transmission of Education, Income, and Earnings, 1987.
22 Crane, J., “The epidemic theory of ghettos and neighborhood effects on dropping out and teenage childbearing,” American Journal
of Sociology 96: 1226-59, 1991.
23 Massey, D. S., Gross, A. H., and Eggers, M. L., “Segregation, the concentration of poverty, and the life chances of individuals,”
Social Science Research 20, 397–420, 1991.
24 Cutler, D.M., and Glaeser, E.L., “The Rise and Decline of the American Ghetto,” NBER Working Paper Series, Issue 5881, 1997;
Galster, G.C., Keeney, W., “Race, Residence, Discrimination, and Economic Opportunity: Modeling the Nexus of Urban Racial
Phenomena,” Urban Affairs Quarterly 1(24), 87-117, 1988; Galster, G.C., “Housing Discrimination and Urban Poverty of African-
Americans,” Journal of Housing Research 2(2), 87-120, 1991.
25 Galster, G. C.,“Polarization, Place, and Race,” in John Boger and Judith Wegner, eds., Race, Poverty, and American Cities, 1996.
26 Annie E. Casey Foundation, The High Cost of Being Poor: What It Takes for Low-Income Families to Get By and Get Ahead in Rural
America, 2005 (www.aecf.org/publications); The Brookings Institution, The Price is Wrong: Getting the Market Right for Working
Families in Philadelphia, 2005 (www.brookings.edu/metro).
12III. Challenges and Opportunities
The Potential of New Transit Investments
The Bay Area stands on the brink of a substantial round of new investment in transit services
with the potential to address the challenges of unaffordable housing, congestion and declining
neighborhood diversity described above. Bay Area voters have approved $12 billion in new
public transit investments since 2000, which will add 100 new stations to the region’s existing
300 rapid transit stations and transit corridors. 27 The Metropolitan Transit Commission is
poised to invest in multiple new and expanded transit services, including:
• The BART system, from Fremont to San Jose and into eastern Contra Costa County;
• Bus Rapid Transit connecting Berkeley, Oakland and San Leandro;
• Expanded Caltrain service and the rebuilding of the Transbay Terminal;
• San Francisco MUNI Third Street Light Rail;
• Sonoma to Marin commuter rail; and
• Dumbarton commuter rail.
The recent passage of California Proposition 1C will add another $300 million in statewide
infrastructure investment to stimulate denser development along these and other transit lines.
Once allocation rules have been finalized, TOD projects that include affordable housing are
likely to receive priority funding. 28
The Growing Demand for Housing near Transit – A Challenge and an
Opportunity
Market demand for transit-oriented housing is broad and deep. By 2030 there will be potential
demand for an additional 423,000 homes near transit in the Bay Area, according to analysis by
the Center for Transit-Oriented Development. 29 At least 54 percent of demand for Bay Area
TOD is likely to come from households earning less than $75,000 per year (2000 dollars). 30
Growing demand for transit-oriented housing in the Bay Area is the result of converging
demographic trends, changing housing preferences and the growing reach of the transit system
itself. Consumers are increasingly choosing smaller, more compact houses in neighborhoods
27 Transportation and Land Use Coalition (TALC) – www.greatcommunities.org. Note that the extent of expansion depends upon
the availability of funding.
28 Legislative Analyst’s Office – http://www.lao.ca.gov/ballot/2006/1C_11_2006.htm.
29 CTOD and Strategic Economics, 2006.
30 CTOD, 2006; US Census, American Community Survey, 2004.
13where shops and services are within walking distance and where high-quality transit service is
a viable alternative to driving. 31 Additionally, the types of households who most tend to seek
out TOD – singles, baby-boomer couples without children, the elderly and low-income minority
households – are expected to increase significantly in number in the Bay Area over the next 25
years. 32 This convergence of trends creates the potential for greater development in infill
locations near transit.
A Closing Window for Low and Moderate Income Households
Growing demand for TOD presents both an opportunity and a challenge. On the one hand,
overall demand creates greater opportunities and incentive for TOD developers. But with this
market comes the risk that virtually all new development near transit in the region will be
unaffordable to lower-income households.
Presently, high-end housing projects are best suited for absorbing the time, uncertainty and cost
of risk inherent in TOD in the Bay Area. The cost of land in and around existing and future
transit stations is rising due to speculation, and land is frequently broken into small parcels,
making it difficult for developers to find sites large enough to produce high density housing at
prices affordable to both the developer and to potential residents.
Furthermore, TOD is not yet supported by appropriate zoning codes in many communities,
leading to lengthy and costly permitting processes and unnecessarily high parking standards.
Both the entitlement delays and the high parking requirements increase construction costs.
The factors inhibiting the general TOD market make it even harder to deliver mixed-income
housing near transit stations. The addition of an affordable housing component further
increases the complexity of the TOD process. Without strong proactive steps by government
agencies to reduce costs and make TOD more inclusive, it will be easiest for developers to
respond to demand from high-moderate and high-income market segments exclusively,
particularly aging baby boomers and young and childless professionals.
Additionally, new or enhanced transit service has the potential to displace residents from
existing low-income and mixed-income neighborhoods. A sizeable number of low-income
households already live within a half-mile of Bay Area transit service that uses exclusive right-
of-way, according to analysis by the Center for Transit-Oriented Development. Consistently,
station areas in the Bay Area are more economically diverse than the region as a whole, though
31 Leinberger, Chris, Emerging Trends in Real Estate, 2004.
32 CTOD and Strategic Economics, 2006.
14this income diversity is declining as discussed in Chapter II. 33 The large numbers of renters
who live near transit in the Bay Area are vulnerable to being pushed out of transit zones as
absentee owners sell, as rental units are converted to ownership units and as the growing
appeal of walkable transit districts allow property owners to command higher rents.
As land near transit is bought and locked away for housing targeted at the upper end of the
market, rare opportunities for inclusive TOD will be lost. Stakeholders need to focus their
efforts to facilitate the development of housing near transit that is affordable to a broader range
of incomes than the market would otherwise provide. Policies, programs and financing tools
that support the creation of mixed-income communities surrounding transit stations are
urgently needed to ensure that the benefit of the formidable new transit investments are
leveraged equitably and efficiently.
Many of the tools needed to
create and sustain income
diversity in transit
communities already exist,
but need to be tailored to the
particular issues of a given
transit district.
Neighborhoods near transit
are not the only settings in
which existing lower-income
residents may face
displacement pressures, or
where new affordable
housing construction may be
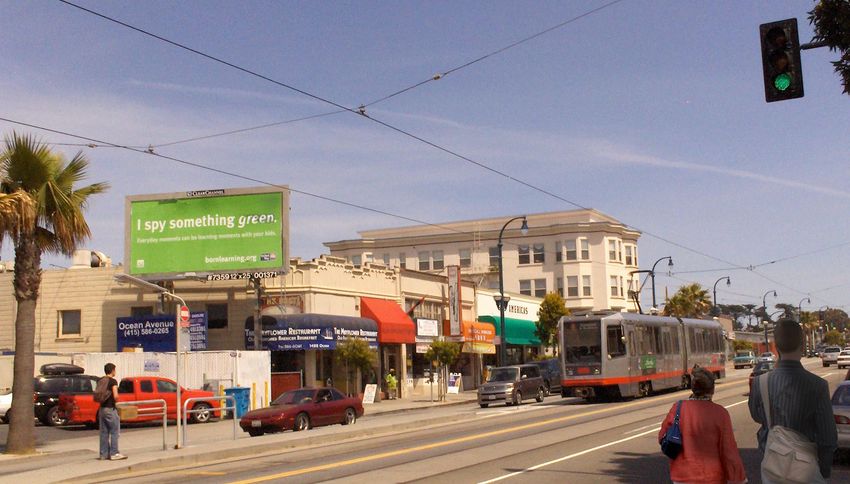
limited. Tools like housing Convenient access to transit and the diverse population of San Francisco’s Hayes Valley
neighborhood energizes the new Hayes Valley Green community park and its nearby
preservation trusts, condo commercial district.
conversion mitigation fees
and renter first-right-of-purchase laws have evolved in other settings to help lower-income
households retain a foothold in appreciating housing markets. Similarly, many cities have
found inclusionary zoning ordinances and reduced parking requirements useful for stimulating
new affordable housing construction. Cities working to create and preserve mixed-income
transit-oriented neighborhoods can draw from an array of tested policies to find the right set of
tools for achieving mixed-income transit-oriented communities.
33 CTOD, 2000 US Census.
15IV. The Synergies of Mixed-Income Transit-Oriented
Communities
Much has been written about the importance of density, a diversity of land uses and pedestrian-
oriented design in leveraging transit investments for greater ridership. Less discussed, but
equally important to TOD’s success, is ensuring that housing built within walking distance of
transit offers opportunities to a broad spectrum of income levels. Indeed, a range of housing
choices in TOD – “mixed-income TOD” – is crucial to realizing the full potential of the region’s
future transit investments.
Mixed-income transit-oriented communities combine the separate benefits of TOD and mixed-
income communities, while reaping synergistic benefits that come from bringing the two
together (Figure 5). By offering genuinely affordable housing, a stable and reliable base of
transit riders, broader access to opportunity, and health benefits to multiple income groups,
mixed-income TOD holds the potential to address the seemingly intractable problems of
worsening congestion, rising unaffordability and the growing wealth and health gap between
lower-income and higher-income residents in the Bay Area.
Figure 5: The Synergies of Combining Mixed-Income Neighborhoods with TOD
These synergistic benefits are discussed later in this section. But first we look at the separate
benefits of transit-oriented communities and mixed-income neighborhoods.
16The Benefits of Transit-Oriented Communities
Transit-oriented communities achieve greater ridership through a combination of appropriate
density, a diversity of housing prices, a mix of land uses and pedestrian-oriented design.
Ultimately the success of transit systems is tied to the characteristics of the entire ½-mile district
surrounding stations, and not just a single project. For this reason, advocates have begun to talk
more broadly about “TOD” as a district rather than a development, or to speak instead of
“transit-oriented communities or neighborhoods.”
Transit-oriented communities make ridership and a “low-car” lifestyle convenient. The
measures of effective transit-oriented neighborhoods are simple: Can parents drop a child off at
daycare on the way to work? Can errands be done on foot? Is it possible to take a business
client to lunch without having to use a car?
High quality transit-oriented neighborhoods are an essential part of sustainable regional
growth. Placing more households near accessible transit, and in communities requiring less car
use, is the key to reducing regional congestion, improving air quality and boosting transit
ridership. Studies of California neighborhoods have shown that people who live within a half
mile of transit stations are 5 times more likely to use transit than their neighbors in the same
city, and people who work in TOD are 3.5 times more likely to use transit than other workers in
the same city. 34 This is particularly true when TOD is developed at stations throughout a
transit corridor, ensuring that both origins and destinations of trips are within an easy walk of a
transit station. In fact, people who both live and work within a half mile of rapid transit are 10
times more likely to use transit than people who neither live nor work near rapid transit. 35
Transit-oriented neighborhoods deliver benefits to a range of stakeholders.
Benefits to Transit Agencies
• Greater ridership. Well-designed transit-oriented development generates increased
ridership by making the combination of transit and walking a viable alternative to
driving.
• Lower-cost ridership. TOD residents and workers are the least costly riders to bring to
transit, since they don’t require the additional and considerable costs of new parking
facilities, additional road space and operating costs associated with feeder buses.
34 Robert Cervero et al., Transit Oriented Development in America: Experiences, Challenges, and Prospects. Washington, D.C.: Transit
Cooperative Research Program, Report, 102, 2004.
35 Metropolitan Transportation Commission, Characteristics of Rail and Ferry Station Area Residents in the SFBA: Evidence from the 2000
BATS, 2006.
17• Value capture. Through careful joint development, transit agencies can use transit-
oriented development to capture the increases in land value that result from public
investment in new rail lines. TOD reduces the need for surface parking lots and auto-
related infrastructure and instead allows for uses that provide more revenue to transit
agencies (and local governments).
Benefits to Employers
• Less absenteeism. Traffic congestion not only contributes to long commutes, it can
cause commuters to be late for work and increase absenteeism, which can be a big cost
to employers. Greater transit ridership can cut down on absenteeism, tardiness and
turnover, given the ability of transit systems with exclusive rights-of-way to run on a
more regular schedule without the uncertainties of traffic accidents or other
unforeseeable events.
• Greater workforce access and retention. When transit becomes a more viable option for
a broader spectrum of the region, employers gain access to a larger and more diverse
workforce. This makes it easier to recruit new employees, and retain employees over
time. In light of the high costs of finding and replacing employees, this amounts to real
savings for businesses.
Benefits to Regions
• Reduced carbon emissions. The increased transit ridership generated by TODs
improves overall air quality. Equally important is that there are fewer “cold starts” – a
significant contributor to regional air pollution – when more people walk or bike instead
of driving to transit.
• Focused growth. TOD helps focus growth into targeted areas, diminishing pressure for
growth at the edge of regions, and cutting down on unsustainable development patterns
and the loss of open space.
Benefits to Households
• Healthier neighborhoods. Neighborhoods that make it feasible to walk or bike to
essential destinations are not only more appealing and socially connected, but also
promote healthier lifestyles.
• Greater independence. TOD improves mobility for youth, the disabled and the
growing numbers of elderly in the US for whom car use is not an option.
• Opportunities for lower transportation expenses. As discussed later in this report,
TOD districts enable households to reduce automobile expenses, both for commute trips
and non-work trips. This can yield substantial savings, particularly for lower-income
households.
18The Benefits of Mixed-Income Neighborhoods
The term mixed-income is a buzzword among planners, politicians, developers and the
community alike. Many equate the mixed-income ideal with equal opportunity as well as
shared understanding among people of different backgrounds. Some associate a mixed-income
community with a sense of neighborhood vitality not found in other neighborhoods. Although
much has been written about the prevalence and importance of diversity in terms of race and
ethnicity, less is known about the benefits of mixing incomes within a neighborhood.
What is a Mixed-Income Neighborhood?
There is no commonly accepted definition of mixed-income neighborhoods in the literature,
although definitions do exist for properties subject to HUD or other guidelines for subsidized
housing. In part, this is because most housing policy mechanisms address particular
developments, rather than entire neighborhoods.
In practice, mixed-income properties have typically combined market-rate and affordable
housing, with the majority of units being market-rate. Although the exact proportions differ, a
commonly employed ratio of market-rate to affordable housing, used for instance in HUD or
inclusionary housing developments, is 80/20 (or in some regions, 85/15).
Of course, given the relatively small proportion of families that can afford to buy a home or
even rent at market rates, especially in a strong market like the San Francisco Bay Area, a
mixed-income neighborhood containing 80 percent market-rate and 20 percent affordable units
would be considered more segregated than diverse, due to the large share of high-income
households. 36 Moreover, most researchers prefer to use more systematic measures of diversity
than the 80/20 split. They typically measure neighborhood diversity against an ideal of perfect
diversity, in absolute rather than relative terms. Most diversity indices measure diversity
within neighborhoods based on equal representation in all existing categories.
Benefits
The interest in promoting mixed-income neighborhoods comes from the general sentiment that
“communities function best when they contain a broad social mix.” 37 Underlying this ideal is
the notion, developed originally by Jane Jacobs, 38 that the mixture of household types, tenures,
36As mentioned above, the California Association of Realtors estimates that in 2005, only 12 percent of Bay Area residents could
afford the median-priced home. However, developers and housing experts consider units priced for households with 120 percent of
area median income and above to be market-rate.
37 Berube, A., Mixed communities in England: A US perspective on evidence and policy prospects, Brookings Institution, 2005.
38 Jacobs, Jane, The Death and Life of Great American Cities,
19and incomes that create diverse neighborhoods are vital components of neighborhood
revitalization.
Although no studies detail the tangible benefits of living in a mixed-income neighborhood,
research on mixed-income developments and racially integrated neighborhoods suggests some
positive outcomes that are likely to occur in mixed-income neighborhoods as well. 39
For low-income residents, living in a mixed-income neighborhood instead of a concentrated
poverty area can mean less crime, higher quality education, and better health. Income mixing
can enhance the ability of low-income residents to move up occupational and social ladders and
participate more fully in economic and political life because they have better networks to those
assimilated into mainstream society. Not only do mixed-income neighborhoods offer an
approach for reducing the cost of goods and services in the short-term, but they also contribute
to the reduction of social costs down the road. By reducing the segregation of the poor from the
mainstream, creating mixed-income neighborhoods can halt the cycle of neighborhood decline
and contribute to greater neighborhood stability. 40
Communities throughout the region, including high-income neighborhoods, would also benefit
from these changes, as they would be likely to reduce crime rates, improve educational
outcomes, increase tolerance, and stabilize neighborhoods. Further, mixed-income
neighborhoods may well reduce the cost of government services, savings that can benefit all of
the region’s residents. This provides a rationale for planning interventions that support mixed-
income neighborhoods because of their ability to use public funds more efficiently and
effectively.
Policymakers in the Bay Area have recognized the importance of diverse, mixed-income
neighborhoods to the health of the region. At the regional level, the Association of Bay Area
Governments’ 2002 report, “Smart Growth Strategy: Regional Livability Footprint Project”
outlines three possible models for growth through 2020. All three list “mixed-income
development” as a major priority. Furthermore, the report specifically advocates the
“proliferation of compact, mixed-use and mixed-income neighborhoods along transit corridors,
particularly near transit stations.” Diverse, mixed-income communities, the report advises,
expand social opportunities and job access, while ensuring that all residents benefit from the
economic welfare of the region.
39 See, for instance, Sarkissian, W., "The Idea of Social Mix in Town Planning: An Historical Review." Urban Studies. Vol. 13. 231-246,
1976; Dreier, P., Mollenkopf, J., & Swanstrom, T, Place Matters: Metropolitics for the Twenty-first Century, 2004; and Varady, D.P. &
Walker, C.C, “Housing vouchers and residential mobility,” Journal of Planning Literature 18(1), 2003.
40 Jargowsky, Paul, Stunning Progress: Hidden Problems: Declines in Concentrated Poverty in the 1990s, Brookings Institution, 2003;
Dreier et al., 2004; Jencks & Mayer, 1990.
20Joining Forces: Bringing Mixed-Income and Transit-Oriented Communities
Together
There are significant benefits to expanding transit-oriented neighborhoods and furthering
mixed-income communities. To date, stakeholders have generally pursued each goal
separately. When combined, however, mixed-income transit-oriented neighborhoods create
synergies that allow stakeholders to more fully achieve their respective objectives. These
synergies create four new benefits described in further detail below.
1: Truly Affordable Housing
Mixed-income TOD pairs lower-cost housing with manageable transportation costs, to create
the opportunity for genuine affordability – in which a household’s combined housing and
transportation costs are no longer unwieldy.
Given the trade-off many lower-income households make between lower housing prices and
higher commute costs, it is important to locate affordable housing in walkable, transit-served,
mixed-use neighborhoods where transportation costs are lower overall. Ultimately location
matters for lower-income families. Neighborhoods with access to transit are the first piece of
the low-transportation-cost equation, as transit use is less expensive than owning and driving a
car. While the average American family spends roughly 19 percent of household income on
transportation, households with access to good transit service spend only 9 percent. 41
The second piece of the low-transportation-cost equation – dense, mixed-use neighborhoods –
further reduce transportation expenses by offering opportunities to walk to frequent
destinations like groceries, dry cleaners and day care centers. 42
Together, the land use and transportation characteristics of a neighborhood – density,
walkability, the availability and quality of transit, and the accessibility of jobs and amenities
such as grocery stores, dry cleaners, daycare and movie theaters – are actually more highly
correlated to transportation expenditures than income and household size alone are. 43
By making low-transportation-cost communities more accessible to a broader range of likely
users, mixed-income TOD offers the potential for genuinely affordable housing to be available
to a greater number of Bay Area low-income households.
41 CTOD and the Center for Neighborhood Technology, The Affordability Index, Brookings Institution Press, 2006.
42 CTOD and the Center for Neighborhood Technology, 2006.
43 CTOD & CNT, 2006.
212: Stabilizing “High-Percentage” Riders
Prominent among TOD’s benefits are the dividends paid to transit systems. TOD is one of the
most cost-effective mechanisms for stabilizing and increasing transit ridership. That said, there
is no guarantee that residents who rent or purchase homes within a one-half mile walk of transit
will give up their cars, especially before TOD proliferates throughout a region.
For this reason, it is particularly useful to a transit operator to preserve or create opportunities
for lower-income households to live near transit. Low-income households are more transit-
dependent and less likely to own cars than other income segments. As such, they use transit
much more than other demographic groups. For the US as a whole, more than half (59 percent)
of all transit users are individuals in households earning less than $37,000 annually. 44 In the
Bay Area, households earning $66,000 or less for a family of four commute by bus more than
twice as frequently as households earning more. 45
Because those without a car often use transit for non-work trips as well – e.g., trips to the store,
school or recreation – low-income households also play a crucial role in filling seats during “off-
peak” times. This makes transit service more efficient, while also paying dividends for the
region through less congestion. Mixed-income transit-oriented development helps ensure that
transit’s most frequent riders have access to transit, by placing a range of housing options
within walking distance of the station.
3: Broadening Access to Opportunity
Housing opportunities for low-income households near transit can improve their access to
employment, education and homeownership opportunities – without the high transportation
costs associated with driving.
The changing nature of work in cities throughout the Bay Area is such that a majority of
residents work outside their city of residence. Currently 1.47 million jobs – comprising 39
percent of all Bay Area jobs – are located in close proximity to fixed-guideway stations and
major bus routes. This percentage is expected to jump to 44 percent by the year 2030, according
to analysis by the Center for Transit-Oriented Development. 46 A recent multi-regional study
found that those industries exhibiting the greatest preference for locations near fixed-guideway
transit systems offer the most diverse range of occupations, impacting workers at the widest
44 Pucher, J.R., “Socioeconomics of Urban Travel,” Transportation Quarterly, 52(3), 1998. (Dollar figure cited is adjusted to 2006
dollars).
45 Rice, Lorien, Transportation Spending by Low-Income California Households: Lessons for the San Francisco Bay Area, Public Policy
Institute of California, 2004. (It is likely that these numbers understate the greater use of transit by lower-income households, as
they don’t take into account non-commute trip transit use.)
46 Center for Transit-Oriented Development, Transit-Oriented Development Demand Analysis, MTC: 2005.
22range of incomes. 47 Accordingly, opportunities to live near BART, BRT, Caltrain and other new
commuter rails would be particularly useful for commuters in a range of income brackets,
including the Bay Area’s lower-income households.
When it comes to accessibility, what is good for workers is also good for employers, not to
mention the regional economy as a whole. When more workers live in areas with easy access to
transit, employers benefit from broader recruitment, easier retention and less tardiness.
In wealthy communities, mixed-income transit-oriented neighborhoods also enable a broader
range of households to live in neighborhoods with well-funded schools, access to a wide variety
of jobs and stronger city services, including policing and after-school programming.
Finally, for households ready to purchase a home, moderately priced TOD housing can help
low-to-moderate-income families and individuals gain access to homeownership and
accumulate wealth in appreciating housing markets. In fact, the potential to save money on
transportation costs in TODs helps make it more possible for lower-income households to
afford the wealth-building opportunities of homeownership in the first place. New
mortgage products by Fannie Mae (Location Efficient Mortgages and Smart Commute
Mortgages) now explicitly allow families in transit areas to qualify for larger mortgages. This
will be particularly useful to households who in other areas of the region would fall just shy of
qualifying for a mortgage. While some jurisdictions may choose to pursue affordable
homeownership models in which participants share price appreciation with other entities (e.g.
the city or community land trusts), moderately priced housing in transit-oriented
neighborhoods can extend homeownership opportunities to a lower income bracket than in
areas with higher transportation costs.
Ultimately, mixed-income TOD holds the potential of connecting lower-income households to
place-based opportunities (through access to better schools and stronger local employment
networks) and regional job opportunities (through access to rapid, low-cost transit service
linked to the region’s major employment centers). Extending both sets of opportunities is
crucial to spreading opportunities more equitably through the region.
4: Extending the Health Benefits of TOD to All Incomes
The hallmarks of transit-oriented communities – a diversity of land uses; housing, retail and
employment density; close destinations; grid street networks and sidewalks; and accessible,
high-quality transit – are highly correlated with higher rates of walking and biking, lower
47 Strategic Economics, FTA New Starts Economic Development Criteria, 2006.
23probabilities of being overweight or obese, and lower risks of life-threatening, obesity-related
diseases for its residents. 48
Neighborhoods that make amenities accessible, promote the safety of pedestrians and bicyclists,
and provide alternatives to automobile transportation have higher rates of physical activity and
healthier body mass indices, 49 which in turn lowers the risk of mortality. 50 Living in less
walkable neighborhoods corresponds to higher probabilities of being overweight or obese, 51
which in turn increases the risk of multiple life-threatening illnesses, such as high blood
pressure, high cholesterol, type 2 diabetes, heart disease and stroke, gallbladder disease and
arthritis. 52
In one recent study, researchers found that a mere 5 percent increase in walkability yielded a 32
percent increase in minutes of physical activity and a lowering of body mass index, not to
mention fewer polluting emissions from vehicles. 53
Transit accessibility is a particularly important part of inducing walking. Recent analysis by the
Metropolitan Transportation Commission found that people walk for more of their trips –
particularly short trips – if they live close to transit, compared to those who live greater than a
half-mile away. 54
Unfortunately, not everyone can afford to live in a walkable neighborhood near transit. Many
lower-income households are priced out. This is troubling given that lower-income households
already have higher rates of being overweight or obese, as well as more barriers to physical
activity and healthy food, elevating their risk of developing life-threatening illnesses. 55
Including affordable housing for lower-income households in TOD can help address obesity-
related health problems for a demographic that is particularly at risk. From a health perspective
alone, it is increasingly important to offer households of all incomes the opportunity to live in
walkable, transit-served neighborhoods, to allow those who wish to integrate active
transportation into their daily lives to reap the health benefits of greater physical activity.
48 ABAG, MTC, BAAQMD and BCDC, Transit-Oriented Development: New Places, New Choices in the San Francisco Bay Area, 2006.
49 Frank, Sallis, Conway, Chapman, Saelens, and Bachman, 2006.
50 US Department of Health and Human Services, Physical Activity and Health, A Report from the Surgeon General, 1996.
51 (1) Frank, Lawrence, Peter Engelke, and Thomas Schmid, Health and Community Design: The Impact of the Built Environment on
Physical Activity, 2003; (2) Frank, Lawrence, James Sallis, Terry Conway, James Chapman, Brian Saelens, and William Bachman,
“Many Pathways from Land Use to Health,” Journal of the American Planning Association, 2006, 75-87; (3) Moudon, Anne V. et al.,
“Operational Definitions of Walkable Neighborhood: Theoretical and Empirical Insights,” Journal of Physical Activity and Health,
2006, S99-S117. (4) Ewing, Reid, Tom Schmid, Richard Killingsworth, Amy Zlot, Stephen Raudenbush, “Relationship Between
Urban Sprawl and Physical Activity, Obesity, and Morbidity,” American Journal of Health Promotion, 2003, 47-57.
52 (1) U.S. Department of Health and Human Services, Healthy People 2010: Understanding and Improving Health, 2000; (2) Frank,
Engelke, and Schmid, 2003.
53 Frank, Sallis, Conway, Chapman, Saelens, and Bachman, 2006.
54 ABAG, MTC, BAAQMD and BCDC, 2006.
55 Frank, Engelke, and Schmid, 2003.
24V. Elements of Stable Mixed-Income Neighborhoods
Although policymakers are beginning to focus on how to create mixed-income neighborhoods,
one stumbling block remains: once upper-income residents have begun settling in low-income
neighborhoods, how can we prevent these areas from “tipping” into mostly high-income
neighborhoods? In other words, how do we stabilize mixed-income neighborhoods?
Our understanding of what
mixed-income neighborhoods look
Characteristics of Stable Mixed Income Communities
like has grown in recent years.
More diverse places tend to have a Social Seams. Places in the neighborhood where people of
different racial or socioeconomic background interact. These
greater range of housing unit include grocery stores, parks, schools, commercial corridors,
types, housing ages, housing religious institutions, other social or cultural institutions.
values, and housing tenure types,
Barriers & Edges. Physical structures within a community that
as well as a smaller proportion of thwart neighborhood change by isolating a piece of the
whites. 56 Rather being than neighborhood from broader neighborhood trends.
master-planned places, they tend
Social Awareness. A neighborhood that is conscious of its
to be planning leftovers, located status as a mixed-income neighborhood is more likely to take
next to barriers such as interstate the steps necessary to ensuring that it stays mixed.
highways, adjacent to commercial
Permanent Affordable Housing. Provides dedicated housing
corridors, and often containing a units to low-income families that are guaranteed in the face of
wholesale neighborhood change.
mix of uses. Over time, diverse
57
neighborhoods emerge as
concentrations of young and/or poor families leave and the neighborhood offers opportunities
for first-time homeownership rather than hot rental properties catering solely to a transient
high-income market niche. 58
Both of these findings suggest that planners seeking to create mixed-income neighborhoods
would be better off identifying mixed-income areas as they emerge organically, making
incremental interventions to support permanent affordability, rather than trying to engineer
large-scale diversity. Although there have been many recent attempts to create mixed-income
communities (e.g., Hope VI), it is too early to tell whether these will result in stable mixed-
income areas.
Much remains unknown about whether stable income-diverse neighborhoods exist and what
they look like. The major scholarly contributions in this area 59 look at racial diversity, not
56 Talen, E., Diverse neighborhoods and how to support them, Unpublished paper, 2006.
57 Talen, E., Design for diversity: Evaluating the context of socially mixed neighborhoods, Unpublished paper, 2005.
58 Galster, G.C., “Consequences from the redistribution of urban poverty during the 1990s: A cautionary tale,” Economic Development
Quarterly 19(2), 119-125, 2005.
25income diversity, and find that stable racially integrated communities do exist. These findings
suggest two types of diversity: diversity spread over blocks, and small pockets of racial
homogeneity within the larger diverse community. 60 Stable diverse communities tend to
feature both social seams, or “points in the community where interaction between different
ethnic and racial groups is ‘sewn’ together in some way,” and awareness of diversity within the
community (or “self-conscious diversity”), which spurs social and community groups that
advocate for the preservation of the diversity. 61
Recent research on mixed-income neighborhoods in the Bay Area 62 confirms the importance of
these social seams – e.g. grocery stores, parks, schools, religious institutions, and commercial
strips – in helping neighborhoods maintain a stable mixed-income population. Looking at pairs
of adjacent neighborhoods in San Francisco and Oakland, the study by the Center for
Community Innovation found that the presence of more social seams in a neighborhood tended
to either attract upper-income newcomers, thereby increasing diversity, 63 or stabilize a mixed-
income area. 64 This may occur because of more awareness (as other studies have found), or
because some of these institutions encourage community involvement in planning issues. But
also what may be happening is that such places simply reduce the availability of real estate for
investment and speculation, thereby stabilizing the area.
Another factor that seems to matter is the presence of barriers and edges. Theoretically, barriers
could contribute to economic segregation at both the high and low ends of the income spectrum
because of their ability to thwart neighborhood change by isolating the neighborhood. 65
Barriers like major thoroughfares can keep a place from gentrifying because they have lots of
unpleasant traffic. But barriers like topography can keep a neighborhood wealthy by making it
physically and economically inaccessible. In one Oakland neighborhood studied (Temescal),
barriers have actually kept part of the neighborhood from attracting the upper-income residents
it would need to become mixed instead of low-income.
Finally, and most importantly, affordability matters. The case of San Francisco’s Western
Addition shows that permanently affordable housing developments have kept some blocks
from gentrifying completely, even as valuable Victorian architectural stock nearby attracts
upper-income newcomers. In the absence of permanent affordability, there is little planners can
do to change the dynamics of neighborhood change.
59 Ellen, Ingrid Gould, Sharing America’s Neighborhoods: The Prospects For Stable Racial Integration, 2000; Nyden, P., Maly, M., &
Lukehart, J., “The emergence of stable racially and ethnically diverse urban communities: A case study of nine U.S. cities,” Housing
Policy Debate 8(2), 1997.
60 Nyden et al., 1997.
61 Ibid.
62 Chapple, et al., 2007.
63 As in part of Oakland’s Temescal neighborhood.
64 As in part of San Francisco’s Mission neighborhood.
65 As found by Talen, 2005, 2006.
26You can also read