THE EUROPEAN LANDSCAPE OF LISTED BIOTECH COMPANIES - 2018 REVIEW
←
→
Page content transcription
If your browser does not render page correctly, please read the page content below
Bertrand Delsuc, Ph.D.
biotechradar.eu / Biotellytics
September 15th, 2019

 THE EUROPEAN LANDSCAPE OF
 LISTED BIOTECH COMPANIES
 2018 REVIEW
September 2019 Author: Bertrand Delsuc

 The European landscape of listed biotech companies: 2018 review

This review is an introduction to the universe covered by Biotellytics, publisher of biotechradar.eu, a
business intelligence service on the landscape of the European biotech companies listed on the main
European stock exchanges. This service aims at providing insights and data at company level for
investors, as well as consolidated data for the European level for life sciences professionals. This
review will form a basis for more content to be released in the future.

This document is intended for a broad audience but more particularly people who are already
specialized in the life sciences, without being familiar with the European biotech landscape, and
notably the listed side.

After a definition of our universe, and a presentation of our selection, we will provide a global
overview of the landscape for 2018, based on the following items: IPOs, M&As, R&D pipeline,
commercial products, market data, employment, financing and other financial metrics, and deals. All
these data will be broken down by country or by (country) cluster, when relevant, in order to have a
minimum number of companies for each presented data. Belgium (BE) and the Netherlands (NL) will
be taken together, as well as UK and Ireland (IE). Norway (NO) and Finland (FI) will also be gathered
into a cluster. The same way, Italia (IT) and Spain (ES) will form the “Southern Europe” cluster. We
will end by a snapshot of the characteristics of a “typical” European public biotech company, at the
end of 2018.

 1 / 72 © biotechradar.eu / Biotellytics
September 2019 Author: Bertrand Delsuc

Introduction

The European biotechnology (“biotech”) sector is an ecosystem in the making. The first listings of
biotech companies (our universe) were only recorded in the late 90s, so roughly 20 years ago. The
inception of biotech companies, listed later on, started accelerating around this period, so 10 to 20
years later than the emblematic Amgen, Biogen, Celgene and Gilead Sciences. The biotech sector is
not yet established as a strong pillar in the European markets, even though one can exceptionally
find some biotech companies selected in the main national indices, e.g. in Belgium. It’s very recent
though.

In contrast, the Healthcare sector and particularly the Pharma segment is well represented in Europe,
with 4 European Pharma companies in the Top 10, and 8 in the Top 20, according to GlobalData [1]
(we do NOT consider Allergan as an Irish company). Another testimony of the relative strength of the
European Pharma sector is the weight of the sector in the total equity market cap, measured to 7.6%
(1.05 trillion USD at the end of 2018 for 28 companies -broad “Pharma” definition- , out of 13.2 trillion
USD of total market cap among the 8 main European stock market operators [2-4]). This is higher
than the US figures, with 1.5 trillion USD for 12 US Pharma companies [1;5], out of 30.4 trillion USD
of market cap, or 4.9% [6]. Unfortunately, the European Biotech segment only weights 0.37% of the
total European market cap, or 50.3 billion USD (155 companies in our universe), whereas the US
Biotech segment represented 1.1% of the total US market cap, or 336 billion USD for 444 US
companies listed on the Nasdaq in New York (diagnostics and services excluded).

This lag in Europe owes mainly to the overall lack of financing available for the Biotech segment, with
few exceptions nonetheless. Some reasons can be found in this review. For the solutions, there are
unfortunately no easy ones. In a recent thought-provoking article named “Is Going Public in Europe
the Kiss of Death?” [7], Antoine Papiernik, Managing Partner at Sofinnova Partners (an important Life
Sciences fund in Europe), invited the European companies aiming at an IPO someday to “think as if
they were located in Boston”, and to engage as soon as possible with the investors with “deep
pockets”, namely those in the US and why not those in the fast-growing Hong-Kong markets. In his
guidance, Europe would a second choice, but paradoxically 3 out of the 4 companies mentioned as
having “cracked the code” (multi-billion USD market cap) were actually listed on European markets
first. Moreover, a direct listing in the US is probably not for the mainstream private biotech company,
e.g. for market cap considerations. This is indirectly implied in the article, as it relates to companies
with “science, products, management, and investors on a par with the best Boston-based
companies”. So yes, the European ecosystem needs success stories à la Actelion, and companies who
remain independent -Galapagos!- to show the way, even if this is the natural order that most of them
are acquired. A few are on their ways and need to end the job from a commercial standpoint. With
the pipeline data we show in this review, there will likely be more.

At the same time, more positive signals are sent from the private side. Over the past couple of years,
we started to see inflated early VC rounds on European biotech companies (e.g. 40 million EUR in
series B for Enyo Pharma in June 2018 [8], or 67 million EUR in series A for Alizé Pharma in July 2019
[9], just to name a few), mimicking a trend recently observed in the US [10-11]. Therefore, it will be
interesting to follow in the coming years what will be the VCs’ exit model when these companies
reach a stage of development legitimating an IPO. One could guess a direct listing on Nasdaq.

 2 / 72 © biotechradar.eu / Biotellytics
September 2019 Author: Bertrand Delsuc

Unfortunately, we do not have any particular insights to provide on why the health in the private and
public sectors would be so divergent, especially in the long term.

The overall ecosystem needs to gain in maturity at all stages: executives, governance, analysts, VCs,
investors of all kind, media, etc… (and service providers like biotechradar.eu!). Maybe just
incantations today, because this is a process. There is still a long way for the European retail investors
to get “educated”, but it is probably only a matter of time as well. The risk-averse profile of the typical
European investors at baseline, at least as compared to the US, is also a hurdle. Perhaps we in Europe
also do not showcase our success stories enough, as compared to the US, at least from one country
to another. There are signs that we try to learn the lessons from the recent successes, and hopefully
from setbacks as well. The regulatory environment can certainly be improved in some countries, to
support the clinical research. Finally, the European politics probably do not see any reason to help
the biotech ecosystem in particular, as the Pharma sector is still relatively healthy. Perhaps the
European biotech sector needs more visibility and more lobbying, in general and as an innovative
industry segment.

Innovation drives growth, this is a constant everywhere in the world, and in every business. Over the
past decade, the biotech sector has become a main vector of innovation in the drug industry, not
only to fuel the pipeline of the largest Pharma companies, but also to bring treatments on the
markets on their own [12-13]. At some point, a strategic question in Europe could be: who do we
want to buy our drugs from? There is no news here, but Europe lacks tech leaders. If we cannot build
digital giants, why not relying on what is still recognized as a strength: the quality of the science and
scientists? At least those who do not leave Europe for better opportunities overseas.

Unfortunately, there is no equivalent to the Nasdaq markets in Europe. Beyond investment policies
excluding investment on European assets like biotech companies, some international investors might
just view the European markets as not worth the effort. If we take the US investors for example, they
only have to deal with one market place (Nasdaq), one regulator (the SEC), all the documents are in
English, and the market offer is large (more than 500 companies for pharma/biotech only). This is
simple. Now, if you look at the main European countries and stock markets, like our universe, you
need to deal with 13 countries, with the same number of Financial Supervisory Authorities and stock
exchanges, managed by 8 stock market operators. The main corporate documents can mostly be
found in English, but not always, so you basically need to deal with 10 languages. On top of that, not
all the countries in the European Union have adopted the euro, so you also need to deal with 7
currencies. And this for 150-200 companies (biotech/pharma only), with select companies already
accessible on the US markets with the dual listings (excluding those who directly list in the US).
Several of these items might be minor hurdles for professional investors, wherever they are based.
Perhaps there is even no hurdle at all for some. But it seems fair to say that this is less simple than in
the US. This is basically one of the purposes of the service offered on biotechradar.eu, presenting the
whole European landscape as one, while keeping the granularity at company level. In short, making
things easier for investors. The US investors’ referential also needs a reset, or at least an adaptation
when they look at Europe, e.g. there is no such thing as same-day offerings after “positive news”.

Additionally, Europe lacks a cluster as strong as Boston, but given the fragmented nature of this
territory, it is not likely to happen anytime soon, as each country also aims at becoming a future
leader. Instead, there are several regional “bio-clusters” in each country. The fragmentation we just

 3 / 72 © biotechradar.eu / Biotellytics

September 2019 Author: Bertrand Delsuc

highlighted may also be reflected in the profile of some companies, with a lack of critical size. Would
the ecosystem benefit of a local consolidation, e.g. of businesses relating to very close therapeutic
areas or modalities?

Another point is the rise of a new hotspot for Life Sciences in Hong-Kong, which now both competes
with Europe to attract US capitals, but could represent an opportunity as well in the future, according
to Papiernik’s take. In reality, there might be just no competition properly speaking, if we refer to the
large amounts of money flowing in Hong Kong, as compared to Europe. However, this is still a “work
in progress” in Hong-Kong as well [14]. Indeed, the biotech stock performances were very mixed in
Hong Kong in 2018 [15], and one will have to judge over a longer period. What is certain is that in
terms of Business Development, Asia must be considered. So, Hong-Kong, Asia, China, threats or
opportunities for Europe, only time will tell.

After all these points, the “elephant in the room” question is: why on earth would anyone invest in
European listed biotech companies? Ask the likes of Fidelity, Perceptive Advisors, Baker Bros, just to
name a few, they will probably have a clue. These specialized funds definitely do not wait for a
company to list on Nasdaq in New York to take a bite. There are opportunities everywhere, and the
sector rewards the best cases. Therefore, when all the boxes are ticked, Europe or not Europe, does
it really matter? Of course, there might be no plethora of opportunities on the old continent, but
they exist. This is even a pity that the European investment firms do not capture a larger share of the
upside from the most promising European biotech companies. On the other side, there are already
several hedge funds operating on the European biotech sector. Looking at the pipeline data in this
review, the aficionados of the event-driven strategy will not lack opportunities either. Finally, even if
selectivity is key in biotech investing, requiring key data at company level, it is also interesting to
know the sector characteristics, at top level, which is the purpose of this review.

Is there a future for the biotech sector in Europe? Will the public sector recover from a tough period?
How long will it take? How will the financing environment evolve moving forward? Is a consolidation
of the number of companies needed? What are the main characteristics of the listed segment of the
European biotech sector? Are there different dynamics among the European countries? Who will be
the next European rising stars? Will the soon-to-be integrated companies succeed in their
transformation process? These are just few themes and questions we will try to cover, or that we will
help the investors and life sciences professionals to find the answers to, not especially in this review
but in general, so stay tuned.

 4 / 72 © biotechradar.eu / Biotellytics
September 2019 Author: Bertrand Delsuc

Table of Contents

1. The European landscape of listed biotech companies: definitions, selection, general
overview 6
 1.1 Companies by country and by stock exchange 10
 1.2 A still relatively young landscape, with an IPO boom over the 2014-2017 period 12
 1.3 New listings/IPOs and M&As in 2018 14
 1.4 Development stages by country 15

2. R&D Pipeline & Commercial Products 19
 2.1 Unique product candidates in active clinical development, indications & therapeutic areas 19
 2.2 Product candidates in registration and commercial products 23
 2.3 Assessing the full pipeline breadth: R&D programs in active clinical development 24

3. Market data 28
 3.1 Market capitalization 28
 3.2 Stock performances 32
 3.3 Market Liquidity 40

4. Employment 43

5. Financing 45

6. Other financial metrics: cash burn, extra cash sources, cash balance, profits & losses
 49
 6.1 Cash burn 49
 6.2 Extra sources of cash 51
 6.3 Balance between cash raised and burnt 52
 6.4 Profits & Losses 54

7. Deals 55

8. Portrait of a “typical” biotech company listed in Europe 64

9. Conclusion 65

2018 Fact Sheet 68
References 69
Annex 1 70
Annex 2 72

 5 / 72 © biotechradar.eu / Biotellytics

September 2019 Author: Bertrand Delsuc

 1. The European landscape of listed biotech companies: definitions,
 selection, general overview

Like in a clinical trial, our selection globally meets some inclusion and exclusion criteria, with few
exceptions. We tried to build a list of companies to have a relatively homogeneous group, or the least
heterogenous to be more accurate, and limit the number of outliers. These criteria can be found
below. We reviewed the activity of all the companies, and checked the consistency of their business
model with the above-listed criteria.

Inclusion criteria:

 • Inception in one of the main European countries: France, Germany, UK, Italy, Spain, Belgium,
 Netherlands, Switzerland, Denmark, Sweden, Norway, Finland, Ireland
 • Primary listing on (at least) one of the main European stock exchanges, including the
 following:
 o Euronext, Main market & Euronext Growth: Paris (France), Brussels (Belgium),
 Amsterdam (Netherlands)
 o Deutsche Börse XETRA: Frankfurt (Germany)
 o SIX Swiss Exchange: Zurich (Switzerland)
 o London Stock Exchange & its Alternative Investment Market/AIM: London (UK)
 o Nasdaq OMX - Nordic List & First North: Stockholm (Sweden)
 o Oslo Børs: Oslo (Norway)
 o Bolsa de Madrid: Madrid (Spain)
 o Borsa Italiana: Milan (Italy)
 • Companies developing therapeutics, with a focus on the development of their innovative
 pipeline, including some “specialty” companies, and some companies developing
 generics/biosimilars (broad “biotech” definition engulfing both “biotech” and
 “pharmaceuticals” as per their original definitions, called “biotech” for simplicity's sake)
 • Companies whose market capitalization/enterprise value essentially relies on their pipeline,
 or in a mix of their pipeline and their product sales/royalties and not only on sales/profits
 • “Large” biotech companies without a fully-owned product at the commercial stage, not yet
 vertically-integrated

Exclusion criteria:

 • European companies directly listed outside Europe (basically on Nasdaq, New York, US),
 without any secondary listing on the main European markets
 • Foreign companies (for which Europe is not considered as their “domestic” territory)
 • Pharma companies or pharma-like vertically-integrated companies (valuation with a PER,
 focus on sales/external growth, or limited innovation in the pipeline)
 • Medtech/Diagnostics companies (non-core activity for some companies in our selection)
 • Service companies: CROs, CMOs, Drug Discovery companies (very few exceptions for this
 particular activity), API providers, etc…
 • Biotech Funds

 6 / 72 © biotechradar.eu / Biotellytics

September 2019 Author: Bertrand Delsuc

All the companies included in our selection (see Table 1) are at various stages of development for
their drug candidate(s). While some companies might remain on the “biotech” side forever, others
might become partially or fully-integrated “pharma” companies (depending on manufacturing
integration). On the other way, integrated companies might be forced to become “biotech” again if
their pipeline was not filled adequately. Therefore, both the position and the direction within the
“biotech-to-pharma” transition process (represented just below) mattered for our selection.

 Road to integration: first (Big) Pharma: fully-integrated / focus on
Biotech: R&D-oriented, no
 fully/partially-owned marketed sales / profits / life cycle management /
 or no significant sales,
 products, internal sales force, M&A / pipeline replenishment with
 licensed assets, risk-
 mixed valuation model with late-stage de-risked assets, PER-based
adjusted pipeline valuation
 high PER ratios (when >0) valuation “at 0 pipeline” (~15-20x)

However, our selection includes some outliers or special cases, either not meeting the afore-
mentioned criteria, or subject to discussion. The most relevant cases can be found below (list not
comprehensive):

 • Evotec (Germany): a company offering integrated drug discovery services, leader on IPSC-
 based drug discovery. It is selected because of its high-growth/innovation profile;
 • Oncodesign (France): another drug discovery company, much smaller than Evotec and with
 a slightly narrower scope of services compared Evotec but also converging towards an
 integrated drug discovery model, leveraging its kinase inhibitor platform at the same time. It
 is basically selected for historical reason;
 • Nanobiotix (France): some might consider this company as a medtech (their lead product
 was regulated as a medical device for their first marketing authorization in Europe), however
 their model is the one of a biotech, and their product is aimed for a therapeutic use (the
 regulatory pathway in the US remains to be defined);
 • Cosmo (Italy): a specialty pharma focused on GI diseases with therapeutics & medical devices
 on the market, still with many drivers in the pipeline. The US patent of their lead UC drug will
 fall next year. We thought it was relevant to have it included in the pool;
 • Vectura (UK): a company specialized in COPD/asthma treatment, developing both
 formulations (CS/LAMA/LABA) and medical devices (inhalers) with partners, included in our
 selection but under watch as the business model is shifting towards a “specialty CDMO”;
 • Indivior (UK): a leading company specialized in addiction and more specifically of opioid
 addiction, de-merged from Reckitt Benckiser Pharmaceuticals in 2014. It can also be
 considered as a specialty pharma but contrary to Cosmo, the patent cliff for their leading
 drug is happening right now, which forced the company to reshape its long-term strategy
 and portfolio. We thought it was legitimate to have it into our selection;
 • Oxford Biomedica (UK): a company with mixed model consisting in manufacturing services &
 supplying viral vectors for cell and gene therapies, along with developing both an internal
 pipeline and supporting a partnered pipeline (mainly gene therapies with 1 CAR-T program).
 Given that the valuation is not (yet) massively dominated by the service segment, we feel
 that the company is still a relevant pick in our selection;
 • Allergy Therapeutics (UK): the company name speaks for itself. The company already has
 several products on the market (some only on a Named-patient basis) but still has a decent
 R&D pipeline to be included in our review;

 7 / 72 © biotechradar.eu / Biotellytics
September 2019 Author: Bertrand Delsuc

 • Basilea (Switzerland): spin-off from Roche in 2000, it is also a commercial stage company that
 was originally focused in infectious diseases. And like many players in this field, the company
 has broadened its scope with the addition of oncology assets, with some innovation pending
 in the pipeline and therefore justifying the presence in our selection;
 • PharmaMar (Spain): a conglomerate that is definitely turning into a pharma-only business
 model, particularly in oncology, with the divestment of 2 group subsidiaries (consumer
 chemicals in 2018 and cleaning, cleansing, disinfecting products for the industry very recently
 in 2019). The company has 2 oncology drugs on the market but only 1 available in the US and
 Europe. We also judged it was a fit in our selection.

In addition, some companies are covered on our service, but are not included in this review, either
because their profile is too singular, or because their business model is transitioning outside the core
“innovative biotech” segment we cover here. This includes the following companies:

 • Circassia (UK): a company specialized in respiratory disease who acquired the rights of
 several assets, but also proceeded to a complete write-off of its innovation pipeline in
 asthma/COPD and allergy over the past couple of years, following multiple clinical trial
 failures. Therefore, the business model, coupled with a fully depleted innovation pipeline,
 makes the company out of the scope of this review;
 • Biotest (Germany): the company specialized in plasma-derived products/IVIg is in complete
 transformation at several stages, after a strategic refocus initiated in 2015 and a change of
 control of the company taking place 2 years ago. It’s now in the hands of Creat Group from
 China via its German subsidiary Tiancheng, but it was not de-listed because of a 2-level share
 scheme (Voting rights majority via Preferential Shares). This takeover led them to divest their
 US business to comply with antitrust rules. The company is also about to be brought in kind
 by Creat as part of a capital increase into Shanghai Raas. Biotest is looking to divest their
 assets outside plasma products (mainly 3 biologics). In anticipation of the completion of all
 these changes, Biotest is not included in this selection;
 • Puretech Health (UK): a very atypical profile, as it is basically a VC fund with an internal
 pipeline (we cover only this internal pipeline on our service). Given that it is far from being
 predominant in the group valuation at this stage, we do not include the company in our
 selection. Also, some would argue that the company mostly operates in the US but still, it
 was incorporated in the UK, and the company is only listed in London (for now);
 • Biotech Pharmacon (Norway): a specialty pharma company whose most of the business relies
 on its API supplier and animal health businesses. The company has a small commercial
 product in human health and a cancer vaccine adjuvant in oncology, but considered as non-
 core, so it is not included in the review (human therapeutic programs covered on our
 service);
 • Sanochemia (Austria): another specialty pharma (not covered), listed on XETRA in Germany,
 mainly operating as a CMO, but with a partnered product in back pain, once again considered
 as non-core.

 8 / 72 © biotechradar.eu / Biotellytics
September 2019 Author: Bertrand Delsuc

 AB Science FR Acacia Pharma UK A1M Pharma SE NOXXON Pharma DE
 ABIVAX FR 4D Pharma UK Active Biotech SE Probiodrug DE
 Adocia FR Allergy Therapeutics UK Alligator Bioscience SE 4SC DE
 Advicenne FR Avacta UK Annexin Pharma. SE Biofrontera DE
 Biophytis FR Destiny Pharma UK Asarina Pharma SE Cytotools DE
 Cellectis FR Diurnal Group UK Alzecure Pharma SE Evotec DE
 Cerenis Therapeutics FR Evgen Pharma UK BioInvent Internat. SE Formycon DE
 Crossject FR Hemogenyx Pharma. UK BioArctic SE Heidelberg Pharma DE
 DBV Technologies FR Immupharma UK Calliditas Therapeutics SE Medigene DE
 Erytech Pharma FR Indivior UK Camurus SE Mologen DE
 Genfit FR Mereo BioPharma UK Cantargia SE Morphosys DE
 GenSight Biologics FR Midatech Pharma UK CombiGene SE Paion DE
 Hybrigenics FR Motif Bio UK Corline Biomedical SE co.don DE
 Innate Pharma FR N4 Pharma UK Cyxone SE
 Inventiva FR Nuformix UK Diamyd Medical SE GeNeuro CH
 Lysogene FR Okyo Pharma UK Gabather SE Genkyotex CH
 Medincell FR Oxford Biomedica UK Hansa Biopharma SE Addex Therapeutics CH
 Nanobiotix FR Realm Therapeutics UK Immunicum SE Basilea Pharma. CH
 Neovacs FR Redx Pharma UK InDex Pharma SE Idorsia CH
 Nicox FR ReNeuron UK Infant Bacterial Ther. SE Molecular Partners CH
 Oncodesign FR Sareum UK IRLAB Therapeutics SE ObsEva CH
 Onxeo FR Scancell UK Isofol Medical SE Polyphor CH
 OSE Immunother. FR Shield Therapeutics UK Kancera SE Santhera CH
 Pharnext FR Silence Therapeutics UK Karessa Pharma SE
 Poxel FR Summit Therapeutics UK Klaria Pharma SE Bavarian Nordic DK
 Quantum Genomics FR Synairgen UK Lidds SE Genmab DK
 Sensorion FR Tiziana Life Sciences UK Medivir SE Oncology Venture DK
 Theranexus FR ValiRx UK NeuroVive SE Orphazyme DK
 Transgene FR Vectura UK Oasmia Pharma. SE Zealand Pharma DK
 Valneva FR Verona Pharma UK Oncopeptides SE Nuevolution DK
 Orexo SE Saniona DK
 argenx BE Amryt Pharma IE PledPharma SE
 ASIT biotech BE Promore Pharma SE Cassiopea IT
 Bone Therapeutics BE BergenBio NO Sprint Bioscience SE Cosmo Pharma IT
 Celyad BE Nordic Nanovector NO Vicore Pharma SE Newron Pharma. IT
 Galapagos BE PCI Biotech NO XBrane Biopharma SE Molmed IT
 Mithra Pharm. BE Targovax NO Xintela SE
 Oxurion BE XSpray Pharma SE
 Faron Pharma. FI
 Kiadis Pharma NL FIT Biotech FI Oryzon Genomics ES
 Pharming Group NL Herantis Pharma FI PharmaMar ES
 Tab. 1. List of selected European public biotech companies

 9 / 72 © biotechradar.eu / Biotellytics
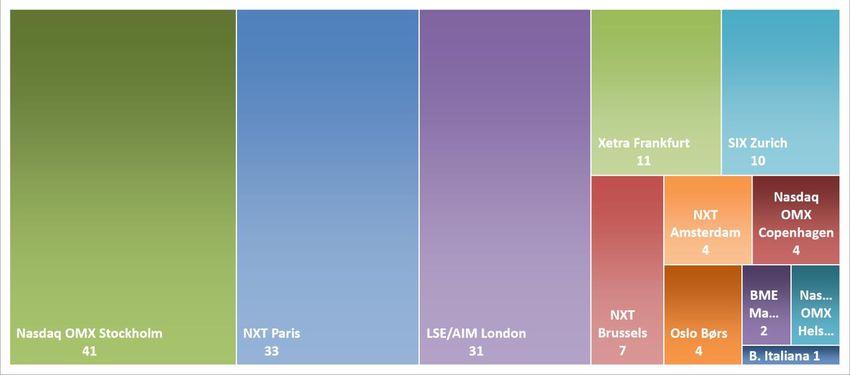
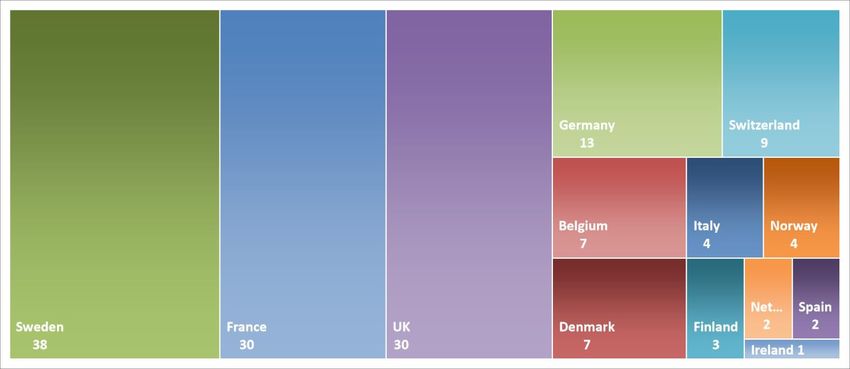
September 2019 Author: Bertrand Delsuc

Finally, this leaves us with the round count of 150 European biotech companies, from 13 European
countries, and listed on stock markets from 8 operators.

Of note, we considered Immupharma as a UK biotech company (this is actually a group with several
subsidiaries) but it would not be completely wrong to classify it as a French company either.

If you want to check for more companies outside our “biotech” universe, you can have a look at our
European Pharma dashboard here, while our European Biotech dashboard (including select
diagnostic companies) can be accessed there.

As a reminder, most of the metrics in this review will be consolidated by country, or by cluster (pooled
data from 2 countries).

1.1 Companies by country and by stock exchange

As shown on Figure 1, Sweden is the largest provider of biotech companies in our universe, before
France and the UK at the same level. Germany is only ranked fourth. Switzerland, the home of 2
European Big Pharma, arrives in fifth. Then follow Belgium and Denmark, 2 very strong places despite
their ranking. Finally, Italy and Spain, 2 members of the EU5, have a limited number of biotech
companies listed on the European markets, more or less at the same level as the Scandinavian
countries like Norway and Finland, and a single company from Ireland.

 biotechradar.eu

 Fig. 1. Repartition of the European listed biotech companies, by country (our universe)

Such a gap between Sweden (10m inhabitants) and much larger countries (> 60m) might come as a
surprise for those who do not follow this space. In fact, Sweden is almost an ecosystem on its own
inside Europe. In addition, biotech companies tend to list very early in the markets (with respect to
their development stage), much sooner than everywhere else actually. In addition, we only included
companies listed on Nasdaq OMX Nordic, but there is another platform on which many companies
start listing as public companies, before being transferred to the Nasdaq OMX markets later on. This

 10 / 72 © biotechradar.eu / Biotellytics
September 2019 Author: Bertrand Delsuc

other platform is the Spotlight platform, formerly known as Aktietorget, allowing companies to list
for a small price. Therefore, many Swedish companies floated on Spotlight first, then migrated to the
secondary “growth” market of Nasdaq OMX (the First North market). For those reaching even higher
valuations, they can finally end on the Nasdaq Nordic List, attracting more investors. Other factors
may characterize the Swedish ecosystem: retail investors who are seemingly keener on taking risks
than the European average, a well-developed market access, a flow of corporate communications
above average, a well-known transparency culture and diligence in reporting. All these elements lead
to a favorable environment in this country, at least for the earliest stages. Though, the question of
the financing of all these companies will remain for the mid-term, as some of them will move forward
into advanced stages, requiring way more funds.

On the other extreme, one might find curious to see so few companies in Italy and Spain. There are
many Pharma companies in both countries, public and private, but these countries are not hotspots
for the public biotech sector, as of today. However, academia is generally strong in these countries,
and some institutions are renowned, so this is not a matter of scientific level. The local ecosystems
seem relatively young there, some regional biotech clusters (within the countries) are 10 years old
or less. Lastly, most of the Italian companies in our selection played the card of the proximity with
specialized investors, by choosing a listing in Switzerland, more than in Italy. This clearly
demonstrates a lack of financing support in their home markets. So, is it just a matter of time before
the rise of biotech in the south of Europe? Time will tell, but the road will probably be long enough.

 biotechradar.eu

 Fig. 2. Repartition of the European public biotech companies, by stock exchange (our universe)

In accordance with Figure 1, we find again the 3 main clusters -Sweden, France, UK- when looking at
the main stock exchanges (Figure 2). As mentioned just before, the country of origin of the companies
does not always correlate with the place where it is trading. This is indeed mostly the case (91%), but
not always. 3 Italian companies out of 4 are listed in Zurich, 1 German company and 2 Swiss
companies are listed in Paris, 1 British company is listed in Brussels, 1 German company is listed the
Netherlands, 1 Finnish company is listed in London, 2 Danish companies are listed in Stockholm, and
Galapagos (Belgium) is listed in Amsterdam (ok, Belgium and Netherlands are really close!). Finally,

 11 / 72 © biotechradar.eu / Biotellytics
September 2019 Author: Bertrand Delsuc

we consider Amryt as an Irish company that is dual-listed in London (AIM) and Dublin (Euronext), but
we assigned the main listing as being in London, notably based on trading volume considerations.

The main reasons for these re-locations are, first, a better access to financial resources expected in
the targeted listing places, and second, merger and acquisitions, not from the biotech companies but
from the stock exchanges. Indeed, Euronext has been very active on M&A in Europe lately: following
the acquisition of the Irish Stock Exchange at the end of 2017, the pan-European group just
completed the acquisition of Oslo Børs mid-June 2019, after a bidding war with Nasdaq OMX. So, the
lead of Euronext will extend again. XETRA (Deutsche Börse) and SIX both host heavyweight biotech
companies, but are way behind in total number of companies. Quality over quantity? Or just more
pragmatic markets there, less prone to sectorial hype cycles?

1.2 A still relatively young landscape, with an IPO boom over the 2014-2017 period

The dates of inception & IPOs/new listings of the companies in our selection are plotted on Figure 3,
sorted from oldest to newest (N.B. these are not the same companies on the x-axis for both series,
as data were sorted separately). Also, these IPO/new listing dates only concern the companies in our
selection.

2020 2018
 2018
2015 2014

2010

2005 2003

2000

 1996
1995

1990

1985 Inception
 IPO/Listing
1980
 1979
 biotechradar.eu
1975
 0 10 20 30 40 50 60 70 80 90 100 110 120 130 140 150
 Fig. 3. Inception dates & IPO/new listing dates, sorted (our universe - see N.B. in the text)

At the end of 2018, approximately 27% had 10 years old or less, 50% 15 years old or less, and 72% 20
years old or less since their inception. In short, the age of the companies is quite evenly spread. For
spun-off companies, we indicate the year of the spin-off and not the inception year of the parent
company. Finally, one could argue that 15 years of median age is not that young. However, the ability
to be properly financed in Europe is far from being equivalent to the US, so a straightforward
argument is to say that on average, the companies advance more slowly simply because they don’t
have the financial means to do more and faster.

 12 / 72 © biotechradar.eu / Biotellytics
September 2019 Author: Bertrand Delsuc

Moving to IPOs, as shown on Figure 4, there was a first peak in 2006 prior to the subprime financial
crisis, followed by a real boom during the period from 2014 to 2017. 57% of the companies in our
selection started floating on the markets in the past 5 years. The climax was reached during the frenzy
over the spring and summer 2015 (19% or approximately 1 out of 5 companies in our selection listed
this year). Right after this, the famous “Hilary tweet” calmed down the sector in September 2015.
However, the pace remained sustained in 2016 and 2017, before a sharp decline in 2018 (diverging
trend with respect to the US), even more accentuated in 2019 year to date.

 30 57%
 biotechradar.eu
 2 28
 25 2
 1

 20
 9 17
 16 1
 15
 15 1 1
 12
 5
 2 5 7 8 10
 10
 7 2 7 2
 6 4
 6 1 3
 4 1 2 5 5 3 5
 5 1 2 2 9
 1 3 3 1 3 3
 2 2 2 2 2 6
 1 1 2 1 1 5 5 4 1
 0 2 1 1 0 2 3 3 1 0 2 2 3 2 2
 0 1 1 1 1 1 1

 Euronext LSE/AIM Nasdasq OMX Xetra SIX BME Oslo Børs B. Italiana
 Fig. 4. IPOs/new listings along time, broken down per stock market operator (our universe)

Concerning the dynamics by stock market operator, there was a deluge of IPOs on Euronext between
2014 and 2016, with 7/11 companies floating in Brussels and Amsterdam over this period, 15/44 in
Paris over 2014 and 2015. In Stockholm, the pace was also sustained from 2014 to 2018, with 31/41
of the listings over this period. For LSE/AIM, it is a bit more balanced between the mid-2000s and the
2014-2017 period.

Yet, what was seen as a good dynamic in 2014/2015 may now be seen as a concern, or even more,
as a mistake. Indeed, more companies on the markets also means more cash needs in the future.
Moreover, these cash needs are not linear along the development of the companies, but they grow
massively after the proof-of-concept step, reaching a climax on pivotal programs. Therefore, such a
large number of IPOs over such a short period of time (4-5 years) basically translated into an
imbalance between ask (the public biotech companies) and bid (the investors on the European
markets). This is where the problem is today in Europe: the funds available did not grow as much and
as fast as the needs. This aspect was, and still is seemingly ignored or not understood by the stock
market operators, or at least some of them, who keep inviting new companies to list on their markets
(…or how to kill your own business)! In addition, this imbalance was exacerbated by a sentiment
reversal in 2015. Of course, many companies try to cope with these needs by trying to partner their
assets past proof-of-concept, but this is never a given, and as of today, many companies with so
called phase 3-ready assets in their pipeline are in a dead-end case, as they cannot run phase 3 trials
by themselves, without a partner to support all or most of the development costs. At the end of the
day, the European markets self-regulated markedly: only 5 IPOs took place on Euronext in the past

 13 / 72 © biotechradar.eu / Biotellytics
September 2019 Author: Bertrand Delsuc

32 months (0 in 2019 to date & 2 last-minute cancellations in 2018), and there was only 1 IPO on
Nasdaq OMX this year (plus 1 listing transfer from Spotlight), far from the 7-8 per year from 2015 to
2017 and even the 5 in 2018. The message seems clear: only the very appealing company profiles will
likely succeed on the road to the public markets, or only those with a large institutional/historical
investors’ backing during the operation (but is it the goal for historical investors?). Otherwise, the
message seems pretty clear… Enough (listed companies) is enough (financial burden to bear for the
investors).

1.3 New listings/IPOs and M&As in 2018

2018 saw only 10 new listings (Table 2), including 6 IPOs (Acacia, MedinCell, Polyphor, AlzeCure,
Asarina, Calliditas), 2 listings following an M&A/reverse takeover operation (Oncology Venture from
MPI, Okyo from a Cash Shell) and 2 listings without a public offering (Combigene in Stockholm and
ObsEva, listed in Switzerland after floating on Nasdaq first). The most active place was Sweden with
5 new listings, followed by Switzerland (2). There was a single event in France, UK and Belgium.

 Company Founded Stock Exch. EU IPO Amount (mEUR)/Listing
 Polyphor (CH) 1996 SIX Zurich 139.2
 Calliditas Ther. (SE) 2004 OMX Stockholm 71.6
 Acacia Pharma (UK) 2007 NXT Brussels 40
 MedinCell (FR) 2003 NXT Paris 31.4
 Alzecure Pharma (SE) 2012 OMX Stockholm 19.4
 Asarina Pharma (SE) 2006 OMX Stockholm 15.6
 Okyo Pharma (UK) 2018 LSE/AIM London 0 (reverse merger)
 Oncology Venture (DK) 2004 OMX Stockholm 0 (reverse merger)
 CombiGene (SE) 2014 OMX Stockholm 0 (no offering/transferred from Spotlight)
 ObsEva (CH) 2012 SIX Zurich 0 (no offering/listed 1st on Nasdaq in 2017)

 Tab. 2. EU IPOs & new listings of European listed biotech companies in 2018 (our universe)

4 companies managed to list on Nasdaq in New York in 2018, of which 3 through an IPO process. The
only significant amount raised was for Morphosys (Table 3).

 Company Founded Listing (EU Stock Exch.) US IPO Amount (mEUR)/Listing
 Biofrontera (DE) 1997 2006 (XETRA Frankfurt) 10.4
 Morphosys (DE) 1992 1999 (XETRA Frankfurt) 193.1
 Tiziana Life Sci. (UK) 2013 2014 (LSE/AIM London) 3.9
 Realm Ther. (UK) 2006 2014 (LSE/AIM London) 0 (no offering)

 Tab. 3. US IPOs (dual listing) of European listed biotech companies in 2018 (our universe)

On the M&A side (Table 4), it was a prolific year (from a European standpoint), with 5 companies
who were acquired and subsequently de-listed: Tigenix (Belgium) acquired by Takeda, Ablynx
(Belgium) acquired by Sanofi, Wilson Therapeutics (Sweden) acquired by Alexion, TxCell (France)
acquired by Sangamo, and Vernalis (UK) by Ligand Pharmaceuticals. For the first 2 names, the

 14 / 72 © biotechradar.eu / Biotellytics
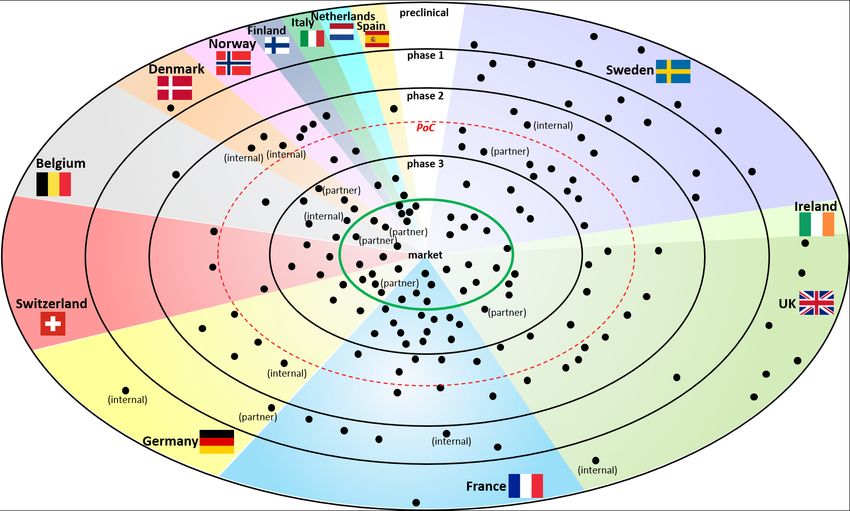
September 2019 Author: Bertrand Delsuc

takeovers came after a drug approval (Alofisel and Cablivi, respectively). For Wilson, the tender offer
followed good data for WTX 101 now in a pivotal trial in Wilson disease. For the TxCell and Vernalis,
it was different. Both companies were facing financial and/or business challenges, so they were
opportunistically acquired by 2 US companies.

 Acquired Founded Listing (EU Stock Exch.) Acquiring Amount Premium
 Company Company (mEUR) (%)
 TiGenix (BE) 2002 2007 (NXT Brussels) Takeda (JP) 520 81.4
 Ablynx (BE) 2000 2007 (NXT Brussels) Sanofi (FR) 3900 112.3
 Wilson Ther. (SE) 2001 2014 (OMX Stockholm) Alexion (US) 689.6 70.3
 Txcell (FR) 2012 2016 (NXT Paris) Sangamo Ther. (US) 72 177.4
 Vernalis (UK) 2003 2012 (LSE/AIM London) Ligand Pharma. (US) 36.4 16.1
 Tab. 4. Acquisitions of European public biotech companies in 2018 (our universe)

Finally, on a wider perimeter, concerning European listed “big pharma”/biopharma companies, Shire
(Ireland) was acquired by Takeda for 52.5 bEUR (approximately 60% premium). Karo Pharma
(Sweden) was acquired by a fund based in Luxembourg for 580 mEUR (premium about 25%). In 2017,
Actelion (Switzerland - not covered) was acquired by Johnson & Johnson for 28.1 bEUR (premium
around 77%). Also, in 2017, STADA Arzneimittel, a German pharma (not covered) was partially taken
over by a consortium of funds. Another “tranche” of the company was furtherly acquired in 2018 and
the company was de-listed early in 2019.

1.4 Development stages by country

The radar plot in Figure 5 indicates the most advanced development stage of the companies, as of
31/12/2018. For a few cases, we separated the partnered pipeline from the internal developments,
thus the mentions “partner” and “internal” associated with some dots (1 dot = 1 company, but 2 dots
for each company with split internal/partnered contributions).

The 3 most represented countries, Sweden, UK, France, are also the main contributors of early stage
companies, gathering 88% of the companies at preclinical/phase 1 stages. Of note, our definition of
“early stage” is “having just reached the proof of concept or before”, as delimited by the red dotted
circle. In our view, the Proof-of-Concept (PoC) might be more relevant, as the “phase 2” term might
be too vague, without the purpose associated with the “phase 2”. It is not rare to see reports
classifying a company that has just started a small phase 2a trial on 30 patients, and another company
that has completed a dose-ranging phase 2b on 300 patients, at the same stage, i.e. “phase 2”. The
difference between these 2 cases can be important, all other things being equal. So, it is worth seeing
if companies are inside or outside the red circle. As always, there are particular cases, e.g. a PoC may
be considered as established in a phase 1b or a phase 1[b]/2[a] in oncology, as usually labelled. Also,
one could argue on what actually defines a “proof-of-concept”, but we will not go further in this
introductory review.

 15 / 72 © biotechradar.eu / Biotellytics
September 2019 Author: Bertrand Delsuc

 biotechradar.eu

 Fig. 5. Radar plot of the European public biotech companies (our universe)

Overall, the number of companies that made it to the finish line, with at least one product
generating revenues, via direct sales or royalty streams is approximately 1 company out of 5 in our
selection (32/150), as shown on Figure 6. The question of whether the marketed products generates
strong revenues is another story. 38% of the biotech companies in our selection can be considered
as “late-stage” companies, and 27% “early-stage” ones. 4% can be considered “mid-stage”
companies (not early- nor late-stage), while 1 company out of 10 is still at preclinical stage.

Of note, the “phase 1” stage is really a transient stage when put into perspective of the time scale of
clinical development, as this is typically the shortest step of all, when everything goes smoothly.
Consequently, the proportion of companies in phase 1 should never be really important.
Nevertheless, in oncology notably, the phase 1 stage may represent a significant proportion of the
global clinical development time (case of 5/15 companies at phase 1 stage in Figure 7). Lastly, some
companies run both a phase 1a trial in healthy volunteers and a phase 1b in patients to characterize
the PK/PD of their investigational drugs more extensively, before moving into phase 2a typically. This
is why some “phase 1” stage can last a year or so. This phase 1b step can also be part of a phase
1(b)/2(a). In this case the company stage is classified as phase 2a.

Lastly, some companies may run a pivotal program as soon as phase 2, so before the phase 3 stage
(e.g. in oncology and rare/orphan deadly diseases).

 16 / 72 © biotechradar.eu / Biotellytics
September 2019 Author: Bertrand Delsuc

 The breakdown of companies by country and
 preclinical
 by development stage is provided on Figure 7.
 15
 market We will review more detailed product portfolio
 10%
 32 phase 1
 21% and R&D pipeline data in the next sections.
 15
 10%

 phase 2a
 26
 phase 3 17%
 36
 24% phase 2
 5 Fig. 6. Distribution of the European public biotech
 phase 2b 4%
 companies by development stage (most advanced
 21
 14% project, partnered or internal - our universe)
 biotechradar.eu

 40
 38 biotechradar.eu

 35 5

 4 31
 30 30
 6 5
 25 7
 4
 20 3
 12
 6
 4
 15
 13
 8 8 5 5
 10 9 9
 3 2 7 7
 1 3 3 1 6
 2 1
 5 1 4 1
 7 4 3 4
 6 4 3 1
 1 1 4 1
 1 1 2 1 1
 0
 SE UK/IE FR DE BE/NL CH DK NO/FI IT/ES
 preclinical phase 1 phase 2a phase 2 phase 2b phase 3 market

 Fig. 7. European public biotech companies by development stage & by country (countries clustered to
achieve a minimal number of companies) - highest combined total of late-stage (at least with a phase 2b
running) & commercial-stage companies on the left

Finally, looking at the country level (or country clusters that make sense, notably based on
geography/similarities), we rendered on Figure 8 the level of maturity of the respective national
biotech sectors, at the end of 2018. Sticking to our early/late-stage definitions, the Belgian/Dutch
public sector (n=9 companies) proposes the most mature panel in Europe, along with Switzerland
(n=9). Indeed, these 2 clusters look very similar on this chart. The Italy/Spain cluster (“Southern

 17 / 72 © biotechradar.eu / Biotellytics
September 2019 Author: Bertrand Delsuc

Europe”) is the subgroup with the highest proportion of commercial stage companies (but n=7 only).
Denmark, another small subgroup (n=7) is also well ranked. From the 3 large subgroups (Sweden
n=38, UK/Ireland n=31, France n=30), the French sector displays the most advanced companies,
proportionally. Sweden is the less mature subgroup in Europe, along with the other Nordic countries,
as also depicted on Figure 5 (radar plot). Especially, when looking at the proportion of companies in
phase 3 or higher, we can see there is a gap between the bottom 3 and the rest. Finally, Germany
(n=13), displays a good balance, with the second proportion of companies having reached the
market.
 biotechradar.eu
 BE/NL 11 11 44 33 n=9

 IT/ES 17 17 67 n=6

 CH 22 11 44 22 n=9

 FR 3 13 10 17 40 17 n=30

 DK 14 14 43 29 n=7

 DE 8 23 8 23 38 n=13

 UK/IE 19 3 26 19 13 19 n=31

 SE 18 21 11 8 18 11 13 n=38

 NO/FI 57 14 14 14 n=7

 0% 10% 20% 30% 40% 50% 60% 70% 80% 90% 100%

 preclinical phase 1 phase 2a phase 2 phase 2b phase 3 market

Fig. 8. Distribution (%) of European listed biotech companies by development stage (most advanced
program) & by country/cluster - highest combined total of late-stage (at least with a phase 2b running) &
commercial-stage companies on top

One should keep in mind there are some important limitations with this representation, especially
when it comes to link these data with valuations. First, the most advanced program is not always a
good reflect of the richness of a pipeline, both in terms of quantity and quality (e.g. programs more
likely to reach the market even if less advanced). Also, it does not indicate anything on the asset NPVs
(Net Present Values) in the portfolios. In addition, important distortions may occur with respect to
the therapeutic areas. For example, an oncology company in phase 1b already having convincing data
may easily have a valuation that is several folds higher than the valuation of a company in phase 2b
in a niche indication. In conclusion, as many subgroups have a relatively small number of companies,
such distortions may have a significant impact, on top of contributions from outliers.

 18 / 72 © biotechradar.eu / Biotellytics
September 2019 Author: Bertrand Delsuc

 2. R&D Pipeline & Commercial Products
2.1 Unique product candidates in active clinical development, indications and therapeutic
areas

The number of unique product candidates in active clinical development is represented in Figure 9,
for each country/cluster. These assets are considered to be in active clinical development if they have
at least started a phase 1, and if the companies have not declared their development as set on
hold/paused/delayed. An asset waiting to be partnered to be developed at a further stage (usually
after proof-of-concept) is still considered as active here, although such an event might never occur.
However, we set the status on hold anyways if there is no news for a long period. The product
candidates having entirely completed their pivotal clinical program and under review for registration
are not taken into account here (see dedicated section 2.2). Product candidates already approved
are not included either, even if their development is pursued in another approved indication (see
also section 2.2).

The unicity of the candidates is defined with the removal of duplicates from the following categories:
indications, territories, targeted populations, formulations. These clinical assets may be developed
by the companies alone or with one or several partners, potentially in-licensed and not yet at the
registration stage/approved/marketed (even if developed in several indications). The only duplicate
cases are when 2 companies in our universe share an asset: in this case, it is counted once for each
company, but consolidated again at the country/cluster level if the 2 companies are in the same
country/cluster. With our set of criteria, there were 341 unique product candidates in active clinical
development among the European biotech companies in our universe, at the end of 2018 (336 if the
assets with shared ownerships among companies in our universe are counted only once).

 70 68
 biotechradar.eu
 60 57 56
 50
 50

 40
 33
 29
 30
 23
 20
 14
 11
 10

 0
 FR UK/IE SE DE DK CH BE/NL IT/ES NO/FI

 Fig. 9. Unique product candidates in active clinical development, by country/cluster, as of 31/12/2018

Without surprise, the 3 main clusters (France, UK/Ireland and Sweden) are the top 3 contributors.
However, as shown on Figure 10, UK/Ireland and Sweden globally under-contribute in quantity, as
they both have the most important proportion of companies at the preclinical stage (see also Figure

 19 / 72 © biotechradar.eu / Biotellytics
September 2019 Author: Bertrand Delsuc

8). On the contrary, Germany (thanks to Morphosys and Evotec), Denmark (Genmab), Switzerland
(Idorsia) contribute over or well over their respective ratios.

 biotechradar.eu

 NO/FI 3.2
 IT/ES 4.1
 FR UK/IE SE DE DK CH BE/NL
 unique candidates
 (% of total) 19.9 16.7 16.4 14.7 9.7 8.5 6.7

 = -- ++ + = -

 NO/FI 4.7
 IT/ES 4.0
 FR UK/IE SE DE DK CH BE/NL
 companies by country
 (% of total) 20.0 20.7 25.3 8.7 4.7 6.0 6.0

 0% 10% 20% 30% 40% 50% 60% 70% 80% 90% 100%

Fig. 10. Distribution (%) of the unique product candidates in active clinical development, by country/cluster

When looking at the absolute numbers by stage and by country (Figure 11), and focusing on the late-
stage assets, France is where the highest number of active R&D assets are in late-stage development,
particularly in phase 3 (on-going, or completed but not yet filed for registration). The other 2
important clusters complete the podium: the numbers at each stage for UK/Ireland and Sweden are
close, with a short edge for the UK in late-stage. Switzerland is also well ranked for the late-stage
assets thanks to Idorsia (4 unique assets in phase 3 for this company alone). 57 unique assets were
in phase 3 at the end of 2018.

 biotechradar.eu phase 1 phase 2a phase 2 phase 2b phase 3
 30 28
 n= 116 91 40 37 57

 25

 20 20
 20 19
 18

 15 15
 15
 12
 11
 1010 10
 10 9
 8 8 8 8 8
 7 7
 6 6 6 6 6
 5 5 5 5 5 5
 5 4 4
 3 33
 2 2 2 2
 11 1 1 1
 0
 NO/FI IT/ES DK DE BE/NL CH SE UK/IE FR
Fig. 11. Number of unique product candidates in active clinical development (n=341), by clinical stage and by
country/cluster - highest number of late-stage assets on the right (late-stage assets=phase 2b, phase 3, phase
2/3 and also “phase 1/3” as usually called by companies developping biosimilars/generics)

Germany has an abnormal number of unique product candidates at the phase 1 stage. This is due to
2 companies, Morphosys and Evotec, which are 2 of the most important R&D powerhouses (mainly
in the frame of partnered programs) in our European biotech universe, if not the 2 most important

 20 / 72 © biotechradar.eu / Biotellytics
September 2019 Author: Bertrand Delsuc

ones. Morphosys has built an important partnered pipeline over the past 2 decades, and the business
model of Evotec is to deliver phase 1-ready candidates for their customers, so in fact, no real surprise
here. Still on early-stage assets, Sweden and the UK have a similar number of product candidates
both at the phase 1 and phase 2a/PoC stages. However, as seen on Figure 8, Sweden has relatively
more phase 1-stage companies than the UK. This illustrates the fact that in Sweden, the phase 1
assets are more lead assets whereas in the UK, they are almost only follow-on assets within broader
and/or more advanced pipelines.

Germany also has the highest number of mid-stage phase 2 assets, owing this position to a high
number of oncology assets at this stage, from 4SC AG and Morphosys.

Of note, France is ranked in the TOP 3 at each development stage, without any special outlier.
Knowing that more than 70% of the French biotech companies reached either the commercial stage
or a late stage (Figure 8), this means that the 60% of early stage assets (Figure 12) are usually follow-
on R&D projects as well, complementing at least one other later-stage asset. We may do one remark
concerning the lack of outliers among the French biotech landscape. This is interesting on one hand
because the potential is globally evenly spread over the landscape. But on the other hands, outliers
are signs of success(es). So far, the French sector is still looking after THE company with a blockbuster
in the pipeline, able to address a large population, and likely assisted by a Top 10 Big Pharma on its
way to vertical integration: in other words, a good success story. In contrast, Belgium/Netherlands
do not look particularly strong on Figure 11, but at least 2 of the late-stage assets are already worth
billions (filgotinib and efgartigimod, 2 assets with a “pipeline-in-a-product” profile, with an option as
well for cusatuzumab, and others if approved). At the end of 2018, in terms of market cap, Galapagos
alone was worth more than the 30 French biotech companies in our universe listed in Paris…
 biotechradar.eu
 IT/ES 14 29 14 7 36 n=14

 BE/NL 35 22 4 13 26 n=23

 CH 24 28 10 10 28 n=29

 UK/IE 35 26 9 16 14 n=57

 FR 41 22 9 10 18 n=68

 SE 34 32 9 14 11 n=56

 DK 30 30 18 3 18 n=33

 NO/FI 18 45 18 9 9 n=11

 DE 40 22 20 8 10 n=50

 0% 10% 20% 30% 40% 50% 60% 70% 80% 90% 100%
 phase 1 phase 2a phase 2 phase 2b phase 3
 Fig. 12. Distribution (%) of the unique product candidates in active clinical development, by clinical stage
 and by country/cluster - highest proportion of late-stage assets on top

The distribution of the unique assets in active development broken down by clinical stage is
represented on Figure 12 for each country/cluster. While the picture in the Top 3 is almost the same
versus the distributions of companies ranked by most advanced development stage from Figure 8,

 21 / 72 © biotechradar.eu / Biotellytics
September 2019 Author: Bertrand Delsuc

the rest of the ranking is entirely reshuffled. Italy/Spain indeed takes the first place to
Belgium/Netherlands but the proportion in the Top 3 is very close, all around 40%, with a 10% gap
on the fourth place. The main differences concern the UK/Ireland (+3) and Germany (-3). For the UK,
the fact that we removed the preclinical assets -and thus the 6 preclinical companies- make the
contribution of the clinical-stage companies look much better (the same reason applies for Sweden,
+2 in the ranking). For Germany, the explanation was mentioned above: the contributions in early-
stage assets of Evotec and Morphosys dilute the later-stage part. The same dilution operates for
Denmark, where Genmab and Saniona contributions at the Proof-of-Concept stage make the national
sector move down by 2 places.

Overall, all these R&D assets were addressing 271 unique indications at the end of 2018, with many
assets addressing several of them.

Like everywhere else in the world [16-17], oncology, just reported as having taken over from
cardiovascular diseases for the leading cause of death worldwide [18], is the most pursued area, with
roughly one fourth of all the indications (Figure 13). Two areas come next, with 15%:
immunology/inflammatory diseases/allergy (including autoimmune diseases) and
neurology/psychiatry to which we attach toxicity management/rescue, as well as addiction and
anesthesia/sedation. These 3 areas include slightly more than half of the indications (56%). Another
small quarter is composed of ophthalmology/otorhinolaryngology, infectious diseases and
endocrine/metabolic diseases, each between 6 and 8%. The last quarter is very fragmented, with 9
areas between 1 and 4%. Of note, infectious diseases, a huge unmet need worldwide because of the
antimicrobial resistance concerns, gather 6% of the indications, especially in the UK and Switzerland.
In contrast, only 4% of the candidates in active development address cardiovascular diseases, the
formerly leading cause of deaths in the world until 2017 [18].

 Ophtalmology /
Otorhinolaryngology Endocrinology /
 8% Metabolic
 Infectious
 6%
 6%
 Nephrology
 Neurology / 3% Dermatology /
 Psychiatry / Tox- Hematology Wound Healing
 Poisoning 3% 3%
 15% Musculoskeletal
 Obstetrics /
 24% Gynecology / 3%
 Immunology /
 Inflammatory / Genitourinary Injury
 Allergy 3% 1%
 15% Respiratory / Others
 Pulmonary 1%
 3% Cardiovascular
 4%
 Oncology
 26%
 biotechradar.eu

Fig. 13. Therapeutic areas addressed by unique R&D product candidates in active clinical development by
the European listed biotech companies (our universe)

 22 / 72 © biotechradar.eu / Biotellytics
You can also read