THE NATIONAL HEALTH STRATEGY - EQUITY AND QUALITY IN HEALTH: LEAVING NO ONE BEHIND - Country Planning ...
←
→
Page content transcription
If your browser does not render page correctly, please read the page content below

National Health Strategy for Zimbabwe 2016-2020FINAL_01-03-17.qxp_Layout 1 1/3/2017 15:14 Page 1

              THE NATIONAL HEALTH STRATEGY
                                                     for Zimbabwe
                                                            2016-2020

                   ZIMBABWE

                              EQUITY AND QUALITY IN HEALTH:
                                 LEAVING NO ONE BEHIND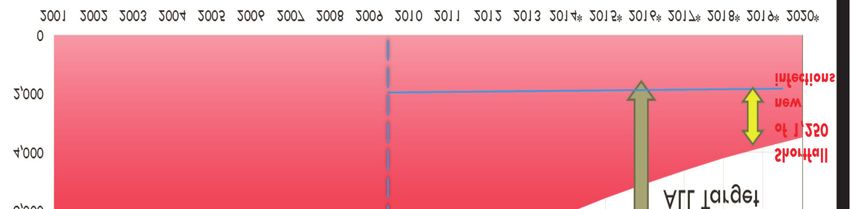
National Health Strategy for Zimbabwe 2016-2020FINAL_01-03-17.qxp_Layout 1 1/3/2017 15:14 Page 2
National Health Strategy for Zimbabwe 2016-2020FINAL_01-03-17.qxp_Layout 1 1/3/2017 15:14 Page 3

                   ZIMBABWE

          THE NATIONAL HEALTH STRATEGY
                                                  for Zimbabwe
                                                        2016-2020

                              EQUITY AND QUALITY IN HEALTH:
                                 LEAVING NO ONE BEHIND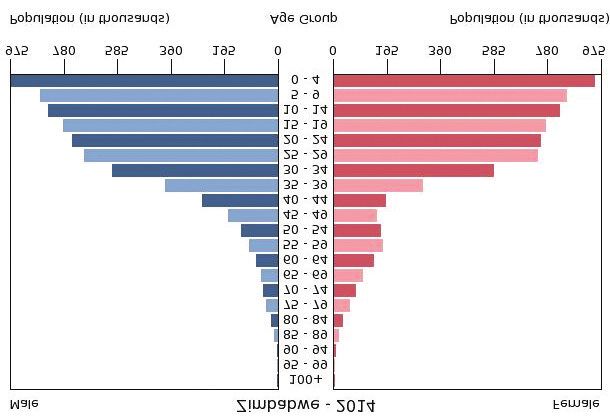
National Health Strategy for Zimbabwe 2016-2020FINAL_01-03-17.qxp_Layout 1 1/3/2017 15:14 Page 4
National Health Strategy for Zimbabwe 2016-2020FINAL_01-03-17.qxp_Layout 1 1/3/2017 15:14 Page i
Foreword
This strategic plan has been developed through a participative and consultative process involving
significant contributions and support from various individuals and institutions.
A specific Technical Task Team (TTT) was established to drive preparatory activities towards this
strategy. The TTT established Technical Working Groups (TWG) to focus on specific strategic pillars.
Various stakeholder workshops were conducted with health workers, community leaders, development
partners, government agencies and communities. The TTT also conducted a Strengths, Weaknesses,
Opportunities and Threats (SWOT) analysis based on the inputs from these stakeholders. The SWOT
analysis provided qualitative evidence on the status of the health sector. In addition, a Bottleneck
Analysis (BNA) was conducted on selected tracer conditions to unpack the underlying bottlenecks and
root causes to observed health system performance challenges. The results of the SWOT analysis and
the BNA, together with a comprehensive review of the performance of the previous strategy exploring
what worked and what did not was used to identify sector priorities and hence remedial strategies.
The Plan provides the framework that will guide the efforts of the Ministry of Health and Child Care
and all stakeholders over the next 5 years in contributing to the attainment of the Zimbabwe Agenda
for Socio-Economic Transformation and the Sustainable Development Goals.
The successful implementation of this plan will depend on the continued dedication of staff in the
Ministry of Health and Child Care and those of its partner institutions.
As a strategic policy document that we have put together, it is my sincere hope that it will become the
single most important point of reference for design of service delivery programmes, resource
mobilization and health financing framework, as it outlines how as Zimbabweans we will reach our
dream of delivering high quality health services to the citizens.
I therefore wish to extend my sincere appreciation to all those that contributed to the process of
developing this plan. I wish to pay special tribute to the members of the technical team and members
of the technical working groups for their significant inputs and commitment to this process. On behalf
of the Ministry of Health and Child Care, I also wish to acknowledge the financial and technical
support rendered to us by our Development Partners. Without the direction and valuable support of
our Cooperating Partners, we could not have managed to successfully complete this plan. Finally,
I wish to thank all the members of staff of the Ministry of Health, and Child Care, line ministries,
Community representatives and NGOs, for their participation, contributions and support to the process
of formulating this strategic plan.
Dr P D Parirenyatwa (Senator)
Minister of Health and Child Care
National Health Strategy For Zimbabwe 20162020 i
National Health Strategy for Zimbabwe 2016-2020FINAL_01-03-17.qxp_Layout 1 1/3/2017 15:14 Page ii

National Health Strategy for Zimbabwe 2016-2020FINAL_01-03-17.qxp_Layout 1 1/3/2017 15:14 Page iii
Acknowledgements
The National Health Strategy (2016-2020) is the product of a long and complex process of intensive
consultations, teamwork on specific assignments, detailed studies and information gathering. Service
providers, civil society groups, community members, the private sector, co-operating partners and other
stakeholders were all involved in the process. The Ministry of Health and Child Care is very grateful
to those who contributed to the successful development of this strategic plan. The concerted effort
of all directorates, programs and other stakeholders is acknowledged. Special thanks go to the Division
of Policy, Planning, Monitoring and Evaluation that provided leadership to members of the core team
tasked to facilitate the development of this document. The efforts of putting together important
information, comments and suggestions have not gone unnoticed. The Government of Zimbabwe
would like to appreciate the financial and technical support given by development partners for the
development of this document. Last, but not least, the Ministry of Health and Child Care expresses
its sincere gratitude to all stakeholders and institutions who continue to contributed one way or the
other towards giving quality health services to the citizens of Zimbabwe.
Brig. Gen. (Dr) Gerald Gwinji
Permanent Secretary, Ministry of Health and Child Care
National Health Strategy For Zimbabwe 20162020 iii
National Health Strategy for Zimbabwe 2016-2020FINAL_01-03-17.qxp_Layout 1 1/3/2017 15:14 Page iv
Table of Contents
Foreword . . . . . . . . . . . . . . . . . . . . . . . . . . . . . . . . . . . . . . . . . . . . . . . . . . . . . . . . . . . . . i
Acknowledgements . . . . . . . . . . . . . . . . . . . . . . . . . . . . . . . . . . . . . . . . . . . . . . . . . . . .iii
Abbreviations . . . . . . . . . . . . . . . . . . . . . . . . . . . . . . . . . . . . . . . . . . . . . . . . . . . . . . . . .vi
Executive Summary . . . . . . . . . . . . . . . . . . . . . . . . . . . . . . . . . . . . . . . . . . . . . . . . . . . ix
1. Overall Context for The National Health Strategy 2016-2020 . . . . . . . . . . . . . . . . . 1
1.1 Introduction . . . . . . . . . . . . . . . . . . . . . . . . . . . . . . . . . . . . . . . . . . . . . . . . . . . . . . . . . . . . .1
1.2 The constitution and its provision for health . . . . . . . . . . . . . . . . . . . . . . . . . . . . . . . . . . 1
1.3 National Health Strategy alignment with Government Programme of Action (GPA) . .2
1.4 The health sector and global commitments . . . . . . . . . . . . . . . . . . . . . . . . . . . . . . . . . . . .2
1.5 Socio-economic and demographic context . . . . . . . . . . . . . . . . . . . . . . . . . . . . . . . . . . . . 3
2. Situation Analysis of Zimbabwe’s Health Sector . . . . . . . . . . . . . . . . . . . . . . . . . . 5
2.1 Health Systems Organisation and Status . . . . . . . . . . . . . . . . . . . . . . . . . . . . . . . . . . . . . . 5
2.2 General performance of the health sector 2009 to 2015 . . . . . . . . . . . . . . . . . . . . . . . . . 9
2.3 Expenditure on health . . . . . . . . . . . . . . . . . . . . . . . . . . . . . . . . . . . . . . . . . . . . . . . . . . . .10
2.4 Overall burden of diseases . . . . . . . . . . . . . . . . . . . . . . . . . . . . . . . . . . . . . . . . . . . . . . . . 11
2.5 Priority Disease Control Programmes . . . . . . . . . . . . . . . . . . . . . . . . . . . . . . . . . . . . . . . 15
2.5.1 Communicable Diseases . . . . . . . . . . . . . . . . . . . . . . . . . . . . . . . . . . . . . . . . . . . . 15
HIV and AIDS . . . . . . . . . . . . . . . . . . . . . . . . . . . . . . . . . . . . . . . . . . . . . . . . . . . 15
Sexually Transmitted Infections (STI) . . . . . . . . . . . . . . . . . . . . . . . . . . . . . . . . . 18
Tuberculosis (TB) . . . . . . . . . . . . . . . . . . . . . . . . . . . . . . . . . . . . . . . . . . . . . . . . . 19
Malaria . . . . . . . . . . . . . . . . . . . . . . . . . . . . . . . . . . . . . . . . . . . . . . . . . . . . . . . . . . 21
Other diarrheal diseases . . . . . . . . . . . . . . . . . . . . . . . . . . . . . . . . . . . . . . . . . . . . 23
Rabies . . . . . . . . . . . . . . . . . . . . . . . . . . . . . . . . . . . . . . . . . . . . . . . . . . . . . . . . . . .23
Anthrax . . . . . . . . . . . . . . . . . . . . . . . . . . . . . . . . . . . . . . . . . . . . . . . . . . . . . . . . . 23
Hepatitis . . . . . . . . . . . . . . . . . . . . . . . . . . . . . . . . . . . . . . . . . . . . . . . . . . . . . . . . .23
2.5.2 Non-communicable diseases . . . . . . . . . . . . . . . . . . . . . . . . . . . . . . . . . . . . . . . . 23
Hypertension and Cardiovascular Diseases . . . . . . . . . . . . . . . . . . . . . . . . . . . . . 24
Diabetes Mellitus . . . . . . . . . . . . . . . . . . . . . . . . . . . . . . . . . . . . . . . . . . . . . . . . . .24
Cancer . . . . . . . . . . . . . . . . . . . . . . . . . . . . . . . . . . . . . . . . . . . . . . . . . . . . . . . . . . 24
Injuries . . . . . . . . . . . . . . . . . . . . . . . . . . . . . . . . . . . . . . . . . . . . . . . . . . . . . . . . . . 25
Oral Health . . . . . . . . . . . . . . . . . . . . . . . . . . . . . . . . . . . . . . . . . . . . . . . . . . . . . . 26
Disabilities . . . . . . . . . . . . . . . . . . . . . . . . . . . . . . . . . . . . . . . . . . . . . . . . . . . . . . . 26
Mental Health . . . . . . . . . . . . . . . . . . . . . . . . . . . . . . . . . . . . . . . . . . . . . . . . . . . . 26
iv National Health Strategy For Zimbabwe 20162020
National Health Strategy for Zimbabwe 2016-2020FINAL_01-03-17.qxp_Layout 1 1/3/2017 15:14 Page v
Table of Contents
2.5.3 Reproductive, Maternal, Newborn, Child Health, Adolescents and Nutrition . 26
Maternal and Child Health . . . . . . . . . . . . . . . . . . . . . . . . . . . . . . . . . . . . . . . . . . 26
Nutrition . . . . . . . . . . . . . . . . . . . . . . . . . . . . . . . . . . . . . . . . . . . . . . . . . . . . . . . . 29
Adolescent and Maternal Nutrition . . . . . . . . . . . . . . . . . . . . . . . . . . . . . . . . . . . 29
Infant and Young Child Nutrition . . . . . . . . . . . . . . . . . . . . . . . . . . . . . . . . . . . . 29
Infant and Young Child Feeding Practices . . . . . . . . . . . . . . . . . . . . . . . . . . . . . 29
Nutritional Status of Men . . . . . . . . . . . . . . . . . . . . . . . . . . . . . . . . . . . . . . . . . . 29
2.5.4 Public health surveillance and disaster preparedness and response . . . . . . . . . . 29
Environmental Health Services . . . . . . . . . . . . . . . . . . . . . . . . . . . . . . . . . . . . . . 30
2.6 Synthesis of Emerging Issues From the Analyses . . . . . . . . . . . . . . . . . . . . . . . . . . . . . .31
2.6.1 SWOT analysis . . . . . . . . . . . . . . . . . . . . . . . . . . . . . . . . . . . . . . . . . . . . . . . . . . . 31
2.6.2 Bottleneck analysis . . . . . . . . . . . . . . . . . . . . . . . . . . . . . . . . . . . . . . . . . . . . . . . . 33
3. Strategic Direction for Health 2016-2020 . . . . . . . . . . . . . . . . . . . . . . . . . . . . . . . . 35
3.1 Overall Structure of the Strategy . . . . . . . . . . . . . . . . . . . . . . . . . . . . . . . . . . . . . . . . . . . 35
3.2 Vision . . . . . . . . . . . . . . . . . . . . . . . . . . . . . . . . . . . . . . . . . . . . . . . . . . . . . . . . . . . . . . . . 35
3.3 Mission . . . . . . . . . . . . . . . . . . . . . . . . . . . . . . . . . . . . . . . . . . . . . . . . . . . . . . . . . . . . . . . .36
3.4 Principles and values . . . . . . . . . . . . . . . . . . . . . . . . . . . . . . . . . . . . . . . . . . . . . . . . . . . . . 36
3.5 Key Result Areas . . . . . . . . . . . . . . . . . . . . . . . . . . . . . . . . . . . . . . . . . . . . . . . . . . . . . . . . 36
3.6 Strategic Responses . . . . . . . . . . . . . . . . . . . . . . . . . . . . . . . . . . . . . . . . . . . . . . . . . . . . . . 39
Priority 1: Communicable Diseases . . . . . . . . . . . . . . . . . . . . . . . . . . . . . . . . . . . . . . . . . 40
Priority 2: Non-communicable diseases (NCDs) . . . . . . . . . . . . . . . . . . . . . . . . . . . . . . 41
Priority 3: Reproductive, Maternal, Newborn, Child Health and Adolescents . . . . . . . 42
Priority 4: Public Health surveillance & disaster preparedness and response
programme . . . . . . . . . . . . . . . . . . . . . . . . . . . . . . . . . . . . . . . . . . . . . . . . . . . . . . 45
Service Delivery Platforms/Entities . . . . . . . . . . . . . . . . . . . . . . . . . . . . . . . . . . . . . . . . 46
Primary Care Services . . . . . . . . . . . . . . . . . . . . . . . . . . . . . . . . . . . . . . . . . . . . . . 46
Hospital Services . . . . . . . . . . . . . . . . . . . . . . . . . . . . . . . . . . . . . . . . . . . . . . . . . .49
Enabling Environment for Service Delivery . . . . . . . . . . . . . . . . . . . . . . . . . . . . . . . . . . 51
Policy and Administration . . . . . . . . . . . . . . . . . . . . . . . . . . . . . . . . . . . . . . . . . . 51
Multi-Sectoral Partnerships . . . . . . . . . . . . . . . . . . . . . . . . . . . . . . . . . . . . . . . . . .54
Research and Development . . . . . . . . . . . . . . . . . . . . . . . . . . . . . . . . . . . . . . . . . 58
4. Implementation of National Health Strategy 2016-2020 . . . . . . . . . . . . . . . . . . . . 61
4.1 Implementation Framework . . . . . . . . . . . . . . . . . . . . . . . . . . . . . . . . . . . . . . . . . . . . . . . 61
4.2 Costing scenarios and key assumptions . . . . . . . . . . . . . . . . . . . . . . . . . . . . . . . . . . . . . . 63
References . . . . . . . . . . . . . . . . . . . . . . . . . . . . . . . . . . . . . . . . . . . . . . . . . . . . . . . . . . .65
Annex . . . . . . . . . . . . . . . . . . . . . . . . . . . . . . . . . . . . . . . . . . . . . . . . . . . . . . . . . . . . . . 66
National Health Strategy For Zimbabwe 20162020 v
National Health Strategy for Zimbabwe 2016-2020FINAL_01-03-17.qxp_Layout 1 1/3/2017 15:14 Page vi
Abbreviations
AIDS Acquired Immunodeficiency Syndrome
ARI Acute Respiratory Infection
ARC AIDS Related Conditions
ART Antiretroviral Therapy
ASRH Adolescent Sexual and Reproductive Health
BCC Behaviour Change Communication
BCG Bacille de Calmente et Guérin
BEmONC Basic Emergency Obstetric and Newborn Care
BMI Body Mass Index
BNA Bottleneck Analysis
BP Blood Pressure
BVIP Blair Ventilated Improved Latrine
CEmONC Comprehensive Emergency Obstetric and Newborn Care
CHC Community Health Centre
CHW Community Health Worker
CORDAID Catholic Organization for Relief and Development AID
CPR Contraceptive Prevalence Rate
CT Computerised Tomography
DHE District Health Executive
DPT Diptheria, Pertussis and Tetanus Vaccine
DOTS Directly Observed Treatment
DR-TB Drug Resistant Tuberculosis
ECCH Environmental Control Community Health clubs
EH Environmental Health
EHB Essential Health Benefits
EHI Environmental Health Initiative
EHO Environmental Health Officer
EHT Environmental Health Technician
EPI Expanded Programme on Immunisation
ETAT Emergency Triage Assessment and Treatment
FP Family Planning
GBD Global Burden of Disease
GDP Gross Domestic Product
GPA Government Programme of Action
GOZ Government of Zimbabwe
HAB Hospital Advisory Board
HACCP Hazard Analysis Critical Control Points
HAT Human African Trypanosomiasis
HBB Helping Babies Breathe
HCC Health Centre Committee
HDU High Dependency Unit
vi National Health Strategy For Zimbabwe 20162020National Health Strategy for Zimbabwe 2016-2020FINAL_01-03-17.qxp_Layout 1 1/3/2017 15:14 Page vii
Abbreviations
HIMS Health Information Management System
HIV Human Immunodeficiency Virus
HQ Headquarters
HRH Human Resources for Health
HTF Health Transition Fund
HTS HIV Testing Services
ICD International Classification of Diseases
ICU Intensive Care Unit
IDSR Integrated Disease Surveillance and Response
IHR International Health Regulations
IMNCI Integrated Management of Childhood & Neonatal Illnesses
IPT Intermittent Preventative Treatment
IRS Indoor Residual Spraying
KRA Key Results Areas
LARC Long-acting Reversible Contraceptive
LF Lymphatic Filariasis
LLIN Long Lasting Insecticide Treated Nets
MOHCC Ministry of Health and Child Care
MDG Millennium Development Goals
MDR Multi-Drug Resistance
M&E Monitoring and Evaluation
MICS Multiple Indicators Cluster Survey
MIMS Multiple Indicator Monitoring Survey
MMR Maternal Mortality Ratio
MNCH Maternal Newborn and Child Health
MRCZ Medical Research Council of Zimbabwe
MRI Magnetic Resonance Imaging
NAC National AIDS Council
NCD Non-communicable Diseases
NHMIS National Health Management Information System
NHS National Health Strategy
NIHR National Institute of Health Research
MTCT Mother to Child Transmission of HIV
NCD Non-Communicable Diseases
NGO Non Governmental Organisation
NMS National Micronutrient Survey
NTD Neglected Tropical Diseases
ODA Overseas Development Assistance
OI Opportunistic Infections
OJT On-the-Job Training
OOP Out of Pocket Expenditure
OPD Outpatient Department
ORS Oral Rehydration Salts
National Health Strategy For Zimbabwe 20162020 viiNational Health Strategy for Zimbabwe 2016-2020FINAL_01-03-17.qxp_Layout 1 1/3/2017 15:14 Page viii
Abbreviations
PBB Programme Based Budgeting
PBF Programme Based Funding
PCN Primary Care Nurse
PER Public Expenditure Review
PFM Public Finance Management
PHE Provincial Health Executive
PMTCT Prevention of Mother to Child Transmission of HIV
PNC Post Natal Care
PPIUCD Post-partum Intrauterine Contraceptive Device
PSM Procurement Supply and Management
RBF Results Based Financing
RCZ Research Council of Zimbabwe
RDT Rapid Diagnostic Test
RRT Rapid Response Team
TB Tuberculosis
SCH Schistosomiasis
SDG Sustainable Development Goals
SSA Sub-Saharan Africa
STH Soil Transmitted Helminthiases
STI Sexually Transmitted Diseases
SWOT Strengths, Weaknesses, Opportunities and Threats
TTT Technical Task Team
TWG Technical Working Group
UNAIDS The Joint United Nations Programme on HIV/AIDS
UNICEF United Nations Children’s Fund
VCT Voluntary Counseling and Testing
VIDCO Village Development Committee
VEN Vital, Essential and Necessary Drugs
VHW Village Health Worker
VMMC Voluntary Medical Male Circumcision
WARDCO Ward Development Committee
WCBA Women of Child Bearing Age
WDI World Development Indicators
WHO World Health Organisation
ZDHS Zimbabwe Demographic Health Survey
ZEPI Zimbabwe Expanded Programme on Immunisation
Zim-ASSET Zimbabwe Agenda for Sustainable Economic Transformation
ZIPHA Zimbabwe Public Health Association
ZMPMS Zimbabwe Maternal and Perinatal Mortality Study
ZNCR Zimbabwe national Cancer Registry
ZNFPC Zimbabwe National Family Planning Council
ZSARA Zimbabwe Service Availability and Readiness Assessment
ZIMSTAT Zimbabwe National Statistics Agency
viii National Health Strategy For Zimbabwe 20162020National Health Strategy for Zimbabwe 2016-2020FINAL_01-03-17.qxp_Layout 1 1/3/2017 15:14 Page ix
Executive Summary
The vision of the Zimbabwe Ministry of Health and Child Care is to have the highest possible level
of health and quality of life for all its citizens. This National Health Strategy 2016-2020 – Equity and
Quality of Health: Leaving No One Behind sets out the strategic direction for the health sector over
the next five years in order to attain this vision.
The 2016-2020 National Health Strategy builds on the 2009-2013 strategy and its extension in
2014-15 by addressing existing gaps and, more importantly, seeks to sustain the gains achieved thus
far through a comprehensive response to the burden of disease and strengthening of the health system
to deliver quality health services to all Zimbabweans. The strategy lays out the health agenda for 2016-
2020 taking into account the broader policy context that is largely defined by the Zimbabwe Agenda
for Sustainable Socio-Economic Transformation (Zim-Asset) and the Sustainable Development Goals.
The current challenges of economic growth worsened by a turbulent global market means that this
strategy cannot be business as usual as the country needs to find innovative ways of supporting the
health sector. Equally important is the need to ensure that other sectors directly and indirectly linked
to health align their programmes and activities to contribute towards a healthy population - hence the
ZimAsset’s clusters approach.
The 2009-2012 period saw the economy rebounding and beginning to reverse the consequences of
near collapse of the health system in 2008. However, the period 2013-2015 saw a dramatic drop in
economic growth and the prospects for the next five years are predicted to remain sluggish.
Consequently, government fiscal space is likely to shrink thereby increasing the need for external
funding to support the health infrastructure, retain health workers, medicines and commodities supply
and distribution, amongst others. Improving the quality of health services and ensuring that these
services are accessed equitably is the main challenge that this strategy seeks to address under these
circumstances.
A systematic review of existing reports, data and evidence regarding the performance of the health
sector shows that Zimbabweans still faces a double burden of communicable and non-communicable
diseases. Zimbabwe is prone to epidemic diseases including diarrhoeal disease and outbreaks of anthrax
and rabies are common, highlighting the critical importance of public health surveillance and a disaster
preparedness and response programme. HIV prevalence remain relatively high at 15% amongst adults
and gains achieved to date are threatened by the deteriorating indicators and risky behaviors amongst
the youth and increasing number of teenage pregnancies. Deaths due to TB remain high due to its
twin relationship with HIV and AIDS. Malaria remains a major cause of morbidity and mortality in
the country and more so in some geographic areas.
Non-communicable diseases are emerging as major cause of morbidity and mortality amongst both
the rich and the poor in the country. The nutrition status of children remains poor. These challenges
are compounded by health systems constraints related to shortages of critical health workforce, aging
infrastructure and equipment, limited supply of medicines and other commodities, limited health
funding, and considerable challenges with the service delivery platforms or entities and the enabling
environment. Addressing the challenges requires strengthened service delivery platforms or entities
including primary care and hospital services, and creation of an enabling environment with attention
to issues of policy and administration, multi-sectoral partnerships and research and development.
National Health Strategy For Zimbabwe 20162020 ixNational Health Strategy for Zimbabwe 2016-2020FINAL_01-03-17.qxp_Layout 1 1/3/2017 15:14 Page x
Executive Summary
Building on this situation analysis, the strategy is structured as shown below:
National Health Strategy, 2016-2020
Equity and Quality in Health: Leaving No One Behind
Vision of the Ministry of Health and Child Care
To have the highest possible level of health and quality of life for all its citizens
Mission of the Ministry of Health and Child Care
To provide, administer, coordinate, promote and advocate for the provision of equitable, appropriate, accessible, affordable
and acceptable quality health services and care to Zimbabweans while maximising the use of available resources in line with
the Primary Health Care Approach
Priority 4:
Priority 3:
Priority 2: Public health
Priority 1: Reproductive, Maternal,
Non-communicable surveillance and disaster
Communicable Diseases Newborn, Child and
Diseases preparedness and
Adolescents
response
Service Delivery Platforms or Entities
Enabling Environment
The priorities are closely interlinked and complementary, not numbered in any particular order of
importance.
This structure is elaborated to include three main goals and twenty one objectives, all with defined
Key Results Areas with their baselines and targets, as shown below:
Key Result Area Objective Key Indicator Baseline 2014 Target 2020
Goal 1: To strengthen priority health programmes
Priority 1: 1. To reduce malaria incidence from Malaria incidence 39 5
Communicable 39/1000 in 2014 to 5/1000 in 2020 and
malaria deaths to near zero by 2020 Malaria deaths 654 0
diseases
% of outbreaks detected
2. To ensure timely detection and
within 48 hours and 30% 100%
control of epidemic prone diseases
controlled within 2 weeks
3. To reduce morbidity due to
Schistosomiasis and soil transmitted 22.7%
Prevalence of STH and SCH 10%
helminthes and other NTDs by 50% by (for SCH/STH)
year 2020.
4. To prevent new HIV infections and to % people who are tested 40.3% (men)
85%
reduce deaths due to HIV by 50% and know their status 56% (women)
% of people on ART 63% 90%
% of ART patients virally
87% 90%
suppressed
5. To reduce mortality, morbidity and
Mortality rate 10% < 5%
transmission of tuberculosis by 90%
x National Health Strategy For Zimbabwe 20162020National Health Strategy for Zimbabwe 2016-2020FINAL_01-03-17.qxp_Layout 1 1/3/2017 15:14 Page xi
Executive Summary
Key Result Area Objective Key Indicator Baseline 2014 Target 2020
6. To reduce the incidence of selected
Priority 2: Non-Communicable Disease (NCDs) % reduction in NCDs burden 0% 5%
Non- by 50 %
communicable
Diseases % increase in number of
7. To improve the mental health diagnosed mentally ill to the
11.1% 90%
status of the population expected mentally ill
patients
Proportion of persons with
8. To reduce disability and disabilities who have access
52% 75%
dependence by 50% to the medical rehabilitation
services that they need
9. To improve the quality of life of
elderly persons and improve life % of older persons that
61.5yrs 65yrs
expectancy from 61.5 to 65 years receive geriatric care
by 2020
10. To reduce maternal mortality ratio
Priority 3: MMR 614 300
from 614 to 300 by 2020
Reproductive,
Maternal, 11. To reduce Neonatal Mortality Rate
Newborn, Child from 29 to 20 deaths per 1,000 live NMR 29 20
and Adolescents births
12. To reduce the under-five mortality
rate from 75 to 50 deaths per 1,000National Health Strategy for Zimbabwe 2016-2020FINAL_01-03-17.qxp_Layout 1 1/3/2017 15:14 Page xii
Executive Summary
Key Result Area Objective Key Indicator Baseline 2014 Target 2020
Hospital Services 17. To ensure universal access and
% of tertiary hospitals
provision of quality tertiary specialist 29% 100%
with specialists
curative services
% of patients and families 40%
18. To promote and support provision 200,000
needing palliative care (80,000
of quality palliative care services in need
who are receiving it people)
Goal 3: To improve the enabling environment for service delivery
Policy Planning 19. To improve health outcomes
and Coordination through facilitation and co-ordination % of policies and strategies
0 100%
of an effective and efficient health aligned to the NHS
delivery system
Human Resources Overall vacancy rate 17% 10%
Finance and Number of institutions 82
9
Administration audited against the plan cost centres
Number of districts with
0 62
functional PFMS
Monitoring and Harmonised M&E policy
0 1
Evaluation framework
Quality Assurance
and Quality Harmonised quality
0 1
Improvement framework
Development
Provincial % of actual to planned PHT
30% 100%
Administration reviews convened per year
Procurement and
% availability of essential
Supply Chain 42% 80%
medicines
Management
Multi-sectoral 20. To strengthen multi-sectoral A policy on public/private
Partnership collaboration with local and and public/public 0 1
international partners partnerships
% of functional national
and subnational
4% 90%
intergovernmental
platforms
Research and 21. To improve uptake of scientific % health research
Development research evidence for decision making informed by the national 25% 70%
and policy development by 70% health research priorities
Number of clinical trials
on Traditional Medicine 2 4
conducted
The implementation framework and costing and funding options for the strategy will aid in
operationalising the strategy and meeting its targets, towards the vision of having the highest possible
level of health and quality of life for all Zimbabweans. Key issues that will be addressed in
implementation include provision of an essential health benefits package, investments in health systems
strengthening, leveraging multi-sectoral actions, gender mainstreaming specifically targeting women
and young girls to improve gender equity, and community participation at all levels. It is important
that achievements to date are maintained and indeed improved, otherwise the vision, mission and
strategy goals will not be realised by 2020.
xii National Health Strategy For Zimbabwe 201620201
National Health Strategy for Zimbabwe 2016-2020FINAL_01-03-17.qxp_Layout 1 1/3/2017 15:14 Page 1
Overall Context of the
National Health Strategy
2016-2020
1.1 Introduction
The Zimbabwe 2016-2020 National Health Strategy builds on the Zimbabwe Agenda for Sustainable
Economic Transformation (ZimAsset) which represents a blueprint for the country’s development
path from October 2013 to December 2018. It provides the basis and context for all sector strategies
and programmes towards the achievement of its vision, namely “Towards an empowered society and
growing economy”. The National Health Strategy 2016-20 derives from this national vision and
provides a framework for attaining health and health related goals and objectives. It assumes the spirit
of the Zim-Asset that seeks to attain “quick wins” and is structured around the Results Based
Management system that focuses on a clear vision, mission, values, key results areas, goals and
objectives. Unlike past strategies, the NHS 2016-20 is complemented by a detailed monitoring and
evaluation framework that will be used to assess progress through mid-term and end-term evaluations
(Annex I).
1.2 The constitution and its provision for health
The Constitution of Zimbabwe explicitly provides for the right to health care in Section 76, sub-section
1 to 4 that:
“(1) Every citizen and permanent resident of Zimbabwe has the right to have access to basic
health-care services
(2) Every person living with a chronic illness has the right to have access to basic healthcare
services for the illness
(3) No person may be refused emergency medical treatment in any health-care institution,
and
(4) The State must take reasonable legislative and other measures, within the limits of the
resources available to it, to achieve the progressive realization of the rights set out in this
section”
The Constitution further provides, in Section 77 that every person has a right to safe, clean and potable
water, and sufficient food (Food Security, Quality and Safety). These rights are directly related to
peoples’ health as it not possible to divorce the living conditions of people from their health risks and
status. This national health strategy is indeed subordinate to these constitutional provisions and the
State has the responsibility to create a conducive environment in which it is possible for all people in
Zimbabwe to access basic health services whenever they need them.
National Health Strategy For Zimbabwe 20162020 1National Health Strategy for Zimbabwe 2016-2020FINAL_01-03-17.qxp_Layout 1 1/3/2017 15:14 Page 2
Overall Context for The National Health Strategy 2016-2020
1.3 National Health Strategy alignment with Government
Programme of Action (GPA)
The Zim-Asset, a Results Based Management agenda, recognizes that socio-economic development
requires substantial transformation in all sectors and that change requires multi-sectoral actions and
working transversally. The Zim-Asset has four clusters and the Ministry of Health and Child Care
(MOHCC) is part of the clusters on Food Security and Nutrition, and Social Service and Poverty
Reduction. The outcomes and strategies set for achieving Zim-Asset goals provide a strong basis for
this strategy because the MOHCC is mandated to lead and provide these services on behalf of the
entire country and contribute to broader socio-economic development. For instance, key outcomes
on nutrition include reduction in stunting among children, and improved availability of quality food
and nutrition data; and improved enabling legal, food and nutrition policy regulatory environment.
With regards to social services delivery, the MOHCC is responsible for several outcomes related to
priority health interventions including in the areas of reproductive, maternal, newborn, child and
adolescent health; communicable diseases (Human Immuonodeficiency Virus - HIV, Tuberculosis -
TB, malaria and diarrhoea); non-communicable diseases; and creation of an enabling environment for
the delivery of quality services through appropriate policy and regulatory frameworks, reduction of
financial barriers, improved procurement and supply of health products and equipment, and improved
infrastructures, amongst other things.
The strategies in the GPA are guided by the notion of “quick wins” and this philosophy permeates
the NHS 2016-2020. Although the ZIM-Asset planning horizon extends up to 2018, this strategy
conforms to that planning trajectory, and also recognizes the importance of mid-term reviews in
influencing the assumed trajectory. The strategy comes into effect at a time when Government is
implementing Programme Based Budgeting (PBB), a reform process that will not only see alignment
of resource budgeting and outcomes, but also necessary reforms to improve the performance of the
health system.
1.4 The health sector and global commitments
Zimbabwe still confronts the unfinished Millennium Development agenda as not all of the goals and
targets were met. According to the 2014 Multiple Indicator Cluster Survey (MICS), the maternal
mortality ratio remains high at 614 deaths per 100,000 live births (versus a target of 174 deaths per
100,000 live births); the under five child mortality rate is at 75 deaths per 1,000 live births (versus a
target of 43 per 1000 live births); the nutritional status of children remains problematic, and HIV and
AIDS, TB and malaria remain major causes of morbidity and mortality. The strategy is aligned to the
Sustainable Development Goals (SDG) agenda, which also takes into consideration the unfinished
MDGs agenda. Of the 17 goals, Goal 3 “Ensure healthy lives and promote well-being for all at
all ages” directly focuses on health, and accordingly, the vision, mission and goals of this strategy
relate to it. It is also important to highlight Goal 5 “Achieve gender equality and empower all
women and girls” which brings to the fore the need to address specific challenges that affect women
and girls who tend to be disproportionately affected by poverty, diseases, violence and other social ills.
This strategy, as described in the SDG framework seeks to realize the human rights of all and to achieve
gender equality and the empowerment of all women and girls.
2 National Health Strategy For Zimbabwe 20162020National Health Strategy for Zimbabwe 2016-2020FINAL_01-03-17.qxp_Layout 1 1/3/2017 15:14 Page 3
Overall Context for The National Health Strategy 2016-2020
Importantly, these goals are integrated and indivisible, and balance the three dimensions of sustainable
development: the economic, social and environmental. This 2016-2020 Zimbabwe National Health
Strategy responds to this call for action in a variety of ways as it seeks to contribute to improving the
quality of lives of Zimbabweans.
1.5 Socio-economic and demographic context
Understanding the socio-economic and demographic context allows for an analysis of what is feasible
in the medium to long term, and also identification of population groups that need to be targeted for
health services and those that that are at risk of various diseases and conditions.
Economic growth slowed down compared to what was projected in the Zim-Asset of 6.2% by 2014,
and the prospects over the strategy period are that economy will remain sluggish in the short to medium
term, and total tax revenues will generally remain at about 27% of GDP (Public Expenditure Revie –
PER - 2015). The fiscal trends and projections are important indicators of the government’s capacity
to allocate financial resources to the health sector. The World Bank revised the economic growth rate
for 2015 from the projected 4.2% to 3% due to low investment levels, poor performance of the mining
sector and the poor global economic environment. The country has a large debt of nearly $10 billion
that needs to be serviced. Unemployment levels remain high with the majority of the people now in
informal employment. This macro-economic environment requires innovation and effective
partnerships between government and various partners including communities, in both funding and
providing health services to the population.
Population size and structure
Zimbabwe covers 390,757 square kilometres and has 10 provinces and 63 districts. The total population
is 13,061,239 translating to the population density of 33. The country has 6,280,539 males and
6,780,700 females. The urban population is 4,284,145 (33%) and the rural population is 8,777,094
(67%) . The total fertility rate is estimated at 4.3 children per woman, and the age-specific fertility rate
for women aged 15-19 years is 120 births per 1000 women (MICS 2014). The population growth rate
is estimated at 2.7% per year. Over 50% of the population is youth (see Figure 1).
Figure 1: Zimbabwe’s Population Pyramid 2014
Source: Zim Census 2012
National Health Strategy For Zimbabwe 20162020 3National Health Strategy for Zimbabwe 2016-2020FINAL_01-03-17.qxp_Layout 1 1/3/2017 15:14 Page 4
Overall Context for The National Health Strategy 2016-2020
The youth, particularly adolescents, are the future and therefore present both challenges and
opportunities for addressing current and future health issues. This particular population group has
shown deteriorating health indicators over the last five to ten years in terms of behavior change towards
HIV and other sexually transmitted diseases, early sexual debut, unplanned pregnancies, high fertility,
increased smoking habits, drugs and substance abuse, worsening perceptions about gender violence
and unhealthy eating habits and lifestyles in general. The advent of new communication technologies
and sedentary entertainment presents both challenges and opportunities. There are now multiple-
channels for communicating with the youth, which need to be used as part of the communication
strategy. However, the youth are also becoming less active and this is compounded by unhealthy eating
habits.
With the majority of the people in rural areas, urban migration remains an ongoing phenomenon
resulting in the number of the urban poor increasing. Within the rural areas, resettled farmers are a
key target population given the need to improve access to water, sanitation and health services to these
populations. The risk of epidemics including cholera remains high because of limited access to clean
water and sub-optimal waste management. Effective public health interventions are a priority for these
key groups if health services coverage and most importantly outcomes are to improve.
4 National Health Strategy For Zimbabwe 201620202
National Health Strategy for Zimbabwe 2016-2020FINAL_01-03-17.qxp_Layout 1 1/3/2017 15:14 Page 5
Situation Analysis of
Zimbabwe’s Health Sector
2.1 Health Systems Organisation and Status
Zimbabwe assumed the Primary Health Care approach in 1980 and its health system is structured
accordingly. The health services delivery platforms include primary, secondary, tertiary (provincial) and
quaternary (central) facilities and these are shown in Table 1. The majority of these health facilities are
at primary care level which refer complicated cases to the next levels of care. Mission and private sector
facilities provide considerable services mostly in rural and urban areas respectively.
Table 1: Health facilities profile for Zimbabwe
Facility level/ Managing Authority All facilities Hospitals Primary Health Facilities
Central Hospitals 6 6
Provincial hospitals 8 8
District Hospitals 44 44 0
Mission Hospitals 62 62 0
Rural Hospitals 62 62 0
Private Hospitals 32 32 0
Clinics 1,122 0 1,122
Polyclinics 15 0 15
Private clinics 69 0 69
Mission clinics 25 0 25
Council/Municipal Clinics/FHS 96 0 96
Rural Health Centre 307 0 307
Totals 1,848 214 1,634
Source: ZSARA, 2015
The status of the current health system organization and readiness is aptly described in the recent
Zimbabwe Service Availability and Readiness Assessment survey (ZSARA 2015). In the ZSARA survey,
general services availability was measured using facility densities such as health facility, inpatient beds,
maternity beds, health workers, outpatient visits and inpatients. Three of these metrics – health facility
density, core health worker density and inpatient bed density are shown in Figures 2, 3 and 4 respectively.
Overall, none of the provinces met the target for health facility density. Bulawayo is the only province
that exceeded the core worker and inpatient bed density target.
National Health Strategy For Zimbabwe 20162020 5National Health Strategy for Zimbabwe 2016-2020FINAL_01-03-17.qxp_Layout 1 1/3/2017 15:14 Page 6
Situation Analysis of Zimbabwe’s Health Sector
Figure 2: Health Facility Density per 10,000 population
Health Facility Density
per 10000 Population
2
Number of Facilities 2.5
Target
2.0
1.5
1.0
0.5
0.0 National
Harare
Bulawayo
Manicaland
Mashonaland Central
Mashonaland West
Masvingo
Matabeleland South
Matabeleland North
Midlands
Mashonaland East
Province
Source: ZSARA, 2015
Figure 3: Inpatient bed density per 10, 000 population
Inpatient Bed Density
45
Number of Inpatent Beds
40
per 10000 Population
35 25
30
25 Target
20
15
10
5
0
National
Harare
Bulawayo
Manicaland
Mashonaland Central
Mashonaland West
Masvingo
Matabeleland South
Matabeleland North
Midlands
Mashonaland East
Province
Source: ZSARA, 2015
Figure 4: Core-health workforce density per 10,000 population
Core Health Workforce Density
Number of Core Health Workforce
30
23
25
per 10000 Population
Target
20
15
10
5
0
National
Harare
Bulawayo
Manicaland
Mashonaland Central
Mashonaland West
Masvingo
Matabeleland South
Matabeleland North
Midlands
Mashonaland East
Province
Source: ZSARA, 2015
6 National Health Strategy For Zimbabwe 20162020National Health Strategy for Zimbabwe 2016-2020FINAL_01-03-17.qxp_Layout 1 1/3/2017 15:14 Page 7
Situation Analysis of Zimbabwe’s Health Sector
The study also generated evidence on general service readiness on selected basic domains (Box 1), and
specific tracer services such as HIV and AIDS, MNCH, TB, malaria, diabetes and others.
BOX 1: General Service Readiness indicators
! Basic amenities: Sanitation facilities were available in all facilities. 96% had access to
emergency transportation and an improved water source.
! The item with the lowest availability was the computer with internet/email access, at only
21%.
! Urban locations had a higher availability of basic amenities items compared to rural
locations. Hospitals were more likely to have all basic amenities compared to primary
care facilities.
! Basic equipment: Thermometers were available across all facilities. Items such as
stethoscope, blood pressure apparatus, and adult scale were available in nine of ten
facilities nationally. Light source had the lowest availability at 58%. Four in ten facilities
had all six basic equipment items.
! Standard precautions: Auto disposable syringes were available in all facilities.
Disinfectants, latex gloves and appropriate storage of sharps waste were available in nine
out of ten facilities across provinces.
! Six in ten facilities had an appropriate storage for infectious waste. Only one in three
facilities had all items for standard precautions.
! Capacity to conduct diagnostic tests on site was relatively high i.e. >70%. Nine in ten
facilities conducted malaria rapid tests or HIV rapid tests on site.
! Eight in ten facilities conducted syphilis rapid test and urine dipstick for protein/glucose.
! Less than half (50%) of facilities had tests available blood glucose, urine test for
pregnancy and haemoglobin.
! Only 1 in 10 facilities reported having all tests available. There were no major variations
between hospitals and primary care facilities in diagnostic capacity.
! Essential medicines: Antibiotics such as oral Amoxicillin were available at almost all
facilities (98%). Injectable antibiotics such as gentamycin, ceftriaxone, and ampicillin were
the least available (31%)
! Magnesium sulphate and oxytocin were available in 9 out of 10 facilities.
Source: ZSARA, 2015
The study found a general service readiness index of 78% with urban locations having higher overall
readiness scores compared to rural locations (Figure 5). Basic equipment scores were generally similar
between rural and urban locations (69% rural versus 66%) urban. Worth noting was that diagnostics
were the lowest at 69%.
National Health Strategy For Zimbabwe 20162020 7National Health Strategy for Zimbabwe 2016-2020FINAL_01-03-17.qxp_Layout 1 1/3/2017 15:14 Page 8
Situation Analysis of Zimbabwe’s Health Sector
Figure 5: General Service readiness index and domain scores by nationally, Zimbabwe 2014
100
90 87
83
80 78 78 75
70 69
60
50
40
30
20
10
0
General Several Basic Ameni!es Standard Basic Equipment Diagnos!cs Essen!al
Readiness Index mean score Precau!ons mean score mean score Medicines mean
mean score score
Source: ZSARA, 2015
This assessment shows that despite the threat of a near collapse of the health system in 2008, the
health system has largely remained resilient enough to provide basic services to the majority of the
people. However, challenges remain in terms of service gaps and more importantly quality of services
to ensure effective coverage. The other key challenge affecting access is the question of direct payment
for health services (Out Of Pocket (OOP) – formal or informal) which presents household hardships
especially for those who are poor and vulnerable. Furthermore, improving quality of services and
equitable access means that health workers must be available when needed with the right attitudes and
work ethics to meet user needs.
Client satisfaction surveys conducted as part of the Results Based Financing (RBF) on Out Patient
Department (OPD) visits, family planning, antenatal care, labour, and delivery services showed that
the average waiting time was 48 minutes, ranging from six minutes to eight hours (CORDAID 2015).
Eighty percent of clients waited for an hour or less, and of these 89% thought the waiting time was
reasonable. An equally high percentage (80%) acknowledged that the staff who received them at the
facility were friendly. The majority of clients (84%) acknowledged that that all the prescribed medicines
were available at the facility while 15% said that the prescribed medicines were partially available and
1% stated that medicines prescribed were not available in the facility. 16% of the clients paid for
services, and the overall satisfaction level was high at 98%. The caveat to these findings is that this
study was done in RBF intervention districts in which health workers had an explicit incentive regime
to provide satisfactory services. This strategy seeks to build on the current levels of client satisfaction
in these areas and enhance overall health systems responsiveness.
If the Primary Healthcare Approach is to be implemented effectively, strong community systems are
essential. Although community structures exist to assist in both health promotion and provision of
health services, they need to be strengthened beyond supporting the Village Health Worker (VHW).
The role of traditional and local leadership, community structures and community participation needs
to be elevated if health interventions are to be effective and sustained over time. Communities play a
major role not just in receiving the services they need, but also in co-production of these services and
their funding and governance.
8 National Health Strategy For Zimbabwe 20162020National Health Strategy for Zimbabwe 2016-2020FINAL_01-03-17.qxp_Layout 1 1/3/2017 15:14 Page 9
Situation Analysis of Zimbabwe’s Health Sector
2.2 General performance of the health sector 2009 to 2015
Life expectancy for Zimbabweans increased from 34 years in 2006 to 58.5 years in 2015, with women
at 61.3 years compared to men at 56.2 years (WHO 2013). This positive trend is also reflected in the
major health indicators such as the maternal mortality ratio which has declined from 960 per 100,000
to 614 per 100,000. However, these figures remain unacceptably high and well below the expired MDG
targets (Figure 6).
Figure 6: Trends in Maternal Mortality in Zimbabwe
1200 ZDHS
MICS 2014
1000 960
800
695
600 614
MMR
555
400
283
200
0
1994 1999 2000 2011 2014
Source: MOHCC
Child mortality trends do not show any noticeable changes since the early 1980s and it is clear that
neonatal and infant mortality remain unacceptably high (Figure 7). The key strategic question is: what
is driving this mortality profile?
Figure 7: Trends I Child Mortality
120 ZDHS
MICS 2014
100
80
Neonatal Mortality
60
Infant Mortality
40 Childhood Mortality
27 29 31 29
20 24 24 Under 5 Mortality
0
1988 1994 1999 2006 2011 2014
Source: MOHCC, 2014
National Health Strategy For Zimbabwe 20162020 9National Health Strategy for Zimbabwe 2016-2020FINAL_01-03-17.qxp_Layout 1 1/3/2017 15:14 Page 10
Situation Analysis of Zimbabwe’s Health Sector
These high mortality figures are occurring in a context in which coverage for maternal and child health
services has generally improved (Table 2). The implication is that there are issues to do with the quality
of services provided that this strategy seeks to address. Table 2 shows specific indicators related to
maternal and child mortality since 2009.
Table 2: Selected Maternal Health Indicators, 2009-2014
GOAL: To reduce the Maternal Mortality Ratio from 725 to 300 deaths per 100,000 live births by 2015
Indicator 2009 2013 2014 Target 2015
% pregnant women who have 19.4% 15% 31.2%
44.4%
1st ANC visit in 1st trimester (ZDHS 2010/11) (MOHCC reports) (MICS 2014)
% of pregnant women with at 64.8% (ZDHS 67% 70.1%
90%
least 4 ANC visits 2010/11) (MOHCC reports) (MICS 2014)
% of deliveries which are 65.1% 76% 80%
80%
institutional delivery (ZDHS (2010/11) (MOHCC reports) (MICS (2014)
% deliveries attended by skilled 66.2% 76% 80%
80%
health personnel (ZDHS 2010/11) (MOHCC reports) (MICS 2014)
% of hospitals equipped to provide 45% 96.8%
No Data 85%
BEmONC (MOHCC reports) (VHMAS 2014)
% of hospitals equipped to provide 37.6% 69.1%
No Data 80%
comprehensive EmONC (MOHCC reports) (VHMAS 2014)
96.9% 99%
% Facilities providing PNC No Data 98%
(NIHFA 2012) (VHMAS 2014)
43% 49% 83.5%
% PNC attendance 80%
(ZDHS 2010/11) (MOHCC reports) (MICS 2014)
% of public health facilities 97%
ZNFPC ZNFPC 98%
providing oral contraceptives (DTTU)
Source: MOHCC, 2014
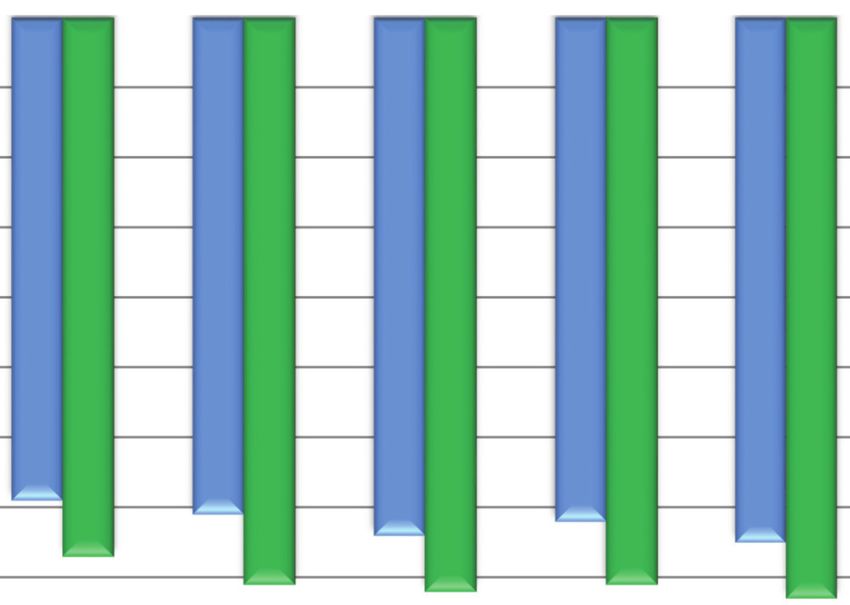
2.3 Expenditure on health
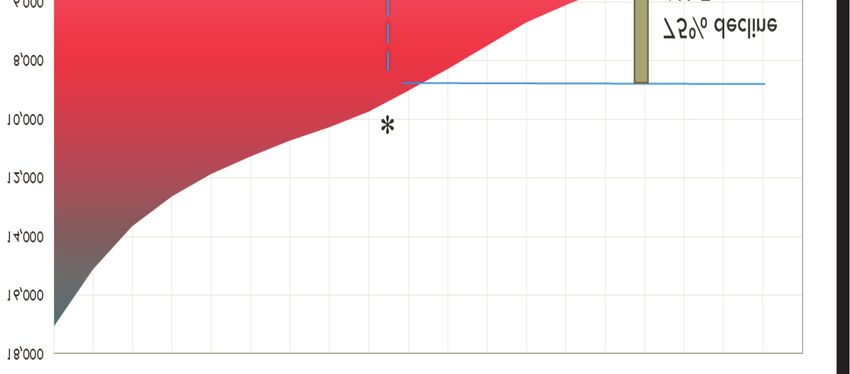
Government funding for health has generally improved since 2009 reaching a peak in 2012 of 8% of
total government expenditure (Figure 8). However, this remains below the Abudja declaration
commitment of 15% of total government spend. During the same period external funding significantly
increased from $167 million in 2009 to $428 million by 2012. Such funding has greatly contributed to
the performance of priority health programmes and more recently to the gains made in health systems
strengthening, particularly retention of health workers and procurement and distribution of essential
health commodities, amongst other things. Out-of-Pocket Expenditure (OOP) contributions remain
unacceptably high at 49% (NHA, 2010) given their negative effects on households. In 2009, per capita
expenditure was $9 and this is estimated to have increased to $24 in 2015. Nonetheless, Cartarm house
recommends per capita spend of $86, meaning that Zimbabwe is still well below this benchmark. The
cost per capita for an Essential Health Benefits (EHB) package at primary care level alone is estimated
at $56, which points to the need to double current per capita spend.
10 National Health Strategy For Zimbabwe 20162020National Health Strategy for Zimbabwe 2016-2020FINAL_01-03-17.qxp_Layout 1 1/3/2017 15:14 Page 11
Situation Analysis of Zimbabwe’s Health Sector
Figure 8: MOHCC Expenditure in total and as share of General Government, 2009-2013
Source: Authors using MOFED data
The current public health expenditure pattern shows that 80% goes to salaries, and curative services
consume a disproportionate amount of what remains meaning that preventative services and research
receive relatively less. Whilst external funding is needed, it tends to target specific programmes at the
expense of others creating resource challenges in other areas. Equitable mechanisms for allocating
resources across health programmes, service levels and geographies are thus necessary. Equally
important is the need to ensure that allocated resources are used appropriately and efficiently to achieve
intended results. Performance based funding models (e.g. Results Based Financing - RBF) present
opportunities for addressing these issues.
Overall, the health sector is underfunded and largely dependent on external funding for service delivery
(over 40% Overseas Development Assistance – ODA - in 2012) given that most of government
expenditure on health goes to salaries. This is unsustainable and necessitates looking at other innovative
and sustainable ways of funding such as prepayment mechanisms and gradually reducing the share of
external funding and OOP.
2.4 Overall burden of diseases
Although significant progress has been made over the last few years, the country still faces a double
burden of communicable and non-communicable diseases. HIV prevalence remains relatively high at
15% amongst adults, and gains achieved to date are threatened by risky behaviors amongst youth and
increasing number of teenage pregnancies. Deaths due to TB remain high due to its twin relationship
with HIV and AIDS. Malaria remains a major cause of morbidity and mortality in the country and
more so in some geographic areas. Therefore the focus on major communicable diseases must be
sustained. At the same time, non-communicable diseases are indeed emerging as major causes of
morbidity and mortality amongst both rich and poor in the country. The nutrition status of children
remains poor. Outbreaks of anthrax and rabies are not unusual. The challenges are compounded by
health systems constraints related to shortages of critical health workforce, aging infrastructure
National Health Strategy For Zimbabwe 20162020 11National Health Strategy for Zimbabwe 2016-2020FINAL_01-03-17.qxp_Layout 1 1/3/2017 15:14 Page 12
Situation Analysis of Zimbabwe’s Health Sector
and equipment, supply of medicines and other commodities, limited health funding currently $24 per
capita (2015 estimate) versus the recommended $86 and general challenges with the service delivery
platforms and the enabling environment.
Table 3 shows the top causes of OPD utilization in 2014 with Acute Respiratory Infection (ARI) at
the top at 31%. Skin diseases, diarrhea, burns and other injuries contribute considerably to the
outpatient diseases and conditions.
Table 3: Top ten out-patient general new diseases and conditions by all age groups
(excluding STIs), 2014
Diseases/Conditions Numbers %
1 Acute Respiratory Infections 3,693,350 31.0
2 Skin diseases 959,885 8.1
3 Diarrhoea 763,136 6.4
4 Burns and Other Injuries 570,841 4.8
5 Malaria 535,931 4.5
6 Diseases of the eye 421,620 3.5
7 Dental conditions 178,948 1.5
8 Bilharzia 74,916 0.6
9 Dysentery 49,373 0.4
10 Nutritional Deficiencies 22,648 0.2
Source: MOHCC, 2014
Outpatient visits broken down by age (see Figures 9 and 10 respectively) show that the top five causes
for under-fives visits in 2014 were ARI , diarrhea, skin diseases, diseases of the eye, burns and other
injuries. For those five years and above, it was ARI, skin diseases, burns and other injuries, malaria and
diarrhoea.
Figure 9: Top ten out-patient general diseases and conditions, under-five years, 2014
Bilharzia 0.1
Poisoning & Toxic Eff 0.1
Dental conditions 0.1
Dysentery 0.3
Nutritional Deficiencies 0.5
Malaria 2.0
Burns + Other Injuries 2.8
Diseases of the eye 3.3
Skin diseases 10.3
Diarrhoea 10.4
ARI 46.6
0.0 5.0 10.0 15.0 20.0 25.0 30.0 35.0 40.0 45.0 50.0
"% of Total < New Cases"
Source: MOHCC, 2014
12 National Health Strategy For Zimbabwe 20162020National Health Strategy for Zimbabwe 2016-2020FINAL_01-03-17.qxp_Layout 1 1/3/2017 15:14 Page 13
Situation Analysis of Zimbabwe’s Health Sector
Figure 10: Top ten out-patient general diseases and conditions, five years and above, 2014
Poisoning & Toxic Eff 0.2
Dysentery 0.5
Bilharzia 0.9
Dental conditions 2.2
Diseases of the eye 3.7
Diarrhoea 4.4
Malaria 5.8
Burns + Other Injuries 5.8
Skin diseases 6.9
ARI 22.9
0.0 5.0 10.0 15.0 20.0 25.0
"% of Total >5 New Cases"
Source: MOHCC, 2014
Table 4 shows the top inpatient diseases and conditions for all age groups. It is clear that direct and
indirect obstetric causes, normal delivery, conditions of the respiratory system, poisoning and toxic
effects, ARI and certain conditions originating in the perinatal period contribute the most to this
inpatient burden. Slight morbidity patterns are observed for the one to four years age group, and
notable differences for those under one year old.
Table 4: Top ten inpatient diseases/conditions, All Age Groups, 2014
Rank Disease/Condition Cases
1 Direct & Indirect Obstetric Causes 137,286
2 Normal Delivery 84,940
3 Other Diseases of the Respiratory System 27,575
4 Poisoning and Toxic Effects 21,550
5 Acute Respiratory Infections 20,865
6 Certain Conditions Originating in the Perinatal period 16,554
7 Oral Cavity & Diseases of the digestive system 12,872
8 Parasitic Diseases 11,219
9 Intestinal Infections 10,638
10 Malaria 10,220
Source: MOHCC, 2014
The five major causes of hospital admissions in 2014 were direct and indirect obstetric causes (29.4%),
normal deliveries (18.2%), other diseases of the respiratory system (5.9%), poisoning and toxic effects
(4.6%), and ARI (4%).
National Health Strategy For Zimbabwe 20162020 13National Health Strategy for Zimbabwe 2016-2020FINAL_01-03-17.qxp_Layout 1 1/3/2017 15:14 Page 14
Situation Analysis of Zimbabwe’s Health Sector
Table 5: Top ten causes of hospital admissions, 2014
Diseases/ Conditions Cases %
Direct and Indirect Obstetric Causes 137286 29.4
Normal Delivery 84940 18.2
Other Diseases of the Respiratory System 27575 5.9
Poisoning and Toxic Effects 21550 4.6
ARI: Lower Respiratory Tract Infections & Influenza 18675 4
Certain Conditions Originating in the Perinatal period 16554 3.5
Oral Cavity & Diseases of the Digestive system 12872 2.8
Parasitic Diseases 11219 2.4
Intestinal Infections 10638 2.3
Malaria 10220 2.2
Source: MOHCC, 2014
Table 6 shows the national top twenty causes of mortality amongst Zimbabweans in 2014. The top
five causes of death include ARI, conditions originating from perinatal period, TB, HIV and meningitis.
Table 6: National top twenty causes of mortality, all ages
Conditions/Diseases Total Deaths
1 ARI 2,034
2 Certain conditions originating in the perinatal period 1,812
3 TB 1,134
4 Human immunodeficiency virus (HIV) disease all complications, AIDS and AIDS Related Conditions 853
5 Meningitis 823
6 Diarrhoea and gastroenteritis due to other infectious diseases (bacterial, viral, protozoal) 560
7 Heart failure (congestive and left ventricular) 510
8 Symptoms, signs and abnormal clinical & laboratory findings, not elsewhere 462
9 Other anaemias 455
10 Malaria 441
11 Renal failure 439
12 Other endocrine, vitamin, nutrients and nutritional deficiencies, obesity and metabolic disorders 403
13 Congenital infections and parasitic diseases, excluding HIV 402
14 Other diseases of intestines, including peritoneum 337
15 Cerebral infarction, Cerebrovascular accident (stroke) not specified as hemorrhage or infarction 270
16 Mycoses, including candidiasis 249
17 Intrauterine hypoxia and asphyxia 234
18 Other diseases of liver 223
19 Diabetes mellitus 206
20 Other heart diseases 194
Source: MOHCC, 2014
14 National Health Strategy For Zimbabwe 20162020You can also read