Catastrophe Modelling
and Climate Change
←
→
Page content transcription
If your browser does not render page correctly, please read the page content below
Catastrophe Modelling and Climate Change
Key Contacts
Trevor Maynard Head of Exposure Management & Reinsurance
Telephone: +44 (0)20 7327 6141 trevor.maynard@lloyds.com

Nick Beecroft Manager, Emerging Risks & Research
Telephone: +44 (0)20 7327 5605 nick.beecroft@lloyds.com

Sandra Gonzalez Executive, Emerging Risks & Research
Telephone: +44 (0)20 7327 6921 sandra.gonzalez@lloyds.com

Lauren Restell Exposure Management Executive
Telephone: +44 (0)20 7327 6496 lauren.restell@lloyds.com

Contributing authors:

Professor Ralf Toumi is Professor of Atmospheric Physics at the Department of Physics, Imperial College London. He is also a director
of OASIS LMF Ltd which promotes open access for catastrophe modelling.

Lauren Restell has worked in catastrophe modelling in the London market since 2006. Prior to joining Lloyd’s Exposure Management,
she held positions with Aon Benfield and Travelers following completion of an MSc in Climate Change at the University of East Anglia.

Case studies:

The case studies were provided by Professor James Elsner (Climatek), Madeleine-Sophie Déroche (Climate – Knowledge
Innovation Centre), Dr Ioana Dima and Shane Latchman (AIR), Professor Rob Lamb, Richard Wylde and Jessica Skeggs (JBA),
Iain Willis (EQECAT) and Dr Paul Wilson (RMS).

Acknowledgements:

Lloyd’s would also like to thank Matthew Foote (Mitsui Sumitomo), Steven Luck (W. R. Berkley Syndicate) and Luke Knowles (Catlin) for
their input to the report.

Disclaimer

This report has been produced by Lloyd's for general information purposes only. While care has been taken in gathering the data and
preparing the report, Lloyd's does not make any representations or warranties as to its accuracy or completeness and expressly
excludes to the maximum extent permitted by law all those that might otherwise be implied.

Lloyd's accepts no responsibility or liability for any loss or damage of any nature occasioned to any person as a result of acting or
refraining from acting as a result of, or in reliance on, any statement, fact, figure or expression of opinion or belief contained in this report.
This report does not constitute advice of any kind.

© Lloyd’s 2014    All rights reserved

Catastrophe Modelling and Climate Change

Contents
1   EXECUTIVE SUMMARY                                         4

2   INTRODUCTION                                              5

3   THE SCIENCE OF CLIMATE CHANGE                             6

4   CATASTROPHE MODELLING                                     8

5   CATASTROPHE MODELS AND CLIMATE CHANGE                    10

6   CONCLUSIONS AND RECOMMENDATIONS                          32

7   APPENDICES                                               33

8   REFERENCES                                               36

                                                                   3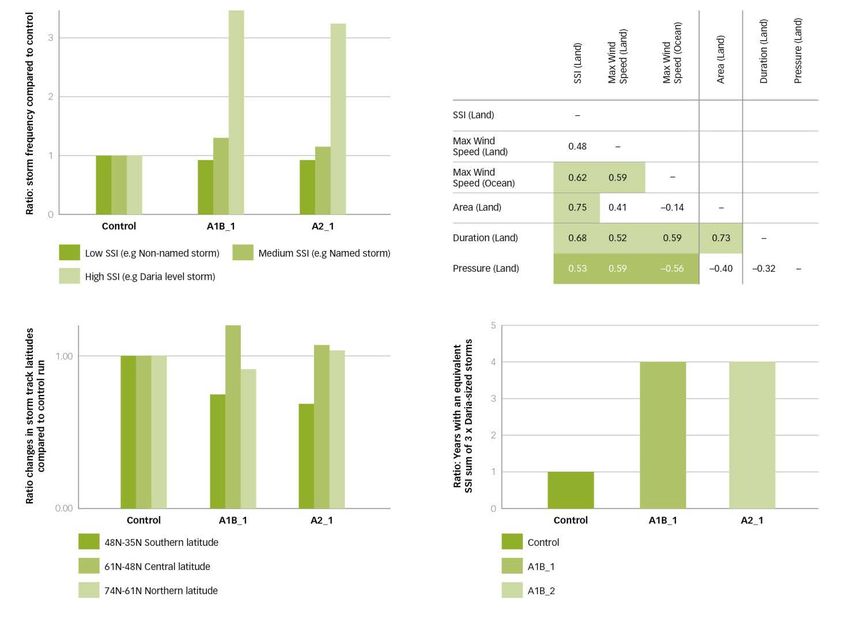
Catastrophe Modelling and Climate Change

1 Executive Summary

Scientific research points conclusively to the existence of climate change driven by human
activity. Nevertheless, significant uncertainty remains on the nature and extent of the changes to our
climate and the specific impacts this will generate. Many of the effects will become apparent over the coming
decades and anticipating them will require forward projections, not solely historical data.

Changes in the climate and weather patterns have the potential to affect extreme weather
events. Insurers have a key interest in understanding the impact of climate change on the frequency of
extreme weather events. The frequency of heat waves has increased in Europe, Asia and Australia and
more regions show an increase in the number of heavy precipitation events than a decrease. It is virtually
certain that since the 1970s there has been an increase in the frequency and intensity of the strongest
tropical cyclones in the North Atlantic basin.

Catastrophe modelling technology is now used extensively by insurers, reinsurers,
governments, capital markets and other financial entities. They are an integral part of any
organisation that deals with natural catastrophe risk and are used most commonly to perform activities such
as risk selection and underwriting, reserving and ratemaking, development of mitigation strategies, design of
risk transfer mechanisms, exposure and aggregate management, portfolio optimisation, pricing, reinsurance
decision-making and capital setting. The models help to quantify our understanding of the natural world.

Climate change trends may be implicitly built into catastrophe models, given the heavy use
of historical data in constructing them; however these TRENDS are not necessarily
explicitly incorporated into the modelling output. Uncertainties associated with the estimation of
the extent and frequency of the most extreme events means that the climate change impact can be difficult
to account for in risk models.

The sensitivity of hurricane losses is influenced by a number of factors related to climate
change, such as sea-level rise and sea surface temperature. There is a relationship between sea
surface temperatures and hurricane strength which suggests a gradual increasing trend. It is thus imperative
that changes in these are modelled accurately.

The approximately 20 centimetres of sea-level rise at the southern tip of Manhattan Island
increased SUPERSTORM Sandy’s surge losses by 30% in New York alone. Further increases in sea-
level in this region may non-linearly increase the loss potential from similar storms. Catastrophe models that
dynamically model surge based on current mean sea-level already factor this increased risk into their
projections.

Climate models continue to project impacts on extreme weather in the coming decades.
EQECAT show how future climate scenarios could see increases in the frequency of intense storms in
Europe, with a possible shift in storm track towards northern latitudes. JBA notes that climate change has
already increased the probability of flood events in the UK such as those which occurred in 2000, and a 1 in
5 rainfall event could be 40% larger in future.

4
Catastrophe Modelling and Climate Change

2 Introduction
The insurance industry has in recent years incurred major losses as a result of extreme weather. 2011 is
regarded as a record year for natural catastrophe, with insured losses costing the industry more than $127
       i
billion . A series of catastrophes at the end of the 1980s and the beginning of the 1990s posed a major
challenge to the insurance industry. The adoption of natural catastrophe models in the 1990s helped the
industry to analyse and measure risk more accurately, and use of these tools has now become the norm.
Given the prevalence of catastrophe models in insurance and the rising cost of extreme weather events, the
accuracy of modelled outputs is a key interest for insurers. The potential for climate change to drive changes
in the severity and likelihood of extreme weather events could have implications for the accuracy of natural
catastrophe models, and this report examines whether and how catastrophe models account for climate
change through a series of case studies provided by a range of academic and commercial model providers.

The Earth’s global climate system is warming. This conclusion is supported by a large body of evidence
which is presented in the scientific literature and most comprehensively in the five Assessment Reports
                                                                               1
published by the Intergovernmental Panel on Climate Change (IPCC) . Increasing greenhouse gas
concentrations in the atmosphere, largely due to human activity such as combustion of fossil fuels and land
use change, result in an enhancement of the planet’s natural greenhouse effect and in increased surface
warming. The additionally captured energy is stored to the largest part in the oceans and, in combination with
a warming of surface air temperatures, results in changes to the physical climate system. One example is the
impact on the hydrological cycle in the form of changed rainfall, in changes to atmospheric circulation and
weather patterns, in a reduction of global ice and snow coverage and in thermal expansion of the oceans
and subsequent sea level rise. These trends challenge insurers to examine both the economic impact of
climate change and the adequacy of the tools used to measure and price risks.

One of the primary concerns for insurers is the potential for these changes in climate and weather patterns to
affect extreme weather events. The Fourth Assessment Report of the IPCC (IPCC, 2007) highlighted the
importance of our understanding of extreme events, due to their disproportionate impact on society and
ecosystems when compared with gradual changes in the average climate. In 2012 the IPCC published a
Special Report focusing specifically on managing the risks of extreme climate events (IPCC, 2012, from now
on referred to as SREX) and the recently released draft of the IPCC’s Fifth Assessment Report (IPCC, 2013)
includes an update of the understanding and observational evidence of changes in climate extremes.

This report has three main parts. The first section reviews the latest findings in climate change science and
its effect on extreme weather events. The second outlines what catastrophe modelling is and how it came to
be developed. The third section examines whether and how catastrophes models account for climate change
through a series of case studies provided by a range of model providers, including AIR, RMS and EQECAT.
The appendices provide detail on the terminology used to describe levels of confidence and likelihood
(Appendix 1) and the limitations of climate models (Appendix 2).

1
    See Appendix 1 for further detail.

                                                                                                                 5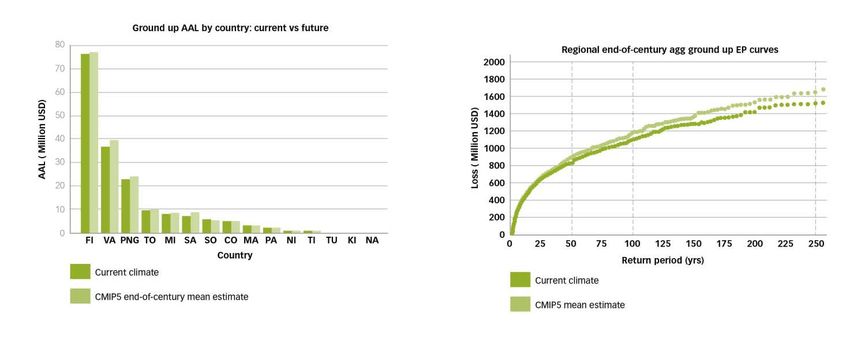
3 The science of Climate Change
The Summary for Policymakers of the IPCC’s Fifth Assessment Report (2013) reports an unequivocal
warming of the climate system. Changes are observed in atmospheric and oceanic temperatures, the extent
of ice and snow coverage, and the concentration of greenhouse gases in the atmosphere. Many of these
changes have been unprecedented over time scales from decades to millennia. Global average air
temperatures during the last three decades have been the warmest since 1850 and, in the northern
hemisphere, the past 30 years were likely the warmest period for at least 1,400 years. These long term
changes are generating widespread impacts, notably:

      •
                                                                                        2
          Increasing accumulation of energy in the world’s oceans: it is virtually certain that the top 700 m of
          the oceans warmed over the last four decades.

      •   From 1901-2010 global mean sea levels rose by approximately 19 cm. The rate of sea level change
                                    th
          since the middle of the 19 century is larger than the average rate of change over the past two
          millennia.

      •   There are changes in the mass losses in the Greenland and Antarctic ice sheets, a decrease in the
          size of glaciers all over the world and a shrinking extent of Arctic sea ice in the Northern
          Hemisphere.

      •   Atmospheric levels of the greenhouse gases carbon dioxide (CO2), methane and nitrous oxide are
          higher than at any time during the last 800,000 years. The main causes for this are the combustion
          of fossil fuels and changes in land use. Since pre-industrial times atmospheric CO2 concentrations
          have increased by 40% and the world’s oceans have absorbed about 30% of the emitted carbon.
          This increased uptake by the oceans results in their increased acidification levels.

Increased greenhouse gas concentrations, observed warming trends and scientific understanding of the
climate system point to a clear human influence on the climate system. Continued emissions of greenhouse
gases will result in further warming and are likely lead to changes in many climate system components.

3.1 Temperature extremes

The current understanding, which is based on a large body of evidence, indicates that most of the global
land areas that were analysed have undergone a significant warming in both minimum and maximum
                                         th       ii
temperature extremes since the early 20 century . An investigation of multiple data sets has shown with
high confidence a stronger increase in minimum temperatures than in maximum temperatures on a global
scale, and a global decrease in the number of cold nights and days with a simultaneous increase in warm
days and nights is very likely. There is however only medium confidence in the reduction of the daily
                                                                                               iii
temperature range, and the overall impact on probability distributions remains an open question .

In contrast to the observed large-scale warming, some regions exhibit changes that are indicative of
episodes of local cooling. These regions include central North America, the eastern United States and parts
of South America. The difference in the trend for these regions appears to be linked with maximum
temperatures that are connected with changes in the water cycle and land-atmosphere interactions and long-
term (multi-decadal) variability in the Atlantic and Pacific Oceans. There is only medium confidence that the
length and frequency of warm spells or heat waves have globally increased since the 1950s, which is partly
due to regionally insufficient data and remaining inconsistencies in the definition of extreme temperature
events. Nevertheless, it is considered likely that during this time period the frequency of heat waves has
                                          iv
increased in Europe, Asia and Australia .

2
    See Appendix 1 for common phrases used in the IPCC reports.

6
Catastrophe Modelling and Climate Change

3.2 Precipitation and droughts

A generally wetter climate is reflected consistently in changes to precipitation extremes. Recent findings
continue to support the earlier assessments that more regions show a statistically significant increase in the
number of heavy precipitation events than a decrease. However, the level of statistical significance is lower
for precipitation extremes than for extreme temperatures. This is due to spatial patterns of change being less
coherent when compared with temperature trends, as well as large areas showing opposite signs in their
respective trend. There is strong regional and sub-regional variation in precipitation extremes since 1950.
Additionally, it remains difficult to provide a universally valid definition for extreme precipitation events. Only
North and Central America and Europe exhibit likely (or higher confidence) increases in either frequency or
intensity of heavy precipitation. In Europe and the Mediterranean there remains significant seasonal and
regional variability with a large part of the increase occurring during winter (see e.g. Table 2.13 in IPCC,
2013). In Asia and Oceania, regions showing increasing extreme precipitation outweigh those exhibiting a
decrease, whereas for Africa a significant trend of extreme precipitation could not be established. In addition,
the trends for small scale severe local weather phenomena (such as hail or thunderstorms) are uncertain
                                                                                         v
due to inhomogeneous historical data and insufficient density of monitoring stations .

Assessment of changes in the magnitude or frequency of floods remains difficult. Working Group II of the
IPCC’s Fourth Assessment Report stated that no general trend existed in the incidence of floods. River
management is an important factor influencing trends in flooding. The strongest indication for flood trends
has so far been found in high latitudes of the Northern Hemisphere, although regional variability is such that
no clear evidence is currently available. SREX reports an earlier onset of spring flow in regions dominated by
snow, however both SREX and IPCC (2013) did not find global trends for flood occurrences, citing lack of
evidence.

The occurrence of droughts, on the other hand, was comprehensively assessed in the SREX report. SREX
concluded that distinction between different types of drought and complex issues with defining droughts have
a significant impact on conclusions on global scale trends, and reported with medium confidence that since
           th
the mid-20 century some regions of the world had experienced more intensive and longer droughts (IPCC,
2012). Due to the scarcity of direct measurements of soil moisture and other variables related to drought
often other related variables hydrological proxies are used for drought assessments. The severity of an
assessed drought event is highly dependent on the choice of variable and the length of time scale
considered. Agreement is however found for some regions. There is high confidence of increasing drought in
the Mediterranean and West Africa and also high confidence is reported for a decrease in drought for central
North America and north-west Australia.

3.3 Tropical and extra-tropical storms

Tropical and extra-tropical storms account for the highest impact extreme events. There is limited evidence
for a long-term trend in the number of tropical storms globally. In addition to frequency or storm count it is
necessary to consider the associated changes in the intensity and duration of tropical cyclones. The quality
of observations has changed significantly over the past century, for instance after the availability of satellite
data. Measurements of storm intensity are very sensitive to observation technology and therefore long-term
historical trends are influenced by changes therein. Regionally it is virtually certain that since the 1970s there
has been an increase in the frequency and intensity of the strongest tropical cyclones in the North Atlantic
      vi
basin . However over the last 100 years there have been other periods of high activity. The variability of
trends makes a confident attribution to climate change challenging, although there are good physical
reasons to expect hurricanes to be stronger on average.

There is limited evidence for a change in extra-tropical storms or extreme winds globally. Long-term wind
measurements exist often for too short periods (particularly in the Southern Hemisphere) or are inconsistent
due to changes in observation technology in order to derive long-term records. Therefore proxy data is
commonly used such as in-situ surface pressure observations or pressure data from reanalyses to derive
changes in the geostrophic wind field. In the latter case the findings are sensitive to the reanalysis product
with newer generation products typically outperforming earlier reanalyses. Studies using reanalysis data
suggest a northward and eastward shift of Atlantic cyclone activity, with intensification of cyclones during
                            vii
winter and at high latitudes .

                                                                                                                      7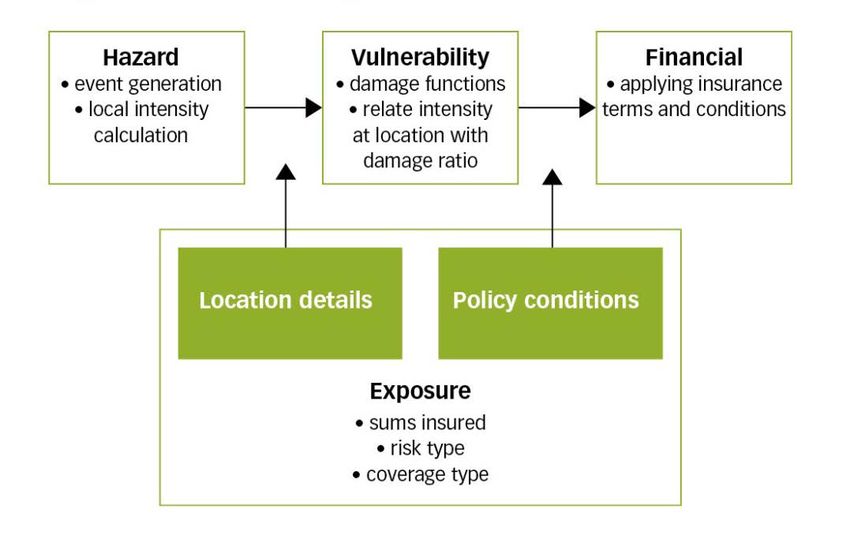
4 Catastrophe modelling
4.1 Evolution and Role of Catastrophe Modelling in the Insurance Industry

Catastrophe modelling is a comparatively young discipline, with its origins embedded within property
insurance and the science of natural hazards. It aims to help companies anticipate the likelihood and severity
of potential future catastrophes before they occur so that they can adequately prepare for their financial
       viii
impact .

Commercially available catastrophe models (often referred to as ‘cat models’) have only been in existence
for the last 25 years. Prior to the birth of catastrophe models in the late 1980s, rudimentary methods were
adopted for estimating catastrophe losses. Standard actuarial techniques were not appropriate to estimate
future catastrophe losses. Historical loss data was, and still is, scarce, especially for low frequency high
severity events with the potential to threaten insurer solvency. For risk acceptance, underwriters used spatial
risk mapping and measuring of hazards, but these had traditionally been performed quite separately. For
pricing, they relied either upon internally generated Probable Maximum Losses (PMLs) using rule-of-thumb
formulae, or upon realistic estimations of potential loss using subjectively derived deterministic scenarios.
There was a clear focus on the severity of potential events, but no reference to frequency. At this time the
unfulfilled aspiration for simultaneous consideration of these elements was recognised by those responsible
for founding three of the globally recognised catastrophe modelling software providers: AIR (1987), RMS
(1988) and EQECAT (1994).

Despite the commercial availability of the first probabilistic catastrophe models in the late 1980s, their use
was not widespread. Reinsurance cover was readily available and the market was somewhat benign.
Meanwhile the software providers were generating large probabilistic US hurricane industry loss estimates of
                                                                   ix
USD $20-30bn occurring with a reasonably significant probability . In 1989, the magnitude of loss caused by
                            x                                           xi
both Hurricane Hugo ($4bn ) and the Loma Prieta earthquake ($6bn ) sparked initial interest in the use of
catastrophe models amongst insurers and reinsurers. However, it was the unprecedented and unforeseen
loss size from Hurricane Andrew in 1992 which really highlighted deficiencies in the purely actuarial
approach to quantifying catastrophe risk losses. In real-time, AIR issued a fax to its clients estimating losses
in excess of $13bn based upon the AIR hurricane model. Months later, the Property Claims Service (PCS)
                                     xii
reported an industry loss of $15.5bn . Losses of this size hit the market hard, resulting in the insolvency of
           xiii
11 insurers . As a response, adoption of catastrophe models grew exponentially as they were viewed as a
more sophisticated and reliable approach to catastrophe risk assessment.

Increasing population densities and property values in hazard prone areas has led to diversification in the
use and coverage of catastrophe models. Catastrophe modelling technology is now used extensively by
insurers, reinsurers, governments, capital markets and other financial entities. Catastrophe models are an
                                                                          xiv
integral part of any organisation that deals with natural catastrophe risk , and are used most commonly to
perform activities such as risk selection and underwriting, reserving and ratemaking, development of
mitigation strategies, design of risk transfer mechanisms, exposure and aggregate management, portfolio
optimisation, pricing, reinsurance decision-making and capital setting.

Catastrophe models are developed by harnessing loss and hazard observations, building upon existing data,
testing existing models and incorporating these lessons into future catastrophe modelling advances. Recent
developments include explicit modelling of windstorm clustering, better understanding of inter-country
demand surge relationships, potential for occurrence and impact of storm surge, response of business
interruption losses, development and damage of hurricanes beyond coastal areas and appreciation of non-
modelled components of catastrophe models. The events of 9/11 also drove the first development of models
for man-made catastrophes, in the form of terrorism models.

By their nature, models represent an approximation of expected outcomes, and they are just one of many
tools used to enhance the understanding and management of risk. Newly available loss data, increasing
understanding of the science of natural hazards, and advancements in computing capability and technology
all contribute to the evolution of catastrophe models and the dynamic discipline of catastrophe modelling.

8
Catastrophe Modelling and Climate Change

4.2 How does a catastrophe model work?

Catastrophe modelling software contains a vendor-specific view of hazard risk, and vulnerability of insured
property. This view is devised using observed data as a basis. The software then facilitates application of this
view of risk to a specific client’s book of business in order to quantify probability and size of potential loss.

This is achieved by reducing the complexity inherent in physical interaction between hazard and vulnerability,
by parameterising characteristics to a limited set of measurable metrics. These metrics are applied
systematically, consistently and repeatedly to a custom set of exposure data. The insurance related financial
characteristics can then be overlaid to give a net loss bespoke to the client using the tool.

Most catastrophe models accomplish this by adopting a modular approach (Figure 1).

                                    Figure 1: Adapted from Dlugolecki et al., 2009

Operating the software is however only a small part of what it takes to optimise the use of catastrophe
modelling within a business. It is imperative that those responsible for running the model can also effectively
understand, interpret and convey the output with consideration for the models’ limitations.

Catastrophe models can provide a variety of financial outputs, the most common of which are the Annual
Average Loss (AAL) and the Exceedance Probability (EP) Curve. The AAL is sometimes also referred to as
the ‘pure premium’ or ‘burning cost’ and can be incorporated into pricing along with an allowance for
expenses and recommended return on capital. The EP Curve is commonly depicted as a graphical
representation of the probability that a certain level of loss will be exceeded. Reading off points on the curve
will give different views on frequency and severity of losses for the book of business being modelled. These
curves are valuable for insurers and reinsurers to determine the size and distribution of their portfolios’
                  xv
potential losses .

Even though catastrophe models are sophisticated, they cannot capture the full spectrum of risks that exist in
the real world. Each catastrophe modelling vendor will have a suite of models covering region/perils that are
of interest to their clients. No model is currently capable of covering every peril in every region, leading gaps
in model availability which can be termed ‘model miss’..

Where a catastrophe model does quantify losses for a region/peril, the process is complex and depends on
many assumptions which naturally result in a degree of uncertainty around that loss. This uncertainty
increases for more extreme events where there is little empirical experience and instances where exposure
data imported into the catastrophe model by the client is of poor quality. It is paramount that the limitations of
the model and the uncertainty inherent in its outputs are conveyed effectively during the decision making
process.

In order for catastrophe models to assist in the forecasting of risk exposure, they must incorporate observed
trends. The next section provides a series of case studies to examine how the catastrophe modelling
community is addressing the challenge of long term climate change trends.

                                                                                                                     9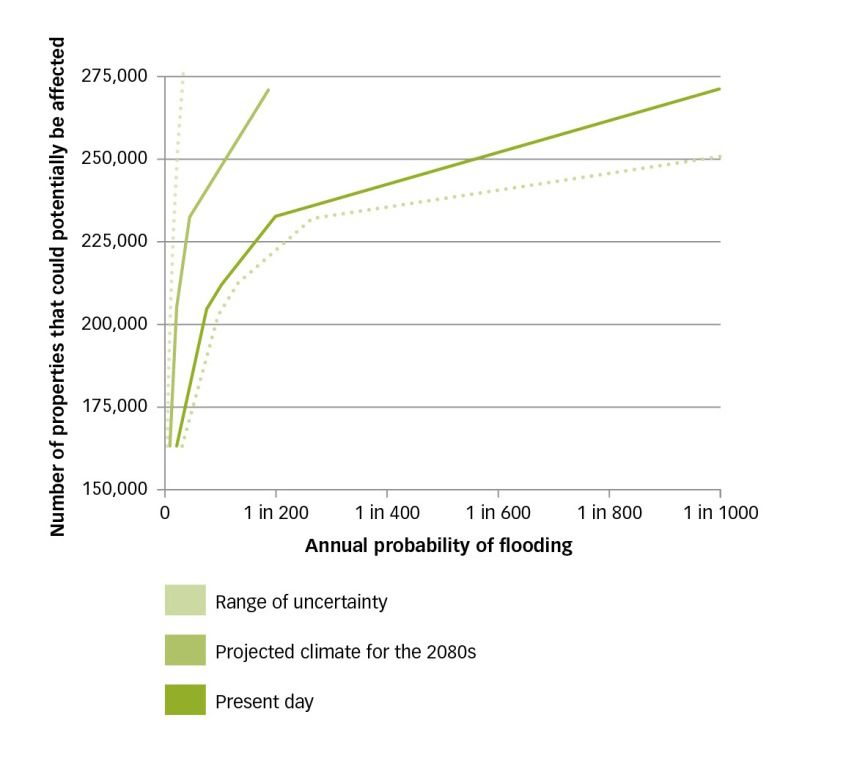
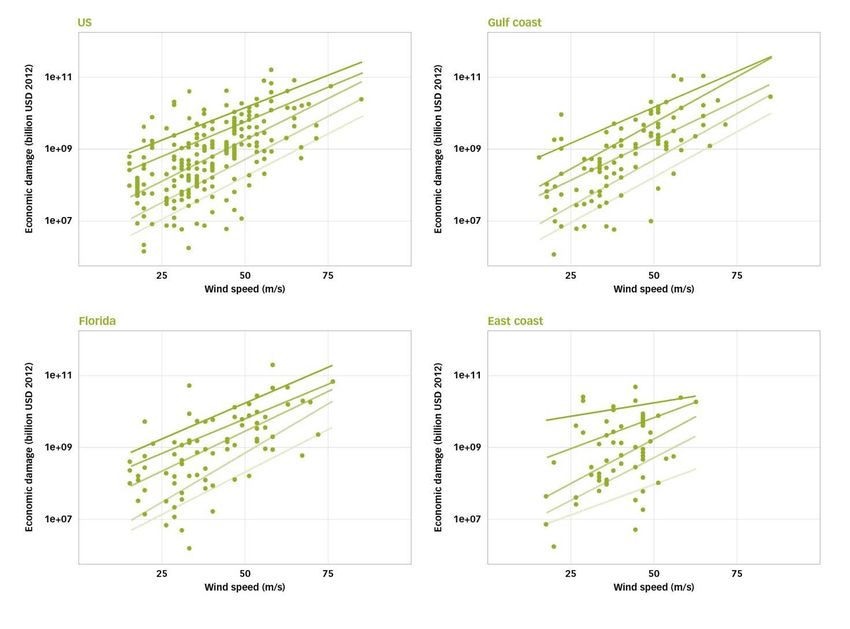
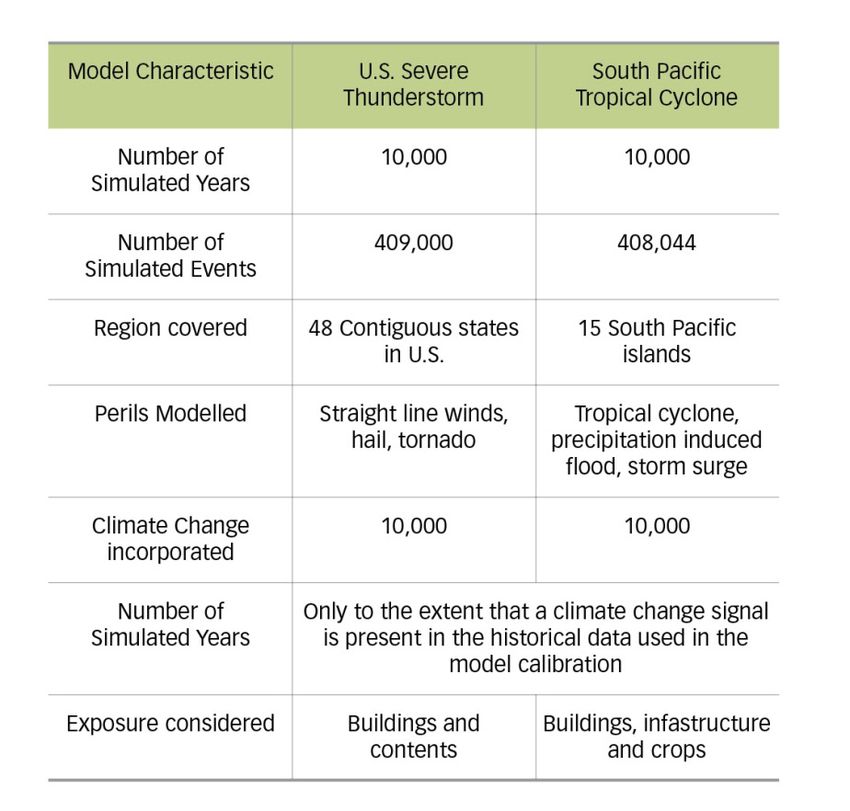
5 Catastrophe models and Climate change
Having reviewed the latest findings on climate change and outlined the workings behind catastrophe
modelling, this section details a series of studies from catastrophe model providers across a range of natural
hazards in order to assess the extent to which climate change influences the outputs of catastrophe models.

In the case study provided by EQECAT it is shown that a northward shift of European storm track and
intensification of the strongest storms is projected by at least one global climate model. Madeleine-Sophie
Déroche of the Climate – Knowledge Innovation Centre points out that the intensification is a consistent
feature amongst the latest generation models, but systematic track changes are shown to vary depending on
the model and region being analysed. UK flood modelling by JBA supports research by the UK Government
which shows that climate change could almost double the number of properties at significant risk of flooding
by 2035 unless there is additional action. It is argued by several case studies that any recent climate trends
will implicitly be included in the data that is used to construct catastrophe models.

Three case studies address cyclone hazard. An attempt at medium–term (1-5 years) forecasting is shown by
RMS which includes sea surface temperature trends as a predictor for anomalous Atlantic Hurricane activity.
They find a small adjustment of the number of cyclones using this method. A more significant effect of
climate change is found when considering that as much of 30% of the surge contribution to losses from
Superstorm Sandy can be attributable to long-term changes in sea-level. AIR also found modest increases
for cyclone losses in the South Pacific, but found no compelling evidence for a climate change signal in US
thunderstorms. James Elsner from Climatek makes the case for increased losses of 5% per decade in the
North Atlantic driven by trends in sea-surface temperature. He also points out that climate models
underestimate the sensitivity of cyclones to temperature. The three independent tropical case studies and
approaches show consistency in the direction and order of magnitude of the changes projected.

Note that the case studies reflect the views and opinions of the contributors – in any one case the
views don’t necessarily reflect the views of Lloyd’s or the other contributors.

10
Catastrophe Modelling and Climate Change
European Windstorm
By Iain Willis, Product Manager at EQECAT
Origins
Every winter, deep low pressure systems originating in the mid and high latitudes of the Atlantic give rise to
intense Extra Tropical Cyclones (ETC). Unlike Tropical Cyclones (such as Typhoons or Hurricanes),
European windstorms usually begin along a polar front where a body of low pressure from the North
encounters high pressure from the South. The movement of these opposing air masses creates a cyclonic
shear, which, if given the right circumstances, can cause an anti-clockwise rotation of the air mass around a
core of low pressure. Following this process of ‘cyclogenesis’ (Figure 2), the Extra Tropical Cyclone tracks
eastwards, driven by the fast moving Northern Hemisphere jet streams (and at speeds ranging from between
30-70mph). Since Extra Tropical Cyclones are frontal systems, largely driven by the temperature and
pressure contrasts of the mid-latitudes, European windstorm frequency and severity is typically greater
during the winter months.
Figure 2: The development of an Extra-tropical Cyclone (ETC)
Studying the path of European windstorms using sources such as remote sensing data, historical wind
speeds, and subsequent reanalysis (e.g. ERA-Interim), the data shows that the most common trend is for
storms to track across the Northern latitudes of Europe, primarily impacting the UK, Ireland and
Scandinavian countries. Such a trend might suggest that countries in the lower latitudes of Europe are not
exposed to windstorms. This is not the case. European windstorms can deviate from this norm and often with
xvi
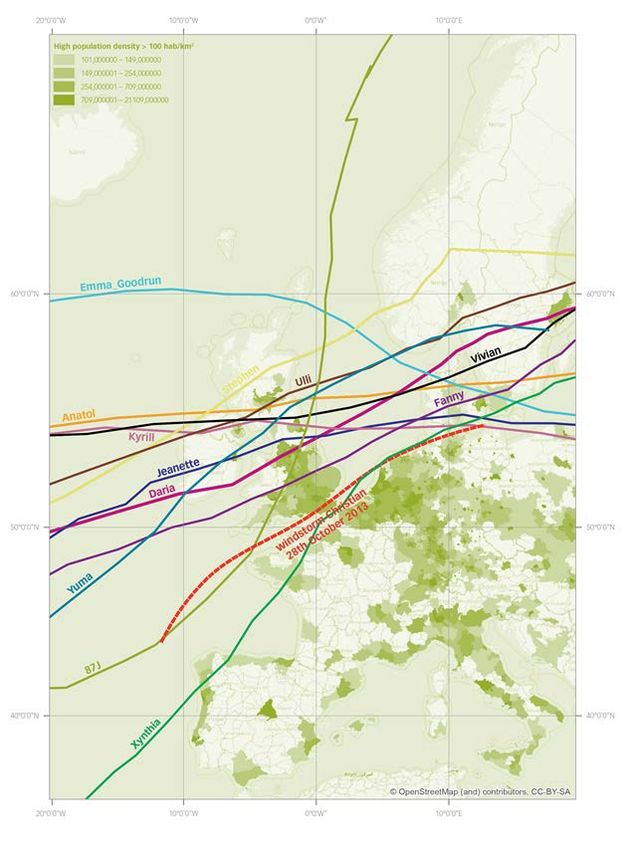
devastating consequences. As seen in Figure 3, highlighting the storm tracks of multiple industry loss
events, windstorm Xynthia (February 2010) emanated from the lower latitudes of the Atlantic, before tracking
xvii
North-Eastwards across Portugal, Spain and France, causing a total of 2.9bn USD in insured loss.
11Figure 3: Storm tracks of major industry loss events and
European population density (Source: EQECAT / Storm tracks
based on the Extreme Wind Storms Catalogue (XWS),
University of Reading, 2013)
Unlike Hurricanes, which tend to have a defined, central core of low pressure, European windstorms are
often more disparate in structure. Similarly, a European windstorm’s size and structure can greatly affect its
damage potential and footprint. For example, windstorm Daria (January 1990) had a very large footprint of
damage whereas windstorm Klaus (January 2009) rapidly intensified as it tracked across continental Europe,
creating a small but very damaging radius of strong winds.
Frequency and industry loss
Between 1959-2001 reanalysis data shows an average of about 19 windstorms a year over Europe. Of these
events however, we would only expect around a third of these storms to result in an insured loss. The most
severe and frequent occur primarily between the months of December and February although the impact of
an early season event, such as Windstorm Christian (October 2013) or the Great Storm of ‘87 (October
1987), can be more damaging as most trees still retain their leaves at this time of year. Within the historical
data there is considerable variability both in the number of storms and their relative severity. The winter of
12Catastrophe Modelling and Climate Change
1989/1990 had the highest windstorm frequency with 37 events recorded. It proved a notable year as several
th
of the windstorms were significant from an insured loss perspective, such as windstorms Daria (25
th th
January), Vivan (26 February) and Wiebke (28 February). Such seasonal intensity is not in isolation and
also took place during the 1999 storm season as Anatol, Lothar and Martin caused a total loss of $13.9
xviii
billion . Lothar and Martin occurred within 36hrs of each other, both impacting similar areas of central
Europe. Such frequency is commonly referred to as ‘temporal clustering’. Due to the magnitude and
aggregation of insured losses in such years, the pattern and periodicity of temporal clustering is of
considerable interest to the insurance market. As traditional excess of loss reinsurance contracts are often
based around the 72 hours clause, the impact of having multiple meteorological events occurring within this
period causes major concern as reinsurance trigger levels may be reached by the aggregation of these
smaller events, rather than by a single, very large windstorm.
European windstorm severity is currently assessed by meteorologists using a Storm Severity Index (SSI). A
single value is calculated for a storm event based on several physical characteristics of the event. This
typically includes factors such as the maximum observed wind speed, a minimum wind speed threshold (e.g.
25 m/s), storm duration, and the physical extent of the storm over land areas. By using such metrics,
meteorologists are able to assess the relative severity of these large complex cyclones. It is important to note
that there remains no universal standard for calculating SSIs and they continue to be a moot point for
meteorologists.
Studying the insured losses from single historic windstorms, the most significant events were recorded from
xix
Daria (1990) and Lothar (1999) with insured losses totalling $8.2 billion and $8 billion respectively
th
However, the most recent large scale loss from a windstorm was in 2007 when Kyrill (18 January) impacted
xx
much of central Europe causing $6.7 billion insured loss . The common factor in the characteristic of the
most damaging windstorms concerns their international impact, i.e. a single storm can impact multiple
countries as it tracks across central Europe. Due to the very high wind speeds of these storms (typically
found to the south of the storm vortex) and the large synoptic size (~1000km), destruction to property,
contents, and business downtime is on a very large scale. As the storm track of Kyrill shows (Figure 3), it
was able to cause considerable damage across multiple European countries including Austria, Belgium,
France, Germany, Ireland, Netherlands, Poland, the Czech Republic and the United Kingdom.
Climate modelling
In considering how climate change will affect the pattern of European windstorms, it is necessary to make
use of Global Climate Models (GCM). These state-of-the-art numerical weather models have become an
integral tool in meteorological research and help scientists simulate future climates in line with IPCC
3
emission scenarios (SRES) .
EQECAT have worked closely with the Free University of Berlin in using the ECHAM5 coupled climate model
TM
as well as our European windstorm catastrophe model (Eurowind ) to study the meteorological and
financial impacts that future climate conditions may bring. Comparing twenty-five different storm parameter
th
statistics (including storm severity, wind speed, area, duration, and atmospheric pressure) of the entire 20
st
Century with the 2007 SRES emission scenarios (A2 and A1B) for the 21 Century, the use of a GCM has
provided us with valuable insight into the possible impacts of climate change on European windstorm track
density and severity. Results were calculated at five different meridional European transects spread evenly
o o
across the longitudes of 0 E to 20 E.
It is important to note that ECHAM5 is one several GCMs used by the IPCC community and therefore
several scenario runs cannot capture the full spectrum of uncertainties associated with climate change
simulations. ECHAM5 results have been shown to lie in the middle of all ENSEMBLES simulations, but the
results presented here must still be seen as one of many possible climate change outcomes.
Despite the differences in various GCM research methodologies, model assumptions, resolution and the
magnitude of storm behaviour, there has proved to be consensus between EQECAT’s results and other
xxi,xxii, xxiii,xxiv
published research in this field. Other climate change findings have all noted that changes in
near-surface temperature, baroclinicity (low level temperature contrast) and sea-ice will greatly affect the
strength and location of mid-latitude cyclone activity. On a global perspective, such changes may result in a
3
Control run was based on CO2 emissions from 1900-2001.
13gradual polar shift in storm track density. With regard to windstorm activity in the European mid-latitudes,
EQECAT’s research highlighted the following observations in future climate scenarios:
1. An increasing volatility - fewer smaller storms but an increase in the frequency of very large storms;
2. A shift in the latitude of European windstorms towards central Europe (between bands 48N-61N);
and
3. A four-fold increase in the frequency of years with several severe storms (this is based on the
normalised equivalent of an SSI sum of three times Daria sized storm events per year).
Figure 4: Possible climate change impacts on European windstorm (Clockwise from Top Left: a) Increasing
severe storms b) Correlations between SSI and storm parameters c) Frequency of years with equivalent SSI of 3
4
x Daria-sized storms d) Location of storm activity)
In considering the consequences of these changes to insured loss, the overall impact on European exposure
from these results implies a 3-5% decrease in the total number of potentially damaging storms but a 10-20%
5
increase in the number of larger storms . Likewise, the progressive shift of storm tracks to the central
latitudes in Europe could increase the severe storm losses seen in major European markets,
disproportionately impacting France and Germany.
4
Findings are based on EQECAT whitepaper ‘Activity of Catastrophic Windstorm Events in Europe in the 21st Century’
(2011).
5
Defined as having an SSI equal to or greater than windstorm Daria.
14Catastrophe Modelling and Climate Change
Modelling
Various techniques are employed in modelling ETC. These range from solutions such as pressure field
analysis, using historically recorded wind speed data, to the use of supercomputers and Numerical Weather
Prediction (NWP). In recent years, and given the rapid advancement of IT, meteorologists and modellers are
increasingly turning their attention to NWP and GCMs.
NWP can essentially be split into macro and meso-scale models. Although both are computationally very
intensive and based on the same mathematical equations of thermo dynamics, the subsequent geographic
scale, complexity and end-purpose of these models varies considerably. Meso-scale NWP modelling is
generally at a very high resolution but is only run for short periods of time. For this reason it is typically used
for short-term weather forecasting. A good example in the progression of this science was evidenced in
October 2013 by the European forecasts that predicted with considerable accuracy the track and intensity of
windstorm Christian (also referred to as the St Jude’s day storm in the UK) several days before it made
landfall. Macro scale modelling concerns the use of GCM and Atmosphere-Ocean General Circulation
Models (AOGCM). These models can be used to simulate weather on a global scale for thousands of years.
Unlike meso-scale techniques, AOGCMs take into account the changing condition of global climate controls
such as the extent of sea-ice, vegetation coverage, and the complex interaction between the oceans and the
atmosphere. In doing so, they are extremely useful for studying longer-term processes such as natural and
anthropogenic climate change, as well as key weather pattern signals (e.g. NAO, AMO, ENSO).
European windstorm modelling has evolved considerably in recent years. Given that historically observed
wind speed data has only been recorded for the last 50 years, and with varying granularity, it provides only a
small window into the past with which to understand the frequency of this complex peril. However, given the
6
advances in GCMs, probabilistic analysis, the reanalysis of historic data, and the downscaling techniques
EQECAT is now able to employ, European windstorm modelling is rapidly evolving.
TM
In creating Eurowind (a fully probabilistic risk model that quantifies prospective risk from windstorms in 24
countries across Europe), EQECAT makes use of these latest capabilities. We combine over 50 years of
historically observed wind speed data (from thousands of meteorological stations across Europe) with a
1200-year climate simulation from using an AOGCM to inform on the key parameters of this peril. Historic
storm seeds are used to develop a stochastic catalogue of synthetic storms. Using a perturbation approach,
theoretical distributions are fitted to major parameters of historical storms (e.g. SSI, duration, track, severity)
to probabilistically generate new storms. This historic and synthetic storm catalogue features ~20,000
events. Making use of a state-of-the-art AOGCM model, we are able to validate key metrics, such as storm
frequency, clustering, and the spatial coverage of European windstorms. Likewise, in downscaling these
large cyclonic events, we employ a combination of both deterministic and probabilistic modelling techniques.
For example, the latest global land use information and digital elevation data (DEM) are combined to
accurately modify wind behaviour, together with local gust parameterization to model the damaging surface
winds of an Extra Tropical Cyclone.
EQECAT does not incorporate future climate change scenarios into its standard catastrophe models. It
would be largely premature to do this given the enormous volatility in catastrophic event activity on annual
and decadal timescales. However, given the use of historically recorded wind speed data over the last 50
years in constructing EQECAT’s European windstorm model, climate variability during this time could be
considered to be implicitly built into the model. From an industry perspective, EQECAT’s paradigm is to
remain focused on our clients' need to write business in today’s market and concentrate on quantifying the
current risk via the best available science and data.
6
Downscaling methods are developed to obtain local-scale surface weather from regional-scale atmospheric variables
that are provided by GCMs.
15European Windstorms
By Madeleine-Sophie Déroche, Junior Analyst at Climate-KIC / LMD / LSCE
European winter windstorms associated with extra-tropical cyclones
ETCs are one of the main atmospheric phenomena of the mid-latitude regions, where they are responsible
for episodes of strong surface wind speeds and rainfall. In the northern hemisphere, the development of
such systems is favoured during the autumn and winter seasons (October to March), when the temperature
difference between the Equator and the Poles is the strongest. Intense ETCs associated with extreme
surface wind speeds (also called windstorms), are generated over the North Atlantic region and sometimes
reach Western and Central Europe. They can cause wind-related damage as well as flood events (Kyrill,
2007) and storm surges (Xynthia, 2010).
The dynamical processes at the origin of the development of extreme ETCs have been studied either by
xxv,xxvi, xxvii
focusing on one specific windstorm that caused important damages or by comparing the
xxviii,xxix
meteorological situation for a group of extreme ETCs . A key process that emerges is the interaction
and mutual amplification of anomalies at the upper and lower levels of the troposphere through vertical
motions. Extreme ETCs are more frequent and more intense during the positive phase of the North Atlantic
Oscillation (i.e. main atmospheric pattern driving the weather over Europe in winter), and are more likely to
reach Europe with a strong polar jet stream (i.e. eastward wind at 11 km height).
Observed trends in European winter windstorms in the recent past
The assessment of windstorm trends depends on the type of data that are used. Studies that consider
storminess over the North Atlantic region (either from wind speed or pressure measurements from
meteorological stations) find significant variations at decadal and longer time scales, with a minimum of
storminess around 1960 and a maximum around 1990. Values of storminess at the beginning of the 21st
xxx,xxxi, xxxii
century are as high as those at the beginning of the 20th century . However, when looking at trends
in specific countries and for shorter time periods, one finds that local variations do not coincide with the ones
xxxiii, xxxiv
from the more extended North Atlantic region . This highlights the importance of the chosen
geographical area and the length of available records when dealing with trends of atmospheric processes
with a high natural variability. Reanalysis datasets, in other words assimilation of observations into climate
model, are another type of meteorological data that are used to analyse the recent past. Studies focusing on
xxxv, xxxvi
storminess over Europe find an increase over different periods of time .
Observed increasing trends in wind-related damage during the last decades seem to be mainly due to an
increased vulnerability of the population and of natural environments. On the one hand, the increase in
economic losses associated with windstorms can be explained by the growth of insured population in
xxxvii, xxxviii
exposed areas . On the other hand, a warming climate may impact natural environments, making
them more vulnerable to windstorms. In Switzerland, warmer and wetter winters have been observed over
xxxix
the last decades impacting the quality of soils and favouring forest damages during windstorm events .
Global Climate Models
GCMs compute the three-dimensional time evolution of the atmosphere and the ocean, including the wind or
current, temperature and moisture content. The models divide the atmosphere into “boxes”, where each
meteorological variable is represented by one value. The equations of motion are then discretized over these
boxes and solved; processes that occur at a scale smaller than the box size are represented implicitly. The
performance of GCMs follows the technological evolution of supercomputers, leading in particular to more
and smaller boxes.
An advantage of using GCMs for weather-related risks is the opportunity to analyse all the factors that
xl
contribute to or hinder the development of a specific phenomenon . The low resolution (large boxes) of
previous generations of GCMs led to a poor simulation of ETCs, but many current GCM simulations now
yield a sufficient resolution to investigate ETCs from both physical and impact perspectives. The comparison
xli
with reanalysis datasets for the current period indeed shows that ETCs are now well simulated . Storm
tracks over the North Atlantic region are well represented even though there are still some biases affecting
xlii
the number of ETCs reaching Europe and their intensity .
16Catastrophe Modelling and Climate Change
Climate Change modelling: from SRES to RCPs
Since the 1990s, the IPCC has coordinated a worldwide assessment exercise consisting of a review of
published scientific research papers. Synchronised with the IPCC reports, a number of model inter-
comparison projects (MIP) use GCMs from major worldwide institutions to assess the impact on climate of
both past and future emissions of greenhouse gases (GHG) and aerosols that change the energy balance of
the Earth. The modelling of future climate change and its impacts is based on projected emission scenarios.
Since the first IPCC assessment report (FAR) in 1990, four sets of emissions scenarios have been released
xliii
and the approach used to define them has evolved . The three first sets were based on assumptions on the
potential evolution of economic and population growth, energy supply and consumption patterns,
development of clean technologies and undertaken climate policies. In 2000, the scenarios from the Special
Report on Emission Scenarios (SRES) encompassed a wider range of uncertainties and took into account
xliv,xlv,xlvi
more social, political and economic factors than scenarios back in 1990 . From these socio-economic
storylines, time series of GHG emissions were derived and used to force GCMs. It took several years to
complete this sequential process, leading to a high risk that the basic socio-economic assumptions would
change, be verified or proven false.
Since 2008, a new approach to design emission scenarios has been chosen for the purpose of the last IPCC
xlvii
assessment report (AR5) . The new emission scenarios, named Representative Concentration Pathways
(RCPs), are now based on the identification in the existing literature of possible levels of radiative forcing by
2100. Socio-economic assumptions do not underlie the RCPs and possible paths leading to these levels of
forcing are thus no longer restricted to only one per emission scenario.
Projected trends from models participating to the fifth Coupled Model Intercomparison
Project (CMIP5)
The latest model inter-comparison project (CMIP5) a worldwide coordination between climate institutes
running their GCMs in the purpose of the assessment of climate change impact. A study comparing the
results from different ETC detection methodologies applied to one CMIP5 model finds an increase in the
xlviii
number of intense ETCs in the Northern Hemisphere . However looking at the response of the storm
tracks to climate change, results differ from one model to the other. In order to explain these differences, it is
xlix
possible to analyse in detail within each GCM the processes surrounding the occurrence of ETCs . It has
been shown that changes in the meridional (i.e. northward) and vertical gradients of the temperature have
competing effects and it is difficult to assess what the overall impact would be. Another important factor is the
increase in atmospheric moisture content that provides a latent heat reservoir increasing the potential
intensification of individual ETCs, but also will have a general weakening effect on the development of ETCs
by enhancing the energy transport from the Equator to the Pole and reducing the temperature difference.
17UK Flood
By Professor Rob Lamb, Chief Scientist, Richard Wylde, Meteorologist, and Jessica
Skeggs, Hazard Mapping Specialist at JBA Group
The evidence for change in the UK
Although winter rainfall totals have changed little in the last 50 years and annual totals appear not to have
changed significantly since records began in 1766, over the last half century an increasing proportion of the
l
UK’s winter rain has fallen during intense wet spells. Additionally, a report on historical trends in the UK
climate concluded in 2008 that sea levels have risen around the UK over the past century.
Past and present greenhouse gas emissions mean further climate change is inevitable in the next 20 to 30
li
years no matter how emissions change in the future. Current UK climate projections are based on the
analysis of outputs from multiple climate models and scenarios for future greenhouse gas emissions.
However, predicting the influence of human-induced change is complicated by the internal variability in the
climate system. Over the next few decades, this internal variability is a major source of uncertainty. It is
estimated to account for nearly half of quantifiable uncertainty associated with regional winter precipitation
lii
changes for the period 2010-2019, compared with only a quarter of the prediction uncertainty by the 2080s .
Even so, statistically significant changes in accumulations of winter rainfall (the type of weather pattern
liii
associated with some major recent floods such as in the winter of 2000) could be detectable by the 2020s .
For the shorter intense storms that are associated with surface water flooding, there is more variability and
so it will take longer to detect significant trends. Despite this, there are accepted physical mechanisms by
which an increase in extreme rainfall should be expected and emerging observational evidence in support of
liv
this .
Long term records of river flooding also paint a complex picture. River flows are affected by changes such as
land use and drainage works as well as by the climate, and there is little statistical evidence for long-term
lv
trends in maximum river flows over the last 80 to 120 years despite many shorter-term fluctuations . This
evidence does not rule out the possibility that climate change has affected river flooding, or that it will do so
in future, although it does illustrate that long-term trends are difficult to identify when set against the
variability of river flow records.
lvi
Recent studies have used climate models to attribute specific flooding events, at least in part, to climate
lvii
change. For the UK it has been suggested that there was very likely to have been at least a 20% increase
in the risk of occurrence of the winter of 2000 floods (which damaged almost 10,000 properties and led to
insured losses worth an estimated £1.3 billion, or £1.85 billion at today’s values) associated with human-
induced climate change. These conclusions are dependent on a complex chain of models and assumptions,
and may not necessarily reflect future changes. However, they do provide emerging evidence of an
increasing risk of inland flooding in the UK and form part of a growing international evidence base on the
lviii
attribution of extremes – despite individual weather events having not been previously attributed to climate
change.
Future climate change
Over longer time horizons, the greenhouse gas emissions are expected to have an increasing influence on
predicted climate in the UK. By the 2050s, there is clear divergence in the latest UK climate change
projections between alternative future greenhouse gas scenarios. By the 2080s, UK projections shows that
there could be around three times as many days in winter with heavy rainfall (defined as more than 25mm in
lix
a day) as in the recent past. It is plausible that the amount of rain in extreme rain storms (defined as storms
with a 1 in 5 annual probability, or rarer) could increase locally by 40%.
The impact of climate change on river flooding is highly dependent on the geography of the river catchment.
Research based on climate models that have been used in the UK projections shows a range of increases in
peak river flows from 10% to 15% over the period between 2015 and 2039, rising to a range of 20% to 30%
lx
by the 2080s . Flood risk is, of course, also affected by property development and by investment in flood risk
management measures.
Sea levels around the UK are projected to rise too. The predicted changes depend on what assumptions are
made about future greenhouse gas emissions, and on the method used to characterize scientific uncertainty
18Catastrophe Modelling and Climate Change
in the modelling. For the UK climate projections, central estimates of sea level rise for a medium emissions
scenario (a world in which there is less, but still increasing reliance on fossil fuels) are in the range 24-36 cm
lxi
by the 2080s, relative to 1990 levels . However under a high emissions scenario (in which reliance on fossil
fuels continues to increase rapidly) there is a chance that sea level could rise by approximately 70 cm. There
are credible (though unlikely) extreme scenarios that would lead to even greater increases in sea level of up
to 1.9m.
What does this mean for flood risk?
The UK Government’s Adaptation Sub Committee has reported that “current levels of investment in flood
defences and in the uptake of protection measures for individual properties will not keep pace with the
increasing risks of flooding. Climate change could almost double the number of properties at significant risk
lxii
of flooding by 2035 unless there is additional action.” The Environment Agency estimates that investment
needs to increase by £20 million above inflation every year merely to stand still and avoid increasing the risk
associated with climate change and deterioration of flood defences. Increased investment to counter
projected climate change could bring about a four-fold reduction in the risk of flooding compared with a
scenario of no additional action.
Do flood risk models account for climate change?
The UK climate projections are gradually being incorporated into flood risk models used for the purposes of
local flood risk management and investment plans. Assessments of risk at national scale are also building in
lxiii
climate change to inform long-term investment strategy . The UKCP09 projections provided a step change
in the available detail, and for the first time a probabilistic treatment of the scientific uncertainty in the climate
models. There are case studies demonstrating the application of the probabilistic projections in assessing
lxiv,lxv
future flood risk , but these require advanced modelling methods and are not yet routinely applied.
Box 1 demonstrates the sensitivity of flood risk to future climate change for a part of the River Thames basin,
based on detailed flood risk mapping and scenarios derived from the latest UK climate projections.
In the insurance industry, probabilistic catastrophe models from companies such as AIR, EQECAT, JBA and
RMS are available to assist insurance companies assess their likely losses due to flooding in the UK. Most
catastrophe models are based on long term data which may have a signal of climate change from the recent
past inherently present within them. However, uncertainties associated with the estimation of both the
degree to which climate change is occurring and to the resulting change in local flood severities and
frequencies means that the impact can be difficult to account for in risk models. The catastrophe models
used today to consider UK flood risk (both river and sea surge) do not, therefore, explicitly model the impact
of future climate change.
Forward look
Future climate change is inherently uncertain because we cannot be sure about how greenhouse gas
emissions may be changed by economic development, technology and government policies around the
world. However climate models are driving towards greater spatial detail and better resolution of key physical
processes. Over the next decade it is possible that weather forecasting and medium-term climate models
may start to converge, giving better foresight of weather at the annual scale and more precise projections
about how the climate will respond over the longer term to changes in the atmosphere caused by human
activity. Allied to these changes, we can expect progress in the representation of internal variability, and a
view of future climate that includes better knowledge of variability as well as of average conditions.
There should be more explicit accounting for uncertainties, especially in predictions made by hybrid models
that integrate climate, weather and flood risk more closely than at present. Models used to predict flooding
will become more efficient and able to provide better information at property level. Side-by-side with these
developments, JBA can anticipate greater integration of projections of climate with other changes (such as
lxvi, lxvii
land use change, flood mitigation investments and industry losses). Studies have already stressed the
need to quantify climate change in catastrophe modelling. It is anticipated that methods to do this will
develop if, as expected, the effects of climate changes become more apparent over the coming decades.
This process must be properly structured and make good use of the evolving climate science, and so
communication between researchers, catastrophe modellers and insurers is expected to be important.
19You can also read